by Suraj S, Ishu Thakur, Mousumi Priyadarshini and Abhishek Nehra^ The financial resource balance1 of the domestic economy remained in deficit at 2.5 per cent of GDP in 2022-23 as compared to a deficit of 1.9 per cent in 2021-22. Net financial wealth2 of domestic sectors moderated to 24.9 per cent of GDP in 2022-23 from 29.0 per cent in the previous year but remained above the pre-pandemic level of 24.2 per cent in 2019-20. Financial assets and liabilities of other depository corporations experienced the highest growth since 2014-15 as credit demand from households and businesses remained buoyant. Non-financial corporations improved their resource balance amidst moderation in debt-equity ratio of PuNFCs. Introduction The financial accounts offer a comprehensive framework for analysing financial transactions and outstanding positions of financial assets and liabilities across institutional sectors3 of the economy. Introduced as the “flow of funds (FoF)” in Copeland’s pioneering analysis of money flows (Copeland 1949), financial accounts have evolved significantly, gaining prominence as a critical tool for assessing financial interconnectedness, uncovering potential vulnerabilities, and ensuring consistency in macroeconomic measures. Structured on from-whom-to-whom4 (FWTW) basis, the financial accounts illuminate structural shifts in savings, investments, and indebtedness across sectors, enhancing insights into financing of economic growth, monetary policy transmission and financial intermediation. The relevance of financial accounts amplified, particularly, in the aftermath of the Global Financial Crisis of 2007-09, when the need for monitoring financial flows to identify systemic risks became apparent. Financial accounts compilation, thus, became a crucial part of the G-20 data gap initiative. In this backdrop, the Reserve Bank of India’s financial accounts compilation framework known as the financial stocks and flow of funds (FSF) which presents a detailed view of sectoral and instrument-wise stocks and flows of financial assets and liabilities. These accounts provide valuable insights into the shifts in domestic savings and borrowings patterns that hold pivotal role in shaping the financial outcomes. During 2022-23, the demand for credit, particularly from households and corporations, remained robust. The government sector stayed on the path of fiscal consolidation in 2022-23 while the current account deficit (CAD) widened to 2.0 percent of GDP, reflecting higher import costs amidst geo-economic fragmentation and elevated global food, energy, and commodity prices. As macroeconomic and financial developments interact and impact each other, a comprehensive view of the inter-sectoral financial flows can be gauged best by FSF accounts by tracking the changes in resource mobilisation, the sectoral financial resource balance and their respective net financial wealth (NFW). This article delves into financial trends of the Indian economy during 2022-23, using an FWTW approach. The rest of the article is structured as follows: Section II provides the sectoral and instrument-wise financial flows in the economy during the year under review. An assessment of sectoral financial resource balance is presented in Section III. Section IV illustrates sector-specific financial trends in detail. Section V concludes the article. II. Financial Flows: Sector and Instrument-wise In 2022-23, total financial assets of the domestic sectors registered a growth of 9.8 per cent as compared with 9.9 per cent in 2021-22 while liabilities increased by 10.4 per cent as compared with 10.2 per cent in the previous year. Households (HH) and financial corporations (FCs), jointly accounting for over 70 per cent of the total financial assets, remained the primary surplus sectors during 2022-23, catering to the financing needs of the general government (GG) and private non-financial corporations (PvNFCs) [Chart 1 and 2]. While most of the sectors exhibited a deceleration in the growth of their liabilities during 2022-23, the HH sector recorded an acceleration on account of increased borrowings from the banking and non-banking sectors. At the same time, growth in financial asset creation by the HH sector moderated during the year. Public non-financial corporations (PuNFCs), however, registered robust growth in both financial assets and liabilities. Among financial instruments, currency and deposits, loans and advances, and debt securities together accounted for nearly two-thirds of the total financial assets and liabilities as at end-March 2023. For FCs including the central bank, debt securities and loans and advances constituted almost three-fourths of their total financial assets, while currency and deposits served as their primary sources of liabilities. HH liabilities are predominantly in the form of loans and borrowings, while their financial assets are largely in the form of currency and deposits. Equity and investment funds constituted the major financial assets of RoW, while debt securities continued to dominate their liabilities, subscribed mostly by the central bank (Chart 3).
III. Financial Resource Balance In 2022-23, the financial resource balance of the Indian economy remained in deficit. The deficit increased to 2.5 per cent of GDP from 1.9 per cent in the previous year, driven primarily by the moderation in the surplus of HH (Chart 4). Further, NFW of all domestic sectors moderated to 24.9 per cent of GDP as at end-March 2023 from 29.0 per cent in the previous year5. However, the NFW remained above its pre-pandemic level of 24.2 per cent in 2019-20. The moderation in the NFW witnessed across the board in 2022-23 reflects the normalization after the pandemic-induced anomaly in 2020-21 (Table 1).
IV. Sectoral Financial Linkages The interlinkages and interdependence among institutional sectors were reflected in the direction and magnitude of the net flows (uses minus sources) [Chart 5]. A shift in the stance of the monetary policy from accommodative to withdrawal of accommodation and the concomitant fall in surplus liquidity in the banking system led to a decline in the parking of surplus funds by ODCs with the RBI. Consequently, net flows from ODCs to the RBI witnessed a reversal during 2022-23. The trend in net flows from HH to GG, OFCs and RBI remained broadly stable. However, HHs received net inflows from the ODCs during 2022-23, driven by rising credit demand, in contrast to the marignal net outflows witnessed in the previous year. Additionally, the magnitude of flows from ODCs to GG increased, reflecting higher public borrowing requirements. With a sharp increase in loans from ODCs, PuNFCs turned net borrowers of funds in 2022-23, as against being net lenders in the previous year. In contrast to 2021-22, when the GG received net inflows of funds from the RBI, a reversal was witnessed in 2022-23, reflecting redemption of the central government debt securities held with RBI. Further details of sectoral flows are discussed in subsequent sections. | Table 1: Sectoral Net Financial Wealth | | (per cent of GDP at current market prices) | | Sector | 2012-13 | 2013-14 | 2014-15 | 2015-16 | 2016-17 | 2017-18 | 2018-19 | 2019-20 | 2020-21 | 2021-22 | 2022-23 | | 1. FCs | 28.4 | 28.3 | 28.9 | 28.1 | 30.2 | 31.7 | 31.3 | 33.5 | 37.9 | 34.0 | 33.8 | | 2. NFCs | -20.8 | -21.6 | -26.7 | -26.1 | -30.2 | -35.1 | -37.6 | -38.3 | -34.8 | -34.9 | -34.4 | | 2.1 PuNFCs | -1.4 | -2.0 | -2.0 | -2.2 | -2.3 | -2.2 | -2.3 | -2.7 | -3.0 | -2.6 | -2.0 | | 2.2 PvNFCs | -19.4 | -19.6 | -24.7 | -23.9 | -27.9 | -32.8 | -35.4 | -35.7 | -31.8 | -32.3 | -32.4 | | 3. GG | -49.2 | -49.9 | -49.5 | -52.5 | -51.2 | -51.1 | -50.9 | -54.2 | -68.1 | -63.1 | -61.3 | | 4. HH | 74.0 | 74.1 | 76.4 | 77.8 | 79.1 | 80.6 | 82.1 | 83.3 | 100.5 | 93.1 | 86.8 | | 5. Total (1+2+3+4) | 32.4 | 30.9 | 29.0 | 27.3 | 27.9 | 26.1 | 24.9 | 24.2 | 35.5 | 29.0 | 24.9 | | 6. RoW | 24.0 | 24.3 | 23.9 | 23.1 | 21.4 | 20.8 | 21.0 | 19.6 | 19.0 | 17.5 | 17.2 | | Source: Authors’ calculations. |
IV.1 Financial Corporations IV.1.1 Central Bank In 2022-23, growth of financial assets and liabilities of RBI decelerated to 2.5 per cent (8.4 per cent in 2021-22) and (-) 1.6 per cent (10.1 per cent in 2021-22), respectively6. On the asset side, foreign currency assets declined, particularly deposits held with foreign institutions7, to USD 98.0 billion at end-March 2023 from USD 177.7 billion as at end-March 2022 (RBI, 2022 & 2023). Growth of currency liability of the RBI moderated further to 7.8 per cent in 2022-23 from 9.9 per cent in the previous year amidst increasing preference for digital payments. The deposit liability of the RBI declined by 23.4 per cent in 2022-23 on account of the earlier noted shift in monetary policy stance. IV.1.2 Other Depository Corporations Depository corporations other than the central bank are basically engaged in financial intermediation as their principal activity, mostly funded through deposits or market borrowings. In the Indian financial sector, the scheduled commercial banks (including regional rural banks) are the largest sub-sector of the ODCs with 85.5 per cent share in the total financial assets followed by co-operative banks. The balance sheet of ODCs has witnessed accelerated growth since 2020-21, driven by sustained credit demand. The financial assets and liabilities of ODCs increased by 11.7 per cent and 11.8 per cent, respectively, during 2022-23 - their highest growth since 2014-15 (Chart 6 & 7). While deposit growth of the ODCs accelerated to 10.4 per cent during 2022-23 from 9.6 per cent in the previous year, borrowings of ODCs through debt securities increased by 25.0 per cent vis-à-vis a decline of 5.9 per cent in the previous year. HH sector continued to have a major share of fund flows from ODCs in the form of loans and advances. While flow of funds from ODCs to GG, OFCs and PvNFCs increased, flows to RoW witnessed a moderation. A net inflow was witnessed by ODCs from other domestic sectors primarily on account of the decline in deposits with the RBI. (Chart 8).
IV.1.3 Other Financial Corporations The distribution of the financial assets and liabilities in the OFC sector is dominated by insurance corporations followed by mutual funds and pension and provident funds (Chart 9). After witnessing two years of double-digit growth on the back of pandemic-induced demand, growth of financial assets and liabilities of the insurance sector decelerated to 8.6 per cent in 2022-23 (12.4 per cent in 2021-22) and 7.9 per cent (12.4 per cent), respectively (Chart 10).
The annual increase of assets under management (AUM) of mutual funds (MFs) moderated from ₹9.2 lakh crore during the pandemic year (2020-21) to ₹1.9 lakh crore in 2022-23, primarily due to moderation in asset prices (Chart 11). As at end-March 2023, the AUM of the mutual fund industry stood at ₹39.4 lakh crore with 14.57 crore mutual fund accounts/folios (SEBI 2023). The balance sheet of pension and provident funds (14.4 per cent of GDP) registered an increase of 16.4 per cent in 2022-23 on top of 18.1 per cent rise in the previous year. Despite a growing interest in equity investments, government securities remained the dominant asset class, accounting for 50.9 per cent of the total financial assets of pension and provident funds. IV.2 Non-Financial Corporations Non-financial corporations (NFCs) [entities primarily engaged in producing goods and non-financial services] include public NFCs (PuNFCs) [such as central public sector enterprises (CPSEs), power companies, and port trusts] and private NFCs (PvNFCs) comprising non-government, non-financial companies. During 2022-23, NFCs reduced their resource deficit to 4.4 per cent of GDP from 4.5 per cent in the previous year. Further, the NFW of NFCs remained negative, although it moderated to (-) 34.4 per cent of GDP in 2022-23 from (-) 34.9 per cent in the previous year. The debt-to-equity (D/E) ratio of PuNFCs fell in 2022-23, with rise in capital infusion particularly in the manufacturing sector. In contrast, the D/E ratio of PvNFCs increased, attributable to increased demand for credit by PvNFCs (Chart 12). IV.3 General Government Fiscal consolidation by the Union Government post-pandemic brought the gross fiscal deficit down to 6.4 per cent of GDP in 2022-23 from 6.7 per cent in the previous year, and 9.2 per cent in 2020-21 (GoI 2024). The state governments combined gross fiscal deficit (GFD) was 2.8 per cent of GDP in 2022-23 as compared with 3.4 per cent in the previous year. The financial resource gap of general government8 in 2022-23 stood at 6.0 per cent of GDP, as compared with 5.9 per cent in the previous year (Chart 13). General government debt reduced to 84.3 per cent of GDP from 86.8 per cent in 2021-22. Growth of equity investments in statutory corporations and joint stock companies, comprising the bulk of financial assets of central government, accelerated to 15.5 per cent during 2022-23 (13.5 per cent in 2021-22) with increased capex by the central government. Total loans and advances extended by the central government increased by 9.2 per cent during 2022-23. On the liabilities side, debt securities issued by central government, accounting for 74.0 per cent of its total liabilities as at end-March 2023, rose by 11.4 per cent over the previous year.
IV.4 Households (including NPISHs) During 2022-23, HH net resource balance declined to 5.2 per cent of GDP from 6.7 per cent in 2021-22 and 11.5 per cent in 2020-21, as households continued to drawdown on their excess savings accumulated during the pandemic year (Chart 14). While the financial assets flows increased marginally to 11.1 per cent of GDP (from 10.6 per cent in 2021-22), liabilities of HH increased by 5.9 per cent of GDP in 2022-23 (from 3.8 per cent in 2021-22), as HH borrowed more, both from banks and non-banking financial companies (NBFCs). With a sizeable part of HH credit being used for real estate, there has been a compositional shift in total household savings away from financial savings in favour of physical savings (NSO, 2024). 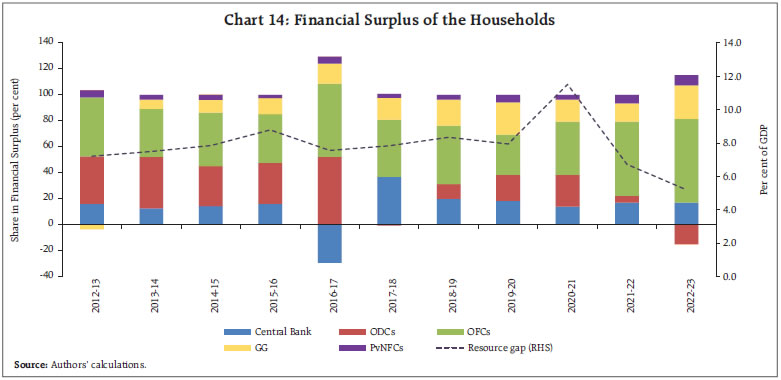 Regarding the financial assets of the HH sector, deposits with banks, non-banks and small saving schemes accounted for the maximum share in total assets. The financial assets of the sector grew by 9.8 per cent in 2022-23 as compared with 10.5 per cent in the previous year. Investment in equities and mutual funds remained robust, attracted by buoyant equity market conditions. In contrast to the general trend of HH allocating their surplus to all the sectors, HH turned net borrowers from the ODCs in 2022-23 on account of robust credit demand. Annual growth of currency holdings of HH, however, has been moderating with increasing preference for digital payments. On the liabilities side, while ODCs remained the primary source of finance, borrowings from both ODCs and OFCs surged. Consequently, household debt as a percentage of GDP increased to 39.4 per cent as at end-March 2023 from 38.1 per cent a year ago. The stock of HH financial assets reduced to 126.2 per cent of GDP at end-March 2023 from 131.2 per cent a year ago. Accordingly, their net financial wealth reduced to 86.8 per cent of GDP from 93.1 per cent over the same period, although it was above the pre-pandemic position (83.3 per cent of GDP in 2019-20) [Table 1]. IV.5 Rest of the World India remained a net borrower from the RoW in 2022-23. With higher merchandise deficit, and higher outgo relating to primary income, the current account deficit widened to 2.0 per cent of GDP from 1.2 per cent in the previous year. On the financing side, net FDI inflows were lower at 0.8 per cent of GDP in 2022-23 (1.2 per cent in the previous year) while portfolio investments witnessed outflows of (-) 0.2 per cent of GDP [(-) 0.5 per cent in the previous year] amidst heightened global uncertainties. Forex reserves declined by US$ 28.9 billion to US$ 578.4 billion as at end-March 2023, of which US$ 19.7 billion decline was due to valuation loss. Consequently, growth of liabilities of the RoW decelerated for the third consecutive year in 2022-23 (Chart 15). The share of debt securities, which is the main component of RoW’s liabilities, however increased further during 2022-23, as RBI’s foreign currency deposits with foreign central and commercial banks were substituted with debt securities (RBI 2023). IV.6 Sector and Instrument-wise Heat Maps The heat maps of sector-wise contribution to the increase in financial assets and liabilities of the domestic sectors are presented in Tables 2 and 3, respectively. Financial assets of the domestic sectors increased by 9.8 per cent during 2022-23. ODCs, HH and OFCs contributed almost 80 per cent of the total change, led by ODCs (28.7 per cent). In terms of instruments, loans and advances contributed the most to the increase in assets, followed by debt securities and deposits. Barring central bank and ODCs, an increase in deposits was seen across all the sectors with maximum contribution by HH. Equity investments saw an increase across all the institutional sectors. The HH sector, the sole contributor to the insurance, pension and provident funds, witnessed 10.5 per cent increase in the assets invested in this sector (Table 2). The liabilities of the domestic sectors increased by 10.4 per cent during 2022-23, driven by ODCs, NFCs, and GG. Instrument-wise loans and borrowings remained dominant, however, deposits by ODCs contributed the highest to the change in liabilities, followed by debt securities issued by GG. As noted earlier, deposit liability of the central bank reduced on account of decrease in liquidity surplus in the banking system while deposit liability of RoW reduced due to fall in RBI’s foreign currency assets. RoW’s liabilities in the form of debt securities increased by 20.4 per cent (Table 3).
V. Conclusion The financial stocks and flows during 2022-23 highlight the continued role of households and financial corporations as surplus sectors in meeting the financing needs of the general government and private non-financial corporations. Financial assets of the domestic sectors increased by 9.8 per cent during 2022-23 while their liabilities increased by 10.4 per cent. The net financial wealth (NFW) of domestic sector moderated to 24.9 percent of GDP at end-March 2023 from 29.0 percent in the previous year mainly on account of higher growth of liabilities vis-à-vis financial assets, driven by buoyant credit demand. However, the NFW at end-March 2023 remained above the pre-pandemic level of 24.2 percent in 2019-20. References GoI (2024). Union Budget 2024-2025. Ministry of Finance, Government of India. NSO (2024). National Accounts Statistics 2024. Ministry of Statistics and Programme Implementation, Government of India. OECD (2017). Understanding Financial Accounts. Edited by Peter van de Ven, P. and D. Fano (eds.), OECD Publishing, Paris, https://doi.org/10.1787/9789264281288-en. RBI (2023). Half Yearly Report on Management of Foreign Exchange Reserves: October 2022 - March 2023. Reserve Bank of India. RBI (2022). Half Yearly Report on Management of Foreign Exchange Reserves: October 2021 - March 2022. Reserve Bank of India. SEBI (2023). Annual Report 2022-23. Securities and Exchange Board of India.
|