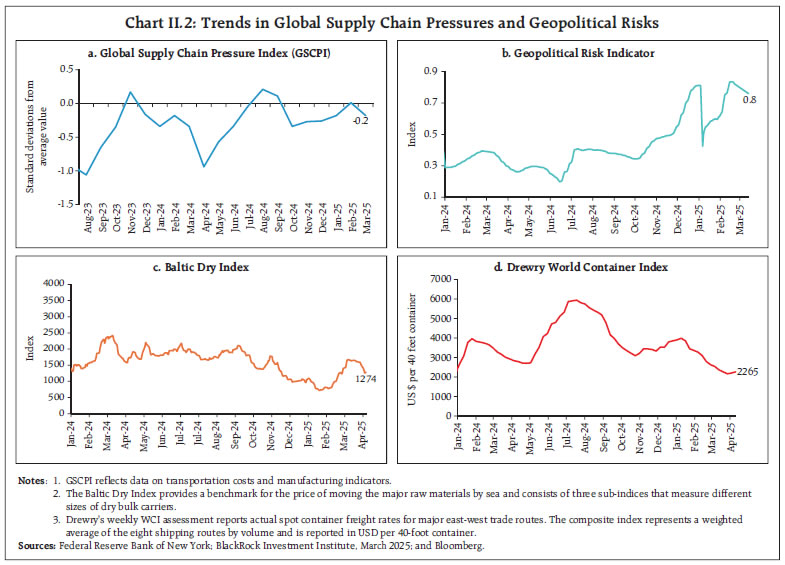
Escalation of trade and tariff tensions and the resultant financial market volatility have raised concerns regarding the weakening of global growth in the near-term. Although the dampening global economic outlook could impact India’s economic growth through weaker external demand, the domestic growth engines, viz., consumption and investment, are relatively less susceptible to external headwinds. Prospects for the farm sector have been boosted by the forecast of an above normal southwest monsoon for 2025, which could augment farm incomes and keep food prices under check. Headline inflation moderated to a 67-month low of 3.3 per cent in March, mainly due to a moderation in food prices. Introduction The global economic landscape is rapidly evolving, with trade policy uncertainty emerging as the key driver of the near-term outlook. On April 2, 2025, the US announced a 10 per cent base tariff and reciprocal levies on approximately 60 countries, taking average US tariffs to their highest levels in over a century. A 90 day pause on implementation of tariffs was announced on April 9 for those countries which did not resort to retaliatory actions. These developments have stoked fears of a global trade war, and countries are still working out their appropriate response in this uncertain environment. The deleterious impact of these escalating trade tensions on global growth are, however, inevitable. As per the International Monetary Fund (IMF), these tariffs “represent a significant risk to the global outlook at a time of sluggish growth”1. The Organization for Economic Co-operation and Development (OECD), in its latest global economic outlook, has assessed that increasing trade restrictions will contribute to higher costs both for production and consumption.2 The baseline assessment is that global growth is likely to weaken while potential pass-through of tariffs to consumer prices could keep inflation elevated. It is estimated that a trade war triggered by the increase in import tariffs is likely to weaken global output by 0.5 per cent.3 Forecasters have also increased the likelihood of a recession in the US.4 While the immediate effects are already visible in market volatility and economic forecasts, the longer-term consequences could lead to widespread disruption in industries, reduced investment, and slower economic recovery worldwide. Falling commodity prices, however, could soften the blow on countries which are net importers. Oil prices dropped to a 4-year low and metals prices have plummeted tracking anticipated slowdown in global growth. As per the World Trade Organization’s (WTO’s) assessment, the immediate impact of tariffs on world trade is expected to be substantial as, global merchandise trade volumes could contract by around 1 per cent in 2025, owing to new tariffs announced by the US along with those introduced at the beginning of the year.5 Much of this decline is expected to be driven by an 80 per cent fall in the bilateral trade between the US and China. As per the Food and Agriculture Organization’s (FAO) estimate, world trade in cereals in 2024-25 is projected to decline by 6.7 per cent from the previous year’s level, reaching the lowest since 2019-20, engendering inflation concerns in cereal importing countries.6 Global financial markets are in a state of flux, scrambling to decipher the implications of the dynamically evolving trade policy scenario. The sweeping tariff announcements sent financial markets into a tailspin globally. In the US, the S&P 500 index plunged to its lowest level in 11 months, erasing over US$5 trillion in market value within two days following the announcement of tariffs, but rebounded sharply on April 9 when a 90 day pause on implementation was announced. The US junk bond market saw its largest sell-off since 2020, even as the US dollar fell about 1.8 per cent. Global bond yields fell during March 2025 as investors, driven by flight to safety, moved to risk free government bonds amidst fears that escalating trade tensions could trigger a tariff-induced recession. The US bond yields, after reaching a high in mid-January 2025 fell as investor sentiments turned negative amidst continued sell-off in US equity markets. However, in early April, the 10-year US treasury yields moved higher, even raising concerns over reputation of US treasuries as a safe haven.7 Meanwhile, in Europe, the announcement of massive allocation of expenditure towards defence and infrastructure spending in some countries such as Germany and Portugal have led to the rise of the 10-year bond yields as investors priced in larger borrowings. The yield on 10-year Japanese bonds rose during March after years of being around zero as investors prepared for tighter monetary policy. Policy makers across the globe are grappling with a number of challenges stemming from these developments. Potential higher trade costs and anticipated slowdown in growth present them with the trade-off of supporting growth without fuelling inflation. The longer-term implications of these developments on productivity, market competition and welfare also cannot be ignored. Amidst a myriad of challenges posed by this volatile external environment, the Indian economy has exhibited marked resilience, with growth poised to recover from the blip witnessed during H1:2024-25. Although the weakening of global economic outlook could impact overall growth through weaker external demand, India’s domestic growth engines, viz., consumption and investment, are relatively less susceptible to external headwinds. As discussed in more detail in Section IV, India also has a low external vulnerability as reflected in its modest external debt-GDP ratio of 19 per cent and substantial forex reserves (close to 11 months of imports cover). India’s position as the fastest growing major economy, coupled with macroeconomic stability, makes it a preferable investment destination in a world characterised by growth slowdown and macro vulnerabilities.8 Additionally, a stable financial sector provides the backbone for sustainable growth, as the Indian financial system has become more robust and diverse, including banks and NBFCs being resilient to macrofinancial shocks.9 The Reserve Bank has been proactively deploying a slew of measures, including open market operations (OMOs), daily variable rate repo (VRR) auctions, and dollar/rupee buy-sell swap auctions, to augment system liquidity. These measures, undertaken since mid-January 2025, have helped to maintain orderly conditions in the money market with softening rates and spreads amidst improving liquidity conditions. The spread of 3-month Certificates of Deposit and 3-month Commercial Paper over 91-day Treasury bills has also reduced, reflecting improvement in liquidity conditions. The funding to NBFCs is also expected to improve as low risk weights on bank loans to NBFCs have been restored from April 1, 2025. On the real economy, Indian entrepreneurs are more confident than their global counterparts about their business prospects.10 India’s Purchasing Managers Indices (PMIs) have consistently outperformed that of other countries in line with this optimistic outlook. The latest enterprise surveys conducted by the Reserve Bank corroborate this assessment (Annex 1). There is continued positivity across sectors, with manufacturing showing higher capacity utilisation and improved business sentiments. Services and infrastructure firms remain upbeat on demand, pricing and profitability. Going forward, sustained demand from rural areas, an anticipated revival in urban consumption, expected recovery of fixed capital formation supported by increased government capital expenditure, and healthy balance sheets of corporates and banks are expected to support growth. Headline CPI inflation declined to a 67-month low of 3.3 per cent in March 2025, mainly due to the continued moderation in food prices. Core inflation (CPI excluding food and fuel), however, remained steady at 4.1 per cent, with gold contributing 22.8 per cent. Recent decline in global commodity prices on account of an expected slowdown in global growth has eased some of the pressures from imported inflation. Prospects for the farm sector have been boosted by the forecast of an above normal southwest monsoon for 2025, which could augment farm incomes and keep food prices under check. In its latest bi-monthly monetary policy meeting held during April 7-9, 2025, the Monetary Policy Committee (MPC) of the Reserve Bank recognised that the global economy is going through a period of exceptional uncertainties making it difficult to extract signal from a noisy and uncertain environment. The MPC noted that inflation is currently below the target and the domestic inflation outlook provides confidence of a durable alignment of headline inflation with the target of 4 per cent over the next year. The MPC opined that a benign inflation outlook and slackening pace of growth makes it imperative for monetary policy to remain growth supportive. Accordingly, the MPC reduced the policy repo rate by 25 bps to 6.00 per cent and reinforced the easing impact through a change in the stance to accommodative from neutral. Set against this backdrop, the remainder of the article is structured into four sections. Section II covers the rapidly evolving developments in the global economy. An assessment of domestic macroeconomic conditions is set out in Section III. Section IV encapsulates financial conditions in India, while the last Section presents the concluding observations. II. Global Setting Growing policy uncertainty and tariff war escalation are weighing on global economic prospects amidst fears that the combined effect of tariffs and expected retaliations will intensify headwinds for global growth. Against this backdrop, estimates of global GDP growth, inflation and trade are likely to be revised downwards. Our model-based nowcasts also point to a significant deceleration in global growth momentum in Q1:2025 (Chart II.1). While policy uncertainty has intensified, supply side pressures to the global economy are showing signs of easing. The Global Supply Chain Pressure Index (GSCPI) declined below historical average levels in March 2025 on account of lower transportation costs and reduced delivery times (Chart II.2a). The geopolitical risk indicator also recorded a sequential moderation in March although the level remains elevated (Chart II.2b). The Baltic Dry Index (BDI) eased slightly after a strong rebound in February, suggesting a temporary cooling in dry bulk shipping demand (Chart II.2c). Container freight rates, which had been on a declining trend, however, saw a brief uptick by early April driven by factors such as tariff-related disruptions and reduced shipping capacity (Chart II.2d). 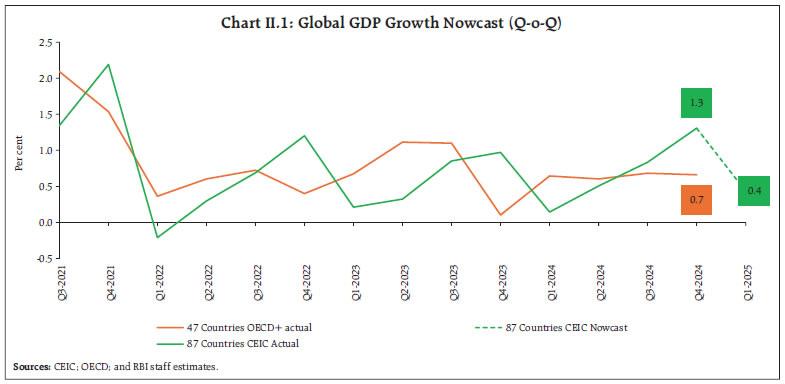
 Trade and policy uncertainties have started to impact consumer sentiments across geographies. Consumer sentiments worsened in the US in March 2025, reaching their lowest level since November 2022, on account of surging inflation expectations, worsening business conditions and uncertain economic outlook on account of tariff escalations. Eurozone also witnessed weakening sentiments, while it improved marginally in the UK and Brazil (Chart II.3a and b). Financial conditions exhibited tightening bias across major AEs and EMEs, except in India and China (Chart II.3c and d). The global composite purchasing managers’ index (PMI) increased modestly in March 2025 as the downturn in the manufacturing sector was offset by a sharp uptick in services sector activity (Chart II.4a). Global manufacturing PMI moderated as output and new orders decelerated, and business optimism fell to a three-month low. Global services PMI, however, rose sharply, recovering from February’s low. Across regions, India continued to be an outlier with robust PMI readings compared with its peers (Chart II.4b).
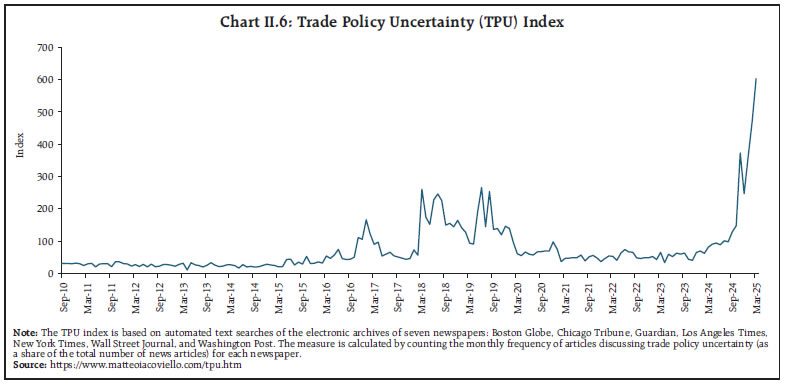
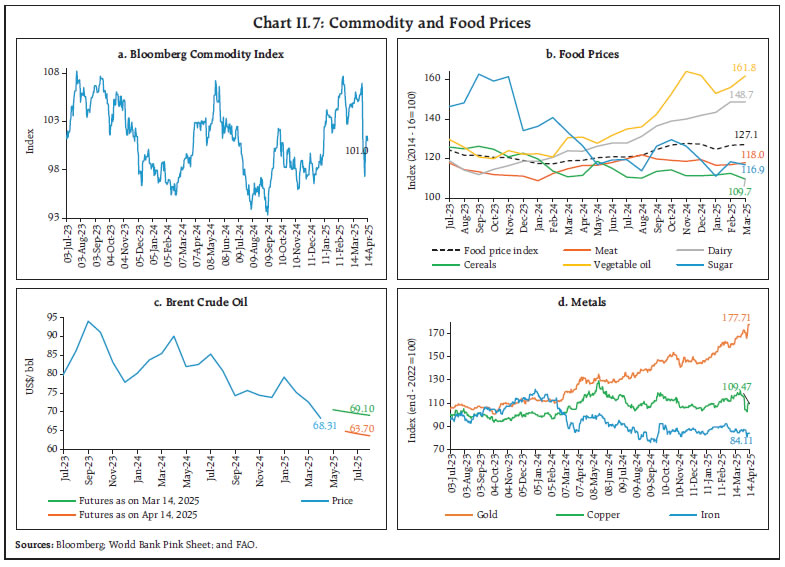
The composite PMI for new export orders recorded a sequential pick-up in March, with both the manufacturing and composite new export orders moving to expansionary territory, after remaining in contractionary zone since June 2024. Services export orders continued to expand despite a sequential deceleration (Chart II.5). Global trade outlook, however, is marred by considerable uncertainty as reflected in the trade policy uncertainty (TPU) index reaching historical highs (Chart II.6). Global commodity prices, as indicated by the Bloomberg Commodity Index, rose by 3.6 per cent in March, led by metal prices, which rose on account of rising optimism about China’s stimulus package. Commodity prices, however, fell sharply in early April due to bleak demand outlook in anticipation of a global slowdown in the wake of a disruptive tariff war, though recovered partially thereafter (Chart II.7a). Food prices, measured by the FAO’s food price index, edged up by 0.3 per cent (m-o-m) in March, primarily driven by the increase in prices of vegetable oil, which was somewhat offset by moderation in prices of cereals and sugar (Chart II.7b). Crude oil prices increased by 5.1 per cent in March (m-o-m) after the US imposed fresh sanctions on Venezuela and Iran. Prices, however, declined precipitously in April, with the brent prices falling to around US$ 63 per barrel on April 9 - touching nearly a four-year low - amidst fears of growth disruptive tariff wars (Chart II.7c). Apart from this, unexpected announcement by the OPEC plus to advance their plan to phase out the oil output cuts, thereby increasing output starting May, also contributed to the price decline. Brent oil prices recovered to US$ 67 per barrel as on April 14, following tariff exemptions on electronic goods. Base metal prices also fell sharply in early April on account of an expected slowdown in global demand, followed by a modest recovery. Gold prices remained elevated in March, bolstered by safe-haven demand amidst heightened trade uncertainties. Although the yellow metal pared gains in early April amidst escalating trade tensions, prices picked up again to surpass the $3200 mark (Chart II.7d). 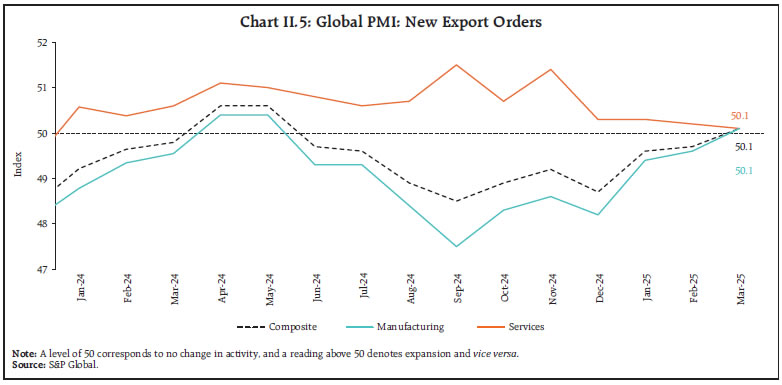
 Headline inflation continued to remain moderate in most major economies, although spillover of tariffs to final consumer prices has emerged as a major upside risk. In the US, CPI inflation softened to 2.4 per cent (y-o-y) in March from 2.8 per cent in February. Inflation in terms of the personal consumption expenditure (PCE) deflator, however, remained stable at 2.5 per cent in February. Headline inflation in the Euro area moderated to 2.2 per cent in March from 2.3 per cent in February. Inflation in the UK and Japan also softened by 20 bps and 30 bps to 2.8 per cent and 3.7 per cent, respectively, in February (Chart II.8a). Among EMEs, CPI inflation in Brazil and Russia rose in March, while that in South Africa remained stable. China, on the other hand, remained in deflation, with CPI registering a decline of 0.1 per cent (y-o-y) in March (Chart II.8b). Core inflation remained above the headline across major AEs, except in Japan, while services inflation decelerated in the US and Euro area (Chart II.8c and d). 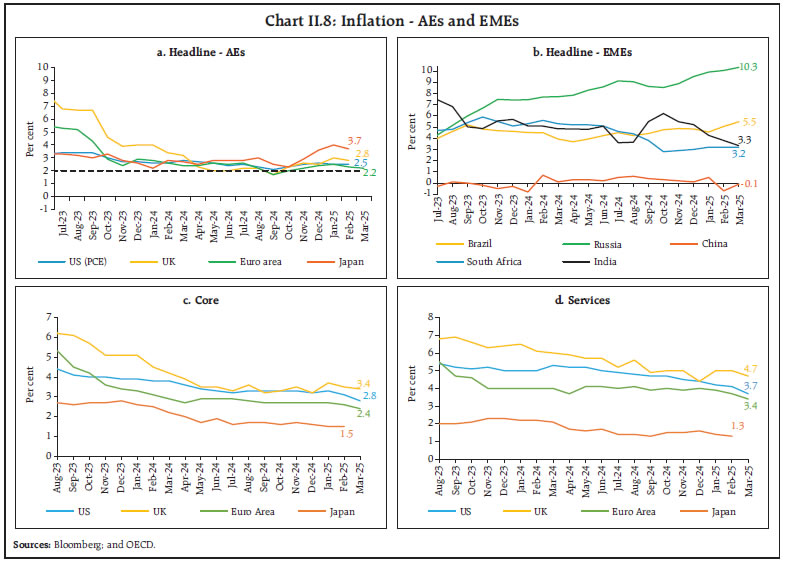 The risk-off sentiment amidst trade policy uncertainty contributed to a significant downturn in the equity market in March and early April. The Morgan Stanley Capital International (MSCI) world equity index shed gains to the tune of 4.1 per cent (m-o-m) in March, led by the losses in AE equity markets. The sell-off in equity markets intensified after the tariff announcements, leading to broad-based declines with the equity index shedding 10.2 per cent up to April 8 (Chart II.9a). Equity markets in most geographies staged a rapid recovery following the announcement of the pause in tariff implementation although volatility remains high. Yields on the US government securities remained volatile in March amidst a turbulent global environment which impacted the sentiments. The US 10-year treasury yields dropped below the 4 per cent mark on April 6 after fears of trade war intensified, inducing investors to deploy funds in safer assets (Chart II.9b). The yields recovered quickly in the following week, as safe haven appeal for gold and Swiss franc increased. The US dollar index (DXY) depreciated by 3.2 per cent in March and further by 4.4 per cent in April (up to April 14) as investors priced in a higher probability of a recession in the US. The MSCI currency index for EMEs increased modestly in March and remained broadly steady in April (up to April 14) despite capital outflows, in both debt and equity, mounting downside pressures (Chart II.9c and II.9d). 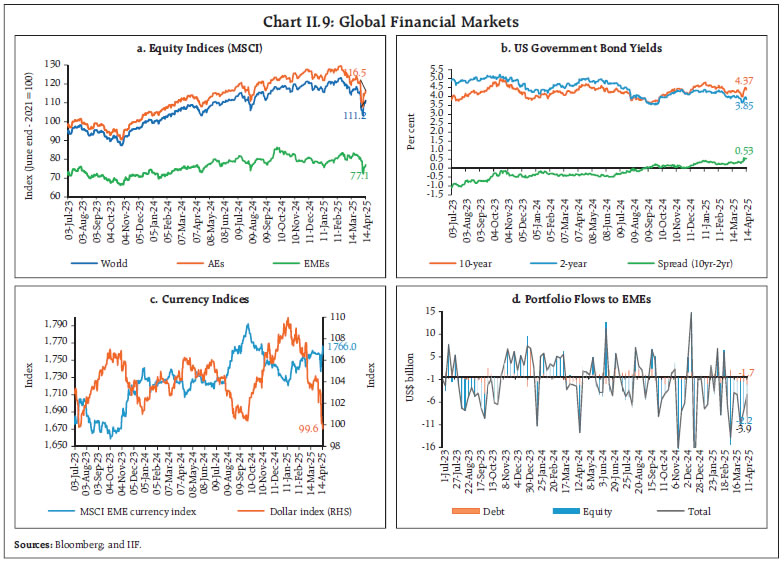
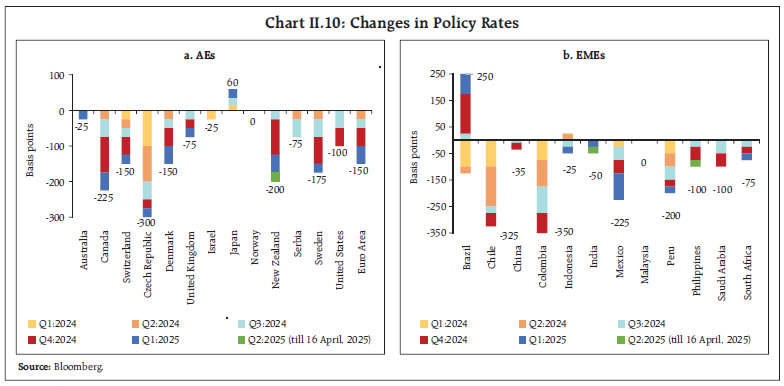 In terms of monetary policy actions, most countries remained guarded maintaining a pause, while a few reduced rates albeit with caution. Among AE central banks, the US, Japan, UK, Sweden, Norway and Czech Republic kept their key rates unchanged in March while the ECB and Switzerland reduced it by 25 bps each. Australia, Canada and Israel maintained a status quo in their April meetings whereas New Zealand cut its official cash rate by 25 bps (Chart II.10a). Among EME central banks, Poland and Peru maintained a status quo in April, and China, Russia, Hungary, Indonesia, South Africa, and Chile opted to maintain their policy rates unchanged in March. Mexico cut its policy rate by 50 bps in March and Philippines reduced its key rate by 25 bps in April. In contrast, Brazil hiked the policy rate by 100 bps in March (Chart II.10b). III. Domestic Developments The Indian economy continues to remain resilient on strong domestic growth impulses and sound macro-fundamentals despite strong global headwinds emanating from trade tensions. Consumers and businesses remain optimistic regarding the economic outlook. As per the latest Consumer Confidence Survey of the Reserve Bank, the Current Situation Index (CSI) sequentially improved although it remained below the neutral mark. Meanwhile, the Future Expectations Index (FEI) strengthened further, indicating optimistic outlook of the respondents on a net basis (Chart III.1a). Supply chain pressures continued to remain below historical average levels in March (Chart III.1b). Aggregate Demand High frequency indicators suggest that aggregate demand remained broadly resilient during Q4:2024-25. Indicators such as E-way bills and toll collections recorded robust y-o-y growth in double digits in March 2025, despite a sequential moderation in the latter (Chart III.2a and Chart III.2b). Automobile sector showed signs of improvement in March. Wholesale automobile sales recorded a double-digit growth in March; scooter sales contributed significantly to overall two wheeler sales indicating strong rural demand (Chart III.3a and 3b). Tractor sales also registered a double-digit growth for the fourth consecutive month. Despite a sequential improvement, vehicle registrations recorded a y-o-y contraction in both non-transport and transport vehicles segments (Chart III.3c). Petroleum consumption declined by 3.1 per cent (y-o-y) in March (Chart III.3d). As per the PMI survey, job creation in both organised manufacturing and services sectors continued to expand despite a sequential deceleration in the pace of expansion (Chart III.4).
With the commencement of the rabi harvest, the demand for work under the Mahatma Gandhi National Rural Employment Guarantee Scheme (MGNREGS) declined in March. Annual demand for work during 2024-25 declined compared to the previous year by 7.4 per cent (Chart III.5a), The daily wages under the MGNREGS have increased between 2.3 per cent to 7.5 per cent (₹7 - ₹26 per day) across states with effect from April 01, 2025 (Chart III.5b). India’s merchandise exports grew by 0.7 per cent (y-o-y) to US$ 42.0 billion in March 2025 – marking a rebound after four straight months of contraction – driven by a recovery in non-oil exports (Chart III.6). Exports of 18 out of 30 major commodities (accounting for 42.0 per cent of export basket in 2023-24) expanded on a y-o-y basis in March. Electronic goods, drugs and pharmaceuticals, gems and jewellery, marine products, and rice supported export growth in March while, organic and inorganic chemicals, petroleum products, engineering goods, handicrafts excluding handmade carpet, and spices contributed negatively (Chart III.7). During 2024-25 (April-March), India’s merchandise exports expanded marginally by 0.1 per cent to US$ 437.4 billion, primarily led by electronic goods, engineering goods, drugs and pharmaceuticals, rice, and textiles, while petroleum products, gems and jewellery and iron ore dragged exports down. Exports to 10 out of 20 major destinations expanded in March 2025, while exports to 13 out of 20 major destinations expanded during 2024-25, with the US, the UAE and the Netherlands being the top three export destinations.
Merchandise imports at US$ 63.5 billion expanded by 11.4 per cent (y-o-y) in March 2025, mainly due to increasing oil, gold and electronic imports. Out of 30 major commodities, 22 commodities (accounting for 81.7 per cent of import basket) registered an expansion on y-o-y basis (Chart III.8). Gold, petroleum, crude and products, electronic goods, machinery, and chemical material and products supported the import growth, while coal, coke and briquettes, transport equipments, silver, pearls, precious and semi-precious stones and project goods dragged imports down (Chart III.9). During 2024-25, India’s merchandise imports at US$ 720.2 billion increased by 6.2 per cent (y-o-y), mainly led by gold, electronic goods, and petroleum, crude and products, while coal, coke and briquettes, etc., pearls, precious and semi-precious stones contributed negatively.
Imports from 11 out of 20 major source countries contracted in March 2025, while imports from 13 out of 20 major source countries expanded in 2024-25. Among major trading partners, imports from China, UAE and the US increased, while imports from Russia declined in March. Merchandise trade deficit widened to US$ 21.5 billion in March 2025 from US$ 15.3 billion in March 2024. Oil deficit increased to US$ 14.1 billion in March from US$ 10.9 billion a year ago. However, its share in total trade deficit fell to 65.5 per cent in March from 71.3 per cent a year ago. Similarly, non-oil deficit widened to US$ 7.4 billion in March from US$ 4.4 billion a year ago (Chart III.10). During 2024-25, merchandise trade deficit widened to US$ 282.8 billion from US$ 241.1 billion a year ago. Petroleum products were the largest source of deficit, followed by electronic goods and gold (Chart III.11). In February 2025, net services export earnings recorded a robust y-o-y growth of 30.6 per cent. Services exports grew by 11.6 per cent (y-o-y) to US$ 31.6 billion due to a rise in exports of software and business services, while services imports contracted by 4.8 per cent (y-o-y) to US$ 14.5 billion (Chart III.12). During April-February 2024-25, the gross fiscal deficit (GFD) –as a proportion of the revised estimates (RE) – was lower whereas the revenue deficit (RD) stood higher than the corresponding period of the previous year. However, the gross primary deficit as proportion of RE remained the same as last year (Chart III.13a). During April-February 2024-25, the key fiscal indicators on the receipts and expenditure front, such as revenue receipts, revenue expenditure and, non-debt capital receipts (as per cent of RE for 2024-25) remained broadly in line with the pattern of the previous year (Chart III.13b). 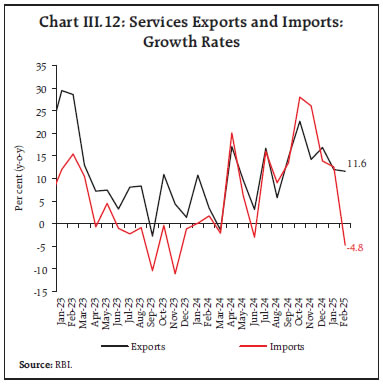
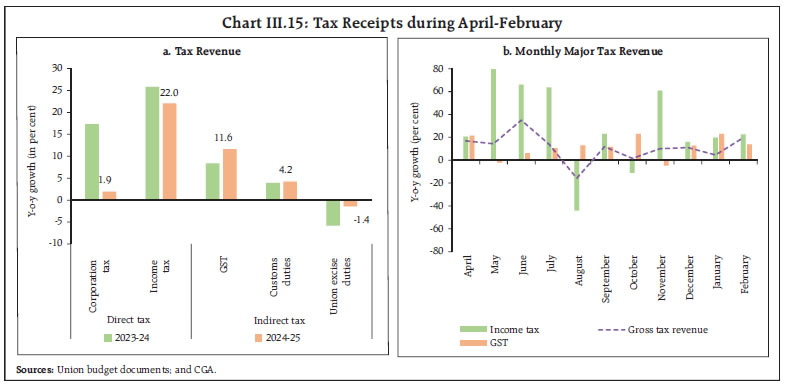
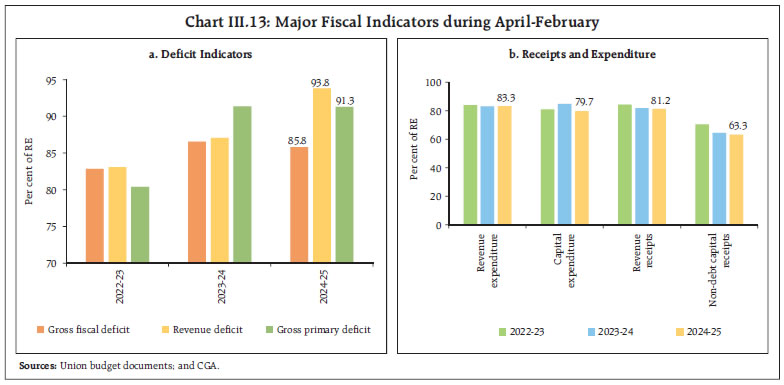 The total expenditure of the Union government increased by 3.9 per cent during April-February 2024-25 vis-à-vis a growth of 7.3 per cent during April-February 2023-24. Amongst the expenditure components, revenue expenditure recorded a growth of 4.7 per cent (y-o-y) during April-February 2024-25 in comparison to 1.3 per cent witnessed during the corresponding period of the previous year. Revenue expenditure excluding interest payments and major subsidies grew by 3.9 per cent on a y-o-y basis, achieving 81.1 per cent of its target for 2024-25 (RE). Capital expenditure witnessed a growth of 0.8 per cent during April-February 2024-25 over the corresponding period of the previous year. As per cent of the RE for 2024-25, the capital expenditure of top six ministries (with the highest share in capex) was broadly in line with that of the pattern observed in 2023-24 (RE), except for the Ministry of Communications (Chart III.14). On the receipts side, the revenue receipts of the Union government registered a y-o-y growth of 13.5 per cent during April-February 2024-25 vis-à-vis a growth of 11.6 per cent registered during the corresponding period of the previous year. Direct taxes increased by 13.3 per cent on a y-o-y basis whereas indirect taxes registered a growth of 7.9 per cent, leading to a growth in gross tax revenue by 10.9 per cent. The robust growth in tax collections was mainly driven by income tax, GST, and customs duties (Chart III.15a). Similarly, in terms of month-wise performance, collections from GST and income tax registered positive y-o-y growth for most months, thereby augmenting the growth of tax revenue collections in 2024-25 (Chart III.15b). 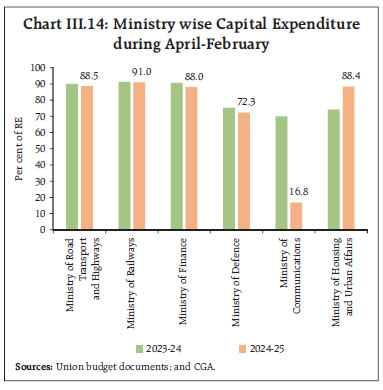
 The collections from securities transaction tax (STT) grew by 65.2 per cent y-o-y during April-February 2024-25 (Chart III.16a). Non-tax revenue collections grew by 36.9 per cent during April-February 2024-25, on the back of surplus transfer of ₹2.11 lakh crore from the Reserve Bank. Overall, total receipts expanded by 13.4 per cent during April-February 2024-25 vis-à-vis a growth of 10.1 per cent during the corresponding period of the previous year. In March 2025, gross GST collections (Centre plus States) rose to ₹1.96 lakh crore, the second highest monthly collection since its inception in 2017. The cumulative GST collection during 2024-25 amounted to ₹22.09 lakh crore, 9.4 per cent higher than during 2023-24 (Chart III.16b). Notwithstanding the global challenges, the robust GST collection in recent times underlines the resilience of domestic economic activity. As per the provisional data available up to February 2025, States’ combined GFD reached 64.2 per cent of their budget estimates for 2024-25, higher than last year’s level of 58.0 per cent (Chart III.17a). States’ revenue receipts recorded a moderate growth of 7.3 per cent during 2024-25, primarily due to a decline in grants from the Centre. Tax revenues remained resilient, growing by 11.2 per cent, albeit lower than the growth of 15.9 per cent witnessed in the previous year (Chart III.17b). The States’ Goods and Services Tax (SGST) experienced robust growth, while State excise growth decelerated. Additionally, sales tax/VAT rebounded after a decline in the previous year. States’ revenue expenditure increased by 11.2 per cent during April-February 2024-25, while capital expenditure experienced a modest growth of 1.1 per cent (Chart III.17c). During April-January 2024-25, the Union government has released ₹1.1 lakh crore as financial assistance under the ‘Scheme for Special Assistance to States for Capital Investment’, amounting to 88.6 per cent of the revised estimate of ₹1.25 lakh crore for 2024-25. The revenue expenditure to capital outlay (RECO) ratio of states rose to 6.8 during April-February 2024-25 on account of a faster growth in revenue expenditure, thereby weakening the quality of expenditure (Chart III.17d). Similarly, the share of capital outlay in total expenditure (CO-TE) declined from 14.1 per cent last year to 12.7 per cent during 2024-25. Aggregate Supply As on April 11, 2025, 92.4 per cent of summer sowing was completed and the acreage was 14.7 per cent higher than the levels recorded a year ago (Chart III.18). Area under all the major crops recorded higher acreage compared to the previous year. The above normal temperature (maximum as well as minimum) and above normal number of heatwave days are estimated over most parts of the country during the summer months (April to June), raising concerns on summer crops (Chart III.19). Nonetheless, the western disturbance induced rains in the selected regions could keep the temperature rise under control. Additionally, harvesting of majority of rabi crops (viz., wheat, rapeseed, mustard and chana) is expected to be completed by April, making heatwaves less of a concern for them (Chart III.19).
The reservoir levels (based on 161 major reservoirs) were at 37 per cent of total reservoir capacity (as of April 11, 2025), which is higher than the previous year as well as the decadal average levels (Chart III.20). As per the IMD’s first stage long-range forecast, the rainfall during southwest monsoon season (June-September 2025) is most likely to be above normal at 105 per cent of the long period average (with a model error of ±5 per cent). The neutral El-Nino-Southern Oscillations (with features similar to La Nina), neutral Indian Ocean Dipole, and below normal snow cover over the northern hemisphere and Eurasia during January - March 2025 are other favourable factors for monsoon precipitation. These developments have boosted the crop prospects for the forthcoming kharif season. Rice procurement for the kharif marketing season 2024-25 (Oct-Sep) at 516.3 lakh tonnes (as on April 17, 2025) was 6.5 per cent higher than the previous year. Wheat procurement for rabi marketing season (RMS) 2024-25 ended at 265.9 lakh tonnes (2 per cent higher than last year). Additionally, wheat procurement for RMS 2025-26 has started, and 48.02 lakh tonnes of wheat have been procured as on April 17, 2025. Rice stocks held by the Food Corporation of India (as on April 1, 2025) reached 631 lakh tonnes, which is 4.6 times the buffer requirements. Wheat stock stood at 118 lakh tonnes, which is 1.6 times the buffer norms. To manage overall food security and to prevent speculation, the Union government has mandated the traders/wholesalers, retailers, big chain retailers and processors to declare their stock position of wheat as on April 01, 2025 and subsequently on every Friday (Chart III.21). India’s manufacturing PMI reached an eight-month high in March 2025, reflecting acceleration in new orders and output (Chart III.22a). The services PMI, however, recorded a marginal deceleration in March, although it continued to remain strongly in expansionary territory (Chart III.22b). Business expectations/future output assessments moderated slightly for manufacturing and services.
Among the high frequency indicators of industrial activity, growth in port traffic accelerated in March 2025, driven by higher growth in petroleum, oil and lubricants (POL) and other miscellaneous cargo (Chart III.23). The construction sector reflected a mixed picture as cement production recorded double-digit y-o-y growth in February while steel consumption recorded a decline in March (Chart III.24).
Available high frequency indicators for the services sector reflect broad based growth in economic activity in March (Table III.1).
India has been working diligently towards adapting to climate change while mitigating the risks from them. India’s climate actions for energy conservation have been on track as compared to other emerging market economies. India’s economy has become increasingly energy-efficient, with energy intensity11 reducing from 0.27 Mega Joules/₹ in 2014-15 to 0.22 Mega Joules/₹ in 2023-24 (Chart III.25). The major energy conservation programmes being implemented by the government include perform, achieve and trade (PAT) scheme for energy-intensive industries; standards and labelling scheme for appliances by the Bureau of Energy Efficiency (BEE); Unnat Jyoti by Affordable LEDs for All (UJALA) scheme; and adoption of electric mobility. According to the Energy Statistics of India 2025, the potential for energy generation from renewable sources has been estimated at 21,09,655 megawatt (MW) as on March 31, 2024. The highest potential for energy generation comes from wind (55.17 per cent), followed by solar energy (35.50 per cent) and large hydro (6.32 per cent). India is also enhancing its nuclear power capacity to meet growing energy demand from non-renewable sources. There has been more than 70 per cent increase in India’s nuclear power capacity from 4,780 MW in 2010-11 to 8,180 MW in 2024. Further, India plans to increase its nuclear power capacity to 22,480 MW by 2031-32 (Chart III.26). The Union Budget 2025-26 announced a nuclear energy mission for research and development of Small Modular Reactors (SMR) with an outlay of ₹20,000 crore and development of nuclear energy capacity of 100 giga watt (GW) by 2047.12 Inflation Headline inflation, as measured by y-o-y changes in the all-India consumer price index (CPI)13, declined to 3.3 per cent in March 2025 from 3.6 per cent in February, marking the fourth consecutive monthly decline and the lowest reading since August 2019 (Chart III.27). The decline in headline inflation by approximately 30 basis points (bps) came entirely from a negative price momentum of around 30 bps in the absence of any base effect in March.14 Among the major groups, CPI food recorded a negative momentum of around (-)0.7 per cent during the month, while momentum in CPI fuel and core (excluding food and fuel) groups was positive at 0.1 and 0.2 per cent, respectively. Annual inflation in food group decelerated sharply to 2.9 per cent in March from 3.8 per cent in February. In terms of sub-groups, vegetables, pulses and eggs experienced further deflation. Spices continued to remain in deflation, albeit at a slower pace. Inflation in cereals, meat and fish, and milk and products continued to moderate. Inflation in oils and fats, fruits, sugar and confectionary, non-alcoholic beverages, and prepared meals, however, continued to rise (Chart III.28). Fuel and light group registered an inflation of 1.5 per cent (y-o-y) in March as against the contraction of (-)1.3 per cent in February. This was the first positive y-o-y print for fuel group following eighteen consecutive months of deflation. Kerosene prices moving out of deflation, a higher rate of inflation in electricity prices along with a lower rate of deflation in LPG prices drove this turnaround. Core CPI inflation remained steady at 4.1 per cent in March 2025, although contrarian trends were witnessed within the sub-groups. Inflation increased in pan, tobacco and intoxicants, housing, health, transport and communication and education, while it moderated in clothing and footwear, recreation and amusement, personal care and effects and household goods and services (Chart III.29). In terms of regional distribution, rural and urban inflation eased to 3.25 per cent and 3.43 per cent, respectively, in March 2025. CPI inflation ranged between 1.1 per cent to 6.6 per cent at state-level, with majority of the states registering less than 4 per cent inflation (Chart III.30).
High frequency food price data for April so far (up to 15th) show a moderation in cereal prices, for both rice and wheat. Pulses prices also continued to record a broad-based moderation. Edible oil prices, on the other hand, have firmed up - mainly for palm, soybean and sunflower oil. Among key vegetables, prices of potato and onion recorded further correction, while tomato prices witnessed a slight pick-up (Chart III.31). Retail selling prices of petrol and diesel have remained unchanged in April thus far (up to 15th). While kerosene prices picked up slightly, LPG prices were hiked by ₹50 per cylinder on April 8, 2025 (Table III.2). The PMIs for March 2025 recorded an uptick in the rate of expansion of input prices for manufacturing, while for services sector it remained relatively sticky. Selling price pressures, however, moderated across manufacturing and services firms in March (Chart III.32).
| Table III.2: Petroleum Products Prices | | Item | Unit | Domestic Prices | Month-over-month (per cent) | | Feb-25 | Mar-25 | Apr-25^ | Mar-25 | Apr-25^ | | Petrol | ₹/litre | 101.02 | 101.02 | 101.02 | 0.0 | 0.0 | | Diesel | ₹/litre | 90.48 | 90.48 | 90.48 | 0.0 | 0.0 | | Kerosene (subsidised) | ₹/litre | 46.37 | 46.23 | 46.56 | -0.3 | 0.7 | | LPG (non-subsidised) | ₹/cylinder | 813.25 | 813.25 | 863.25 | 0.0 | 6.1 | Notes: 1. ^: For the period April 1-15, 2025.
2. Other than kerosene, prices represent the average Indian Oil Corporation Limited (IOCL) prices in four major metros (Delhi, Kolkata, Mumbai and Chennai). For kerosene, prices denote the average of the subsidised prices in Kolkata, Mumbai and Chennai.
Sources: IOCL; Petroleum Planning and Analysis Cell (PPAC); and RBI staff estimates. | Households’ perception of the current inflation declined by 50 bps to 7.8 per cent. Their inflation expectations also eased, with a reduction of 40 bps and 50 bps for the next three months and one year, respectively (Chart III.33).
IV. Financial Conditions The seasonal increase in currency in circulation and RBI’s forex operations were the major drivers of liquidity tightness during Q4:2024-25. Responding to the liquidity needs of the banking system, the Reserve Bank has taken a slew of measures to inject durable liquidity, apart from conducting daily variable rate repo (VRR) auctions sine mid-January 2025. Consequently, liquidity deficit in the banking system moderated during February-March 2025, with average daily net injection under the Liquidity Adjustment Facility (LAF) declining to ₹1.1 lakh crore in March 2025 as compared to ₹2.0 lakh crore in January 2025. Since January 2025, the Reserve Bank has injected around ₹7.9 lakh crore of durable liquidity through a combination of open market operation (OMO) purchases, longer-duration VRR auctions and forex swaps, so far (Table IV.1). System liquidity turned into surplus since March 29, 2025, after a gap of over three months on account of RBI’s liquidity augmenting measures along with the usual drawdown of government cash balances in the month-end. Furthermore, the aggregate limit available to Standalone Primary Dealers (SPDs) under the Standing Liquidity Facility (SLF) were increased from ₹10,000 crore to ₹15,000 crore beginning April 2, 2025, and a calendar of open market purchase operations were announced for April 2025. Effective March 26, 2025, SPDs were also allowed to participate in all repo operations, irrespective of the tenor. The Reserve Bank has been conducting daily VRR auctions since January 16, 2025 and standalone primary dealers (SPDs) were allowed to participate in these auctions. An aggregate amount of ₹10.2 lakh crore was injected into the banking system through nineteen fine-tuning VRR operations of 1 to 5 days maturity during March 16 to April 17, 2025. | Table IV.1: Durable Liquidity Measures since January 2025 | | (Amount in ₹ crore) | | Measures | Auction Date | Description | Bid Cover Ratio | Liquidity injected | | OMO Purchase | January to March, 2025 | Through NDS-OM | | 38,825 | | OMO Purchase auctions | January 30, 2025 | Notified Amount: 20,000 | 6.03 | 20,020 | | January 30, 2025 | Notified Amount: 20,000 | 6.03 | 20,020 | | February 13, 2025 | Notified Amount: 40,000 | 4.53 | 40,000 | | February 20, 2025 | Notified Amount: 40,000 | 4.69 | 40,000 | | March 12, 2025 | Notified Amount: 50,000 | 2.51 | 50,000 | | March 18, 2025 | Notified Amount: 50,000 | 2.02 | 50,000 | | March 25, 2025 | Notified Amount: 50,000 | 1.35 | 44,541 | | April 3, 2025 | Notified Amount: 20,000 | 4.04 | 20,000 | | April 8, 2025 | Notified Amount: 20,000 | 3.51 | 20,000 | | April 17, 2025 | Notified Amount: 40,000 | 2.03 | 40,000 | | Term Repo Auctions | February 07, 2025 | 56-day VRR auction | 2.17 | 50,010 | | Notified Amount: 50,000 | | February 14, 2025 | 49-day VRR auction | 1.33 | 75,003 | | Notified Amount: 75,000 | | February 21, 2025 | 45-day VRR auction | 0.77 | 57,951 | | Notified Amount: 75,000 | | April 17, 2025 | 43-day VRR auction | 0.17 | 25,731 | | Notified Amount: 1,50,000 | | USD/INR Buy/Sell swap auctions | January 31, 2025
(Settlement on Feb 4, 2025) | Tenor: 6 months | 5.12 | 44,000* | | Notified Amount: USD 5 billion | February 28, 2025
(Settlement on Mar 4, 2025) | Tenor: 3 years | 1.62 | 88,000* | | Notified Amount: USD 10 billion | March 24, 2025
(Settlement on Mar 26, 2025) | Tenor: 3 years | 2.23 | 86,000* | | Notified Amount: USD 10 billion | | Total | | | | 7,90,081* | Note: *: indicates approximate value.
Sources: RBI; and Monetary Policy Report, April 2025. |
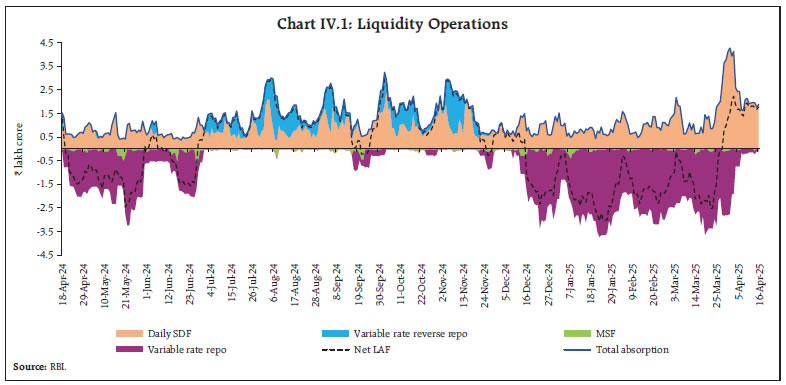 The average daily net absorption under the liquidity adjustment facility (LAF) stood at ₹0.31 lakh crore during March 16 to April 17, 2025 as compared to average daily net injection of ₹1.46 lakh crore during February 16 to March 15, 2025 (Chart IV.1). Banks’ placement of funds under the standing deposit facility (SDF) averaged ₹2.13 lakh crore during this period, higher than ₹1.12 lakh crore in the previous month. The co-existence of deficit liquidity conditions and substantial fund placements under the SDF during mid-December 2024 to end-March 2025 suggests the asymmetric distribution of liquidity within the banking system. Meanwhile, daily average borrowings under the marginal standing facility (MSF) declined marginally to ₹0.04 lakh crore during this period. The weighted average call rate (WACR) – the operating target of monetary policy – broadly remained within the policy corridor, barring the year-end spike. The spread of the WACR over the policy repo rate averaged (-)1 basis point (bp) during March 16 and April 16, 2025, compared to 5 bps during February 16 to March 15, 2025 (Chart IV.2a). Rates in the collateralised segment also moderated due to improving liquidity conditions. Across the term money market segment, the rates on 3-month certificates of deposit (CDs), 3-month commercial papers (CPs) issued by non-banking financial companies (NBFCs) and 91-day T-bills moderated since the latter part of March after remaining elevated since mid-December 2024 (Chart IV.2b). The average risk premia in the money market (3-month CP [NBFC] minus 91-day T-bill) moderated to 104 bps during the current period from 142 bps during March 16 to April 16, 2025 (Chart IV.2c). During March 16 to April 16, 2025, the weighted average discount rate (WADR) of CPs and the weighted average effective interest rate (WAEIR) of CDs remained lower by 59 bps and 6 bps, respectively, than the levels recorded a year ago (Chart IV.3). In the primary market, issuances of CDs reached an all-time high of ₹11.75 lakh crore during 2024-25 (up to March 21, 2025) [Chart IV.4]. Banks’ reliance on CDs to meet their funding requirements in March is also a seasonal phenomenon. Similarly, CP issuances at ₹15.74 lakh crore were higher by 14.5 per cent during 2024–25 (up to March 31, 2025). The yield on the 10-year G-sec benchmark softened to 6.39 per cent on April 16, 2025, as compared to 6.70 per cent on March 17, 2025 (Chart IV.5a). The moderation was on account of lower than expected inflation, open market operations by the Reserve Bank, and softening of global bond yields. The domestic yield curve softened across the term structure (Chart IV.5b). Between March 16 and April 16, 2025, the average term spread (10-year G-sec yield minus 91-day T-bills yield) marginally hardened to 29 bps as compared to 27 bps during the previous period.
The spread of the 10-year Indian G-sec yield over the 10-year US bond yield moderated in March, driven by a fall in Indian yields. The spread has fallen in April so far (up to April 16, 2025), mainly due to spike in US bond yields. The volatility of yields in India remained low relative to the US treasuries (Chart IV.6). Corporate bond issuances at ₹8.77 lakh crore were 16.3 per cent higher during 2024-25 (up to February) as compared to last year. Corporate bond yields moderated across rating spectrum and tenors, while the corresponding risk premia exhibited mixed trends during the second half of March till April 15, 2025 (Table IV.2).
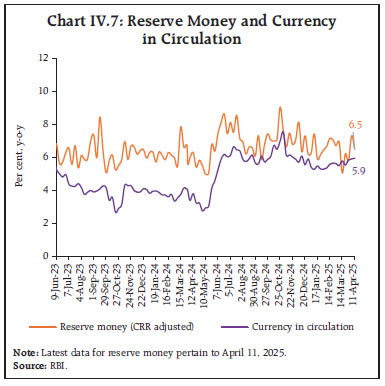
Reserve money (RM), adjusted for the first-round impact of change in the cash reserve ratio (CRR), recorded a growth of 6.5 per cent (y-o-y) as on April 11, 2025 (6.3 per cent a year ago) [Chart IV.7]. Growth in currency in circulation (CiC), the largest component of RM, stood at 5.9 per cent (y-o-y) as compared with 3.8 per cent a year ago. On the sources side (assets) of RM which include both RBI’s net foreign assets (NFA) and net domestic assets (NDA), while foreign currency assets grew marginally by 4.9 per cent (y-o-y) as on April 11, 2025, gold increased by 47.9 per cent mainly due to revaluation gains on account of higher gold prices (Chart IV.8). This led to a steady rise in its share in NFA from 8.3 per cent as at end-March 2024 to 12.1 per cent as on April 11, 2025. | Table IV.2: Financial Markets - Rates and Spread | | | Interest Rates (per cent) | Spread (basis points) | | | (Over Corresponding Risk-free Rate) | | | | Instrument | Feb 16, 2025 – Mar 13, 2025 | Mar 16, 2025 – Apr 15, 2025 | Variation | Feb 16, 2025 – Mar 13, 2025 | Mar 16, 2025 – Apr 15, 2025 | Variation | | 1 | 2 | 3 | (4 = 3-2) | 5 | 6 | (7 = 6-5) | | Corporate Bonds | | | | | | | | (i) AAA (1-year) | 7.85 | 7.43 | -42 | 121 | 99 | -22 | | (ii) AAA (3-year) | 7.65 | 7.44 | -21 | 96 | 94 | -2 | | (iii) AAA (5-year) | 7.60 | 7.42 | -18 | 84 | 86 | 2 | | (iv) AA (3-year) | 8.43 | 8.27 | -16 | 174 | 177 | 3 | | (v) BBB- (3-year) | 12.08 | 11.93 | -15 | 539 | 543 | 4 | Note: Yields and spreads are computed as averages for the respective periods.
Sources: FIMMDA; and Bloomberg. |
 Money supply (M3) rose by 9.5 per cent (y-o-y) as on April 4, 2025 (11.4 per cent a year ago).15 Aggregate deposits with banks, accounting for around 86.5 per cent of M3, increased by 9.9 per cent (12.7 per cent a year ago). Scheduled commercial banks’ (SCBs’) credit growth moderated to 12.0 per cent as on April 4, 2025 (16.0 per cent a year ago) on account of unfavourable base effect, which offset the positive momentum (Chart IV.9). As on April 4, 2025, SCBs’ deposit growth (excluding the impact of the merger) decelerated to 10.4 per cent from 13.3 per cent a year ago (Chart IV.10).
SCBs’ incremental credit-deposit ratio increased to 89.1 per cent as on April 4, 2025 from a low of 80.7 per cent as on October 18, 2024. In response to the 50-bps cut in the policy repo rate since February 2025, banks have reduced their repo-linked EBLRs by a similar magnitude. The marginal cost of funds-based lending rate (MCLR) that have a longer reset period and are referenced to the cost of fund, may get adjusted with some lag. The weighted average lending rates (WALR) on outstanding rupee loans of scheduled commercial banks (SCBs) declined by 7 bps; however, it has increased for fresh rupee loans by 8 bps in February (Table IV.3). In case of deposits, the weighted average domestic term deposit rate (WADTDR) on fresh deposits moderated by 8 bps during the same period. 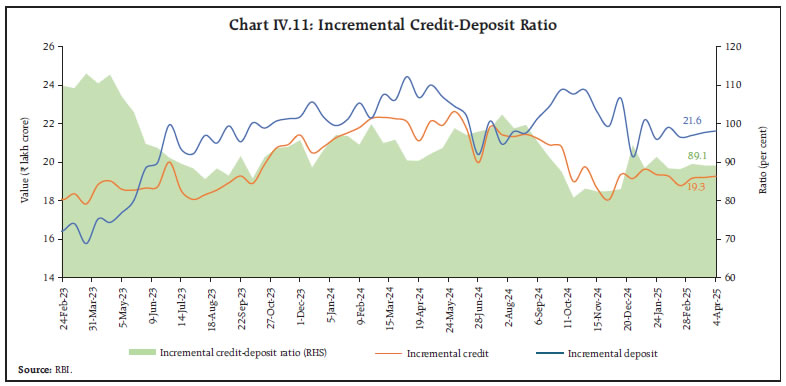
| Table IV.3: Transmission to Banks’ Deposit and Lending Rates | | (Basis points) | | | | Term Deposit Rates | Lending Rates | | Period | Repo Rate | WADTDR- Fresh Deposits | WADTDR- Outstanding Deposits | EBLR | 1-Yr. MCLR (Median) | WALR Fresh Rupee Loans | WALR- Outstanding Rupee Loans | | (1) | (2) | (3) | (4) | (5) | (6) | (7) | (8) | Easing Phase
Feb 2025 to Mar* 2025 | -25 | -8 | 0 | -25 | 0 | 8 | -7 | Tightening Period
May 2022 to Jan 2025 | +250 | 253 | 199 | 250 | 178 | 181 | 115 | Easing Phase
Feb 2019 to Mar 2022 | -250 | -259 | -188 | -250 | -155 | -232 | -150 | Notes: Data on EBLR pertain to 32 domestic banks.
*: Data on WADTDR and WALR pertain to February 2025.
WALR: Weighted Average Lending Rate; WADTDR: Weighted Average Domestic Term Deposit Rate;
MCLR: Marginal Cost of Funds-based Lending Rate; EBLR: External Benchmark-based Lending Rate.
Source: RBI. | The increase in WALR was higher in public sector banks (PSBs) as compared to private banks; however, in case of outstanding loans the transmission was higher in PSBs during February 2025 (Chart IV.12). In case of WADTDRs, both PSBs and foreign banks have reduced their fresh deposit rates. The Government of India reviewed the interest rates on various small savings instruments, which are linked to secondary market yields on G-secs of comparable maturities and kept it unchanged for Q1:2025-26.16 As a result, the rates on most of the instruments are now above the formula-based rates in the range 16-66 bps.17 In a rate easing cycle when deposit rates are expected to come down, higher small savings rates can be a potential source of concern for bank deposit growth. 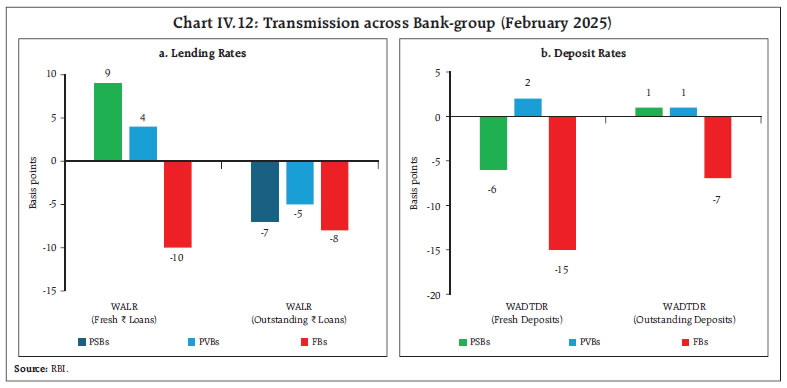
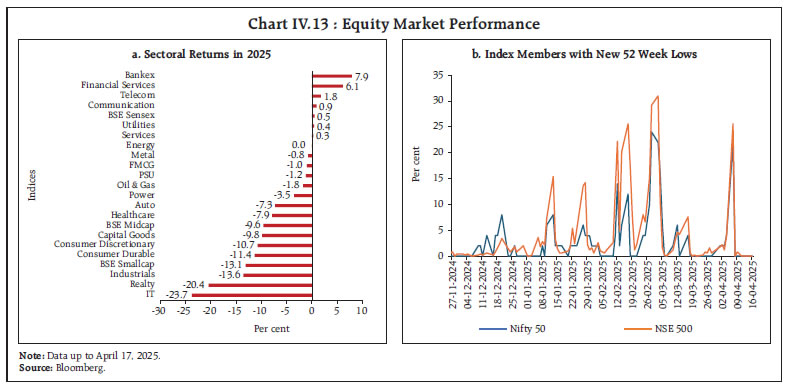 Indian equity markets recorded gains in the second half of March, aided by foreign portfolio investor (FPI) inflows, resilient economic activity and moderation in inflation. Equity markets, however, witnessed a sharp decline in early April, tracking losses in global markets emanating from the imposition of reciprocal tariffs by the United States. The sharp sell-off on April 7, effectively eroded the gains recorded in the latter half of March, as 22 per cent of the Nifty 50 constituents and 26 per cent of the NSE 500 stocks registered fresh 52-week lows on the day (Chart IV.13). This was also associated with heightened volatility as the India VIX recorded its highest single-day percentage surge on April 07, 2025 (since November 2007) [Chart IV.14]. Domestic equity markets subsequently rebounded, tracking global market gains after the US announced a pause in reciprocal tariffs. Financial sector stocks led the recovery, supported by a decline in domestic CPI inflation in March 2025. Uncertainty in both domestic and global equity markets has continued to weigh on resource mobilisation through equity issuances (Chart IV.15a). There was no issuance of mainboard IPOs in March 2025 — the first such instance since February 2023 (Chart IV.15b). An analysis of sectoral equity market indices compiled by the Centre for Monitoring Indian Economy (CMIE) indicates that sectors with a substantial export exposure to the US have remained highly volatile so far in April 2025 (Chart IV.16).
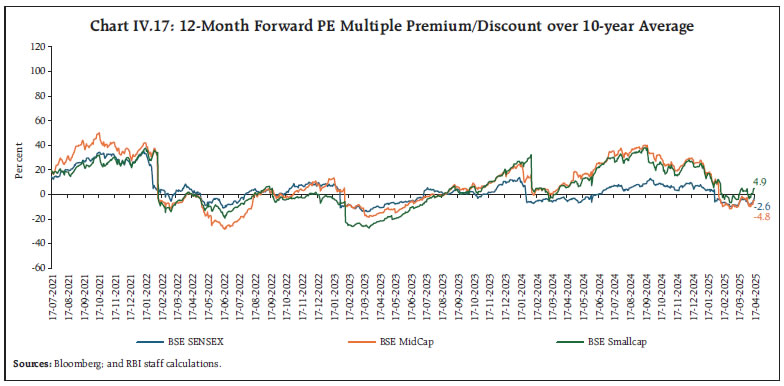
Indian equities have historically traded at a premium compared to other EMEs. An analysis of market valuation, measured by the premium/ discount relative to the 10-year average of forward price-to-earnings (PE) ratios across various indices, shows that forward PE ratios surged well above their 10-year averages in the early months of H2:2024-25. Following the correction in Indian equity markets since then, these ratios have now approached their long-term average, signalling a moderation in market valuations to more sustainable levels (Chart IV.17). 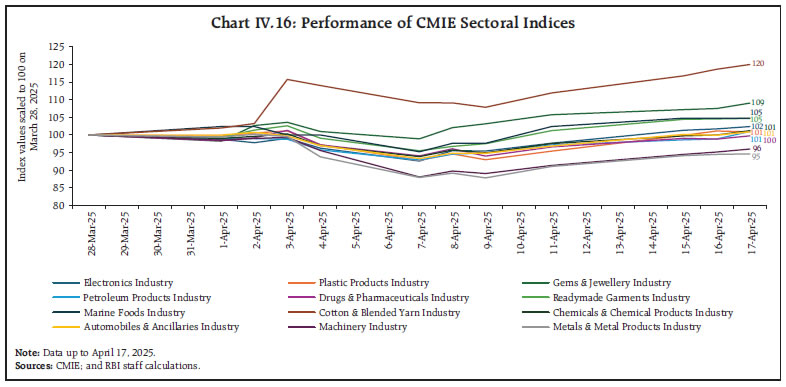
 Gross inward foreign direct investment (FDI) grew by 15.2 per cent (y-o-y) to US$ 75.1 billion during 2024-25 (April - February) [Chart IV.18a]. Singapore was the largest source of equity inflows with a share of 29.8 per cent, followed by Mauritius and the US. Manufacturing sector accounted for the highest share (24.1 per cent) of FDI inflows, followed by financials services and electricity. Net FDI declined to US$ 1.5 billion during this period owing to higher repatriation and outward FDI from India. Globally, the US remains the most favoured destination for inward FDI and is the second largest destination for overseas direct investment (ODI) from India in recent years (Chart IV.18b). Moreover, multinationals have been redirecting their investment plans to the US, influenced by recent policy announcements. 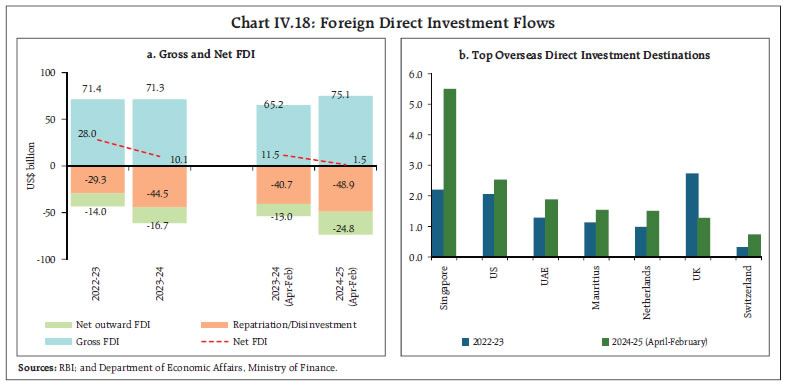
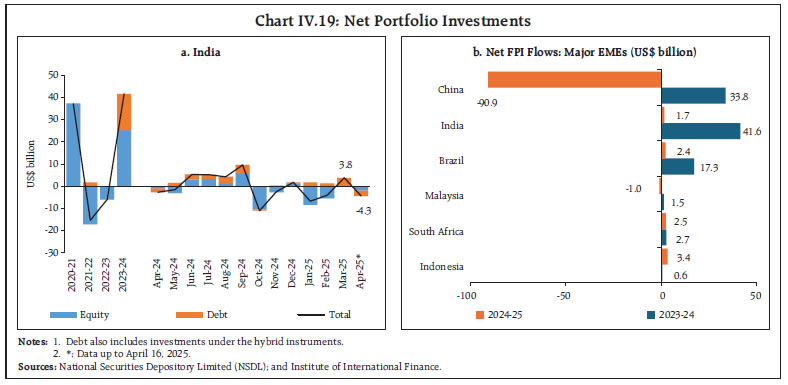 FPI flows witnessed a turnaround in March 2025 by recording inflows worth US$ 3.8 billion, driven mostly by the debt segment (US$ 3.6 billion) [Chart IV.19a]. Equity segment witnessed modest inflows of US$ 0.2 billion in March, reversing the trend of outflows seen over the previous two months. Debt FPI amounting to US$ 9.4 billion has flowed into government securities through the Fully Accessible Route (FAR) in 2024-25.18 Despite outflows in the equity segment during H2:2024-25 on rising risk-off sentiments amidst ongoing global trade uncertainties, net FPI flows remained positive at US$ 1.7 billion during 2024-25 but significantly lower than in the previous year (Chart IV.19b). The flow of non-resident deposits (NRD) witnessed an improvement in Q4:2024-25 compared to the previous quarter for SCBs (excluding Regional Rural Banks) [Chart IV.20]. For 2024-25, net inflows of NRDs remained positive across all sub-components, viz., Foreign Currency Non-Resident (Banks) (FCNR(B)), Non-Resident (External) Rupee Accounts (NR(E)RA) and Non-Resident Ordinary (NRO) accounts. On a cumulative basis, external commercial borrowing (ECB) registrations (US$ 50.1 billion) and disbursements (US$ 46.1 billion) during April 2024 - February 2025 were higher than those recorded during the same period last year by US$8.6 billion and US$13.4 billion, respectively. After adjusting for principal repayment of US$ 25.8 billion, net ECB inflows (US$ 20.3 billion) stood significantly higher during the current financial year — more than double the level recorded a year ago (Chart IV.21).
Nearly 44 per cent of total ECBs registered during April 2024-February 2025 were for capital expenditure, including on-lending/sub-lending (Chart IV.22). The overall cost of registered ECBs declined by 35 bps during the year, driven by a reduction in both the global benchmark interest rates - the secured overnight financing rate (SOFR) and the weighted average interest margin (WAIM) [Chart IV.23]. The Indian rupee (INR) appreciated by 0.5 per cent (m-o-m) during March 2025, supported by FPI inflows and year-end dollar receipts from inter-company borrowings; however, INR volatility rose driven by elevated global uncertainty (Chart IV.24).
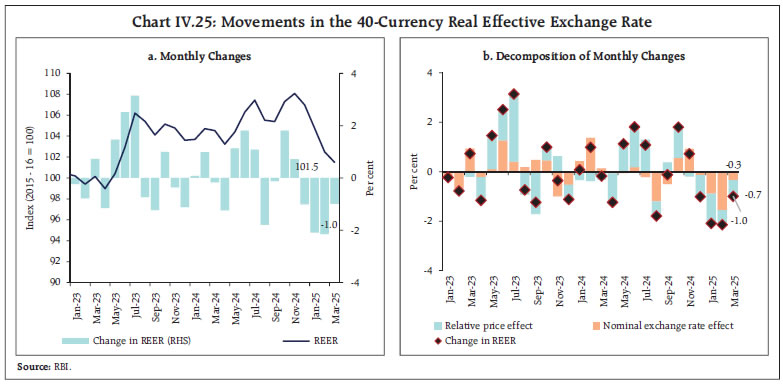
The INR depreciated by 1.0 per cent (m-o-m) in terms of the 40-currency real effective exchange rate (REER) in March 2025 due to depreciation of the INR in nominal effective terms and widening of India’s inflation differential with its major trading partners (Chart IV.25). As on April 11, 2025, India held foreign exchange reserves worth US$ 677.8 billion, sufficient for about 11 months of imports and 94 per cent of external debt outstanding at end-December 2024 (Chart IV.26a). At its current level, India holds the world’s fourth largest foreign exchange reserves (Chart IV.26b). India’s current account deficit (CAD) moderated to US$ 11.5 billion (1.1 per cent of GDP) in Q3:2024-25 from US$ 16.7 billion (1.8 per cent of GDP) in Q2:2024-25 but was higher than US$ 10.4 billion (1.1 per cent of GDP) in Q3:2023-24. Robust growth in business, computer, transportation and travel, services exports alongside higher remittance receipts cushioned the effect of a widening merchandise trade deficit. Net capital outflows of US$ 26.8 billion in Q3:2024-25 were driven mainly by outflows in FPI and FDI to India. CAD and net capital outflows led to a depletion of US$ 37.7 billion in foreign exchange reserves (on a BoP basis) during Q3 (Chart IV.27). 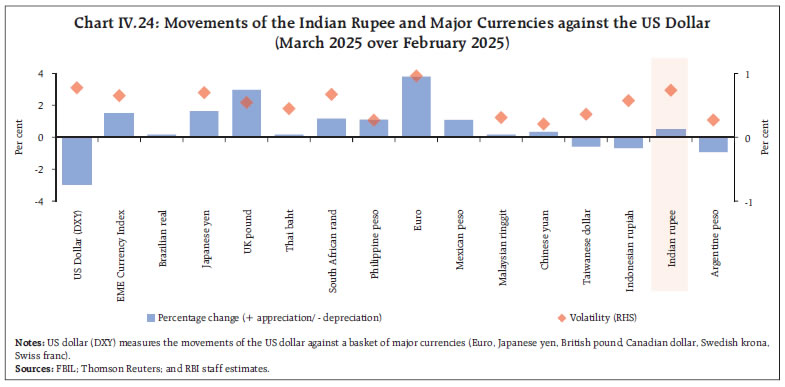
 India’s external debt rose to US$ 717.9 billion (19.1 per cent of GDP) at end-December 2024 from US$ 668.8 billion (18.5 per cent of GDP) at end-March 2024. Other external vulnerability indicators, however, witnessed an improvement during the same period, emphasising India’s external sector resilience amidst a challenging global environment (Chart IV.28).
India’s net international investment position (IIP) increased by US$ 11 billion during Q3:2024-25 to US$ 364.5 billion. While both the foreign assets of Indian residents and India’s foreign liabilities declined during the quarter, the ratio of international assets to international liabilities improved to 74.7 per cent in December 2024 from 73.1 per cent a year ago (Chart IV.29).
Payment Systems Digital transactions grew across different payment modes in March 2025, led by retail transactions through the Unified Payments Interface (UPI) and the Bharat Bill Payment System (BBPS) [Table IV.4]. Large-value transactions through the Real Time Gross Settlement (RTGS) posted a steady growth in volume and value. BBPS also continued to witness sustained growth in both volume and value, with March 2025 marking a continued upward trend, indicating a steady shift in consumer bill payment through digital platforms. UPI remains the cornerstone of India’s digital payments landscape, recording the second highest growth among major payment systems with 18.3 billion transactions in March 2025. A significant share of UPI transactions is spent on shopping, encompassing both lifestyle-related and essential purchases19. 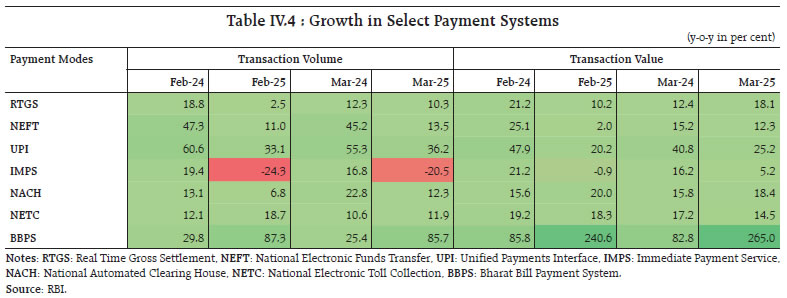 As part of its continued outreach to the payments and fintech sector, the Reserve Bank observed the 5th Digital Payments Awareness Week (DPAW) in March 2025.20 Held under the theme ‘India Pays Digitally’ and aligned with the ‘Har Payment Digital’ mission, the initiative aimed at enhancing public awareness. In its Statement on Developmental and Regulatory Policies of April 9, 2025, the Reserve Bank proposed that National Payments Corporation of India (NPCI) may revise UPI transaction limits for Person to Merchant (P2M) payments, based on evolving user needs. Certain P2M categories already allow higher limits of ₹2 lakh and ₹5 lakh. Banks will retain discretion to set internal limits within NPCI’s framework. Meanwhile, the Regulatory Sandbox will become ‘Theme Neutral’ and ‘On Tap’, enabling continuous testing of eligible FinTech innovations across categories. V. Conclusion In the near-term, global growth outlook remains downcast, as uncertainty surrounding tariffs and the individual policy responses of different countries could result in lower investments spending, subdued consumer confidence, and a slowdown in global trade. The long-term effects of these developments on the course of the global economy remain highly uncertain as there is still no clarity regarding the scope, timing and intensity of tariffs. Going forward, global financial conditions are likely to remain volatile and EMEs are vulnerable to feedback loops and spillovers which may lead to reigniting of global inflation. Decline in global commodity prices, however, could ease pressure on inflation in commodity importing countries, although currency pressures could partly offset such benefits. India’s strength to withstand these headwinds stem from its robust growth fostered by a strong macroeconomic framework and moderating inflation, with strong domestic engines of growth. The agricultural sector in India is poised to sustain its momentum, supported by bumper kharif and rabi harvest and higher summer sowing amidst comfortable reservoir position. Risks emanating from the rise in temperature above normal levels and likelihood of heatwaves in the current summer season (April - June), however, needs to be monitored. Industrial and services activity continue to remain resilient. Results of the survey conducted among representatives from industry associations, including several industry bodies, credit rating agencies, and banks reveal optimism in economic activity supported by moderating inflation, sustained upswing in rural consumption and recovery in urban consumption. Global uncertainties, however, act as downside risks to this outlook. Going forward, India is poised to benefit from supply chain realignments, diversified FDI sources, and engagement with global investors seeking resilience and scale, given its already established trade linkages. Moreover, India’s consistent strength in services exports and remittance inflows continues to provide a vital buffer for the current account. Calibrated policy support can help India turn global volatility into an opportunity and strengthen its position in the emerging world economic landscape.
Annex 1: Major Takeaways from the RBI’s Enterprise Surveys Capacity utilisation (CU) in the manufacturing sector increased by 120 bps while the seasonally adjusted CU increased by 60 bps in Q3:2024-25 (Chart A1). Manufacturers continued to report a positive outlook on CU for the ensuing quarters (Chart A2).
Manufacturers’ optimism on demand conditions registered a seasonal moderation for Q1:2025-26 but recorded an improvement for the ensuing quarters. Services and infrastructure firms continued to report a more optimistic outlook on demand conditions (Chart A3). Expectations on employment situation evolved largely in sync with the demand conditions (Chart A4).
Firms across the broad sectors remain optimistic about the overall business situation through Q3:2025-26 (Chart A5). Input cost pressures are likely to remain high for the services and the infrastructure sectors during Q1:2025-26; while the manufacturing sector expects some easing of cost pressures (Chart A6). Growth of selling prices and profit margins in Q1:2025-26 is likely to moderate for manufacturing enterprises, in line with the softer demand conditions. Services and infrastructure firms, however, expect improved growth in both selling prices and profit margins during the same period (Chart A7). Bankers’ optimism on loan demand moderated during Q1:2025-26 (Chart A8). Note: The ‘net response’ is calculated as the difference between the percentage of respondents reporting optimism and that reporting pessimism. The increase option (I) is an optimistic response for all parameters, except the cost related parameters, such as cost of raw materials, etc., where the decrease option (D) signifies optimism from the viewpoint of a respondent company.
|