by Satadru Das and Vidya Kamate^ This article analyses the evolving relationship between climate change measured using Climate Policy Uncertainty (CPU) index developed by Gavriilidis (2021) and global energy commodity prices, and its implication for India’s domestic inflation. Statistical tests using monthly data indicate that the relationship between CPU index and global energy commodity prices underwent a structural break around March 2017. While before March 2017, the relationship between the two variables was positive, it has since been negative. Empirical analysis using a Local Linear Projection (LLP) framework suggests that this change in dynamics between CPU and energy commodity prices has led to a countercyclical pass-through of global climate policy uncertainty to domestic prices in India in recent years. Introduction Traditional sources of energy such as fossil fuels have contributed to global economic expansion. The simultaneous adverse environmental consequences of continued fossil fuel usage have resulted in global policy concern towards the climate change phenomenon. Since the signing of the Paris Agreement in 2016 aiming to limit the increase of global temperature to well under 2 degree Celsius, a growing number of countries are drawing up roadmaps for voluntary emission reductions and other development strategies to attain the vision of “net zero emissions”. Therefore, global energy usage and energy commodity prices are intricately intertwined with uncertainties related to climate policy changes. In light of the aforementioned interlinkages, this paper analyses the impact of climate policy uncertainty on global energy prices and relatedly, on the ramifications of these dynamics for domestic inflation in India. The relationship between climate change and energy prices could be either positive or negative. Climate regulation induced uncertainty has been found to be positively related to firm investment in green energy driven by its desire to diminish its carbon footprint (Rodriguez Lopez et al., 2017). Investors move away from brown firms and switch to green firms in response to rising climate change worries which leads to underperformance of brown stocks vis-à-vis green stocks (Pástor et al., 2021, Bouri et al., 2022). In contrast, the real options approach to investment decisions under uncertainty dictates the agents to postpone their investments by increasing the option value of waiting to invest (Bernanke, 1983; Dixit et al., 1994). A number of studies have found empirical evidence of such investment postponement in green or low carbon technologies (Fuss et al., 2009; Blyth et al., 2007; Kettunen et al., 2011). The two opposing views with one arguing that uncertainty discourages firms from investing, while other suggesting that uncertainty encourages investment may have opposing implications for prices of energy commodities and therefore, calls for further empirical analysis. Climate transition risk related policies are likely to affect energy prices. Inflationary pressures can arise from the impact of climate policy uncertainty on investment demand and inflation expectations (Adediran et al., 2023). Physical risks related to climate change can increase inflation volatility regarding food, housing and energy prices which can have heterogenous effects on inflation (RBI, 2023). Therefore, it becomes important to analyse the pass-through of energy price changes caused by climate policy uncertainty to domestic inflation. With this backdrop, the rest of the article is organised as follows. Section II provides a brief overview of the literature analysing the relationship between climate change policy and energy prices. Section III presents a detailed description of the choice of data and variables used in the analysis. Section IV and V discuss the methodology and main empirical results obtained in the paper. Section VI concludes with some key takeaways and policy suggestions. II. Literature Review Extant literature has analysed various aspects of the relationship between climate change and oil industry. Climate change policies have the potential to alter the risk premiums for oil sector through their impact on transition risks and relative costs of crude oil usage and renewable energy consumption (Diaz-Rainey et al., 2021). Fossil fuel firms face relatively larger bank borrowing costs as compared to non-fossil fuel firms due to higher uncertainty (Delis et al., 2019). The financial market impact of climate change on carbon-intensive industries has been the subject of numerous studies. Using data from prediction markets, Meng (2017) analyse how changes in likelihood of carbon regulation is measured by the stock market. Schlenker and Taylor (2021) highlight the impact of expectations of future climate policies on the profitability of the energy industries. Pastor et al. (2022) attribute the high performance of green bonds to strong increases in environmental concerns and not to high expected returns. Similar conclusion is arrived at in Ardia et al. (2023) using data for S&P 500 companies. Bolton and Kacperczyk (2021) analyse the cross section of US stock returns and find that stocks of firms with higher carbon dioxide emissions earn higher returns highlighting the increased compensation demanded by investors for being exposed to carbon emission risk. There is no single instrument that is able to capture climate change in its full dimensionality. To overcome this challenge, Gavriilidis (2021) developed a Climate Policy Uncertainty (CPU) index. The CPU index not only accounts for the outlook change on climate but also provides signals relating to transition risks to the energy sector. There is a growing literature analysing the relationship of the index with various economic indicators. Bouri et al. (2022) find that difference in performance of green versus brown energy stocks is driven by climate policy uncertainty. Treepongkaruna et al. (2023) show that the risk-adjusted future returns of stocks with low exposure to CPU are higher than those with high CPU exposure and thus provide evidence of CPU being priced in cross-section of individual stocks. He and Yang (2022) find strong in and out of sample stock market predictability of oil industry using CPU index. Ren et al. (2022) analyse the bidirectional causality between CPU and traditional energy and green energy markets. Zhou et al. (2023) developed a time varying parameter vector autoregressive model with stochastic volatility (TVP-SV-VAR) to investigate the relationship between climate policy uncertainty, oil prices, and renewable energy consumption. Dai and Zhang (2023) find that CPU increases insolvency risk in commercial banks. Tian et al. (2022) highlight the asymmetric effects of CPU on green bond prices in US, Europe and China. The pass-through effect of CPU index on domestic prices is relatively underexplored and this article fills that gap in the context of India. III. Data Any analysis of the impact of climate change on economic outcomes would require an adequate measure of climate change that is able to capture all aspects of the climate system consisting of atmosphere, land surface, snow and ice, oceans and other bodies of water, and living things. Given that India is a price taker in global energy markets, an appropriate measure could be the CPU index pertaining to global climate policy. The CPU Index has been used as a benchmark for global climate risk in analysis in the context of other developing economies (Ren et al., 2022; Dai and Zhang, 2023). Another advantage is that as compared to other climate change variables, CPU index is available at a higher frequency (monthly). The construction of CPU index is based on the methodology outlined in Baker et al. (2016). In particular, eight leading US newspapers were searched for keywords relating to climate change uncertainty and average of the standardised scaled number of relevant articles was considered to construct the index1. The monthly energy price index data is obtained from World Bank Pink Sheet commodity markets data. The energy index comprises of a weighted price index of coal, crude oil and natural gas. The sample period used in the analysis is January 1991 – October 2022. The data on WPI is obtained from CEIC and a consistent time series from January 1991 to October 2022 is obtained through splicing given the base year changes in 1993-94, 2004-2005 and 2011-2012. The historical series has been constructed by using the latest series as the benchmark. All the three variables are de-seasonalized, log-transformed and detrended using a Baxter King filter and cycles are extracted. The detrending leads to the loss of observations of few months in the beginning and the end of the sample, and the final sample consists of the period between May 1991 and May 2022. All the empirical analysis in the forthcoming sections is conducted on the extracted cycles of the series. IV. Methodology and Results The relationship between CPU, oil price and renewable energy consumption is dynamic and time varying (Zhou et al., 2023). As has been alluded to earlier, the relationship between CPU and energy prices could be either positive or negative with one view arguing that climate-related uncertainty discourages firms from making investment in green energy while the other view provides support for increased investment in cleaner energy in response to heightened climate-related concerns. Consequently, the price of conventional energy may also be impacted in either direction due to CPU. Lower/higher investment in greener energy may imply delayed/faster transition to greener energy and that may increase/decrease prices of energy commodities like oil, natural gas, and coal. It is also possible that the relationship is evolving and changing with time depending on the climate policy related discourse. Therefore, in order to analyse the dynamic relationship between CPU and energy price index, a supremum Wald test was conducted to identify the presence of structural breaks, if any. The results of the test highlight a structural break around March 2017 (Annex Table A1). A scatter plot between the two variables in the two samples also confirms the structural break and the change in the relationship. While the pre-March 2017 relationship between the variables is positive, the post-2017 relationship is negative (Chart 1). The change in relationship is robust to winsorising the data and, therefore, is not driven by a few outlier observations. 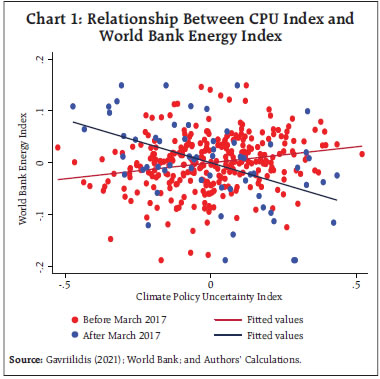 The results are consistent with extant empirical evidence that suggests a time-varying dynamic relationship between CPU index and energy prices. Zhou et al. (2023) shows that the impact of CPU on oil prices is heterogeneous and dynamic. Using time-varying Granger tests, Ren et al. (2023) find that the causal relationship between CPU and energy prices rises significantly in the aftermath of extreme climate events or major climate-related policy changes. One potential explanation for the change in relationship from positive to negative could be the increased global climate change policy effort post the Paris Agreement that became effective in November 2016. The Paris Agreement is a landmark international accord that aims to reduce global greenhouse gas emissions to limit the global temperature increase in this century to 2 degrees Celsius and pursuing the means to limit the increase to 1.5 degrees. Under the agreement, all major emitting countries made commitments to cut their climate pollution. Post the signing of the Paris Agreement, many countries have issued detailed Nationally Determined Contributions (NDCs) that outline their respective climate action plan to cut emissions and adapt to climate impacts. Prior to the Paris Agreement, the uncertainty in climate policy may have been regarding the likelihood of green transition. If there was an increase in uncertainty, it may have suggested that the duration of a transition will either be postponed or remain unchanged. This may have led to withholding of investment in green projects and longer usage of traditional sources of energy. Post 2016, climate policy may have changed to one of a faster than previously anticipated transition to net zero. In the present scenario, any increase in uncertainty may be interpreted as to whether the transition timeframe will be expedited or remain as anticipated. This may foster increased impetus towards green energy investments and a bearish outlook for the conventional energy sources. As a result, the relationship between energy price index and climate policy uncertainty has moved from being pro-cyclical to counter-cyclical. This change in relationship between the two and its implications for India is formally analysed in the following section. V. Impact on the Indian Economy of the Evolving Dynamics of CPU and Energy Prices The analysis so far has indicated that the relationship between CPU index and Energy index underwent a structural change and went from positive to negative post March 2017. Next, a series of econometric models are estimated using three variables for the two subsamples to determine if the change in this relationship affects the Indian economy. The three variables in consideration are CPU Index, Energy Commodity Price Index, and India’s headline Wholesale Price Index (WPI). We estimate a local linear projection (LLP) model of the following form 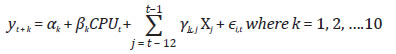 The unit of analysis is observed value of the dependent variable in a month. The dependent variable is the CPU, the global Energy Index or the WPI. To generate the impulse response function, we need to measure the impact of a Climate Policy Shock on the dependent variable at various subsequent time horizons. Accordingly, k-number of separate regressions with the k-leads of dependent variable are run, where k=0, 1,…,10 months. The main explanatory variable is the contemporaneous cycle in CPU index. Control variables include up to twelve lags of the CPU index, and the dependent variable. The impulse response functions show that prior to March 2017, the relationship between CPU Index and WPI was significant with CPU increase (decrease) resulting in WPI increase (decrease). However, the response of Energy Index and WPI to CPU has reversed since March 2017. While it was procyclical pre-March 2017 (Chart 2), it has become countercyclical since then (Chart 3). Post March 2017, there is a negative effect of a positive CPU shock on energy prices and WPI. Alternative econometric models were estimated to check for the robustness of the results. A VARX model with cycles of CPU Index used as an exogenous shock and an SVAR model with Cholesky ordering both produce qualitatively similar results. Additionally, an indicator of global demand – the OECD composite economic indicator for G20 economies, was introduced in the VARX and SVAR models. The results do not differ significantly from the models without the aforementioned demand indicator (Annex Charts A2-A5).
VI. Conclusion Sustained use of fossil fuels to meet growing energy needs of economic development of the world has resulted in not just depletion of reserves of traditional sources of energy but also a rapid and unpredictable slew of extreme climate events and a trend increase in global temperatures. This has resulted in global calls for climate-related concerns and spurred many nations across the world into action on developing and adhering to plans of transitioning to a greener economy. In this context, this paper analyses the relationship between climate policy uncertainty using a CPU index and energy commodity prices. The relationship between CPU index and energy commodity index is found to be time-varying. The relationship that was positive underwent a structural break around March 2017 post which it turned negative. These changed dynamics have also resulted in differing evolving dynamics of the impact of climate policy uncertainty on WPI in India. The conclusions have important policy implications. First, the impact on energy prices of climate policies should be taken into account while formulating policies relating to green energy transition. Second, while climate policy may have an impact on the macroeconomy of India through various other channels, the channel of pass-through of policy uncertainty to domestic WPI via brown energy prices has undergone a significant change. In the medium term, India may benefit from heightened global policy actions as these seem to have a negative effect on global energy prices. However, the relationship between these variables is continuously evolving and needs to be regularly monitored. The current analysis considers the impact of CPU on energy index, as a whole. The heterogeneity of impact of CPU on prices of different types of energy sources could be a potential direction for future research. References Adediran, I. A., Isah, K. O., Ogbonna, A. E., & Badmus, S. K. (2023). A global analysis of the macroeconomic effects of climate change. Asian Economics Letters, 4 Ardia, D., Bluteau, K., Boudt, K., & Inghelbrecht, K. (2023). Climate change concerns and the performance of green vs. brown stocks. Management Science, 69(12), 7607-7632. Baker, S. R., Bloom, N., & Davis, S. J. (2016). Measuring economic policy uncertainty. The Quarterly Journal of Economics, 131(4), 1593-1636. Bernanke, B. S. (1983). Irreversibility, uncertainty, and cyclical investment. The Quarterly Journal of Economics, 98(1), 85-106. Bolton, P., & Kacperczyk, M. (2021). Do investors care about carbon risk?. Journal of Financial Economics, 142(2), 517-549. Bouri, E., Iqbal, N., & Klein, T. (2022). Climate policy uncertainty and the price dynamics of green and brown energy stocks. Finance Research Letters, 47, 102740. Blyth, W., Bradley, R., Bunn, D., Clarke, C., Wilson, T., & Yang, M. (2007). Investment risks under uncertain climate change policy. Energy Policy, 35(11), 5766- 5773. Delis, M. D., De Greiff, K., & Ongena, S. (2019). Being stranded with fossil fuel reserves? Climate policy risk and the pricing of bank loans. Climate Policy Risk and the Pricing of Bank loans (September 10, 2019). EBRD Working Paper, (231). Dixit, R. K., Dixit, A. K., & Pindyck, R. S. (1994). Investment under uncertainty. Princeton university press. Gavriilidis, K. (2021). Measuring climate policy uncertainty. Available at SSRN 3847388. Fuss, S., Johansson, D. J., Szolgayova, J., & Obersteiner, M. (2009). Impact of climate policy uncertainty on the adoption of electricity generating technologies. Energy Policy, 37(2), 733-743. Dai, Z., & Zhang, X. (2023). Climate policy uncertainty and risks taken by the bank: evidence from China. International Review of Financial Analysis, 87, 102579. Diaz-Rainey, I., Gehricke, S. A., Roberts, H., & Zhang, R. (2021). Trump vs. Paris: The impact of climate policy on US listed oil and gas firm returns and volatility. International Review of Financial Analysis, 76, 101746. He, M., & Zhang, Y. (2022). Climate policy uncertainty and the stock return predictability of the oil industry. Journal of International Financial Markets, Institutions and Money, 81, 101675. Kettunen, J., Bunn, D. W., & Blyth, W. (2011). Investment propensities under carbon policy uncertainty. The Energy Journal, 32(1). Lopez, J. M. R., Sakhel, A., & Busch, T. (2017). Corporate investments and environmental regulation: The role of regulatory uncertainty, regulation-induced uncertainty, and investment history. European Management Journal, 35(1), 91-101. Meng, K. C. (2017). Using a free permit rule to forecast the marginal abatement cost of proposed climate policy. American Economic Review, 107(3), 748-784. Pástor, Ľ., Stambaugh, R. F., & Taylor, L. A. (2021). Sustainable investing in equilibrium. Journal of Financial Economics, 142(2), 550-571. Pástor, Ľ., Stambaugh, R. F., & Taylor, L. A. (2022). Dissecting green returns. Journal of Financial Economics, 146(2), 403-424. RBI (2023), Report on Currency and Finance 2022-23, Towards a Greener Cleaner India. Ren, X., Zhang, X., Yan, C., & Gozgor, G. (2022). Climate policy uncertainty and firm-level total factor productivity: Evidence from China. Energy Economics, 113, 106209. Ren, X., Li, J., He, F., & Lucey, B. (2023). Impact of climate policy uncertainty on traditional energy and green markets: Evidence from time-varying granger tests. Renewable and Sustainable Energy Reviews, 173, 113058. Schlenker, W., & Taylor, C. A. (2021). Market expectations of a warming climate. Journal of financial economics, 142(2), 627-640. Tian, H., Long, S., & Li, Z. (2022). Asymmetric effects of climate policy uncertainty, infectious diseases-related uncertainty, crude oil volatility, and geopolitical risks on green bond prices. Finance Research Letters, 48, 103008. Treepongkaruna, S., Chan, K. F., & Malik, I. (2023). Climate policy uncertainty and the cross-section of stock returns. Finance Research Letters, 103837. Zhou, D., Siddik, A. B., Guo, L., & Li, H. (2023). Dynamic relationship among climate policy uncertainty, oil price and renewable energy consumption—findings from TVP-SV-VAR approach. Renewable Energy, 204, 722-732.
Annexure | Table A1: Supremum Wald Test for Structural Break in Relationship between Energy Index and CPU | | | Energy Index | | CPU Index | 0.0065 | | | (0.0173) | | Constant | -0.0001 | | | (0.0030) | | N | 372 | | *p < 0.1, **p < 0.05, ***p < 0.01. |
Full sample:
Estimated break date:
Ho: | 1991m5 - 2022m4
2017m3
No structural break | | | Test | Statistic | p-value | | SWALD | 31.5702 | 0.0000 | Exogenous variables:
Coefficients included in test: | CPU Index
CPU Index; Constant | | Results from Alternative Specifications (includes OECD composite economic indicator for G20 economies) 1. VARX model with cycles of CPU index used as exogenous shock
Results are similar to those obtained using LLP although the coefficients of the post 2017 period are less significant statistically on account of widening confidence intervals. 2. SVAR with Cholesky Ordering A structural VAR using three variables, namely, CPU Index, Energy Commodity Price Index and WPI is estimated. The structural form of the regressions is as follows: Where yt is a nx1 vector of variables, A is a nx1 vector of constants, Bs is a nxn matrix of coefficients where s =1, 2, 3….p are number of lags, and ut is a nx1 vector of structural disturbances. We assume Cholesky decomposition for identification. Therefore, the identification scheme is the following: The results from SVAR model are similar to the ones obtained from LLP but with lower statistical significance on account of wider confidence intervals.
|