Persistent trade frictions, heightened policy uncertainty, and weak consumer sentiment continue to create headwinds for global growth. Amidst these challenges, the Indian economy exhibited resilience. Various high frequency indicators of industrial and services sectors sustained their momentum in April. A bumper rabi harvest and higher acreage for summer crops, coupled with favourable southwest monsoon forecasts for 2025, augur well for the agriculture sector. Headline CPI inflation fell for the sixth consecutive month to its lowest since July 2019, primarily driven by the sustained easing in food prices. Domestic financial market sentiments, which remained on edge in April, witnessed a turnaround since the third week of May. Introduction Global growth continues to face headwinds, with persistent trade frictions, heightened policy uncertainty, and weak consumer sentiment weighing on the outlook. Though the tariff pause has provided a temporary let off, the global outlook remains fragile. In its April 2025 World Economic Outlook, the International Monetary Fund (IMF) trimmed global growth forecasts for 2025 and 2026 from its January projections citing escalating trade tensions and policy uncertainty. Growth in emerging market and developing economies (EMDEs) is also projected to decelerate with emerging and developing Asia significantly impacted by the tariffs. Going forward, financial turbulence is seen as a major downside risk to growth projections.1 The latest Purchasing Managers’ Index (PMI) for the month of April 2025 underline these challenges. S&P Global manufacturing PMI contracted in its latest release from being in expansionary zone in March, reflecting sluggishness in new orders and exports. Barring the post-pandemic years, April’s drop in exports was the largest since October 2012.2 China’s official manufacturing PMI for April also contracted, falling short of expectations. In the US, GDP shrank in the first quarter largely due to the frontloading of imports ahead of anticipated tariff hikes. Going ahead, if a more protectionist trade environment emerges, it is likely to lead to a sharp contraction in trade volumes. In this inherently fluid situation, major corporates have also started withholding profit guidance for the year3. Globally, the progress on the last mile of disinflation seems to have stalled4. While headline inflation in advanced economies (AEs) has moved closer to targets, core inflation has been slower to fall, particularly on account of persistent services inflation. Inflation in emerging market economies (EMEs) displayed a mixed but generally easing trend. Global commodity markets are beginning to enter a new phase. Multiple risks – arising from trade and geo-politics, fall in demand and weather-related supply shocks – could potentially trigger in a period of significant volatility in commodity prices5. Energy and industrial metal prices have been trending lower, with crude oil prices forecasted to decline during 2025 and 2026.6 With looming uncertainty about aggregate demand conditions and in the absence of supply shocks, global commodity prices could fall to levels not seen since 20207. Financial markets remained volatile reflecting heightened uncertainties, particularly surrounding trade policy developments. Global equity markets saw enhanced turbulence following the announcement of new tariff measures, which weighed on investor sentiment and triggered broad-based sell-offs. Reflecting increased market volatility, the CBOE VIX registered a sharp jump in April8. However, a subsequent easing in trade tensions and a pause in further tariff escalation spurred a sharp rebound in equity markets and significantly eased volatility. The US dollar faced depreciating pressures amidst rising trade policy uncertainty and ebbing investor confidence, with other AE currencies witnessing notable appreciation. In an uncertain and volatile macro-financial environment, monetary policies have turned cautious with many central banks maintaining status quo or resorting to pre-emptive but measured easing of policy rates to cushion the impact of trade disruptions on growth. In export intensive AEs such as Switzerland and Japan, the sharp appreciation of domestic currencies on safe haven flows are further complicating the central bank’s management of domestic growth inflation trade-offs. In an event of sharp deterioration in global growth prospects, the space for large fiscal policy interventions is limited, with economies continuing to grapple with the legacy of high debt levels9. The Indian economy is exhibiting resilience despite the high trade and tariff-related uncertainty. Various high frequency indicators of industrial and services sectors sustained their momentum in April. Record goods and services tax (GST) collections in April also reflect the underlying resilience of the economy.10 A bumper rabi harvest and higher acreage for summer crops also augur well for agriculture sector. During April 2025, India’s external sector remained resilient notwithstanding global uncertainty impacting supply chains. Merchandise exports growth remained robust in April despite the global trade policy uncertainties. Furthermore, services exports also remained strong in March. The sequential downturn in headline CPI inflation that started in November 2024 continued into April 2025, for the sixth consecutive month. Headline inflation in April was the lowest since July 2019. The benign headline inflation movements were primarily driven by the substantial easing of food prices seen since last winter. Core inflation (CPI excluding food and fuel inflation) movements continued to be disproportionately impacted by the highly elevated gold prices. Excluding its impact, underlying inflation pressures too remained muted. The optimism on domestic growth, along with the news of a temporary freeze on tariff measures by the US, led to a significant recovery of financial markets by mid-April. The domestic equity market, which declined initially in response to the tariff announcements by the US, gained momentum in the second half of April in the wake of robust corporate earnings reports for Q4:2024-25 by some banking and financial sector companies. Net investments by foreign portfolio investors (FPIs) also rebounded in the second half of the month on the back of improving domestic market sentiments. Reflecting these, the Indian rupee moved within a narrow range and exhibited lower volatility compared to peer economies. Nevertheless, the escalation of tensions between India and Pakistan rendered financial markets volatile with India VIX seeing a substantial jump11. Domestic financial markets sentiments witnessed a turnaround thereafter amidst easing India-Pakistan tensions, an improvement in the global trade scenario, and softer domestic inflation. Amidst uncertainties on global capital flows, it is noteworthy that domestic institutional investors (DIIs) have surpassed FPIs in ownership of Nifty-500 companies in March 2025. This marks a structural shift in Indian equity markets as DIIs, including mutual funds and insurance companies, increasingly offset the volatility caused by FPIs, with retail and systematic investment plan (SIP) flows providing a steady long-term investment base.12 The measures undertaken by the Reserve Bank since January 2025 have significantly eased liquidity conditions and calmed financial markets. System liquidity has remained in surplus since end-March 2025. While day-to-day liquidity position of banks continued to remain skewed, the Reserve Bank’s liquidity augmenting measures have resulted in a gradual increase in durable liquidity. The consequent moderation in money market rates and bond yields has led to relatively more benign financial conditions. Domestic bond yields steadily declined to multi-year lows, aided by back-to-back policy rate cuts in February and April 2025 and the liquidity measures that augmented durable liquidity. The overall monetary and credit conditions are evolving in sync with the Reserve Bank’s extant monetary policy stance of ensuring that inflation progressively aligns with the target, while supporting growth. Set against this backdrop, the remainder of the article is structured into four sections. Section II covers the rapidly evolving developments in the global economy. Section III provides an assessment of domestic macroeconomic conditions. Section IV encapsulates financial conditions in India, while the last Section presents the concluding observations. II. Global Setting The intensifying trade tensions and policy uncertainties following the sweeping increase in trade tariffs by the United States (US) in early April are weighing on global economic growth prospects. In the April 2025 World Economic Outlook, the IMF revised downwards its global GDP growth forecast for 2025 by 50 bps to 2.8 per cent and for 2026 by 30 bps to 3.0 per cent, from its January 2025 projections. Growth in advanced economies (AEs) is now expected at 1.4 per cent in 2025 (down 50 bps), with the US growth revised sharply downwards to 1.8 per cent (a 90 bps cut). Emerging market and developing economies (EMDEs) are projected to grow at 3.7 per cent, down from the earlier forecast of 4.2 per cent (Table II.1). Growth projection for emerging and developing Asia was also revised downwards, particularly for ASEAN and China. Owing to a significant downgrade for growth in Mexico, growth projections for Latin America and the Caribbean were also revised downwards. For Sub-Saharan Africa, growth projections have been revised downwards, albeit at a lesser magnitude. While policy uncertainty has intensified, supply side pressures on the global economy are showing signs of relenting. The Global Supply Chain Pressure Index (GSCPI) continued to decline below the historical average levels in April 2025 on account of lower transportation costs and delivery times (Chart II.1a). The geopolitical risk indicator increased in April 2025, following a sequential moderation since February, primarily due to rising trade protectionism and ongoing tensions in the Middle East (Chart II.1b). | Table II.1: GDP Growth Projections – Select AEs and EMDEs | | Projection for | 2025 | 2026 | | Month of Projection | April 2025 | January 2025 | April 2025 | January 2025 | | World | 2.8 | 3.3 | 3.0 | 3.3 | | Advanced Economies | 1.4 | 1.9 | 1.5 | 1.8 | | US | 1.8 | 2.7 | 1.7 | 2.1 | | UK | 1.1 | 1.6 | 1.4 | 1.5 | | Euro area | 0.8 | 1.0 | 1.2 | 1.4 | | Japan | 0.6 | 1.1 | 0.6 | 0.8 | | Emerging Market and Developing Economies | 3.7 | 4.2 | 3.9 | 4.3 | | Russia | 1.5 | 1.4 | 0.9 | 1.2 | | Emerging and Developing Asia | 4.5 | 5.1 | 4.6 | 5.1 | | India# | 6.2 | 6.5 | 6.3 | 6.5 | | China | 4.0 | 4.6 | 4.0 | 4.5 | | Latin America and the Caribbean | 2.0 | 2.5 | 2.4 | 2.7 | | Mexico | -0.3 | 1.4 | 1.4 | 2.0 | | Brazil | 2.0 | 2.2 | 2.0 | 2.2 | | Middle East and North Africa | 2.6 | 3.5 | 3.4 | 3.9 | | Sub-Saharan Africa | 3.8 | 4.2 | 4.2 | 4.2 | | South Africa | 1.0 | 1.5 | 1.3 | 1.6 | Note: #: India’s data is on a fiscal year basis, while for all other countries it is for calendar years.
Source: IMF. | Consumer sentiments worsened in AEs with an across-the-board decline in April 2025 while EMEs showed greater resilience, with India and Brazil registering slight improvement in consumer sentiments (Chart II.2a and II.2b). Financial conditions continued to tighten further across major AEs and EMEs, except India (Chart II.2c and II.2d). The global composite Purchasing Managers’ Index (PMI) growth slowed to a 17-month low in April 2025, as services sector activity decelerated sharply while manufacturing output remained sluggish (Chart II.3a). Global manufacturing PMI contracted for the first time in four months on account of declining new orders and worsening global trade. Even though the global services PMI remained in expansionary territory, its growth slowed due to weaker new business inflows and a decline in export demand. Across regions, India continued to be an outlier with robust PMI readings while Canada continued to register a sharp contraction (Chart II.3b).
The composite PMI for new export orders contracted substantially in April 2025, with orders in both manufacturing and services moving into contractionary territory, reversing the trend seen in March 2025 (Chart II.4a). In April 2025, new export orders contracted for all major economies, barring India (Chart II.4b). As indicated by the Bloomberg Commodity Index, global commodity prices declined by 5.1 per cent in April driven by lower energy and base metal prices (Chart II.5a). Food prices13 edged up by 1.0 per cent (m-o-m) in April, primarily driven by the increase in prices of meat, dairy and cereals, which was partially offset by moderation in sugar and vegetable oil prices (Chart II.5b). Crude oil prices declined steeply by 18.1 per cent in April (m-o-m) primarily on global demand concerns and increased output from OPEC+. Subsequently, prices rebounded by 4.5 per cent in May (up to May 19), supported by renewed demand hopes after a temporary trade agreement between the US and China (Chart II.5c). Base metal prices also dropped sharply in April, as tariff announcements dampened the global economic outlook. Prices, however, saw a recovery in the third week of May as trade sentiment improved following a de-escalation in the tariff war. Gold prices remained elevated in April, bolstered by safe-haven demand amidst rising trade uncertainties, but the trend reversed in May as market concerns eased (Chart II.5d). Headline inflation remains above target in many economies, and inflation expectations now exceed central bank targets in most AEs as well as in EMEs14. In the US, CPI inflation softened to 2.3 per cent (y-o-y) in April 2025 from 2.4 per cent in March. Inflation, in terms of the personal consumption expenditure (PCE) deflator, declined to 2.3 per cent in March from 2.7 per cent in February. Headline inflation in the Euro area remained unchanged at 2.2 per cent in April. Inflation in the UK and Japan also softened from that of February by 20 bps and 10 bps to 2.6 per cent and 3.6 per cent, respectively, in March (Chart II.6a). Among EMEs, CPI inflation in Brazil remained elevated but stable in April, whereas China remained in deflation. Inflation moderated in Russia in April, while it moderated in South Africa in March (Chart II.6b). Core inflation remained above the headline across most AEs. 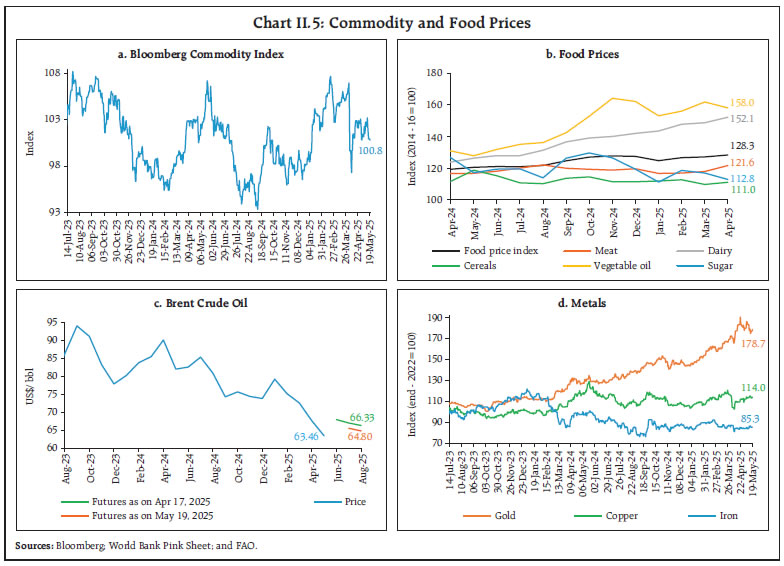
 Global equity markets witnessed heightened volatility in early April, with the announcement of sweeping tariffs on April 2 triggering a sharp sell-off worldwide. However, sentiments improved later in the month and equity markets registered a strong recovery following the announcement of a 90-day pause on reciprocal US tariffs on April 9 and with major US tech companies reporting strong earnings. This rebound more than offset the initial losses, with the MSCI World Equity Index ending the month with a modest gain of 0.8 per cent. The rally strengthened further in the third week of May, with the index rising by 5.9 per cent (as of May 19), fully recouping the losses triggered by the April 2 tariff announcement, driven by growing optimism over potential new bilateral trade deals with the US (Chart II.7a). Yields on the US government securities declined in April, with the 10-year treasury yield falling by 4 bps, as safe-haven demand driven by tariff war uncertainties outweighed intermittent upticks during the month (Chart II.7b). The US dollar index (DXY) depreciated by 4.6 per cent in April amidst weaker-than-expected GDP data in Q1:2025 and deteriorating consumer sentiment. However, the trend reversed in May for both US Treasury yields and the dollar, with the 10-year yield rising by 29 basis points and the dollar strengthening by 1.0 per cent (till May 19), as investor sentiments improved in view of stronger-than-expected non-farm payroll data and US-China trade deal. Concomitantly, the MSCI currency index for EMEs increased in May with equity markets recording inflows (Chart II.7c and II.7d). 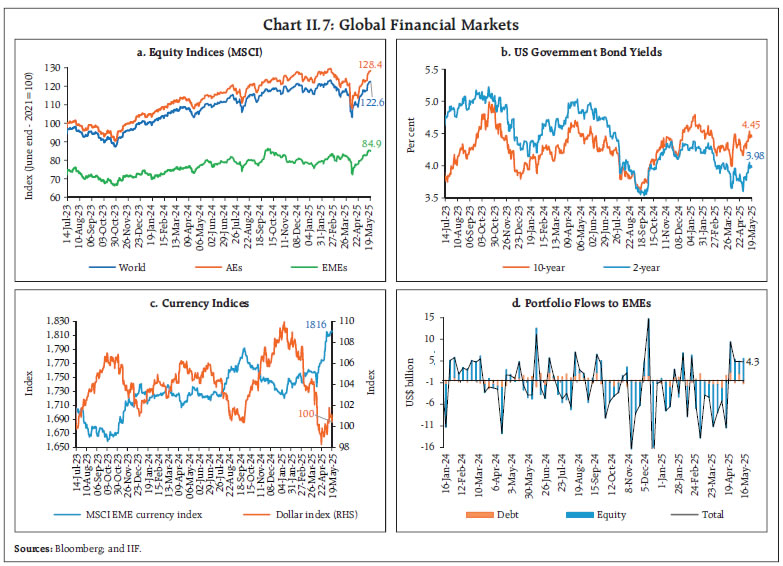
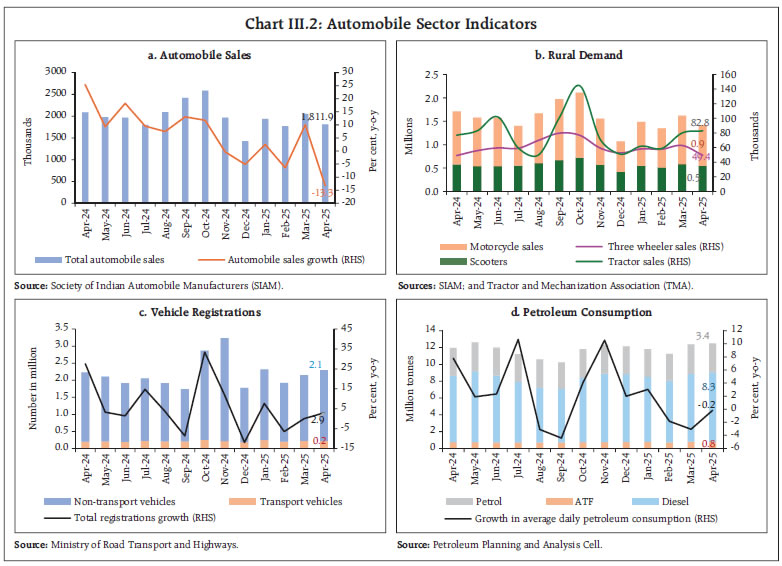
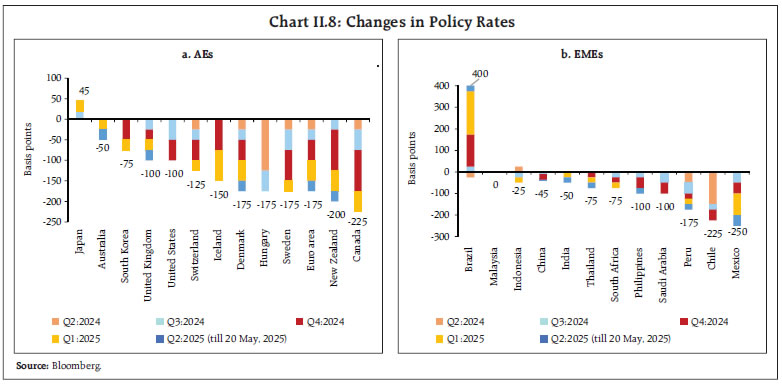 With the outlook being clouded by considerable uncertainties, central banks maintained a cautious monetary policy approach, with most pausing on rate cuts. Among AE central banks, Canada, South Korea and Israel maintained their key rates while Euro area and New Zealand reduced their benchmark rates by 25 bps in April. The US, Japan, Norway, and Sweden held rates steady, whereas the UK, Australia and Czech Republic reduced their policy rates by 25 basis points in their May meetings (Chart II.8a). Among EME central banks, Russia, Chile, Hungary, Indonesia and Romania kept their policy rates unchanged, while Colombia, Philippines and Thailand cut their key rates by 25 bps each in April. In May, China and Peru cut their rates by 10 bps and 25 bps, respectively, while Poland and Mexico reduced their policy rates by 50 bps each. Malaysia continued to pause while Brazil hiked by 50 bps (Chart II.8b). III. Domestic Developments The Indian economy remains resilient amidst global uncertainties. Domestic growth is driven by robust domestic consumption, increased government spending and strong services sector. Aggregate Demand High frequency indicators suggest that aggregate demand remained broadly resilient in April 2025. E-way bills and toll collections recorded robust double-digit growth (y-o-y) in April 2025 (Chart III.1a and III.1b). The automobile sector witnessed a slowdown in April. Wholesale automobile sales declined by 13.3 per cent (y-o-y) in April, with two-wheeler sales growth turning negative owing to high base effect (Chart III.2a and III.2b). Tractor sales registered a strong growth in April 2025, albeit with a weakened momentum. Vehicle registrations recorded a 2.9 per cent growth (y-o-y) with transport segment registering a six-month high growth in April 2025 (Chart III.2c). Petroleum consumption declined by 0.2 per cent (y-o-y) in April marking a decline for the third consecutive month, although the pace of contraction waned (Chart III.2d). As per Annual Periodic Labour Force Survey (PLFS), the labour market in January-December 2024 remained resilient, while exhibiting signs of moderation as compared to the previous year. The labour force participation rate (LFPR) and worker population ratio (WPR) came down in 2024, driven entirely by a fall in LFPR and WPR among rural females. This can be attributed to a fall in employment among helper in household enterprise (unpaid category) in rural areas. The unemployment rate also increased marginally in 2024 due to a rise in rural unemployment (Table III.1). The post-pandemic expansion in the agriculture sector’s share in total employment reversed in 2024, coming down from 46.1 per cent in 2023 to 44.8 per cent in 2024. Concomitantly, the shares of services, construction, and manufacturing increased vis-a-vis 2023. The employment quality also increased with the share of regular salaried and self-employed (own-account enterprises) showing an increase in 2024. 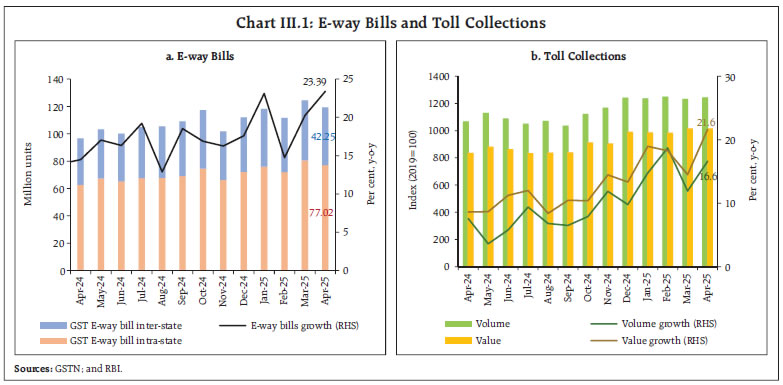
| Table III.1: Annual PLFS (January-December 2024) | | Survey period | All India | Rural | Urban | | Year | All | Male | Female | All | Male | Female | All | Male | Female | | Labour Force Participation Rate (LFPR) | | 2021 | 55.2 | 77.4 | 32.8 | 57.6 | 78.5 | 36.8 | 49.4 | 74.9 | 23.2 | | 2022 | 56.1 | 78.0 | 33.9 | 58.5 | 79.5 | 37.5 | 50.0 | 74.3 | 24.7 | | 2023 | 59.8 | 78.3 | 41.3 | 63.4 | 79.8 | 47.3 | 51.4 | 74.9 | 27.2 | | 2024 | 59.6 | 79.2 | 40.3 | 62.9 | 80.6 | 45.8 | 52.2 | 76.2 | 27.6 | | Worker Population Ratio (WPR) | | 2021 | 52.9 | 74.0 | 31.7 | 55.7 | 75.5 | 36 | 46.2 | 70.4 | 21.3 | | 2022 | 54.1 | 75.1 | 32.8 | 56.9 | 77.1 | 36.7 | 47.0 | 70.4 | 22.8 | | 2023 | 58.0 | 75.8 | 40.1 | 61.9 | 77.7 | 46.4 | 48.8 | 71.6 | 25.2 | | 2024 | 57.7 | 76.6 | 39.0 | 61.4 | 78.4 | 44.8 | 49.6 | 72.8 | 25.8 | | Unemployment Rate (UR) | | 2021 | 4.2 | 4.5 | 3.4 | 3.3 | 3.8 | 2.1 | 6.5 | 6.0 | 8.2 | | 2022 | 3.6 | 3.7 | 3.3 | 2.8 | 3.1 | 2.1 | 5.9 | 5.3 | 7.7 | | 2023 | 3.1 | 3.2 | 3.0 | 2.4 | 2.7 | 1.9 | 5.2 | 4.4 | 7.5 | | 2024 | 3.2 | 3.3 | 3.1 | 2.5 | 2.8 | 2.1 | 5.0 | 4.4 | 6.7 | Note: All indicators are in Usual Status and for person aged 15 and above.
Source: MoSPI. | The Ministry of Statistics and Programme Implementation (MOSPI) has started releasing monthly estimates of labour market indicators beginning April 2025. As per the recently released monthly PLFS bulletin for April 2025, the LFPR in the Current Weekly Status (CWS) among persons aged 15 years and above was 55.6 per cent, while the Unemployment Rate (UR) was 5.1 per cent in April 2025. Rural areas recorded a lower unemployment rate of 4.5 per cent compared to 6.5 per cent registered in urban areas. As per the PMI survey, job creation in organised manufacturing and services sectors picked up pace in April 2025 (Chart III.3).
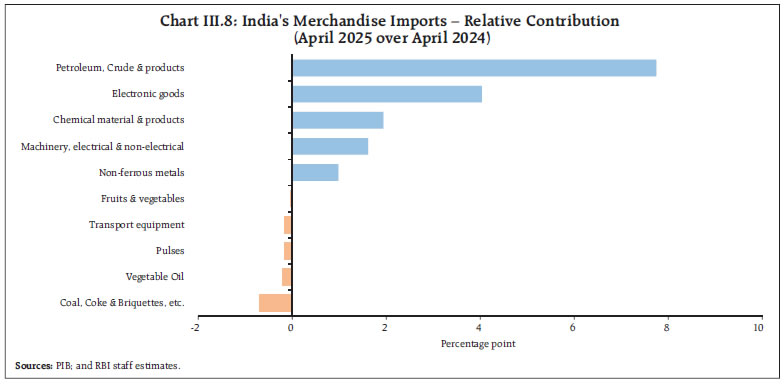
During April 2025, household demand for work under the Mahatma Gandhi National Rural Employment Guarantee Scheme (MGNREGS) rose by 7.9 per cent sequentially; however, it remained at its lowest level for the month of April since the onset of recovery from the pandemic (Chart III.4). India’s merchandise exports grew by 9.0 per cent (y-o-y) to US$ 38.5 billion in April 2025, as favourable base effect more than offset the negative momentum (Chart III.5). Exports of 23 out of 30 major commodities (accounting for 86.2 per cent of export basket in 2024-25) expanded on y-o-y basis in April. Electronic goods, engineering goods, petroleum products, gems and jewellery, and ready-made garments of all textiles supported export growth in April while organic and inorganic chemicals, iron ore, oil meals, oil seeds, and other cereals contributed negatively (Chart III.6). Exports to 11 out of 20 major destinations expanded in April 2025, with the US, the UAE and Netherlands being the top 3 export destinations. Merchandise imports at US$ 64.9 billion expanded by 19.1 per cent (y-o-y) in April 2025, on positive momentum as well as from favourable base effect (Chart III.7). Out of 30 major commodities, 23 commodities (accounting for 82.5 per cent of import basket) registered an expansion on y-o-y basis. Petroleum, crude and products, electronic goods, chemical material and products, machinery, and non-ferrous metal supported the import growth, while coal, coke and briquettes, vegetable oil, pulses, transport equipments, and fruits and vegetables, dragged imports down(Chart III.8).
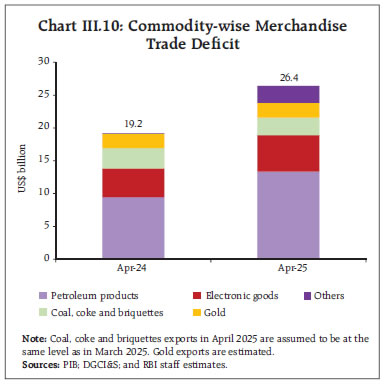
Imports from 17 out of 20 major source countries expanded in April 2025. Among major trading partners, imports from China, Russia, the UAE and the US increased. Merchandise trade deficit widened to US$ 26.4 billion in April 2025 from US$ 19.2 billion in April 2024. Oil deficit increased to US$ 13.3 billion in April from US$ 9.4 billion a year ago. Consequently, its share in total trade deficit rose to 50.5 per cent in April from 49.2 per cent a year ago. Similarly, non-oil deficit widened to US$ 13.1 billion in April from US$ 9.7 billion a year ago (Chart III.9). Petroleum products were the largest source of deficit, followed by electronic goods and coal, coke and briquettes (Chart III.10). 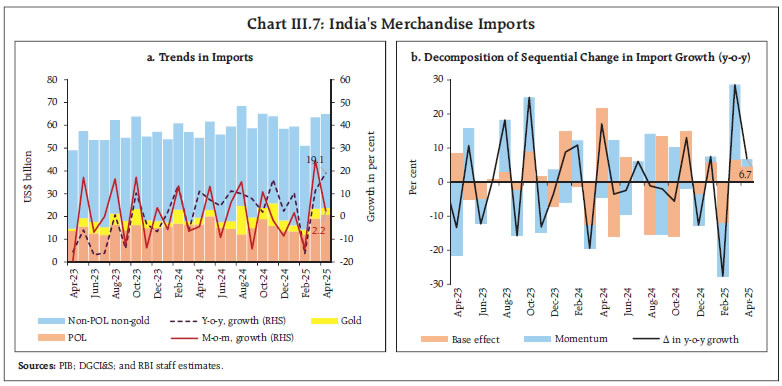
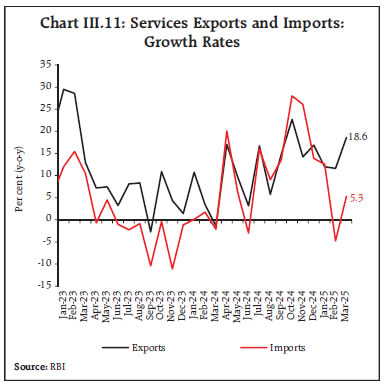
 In March 2025, net services export earnings growth accelerated to 35.1 per cent y-o-y. Services exports rose by 18.6 per cent to US$ 35.6 billion—the second-highest monthly level in the current fiscal year—while imports increased modestly by 5.3 per cent to US$ 17.5 billion (Chart III.11). Services trade continues to anchor India’s export performance, with total services exports reaching a record high of US$ 387.5 billion in 2024–25, marking a 13.6 per cent increase over the previous year. 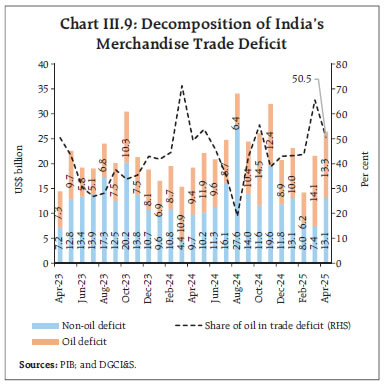
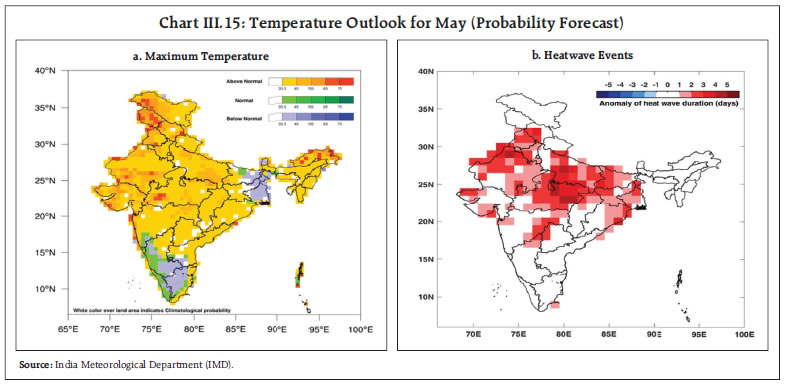
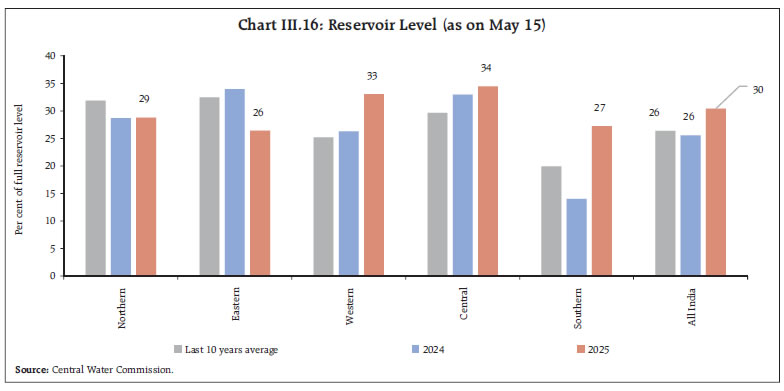
 Gross GST collections (centre plus states) stood at ₹2.4 lakh crore in April 2025 – the highest monthly collection since the inception of GST in 2017 – registering a robust growth of 12.6 per cent (y-o-y) [Chart III.12]. Collections from domestic sources and import-based sources grew by 10.7 per cent and 20.8 per cent, respectively. Robust GST collections during the past several months is perhaps indicative of resilience in economic activity as well as the government’s efforts to improve tax compliance. Aggregate Supply Following the bumper harvest of the major kharif as well as rabi crops along with the series of policy measures to combat food inflation, the average mandi prices15 of major food crops (except wheat16) appear to have eased and are ruling below their minimum support prices (MSPs), auguring well for the nation’s food security (Chart III.13). 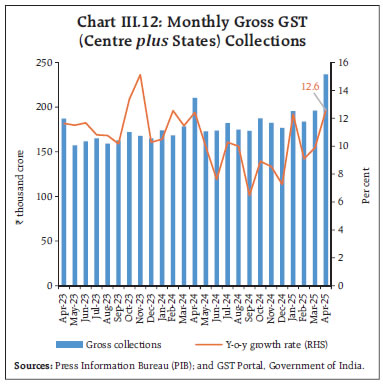 In case of summer crops, sowing, especially in pulses, is nearly complete. As of May 16, 2025, the sowing of paddy (accounting for around 43 per cent of total summer acreage) was at 107.6 per cent of full season normal area, while that of green gram or moong (accounting for around 27 per cent of total season’s acreage) was at 108.2 per cent. The cumulative summer acreage stood at 80.7 lakh hectare which is 11.9 per cent higher over the corresponding week’s acreage during the previous year (Chart III.14). The India Meteorology Department (IMD) has forecasted above normal temperatures to persist in May in most parts of the country (Chart III.15). While this raises concerns about potential stress on summer crops, the favourable root zone soil moisture17 and prevailing comfortable reservoir levels could minimise the adverse impact (Chart III.16). For the month of May, IMD has also projected above normal rains [109 per cent of the long period average (LPA)]. 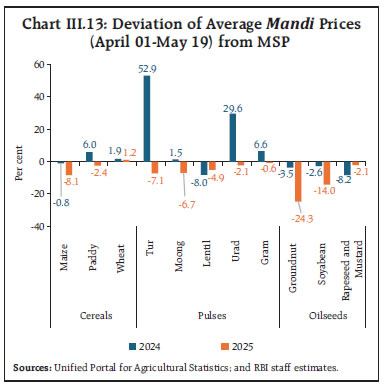 Going ahead the above normal rainfall forecast for Southwest Monsoon 2025 season (105 per cent of the LPA) and its likely early onset (forecast to set over Kerala on May 27, five days earlier than its usual onset date of June 1) augurs well for the upcoming kharif season. The requirement projected for the major fertilisers (except phosphatic fertilisers) is also higher as compared to the previous year (kharif 2024).18 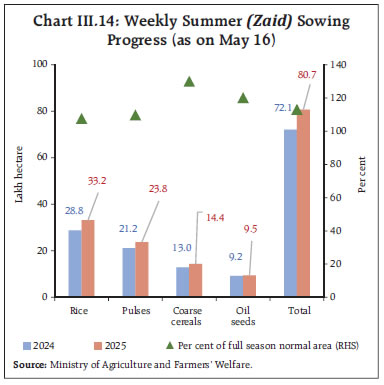
 As on May 18, 2025, the wheat procurement for rabi marketing season (RMS) 2025-26 (Apr-Mar) stood at 296.1 lakh tonnes, 13.9 per cent higher than the previous year (Chart III.17). Moreover, the wheat procurement target has been revised up by around 20 lakh tonnes to 332.7 lakh tonnes in view of higher yield in Madhya Pradesh. Rice procurement for the kharif marketing season (KMS) 2024-25 (Oct-Sep) at 557.1 lakh tonnes was also 7.1 per cent higher than the previous year. As a result of robust procurement, the wheat and rice stocks held by the Food Corporation of India as on May 01, 2025 were 4.8 times (highest in 4 years) and 4.4 times the buffer norms19, respectively. 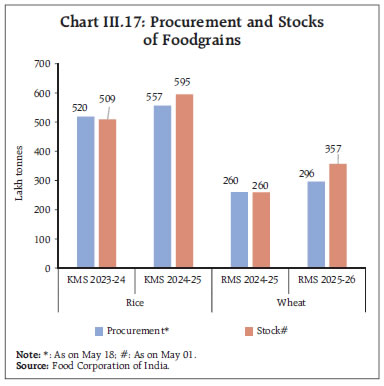 The Index of Industrial Production (IIP) growth rate moderated to 3.0 per cent (y-o-y) in March 2025 from 5.5 per cent in March 2024 but was marginally above 2.7 per cent recorded in February 2025. At the sectoral level, growth was dampened by the mining sector, while manufacturing posted a modest growth of 3.0 per cent. Within the use-based categories, infrastructure and primary goods drove expansion, while consumer non-durables dragged it down. The growth of Eight Core Industries Index (ECI) slowed to an eight-month low of 0.5 per cent y-o-y in April 2025, as compared to 6.9 per cent registered in April 2024. While refinery products, fertilisers and crude oil showed negative growth, the production of cement, coal, steel, electricity and natural gas recorded a positive growth in April 2025. India’s manufacturing PMI rose to a ten-month high of 58.2 in April 2025, led by new export orders and output (Chart III.18a). The services PMI also accelerated in April supported by a robust increase in new orders (Chart III.18b). Business expectations/ future output assessments improved slightly for the manufacturing sector while it moderated for the services sector. Among the high frequency indicators of industrial economic activity, data for April indicates that supply chain pressures remain below the historical average levels in April (Chart III.19). Growth in port traffic, although moderating from March, remained strong and above its post-COVID average in April 2025, driven by containerised cargo, petroleum, oil and lubricants (POL), and coal (Chart III.20). After registering a double-digit growth in Q4:2024-25, construction sector indicators-steel consumption and cement production- witnessed a moderation in April 2025. (Chart III.21).
Available high frequency indicators for the services sector reflect resilience in economic activity in April (Table III.2).
India is making considerable efforts towards achieving sustainable mobility and cleaner industry, as evident from the consistent increase in the electric vehicle (EV) adoption20 over the last four financial years (Chart III.22a). In 2024-25, around 11.5 lakh electric two-wheelers and 1.6 lakh electric three-wheelers were sold, reflecting a growth of 21 per cent and 57 per cent, respectively.21 Since 2020-21, more than 26,000 public EV charging stations (PCS) have been set up across the country as of end-March 2025 (Chart III.22b).22 These developments align with the proposed Greenhouse Gases Emissions Intensity (GEI) Target Rules, 2025, which aim to achieve net-zero emissions by 2070 through sector-specific greenhouse gas (GHG) intensity reduction targets for energy-intensive industries. Inflation Headline inflation, as measured by y-o-y changes in the all-India consumer price index (CPI)23, moderated to 3.2 per cent in April 2025 (the lowest since July 2019) from 3.3 per cent in March (Chart III.23). The decline in headline inflation by approximately 20 basis points (bps) came from a negative base effect of 50 bps which more than offset a positive price momentum of 30 bps. CPI food recorded a negative momentum of around (-)10 bps during the month, while momentum in CPI core (CPI excluding food and fuel) and fuel groups was positive at 68 and 67 bps, respectively. Food inflation (y-o-y) decelerated sharply to 2.1 per cent in April from 2.9 per cent in March. Vegetables and pulses subgroups continued to record deflation. Cereals and fruits also witnessed a moderation in inflation, while it saw an uptick in eggs, milk and products, oils and fats, sugar and confectionary, non-alcoholic beverages, and prepared meals. Spices continued to record deflation, albeit at a slower pace, while meat and fish entered the deflationary zone (Chart III.24). Fuel and light inflation increased to 2.9 per cent in April from 1.4 per cent in March, primarily reflecting a sharp hike in LPG prices by ₹50 per cylinder from April 8. Inflation eased for electricity while kerosene prices recorded deflation during the month. Core CPI inflation edged up to 4.2 per cent in April from 4.1 per cent in March driven by increase in gold prices by 6.2 per cent (m-o-m). Among the subgroups, inflation increased in clothing and footwear, and transport and communication while it moderated in pan, tobacco and intoxicants, personal care and effects, and household goods and services categories. Inflation remained steady in recreation and amusement, housing and health. In terms of regional distribution, inflation eased in both rural and urban areas in April, with rural inflation at 2.9 per cent and urban inflation of 3.4 per cent. Across states/UTs, the inflation rate exhibited variability, ranging from 1.3 per cent to 6.9 per cent. Majority of states experienced inflation rates below 4 per cent (Chart III.25). High frequency food price data for May so far (up to 19th) showed a broad-based moderation in prices of both cereals and pulses. Edible oil prices, on the other hand, continued to edge up - driven by soyabean, sunflower and mustard oil, while palm and groundnut oil prices moderated. Among key vegetables, prices of onion recorded further correction, while potato and tomato prices showed an uptick (Chart III.26). Retail selling prices of petrol and diesel remained broadly unchanged in May (up to 19th). Kerosene prices declined substantially, while LPG prices remained unchanged in May following the hike in April (Table III.3).
The PMIs for April 2025 recorded an uptick in the rate of expansion of input prices pressures across manufacturing, while it decelerated in services. Selling prices, on the other hand, accelerated across both manufacturing and services firms in April (Chart III.27). | Table III.3: Petroleum Products Prices | | Item | Unit | Domestic Prices | Month-over-month (per cent) | | | | May-24 | Apr-25 | May-25^ | Apr-25 | May-25^ | | Petrol | ₹/litre | 101.02 | 101.02 | 101.04 | 0.0 | 0.0 | | Diesel | ₹/litre | 90.48 | 90.48 | 90.49 | 0.0 | 0.0 | | Kerosene (subsidised) | ₹/litre | 50.03 | 46.56 | 41.51 | 0.7 | -10.9 | | LPG (non-subsidised) | ₹/cylinder | 813.25 | 863.25 | 863.25 | 6.1 | 0.0 | ^: For the period May 1-19, 2025.
Note: Other than kerosene, prices represent the average Indian Oil Corporation Limited (IOCL) prices in four major metros (Delhi, Kolkata, Mumbai and Chennai). For kerosene, prices denote the average of the subsidised prices in Kolkata, Mumbai and Chennai.
Sources: IOCL; Petroleum Planning and Analysis Cell (PPAC); and RBI staff estimates. | IV. Financial Conditions System liquidity surplus persisted in April and May (up to May 19, 2025), supported by the Reserve Bank’s proactive liquidity management measures. However, the build-up of government cash balances – driven by advance tax payments and GST outflows – and an increase in currency in circulation (CiC) exerted some pressure on liquidity conditions in the second half of April. The Reserve Bank injected a cumulative amount of ₹1.68 lakh crore into the banking system through one main 14-days variable rate repo (VRR) and twenty-one fine-tuning VRR operations with maturities ranging from 1 to 4 days during April 16 to May 19, 2025. Reflecting these developments, the average daily net absorption under the liquidity adjustment facility (LAF) stood at ₹1.52 lakh crore during April 16 to May 19, 2025, markedly higher than ₹0.26 lakh crore recorded during March 16 to April 15, 2025 (Chart IV.1). With liquidity conditions remaining easy, recourse to the marginal standing facility (MSF) averaged at ₹0.02 lakh crore during April 16 to May 19, 2025, marginally lower than ₹0.04 lakh crore during March 16 to April 15. Average deployment in the standing deposit facility (SDF) stood at ₹1.86 lakh crore during April 16 to May 19, 2025, lower than ₹2.13 lakh crore during March 16 to April 15.  In the current financial year (up to May 19, 2025), the Reserve Bank has infused liquidity to the tune of ₹2.65 lakh crore through purchases under open market operation (OMO) and a 43-day term VRR auction (Table IV.1). The weighted average call rate (WACR) – the operating target of monetary policy – moderated further following the repo rate cuts in February and April but remained within the policy corridor. The spread of the WACR over the policy repo rate averaged (-) 15 bps during April 16 to May 19, 2025, as against no deviation (0 bps) during March 16 to April 15, 2025 (Chart IV.2a). Overnight rates in the collateralised segments, the triparty repo and market repo, moved in tandem with the WACR. | Table IV.1: Durable Liquidity Measures since April 2025 | | (Amount in ₹ crore) | | Measure | Auction Date | Description | Bid Cover ratio | Liquidity injected | | OMO Purchase auctions | April 3, 2025 | Notified Amount: 20,000 | 4.04 | 20,000 | | April 8, 2025 | Notified Amount: 20,000 | 3.51 | 20,000 | | April 17, 2025 | Notified Amount: 40,000 | 2.03 | 40,000 | | April 22, 2025 | Notified Amount: 20,000 | 3.05 | 20,000 | | April 29, 2025 | Notified Amount: 20,000 | 1.96 | 20,000 | | May 6, 2025 | Notified Amount: 50,000 | 2.65 | 50,000 | | May 9, 2025 | Notified Amount: 25,000 | 3.07 | 25,000 | | May 15, 2025 | Notified Amount: 25,000 | 2.85 | 25,000 | | May 19, 2025 | Notified Amount: 25,000 | 2.01 | 19,203 | | Term Repo Auctions | April 17, 2025 | 43-day VRR auction
Notified Amount: 1,50,000 | 0.17 | 25,731 | | | Total | 2,64,934 | | Source: RBI. |
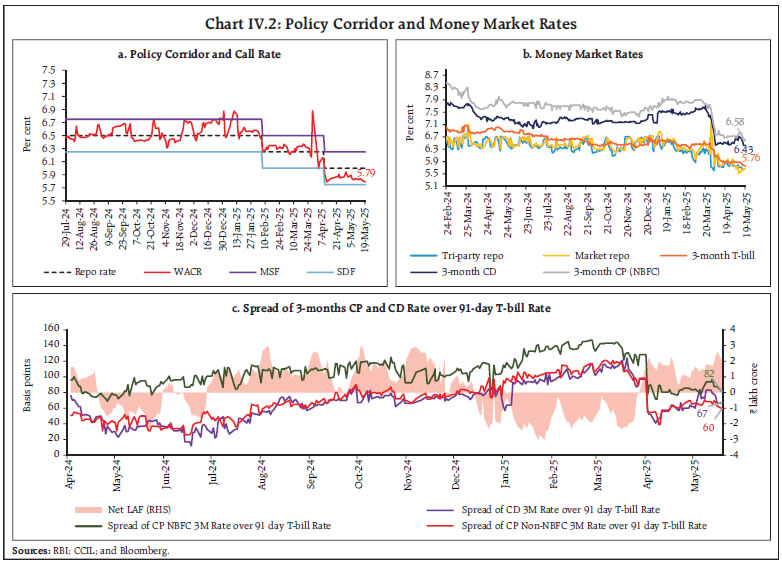 Concomitantly, interest rates declined in the term money market, with yields on 3-month Treasury Bills (T-bills), Certificates of Deposit (CDs), and 3-month Commercial Papers (CPs) issued by non-banking financial companies (NBFCs) moderating during mid-April to May (up to May 19, 2025), compared to the previous period (Chart IV.2b). The average risk premium in the money market – measured as the spread between 3-month CP and 91-day T-bill yields – narrowed significantly to 85 bps during this period from 106 bps in the preceding period, indicating improved funding conditions and lower credit risk in the short-term money market (Chart IV.2c). During April 16 to May 19, 2025, the weighted average discount rate (WADR) of CPs and weighted average effective interest rate (WAEIR) of CDs remained lower by 77 bps and 73 bps, respectively, than their levels recorded a year ago (Chart IV.3). In the primary market, issuances of CDs grew around 5 per cent (y-o-y) to ₹0.48 lakh crore during 2025-26 (up to May 2, 2025) amidst persisting but narrowing wedge between credit and deposit growth. Similarly, CP issuances at ₹1.18 lakh crore were higher by 59 per cent (y-o-y) during 2025–26 (up to May 15) as compared with the corresponding period of the previous year (Chart IV.4). 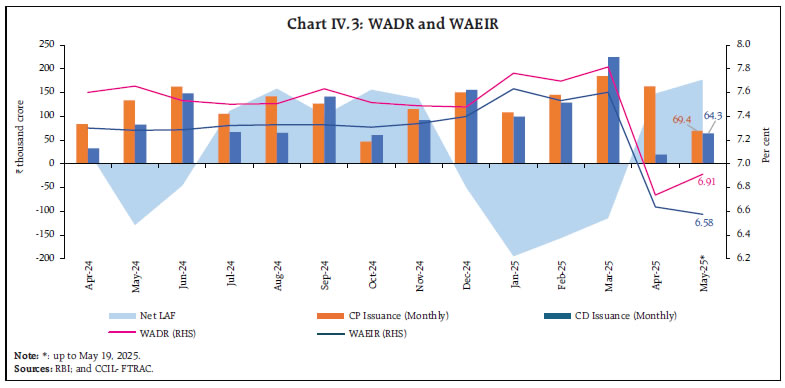 In the fixed income segment, bond yields traded with a soft bias relative to the preceding month, on account of OMO purchases, fall in crude oil prices, and moderation in CPI inflation. The yield on the 10-year G-sec benchmark declined to 6.29 per cent on May 19, 2025 from 6.41 per cent on April 15, 2025 (Chart IV.5a). The domestic yield curve has generally shifted downwards with relatively larger decrease in yields across the short and long end of the curve across the term structure (Chart IV.5b). Between April 16 and May 19, 2025, the average term spread (10-year G-sec yield minus 91-day T-bills yield) increased by 18 bps over the period March 16 to April 15, 2025. 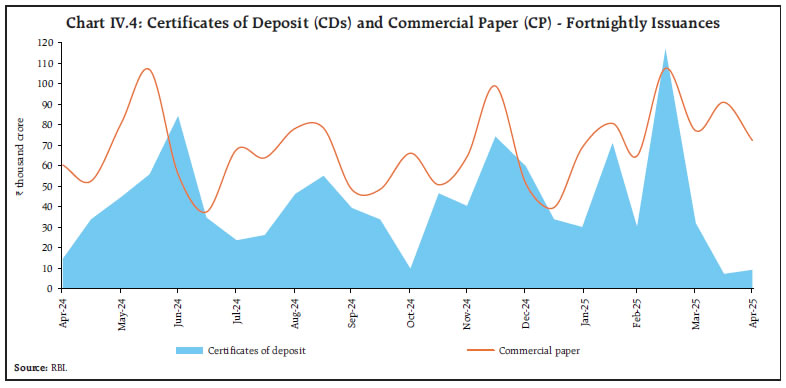
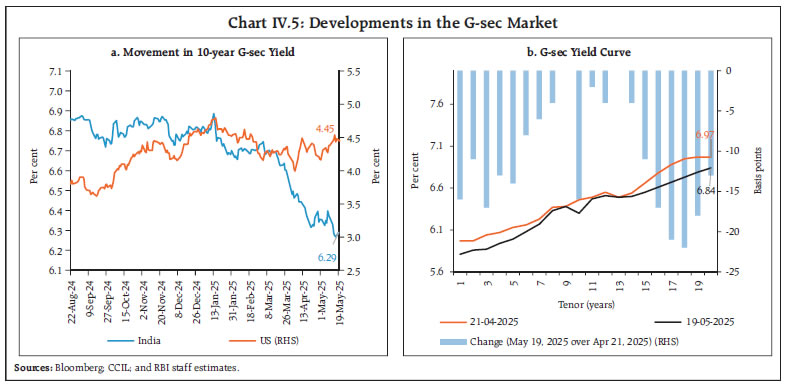 The spread of 10-year Indian G-sec yield over 10-year US bond narrowed to 184 bps as on May 19, 2025 from 314 bps in mid-September and 267 bps a year ago. The spread which fell sharply during April 4 –11, 2025, due to heightened market volatility from uncertainty over the US tariff policy, subsequently stabilised, though it exhibited a gradual declining trend. Volatility of yields in India remained low relative to the US treasuries (Chart IV.6). Corporate bond issuances surged to ₹9.94 lakh crore during 2024-25, a rise of 16.1 per cent compared to the previous year. Corporate bond yields eased while the corresponding risk premia generally increased during the second half of April till May 16, 2025 (Table IV.2).
| Table IV.2: Financial Markets - Rates and Spread | | Instrument | Interest Rates (per cent) | Spread (bps) | | (Over Corresponding Risk-free Rate) | | Mar 16, 2025 – Apr 15, 2025 | Apr 16, 2025 – May 16, 2025 | Variation | Mar 16, 2025 – Apr 15, 2025 | Apr 16, 2025 – May 16, 2025 | Variation | | 1 | 2 | 3 | (4 = 3-2) | 5 | 6 | (7 = 6-5) | | Corporate Bonds | | | | | | | | (i) AAA (1-year) | 7.43 | 6.96 | -47 | 99 | 98 | -1 | | (ii) AAA (3-year) | 7.44 | 7.13 | -31 | 94 | 103 | 9 | | (iii) AAA (5-year) | 7.42 | 7.21 | -21 | 86 | 101 | 15 | | (iv) AA (3-year) | 8.27 | 7.98 | -29 | 177 | 187 | 10 | | (v) BBB- (3-year) | 11.93 | 11.63 | -30 | 543 | 550 | 7 | Note: Yields and spreads are computed as averages for the respective periods.
Sources: FIMMDA; and Bloomberg. | Reserve money (RM), adjusted for the first-round impact of change in the cash reserve ratio (CRR), recorded a growth of 7.8 per cent (y-o-y) as on May 9, 2025 (5.0 per cent a year ago) [Chart IV.7]. Growth in currency in circulation (CiC), the largest component of RM, stood at 7.0 per cent (y-o-y) as compared with 2.9 per cent a year ago. On the sources side (assets), RM comprises net domestic assets (NDA) and net foreign assets (NFA) of the Reserve Bank. Growth in foreign currency assets accelerated to 4.9 per cent (y-o-y) as on May 9, 2025 (Chart IV.8). Gold – the other major component of NFA – grew by 57.8 per cent, mainly due to revaluation gains on gold prices, leading to a steady rise in its share in NFA from 8.3 per cent as of end-March 2024 to 12.9 per cent as of May 9, 2025. As on May 2, 2025, money supply (M3) rose by 9.5 per cent (y-o-y) [11.1 per cent a year ago]24. Aggregate deposits with banks, accounting for around 86 per cent of M3, increased by 9.8 per cent (12.5 per cent a year ago). Scheduled commercial banks’ (SCBs’) credit growth moderated to 10.9 per cent as on May 2, 2025 (15.9 per cent a year ago) due to weaker momentum effect and unfavourable base effect (Chart IV.9).
SCBs’ deposit growth (excluding the impact of the merger) decelerated from 10.6 per cent as on March 21, 2025 to 10.3 per cent as on May 2, 2025, with the base and momentum effect offsetting each other (Chart IV.10). SCBs’ incremental credit-deposit ratio declined during the previous two months to 82.3 per cent as on May 2, 2025, with deposit accretion outpacing that of credit during this period (Chart IV.11).
In the fiscal year 2024-25, SCBs primarily relied on deposits for funding, while their reliance on borrowings declined (Chart IV.12a). Majority of the funds raised by SCBs were primarily utilised to extend credit followed by investment, while their cash holdings (cash in hand) and balances with the RBI registered a decline – the latter due to a reduction in the cash reserve ratio from 4.5 per cent to 4.0 per cent in December 2024 (Chart IV.12b). During Q4:2024-25, SCB’s net holdings of non-approved securities (comprising CPs, units of mutual funds, shares, and bonds/debentures/security receipts, etc.) increased as compared to Q3:2024-25 (Chart IV.13). SCBs experienced a net inflow in CPs and bonds/debentures/security receipts but a net outflow in mutual funds.
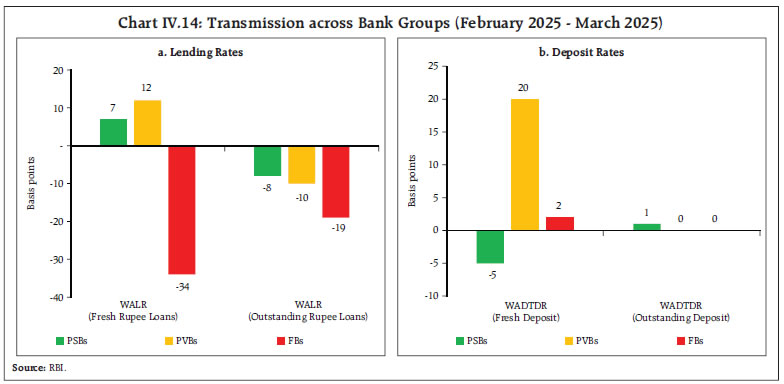
In response to the 50-bps cut in the policy repo rate since February 2025, most of the banks have reduced their repo-linked external benchmark based lending rates (EBLRs) and marginal cost of funds-based lending rate (MCLR). Consequently, the weighted average lending rate (WALR) on outstanding rupee loans of SCBs declined by 10 bps; however, it has increased for fresh loans by 3 bps during February and March 2025 (Table IV.3). On the deposit side, the weighted average domestic term deposit rates (WADTDRs) on fresh and outstanding deposits increased by 8 bps and 1 bp, respectively, during the same period. The decline in WALR of outstanding loans was broad-based covering public sector banks (PSBs), private banks (PVBs) and foreign banks (FBs). The increase in WALR on fresh rupee loans, however, was on account of PSBs and PVBs (Chart IV.14). | Table IV.3: Transmission to Banks’ Deposit and Lending Rates | | (Variation in bps) | | | | Term Deposit Rates | Lending Rates | | Period | Repo Rate | WADTDR-Fresh Deposits | WADTDR-Outstanding Deposits | EBLR | 1-Yr. MCLR (Median) | WALR - Fresh Rupee Loans | WALR-Outstanding Rupee Loans | | (1) | (2) | (3) | (4) | (5) | (6) | (7) | (8) | Easing Phase
Feb 2025 to Apr* 2025 | -50 | 8 | 1 | -50 | 0 | 3 | -10 | Tightening Period
May 2022 to Jan 2025 | +250 | 253 | 199 | 250 | 178 | 181 | 115 | Notes: Data on EBLR pertain to 32 domestic banks.
*: Data on WADTDR and WALR pertain to March 2025.
WALR: Weighted Average Lending Rate; WADTDR: Weighted Average Domestic Term Deposit Rate;
MCLR: Marginal Cost of Funds-based Lending Rate; EBLR: External Benchmark-based Lending Rate.
Source: RBI. |
 Based on the early results of listed non-government non-financial companies25, sales growth moderated to 6.4 per cent (y-o-y) during Q4:2024-25, down from 7.7 per cent in the previous quarter. Amid sluggish demand conditions, sales growth of listed private manufacturing companies moderated to 6.0 per cent (y-o-y) during Q4:2024-25 from 7.3 per cent during the previous quarter. Subdued performance of manufacturing companies was primarily due to weak financials of petroleum industry, which has a high share in early results. Excluding petroleum, sales growth for the manufacturing sector stood at 9.7 per cent during Q4:2024-25. Despite macroeconomic and global uncertainties, sales growth of IT companies improved further to 7.7 per cent during Q4:2024-25 from 6.7 per cent in the previous quarter. In contrast, sales growth of early reporting non-IT services companies moderated further to 11.2 per cent during Q4:2024-25 from 12.1 per cent in the previous quarter (Chart IV.15). Debt serviceability, as measured by interest coverage ratio (ICR), for the manufacturing companies improved to 9.0 during Q4:2024-25 from 8.0 in the previous quarter due to a sequential rise in profits along with decline in interest expenses. The ICR of non-IT services companies deteriorated during Q4 but remained above unity since Q2:2022-23, indicating continued ability to service interest payments (Chart IV.16).
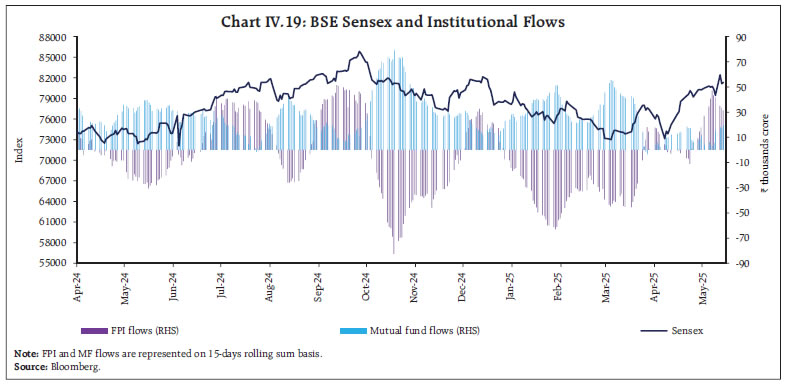
Despite rising input costs, staff costs and other expenses, operating profit of manufacturing companies rose by 4.0 per cent during Q4:2024-25. Among the major industries, petroleum, iron and steel industries recorded contraction in the operating profit on year-on-year basis (Chart IV.17a). The operating profit margin remained stable during Q4 from previous quarter. Within the services sector, operating profit margins moderated sequentially for both IT and non-IT service sector companies during Q4 (Chart IV.17b). 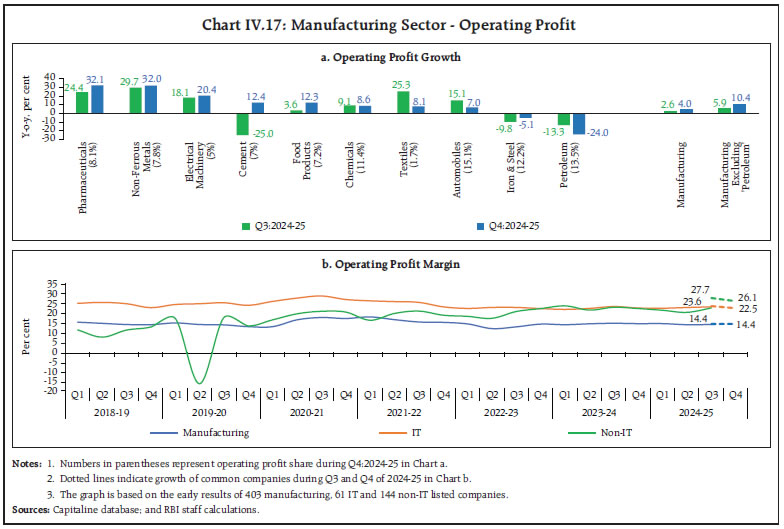 During Q4:2024-25, the Indian listed banking and financial sector companies26 exhibited robust bottom-line growth despite a moderation in top-line growth (Chart IV.18). Revenues, which primarily include interest income in case of banks registered strong growth, albeit with some moderation over the previous quarter, indicating sustained credit demand. Other income, including income from fees/ commissions, profit and loss from sale of investments, etc., exhibited a double-digit growth during the quarter. Expenditure growth was moderately higher than top-line growth amidst a double-digit growth in interest expenses. However, a moderation in provisioning costs and an improvement in asset quality resulted in higher growth in net profits as compared to operating profits. After declining in the first half of April amidst tariff announcements by the US, the equity market recovered in the second half as tariff related concerns eased. Moreover, the ebullient sentiment was supported by a strong rally in financial sector stocks, following robust corporate earnings of some PVBs and moderation in domestic CPI inflation for March 2025. The markets continued their upward momentum amidst favorable cues from global equity markets. In early May, markets declined amidst escalation of tensions between India and Pakistan. Thereafter, however, markets rebounded amidst easing of concerns over India-Pakistan conflict and the release of softer-than-expected domestic inflation prints for April 2025. Overall, Indian equity markets registered gains during April-May 2025 with the BSE Sensex increasing by 6 per cent to close at 82,059 on May 19, 2025 (Chart IV.19). The broader market indices outperformed the benchmark, with the BSE Midcap and BSE Smallcap indices gaining 8.7 per cent and 10.3 per cent, respectively, during April-May 2025 (up to May 19, 2025). Foreign portfolio investors (FPIs) remained net buyers to the tune of ₹36,662 crore during April-May 16, 2025. Domestic institutional investors (DIIs), including mutual funds and insurance companies, played a stabilising role by capitalising on lower valuations and maintaining long-term investment strategies, remaining net buyers in the domestic equity markets to the tune of ₹48,312 crore during April-May 2025 so far. 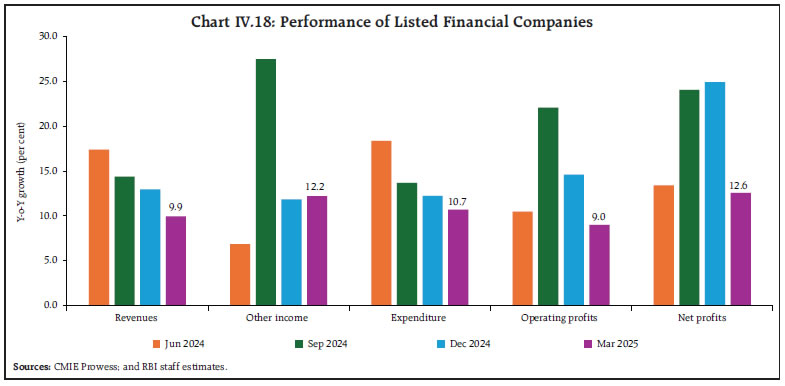
 Net foreign direct investment (FDI) moderated to US$ 0.4 billion during 2024-25 from US$ 10.1 billion a year ago, reflecting the rise in net outward FDI and repatriation FDI (Chart IV.20a). This is a sign of a mature market where foreign investors can enter and exit smoothly, which reflects positively on the Indian economy. Nonetheless, gross inward FDI witnessed a double-digit growth of 13.7 per cent and stood at US$ 81 billion during 2024-25. Gross FDI inflows remain concentrated in manufacturing, financial services, electricity and other energy, and communication services sectors, with a share of more than 60 per cent. Singapore, Mauritius, the UAE, the Netherlands, and the US accounted for more than 75 per cent of the flows during this period. In 2024-25, India’s net outward FDI (OFDI) reached US$ 29.2 billion, a growth of more than 75 per cent over the previous year. Singapore, the US, UAE, Mauritius and the Netherlands together accounted for more than half of the rise in OFDI; moreover, sector-wise analysis reveals that financial banking and insurance services, followed by manufacturing; and wholesale, retail trade, restaurants and hotels accounted for more than 90 per cent of the rise of OFDI (Chart IV.20b). Foreign portfolio investment (FPI) registered net outflows of US$ 2.4 billion in April 2025 (Chart IV.21a). While equity FPI turned positive in the latter half of the month – supported by the 90-day pause in the US tariff implementation and growing optimism around a potential US-India trade agreement – overall FPI flows remained negative during April 2025. The UK and the European equities have led global gains year-to-date post ‘Trump 2.0’, while Indian equities performed well among emerging markets following the April market trough and recorded inflows (Chart IV.21b). In contrast, the debt segment recorded net outflows of over US$ 3.7 billion in April – the largest monthly outflow since March 2020. This was driven by diminished global risk appetite amid tariff-related volatility, a narrowing yield differential between Indian and US bonds, and a possible reallocation of foreign capital towards Indian equities. 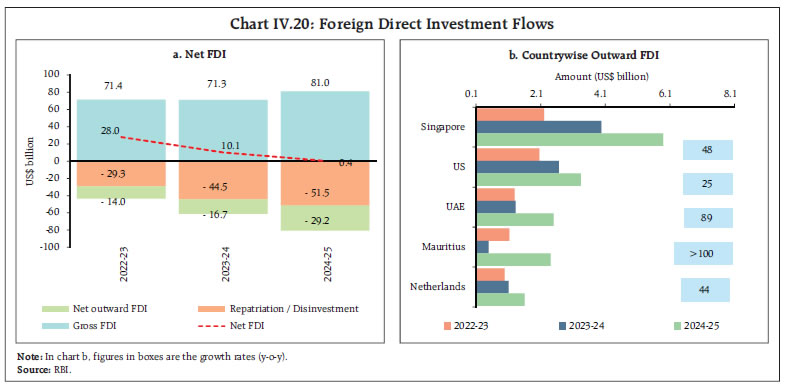 External commercial borrowing (ECB) registrations by Indian companies reached a record high of US$ 61.2 billion during 2024-25, a 24.3 per cent increase over the previous year. Both ECB registrations (US$ 17.9 billion) and gross disbursements (US$ 16.8 billion) were higher in Q4:2024-25 as compared with Q4:2023-24. During 2024-25, ECB gross disbursements stood at US$ 54.1 billion. ECB outflows (US$ 29.0 billion) on account of principal repayments of past contracts resulted in significantly higher net inflows of US$ 25.1 billion – nearly three times the level recorded a year ago (Chart IV.22).
Over US$ 25.9 billion (42.3 per cent) of the total ECBs raised during 2024-25 were intended to be used for capital expenditure (capex), including on-lending and sub-lending for capex (Chart IV.23). Of the total ECB registrations, 67.4 per cent were intended to be hedged during 2024-25. Considering loans from foreign parent companies and rupee denominated loans, the effectively hedged position increases to 77.6 per cent, considerably offsetting the exchange rate risk exposures (Chart IV.24). During 2024-25, the overall cost of ECB loans declined by 43 bps, largely driven by a reduction in global benchmark interest rates – the secured overnight financing rate (SOFR). In contrast, the weighted average interest margin remained largely unchanged compared to the previous year (Chart IV.25).
The Indian rupee (INR) appreciated by 1.3 per cent (m-o-m) in April 2025 and remained one of the least volatile major currencies globally (Chart IV.26). The spillovers of trade policy uncertainty are already getting manifested in greater volatility in currency markets, with export-oriented economies being highly vulnerable as witnessed in the case of the New Taiwan dollar (TWD). The TWD recorded an intraday surge of more than 5 per cent on May 5, 2025 – the biggest in over three decades.
The INR depreciated (m-o-m) by 0.7 per cent in real effective terms in April 2025 as India’s inflation (m-o-m) was 1.4 percentage points lower than the weighted average inflation of its major trading partners, more than offsetting the appreciation in the nominal effective exchange rate (NEER) [Chart IV.27]. As on May 9, 2025, India’s foreign exchange reserves stood at US$ 690.6 billion, providing a cover for more than 11 months of goods imports27 and 96 per cent of external debt outstanding at end-December 2024 (Chart IV.28a). Over the past three years, the share of gold (in value terms) in total foreign exchange reserves of central banks holding large reserves has increased (Chart IV.28b).
Payment Systems Following the strong financial year-end expansion in March 2025, digital transactions continued to increase across various payment modes in April, notwithstanding intermittent technical issues (Table IV.4). Real Time Gross Settlement (RTGS), a key indicator of overall economic activity, registered robust double-digit growth (y-o-y) in both volume and value terms. Among retail digital payment modes, the Unified Payments Interface (UPI), National Electronic Funds Transfer (NEFT), and Bharat Bill Payment System (BBPS) also maintained steady expansion. Transactions under the National Electronic Toll Collection (NETC) recorded an uptick, driven by improved mobility, rising vehicular traffic and increased tag issuance. In the cards segment, credit card spending peaked at ₹2.01 lakh crore in March 2025, alongside a 7.94 per cent (y-o-y) rise in issuances, which increased total cards to 109.8 million. Overall, total digital payments grew (y-o-y) by 35.0 per cent (44.3 per cent in 2023-24) in volume and 17.9 per cent (16.4 per cent in 2023-24) in value in 2024-25. Moreover, the central bank digital currency-e₹ in circulation continued to gain further traction, with volume more than doubling and value rising over fourfold (y-o-y) as of the week ended April 18, 2025. 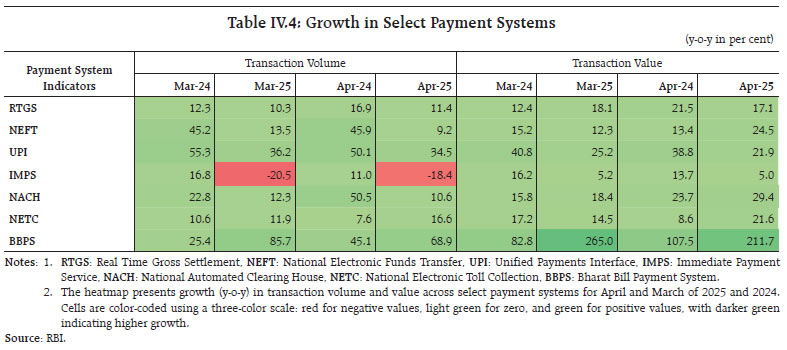 V. Conclusion The global economic outlook remains clouded amidst shifting policy landscapes and lingering vulnerabilities. In the midst of these uncertainties, the outlook for India is one of cautious optimism. According to IMF projections of April 2025, India is projected to remain the fastest growing major economy in 2025 and is likely to surpass Japan this year to become the world’s fourth largest economy28. Inflation pressure has eased significantly and is poised for a durable alignment with the target in 2025-26. The prospects of bumper rabi harvest and the outlook of an above normal monsoon would further strengthen rural consumption and is also likely to keep food inflation in check. Consumers and businesses remain confident, supportive for a strengthening of economic activity. Indian economy continues to be ring-fenced by stability encompassing monetary, financial and political stability; policy consistency and certainty; congenial business environment; and strong macroeconomic fundamentals along with a policy ecosystem that is transparent, rule-based, and forward-looking29. In the midst of global trade realignments and industrial policy shifts, India is increasingly positioned to function as a “connector country” that can become a key intermediary in sectors such as technology, digital services and pharmaceuticals. In this scenario, the recent completion of free trade agreement with UK points to a strengthening of bilateral trade linkages. Going forward, notwithstanding the daunting challenges in the horizon, India stands well-positioned to navigate the ongoing global headwinds with confidence, ready to harness emerging opportunities and consolidate its role as a key driver of global growth.
|