|
Abstract
The study estimates that ‘excess’ bank deposit growth (y-o-y) following
demonetisation has been in the range of 3.0-4.7 percentage points. In nominal terms,
these estimates imply excess deposits that accrued to the banking system due to
demonetisation to be in the range of ₹ 2.8-4.3 trillion. A micro-level analysis
of unusual growth in cash deposits in specific types of accounts, which are usually
marked by low level of activity, also support the findings. Such gains in terms
of shift towards bank deposits, if durable, could have beneficial impact in the
form of financialisation of savings.
I. Introduction
On November 8, 2016, currency notes of denominations of ₹ 1000 and ₹
500 (specified bank notes or SBNs), valued at ₹ 15.4 trillion and constituting
86.9 per cent of the value of total notes in circulation were demonetised. The consequent
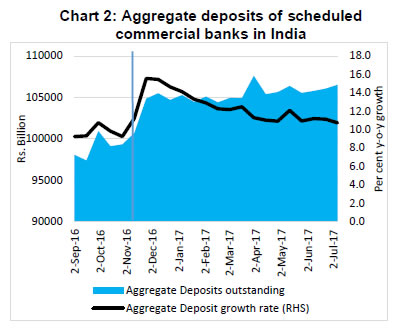
decline in currency in circulation was mirrored in a surge in bank deposits. Between
October 28, 2016 to January 6, 2017, notes in circulation declined by about ₹
8.8 trillion, which in turn, was largely reflected in an increase of about 4 percentage
points in the share of Current Account and Saving Account (CASA) deposits (low cost
deposits) in aggregate deposits of the banking system (Charts
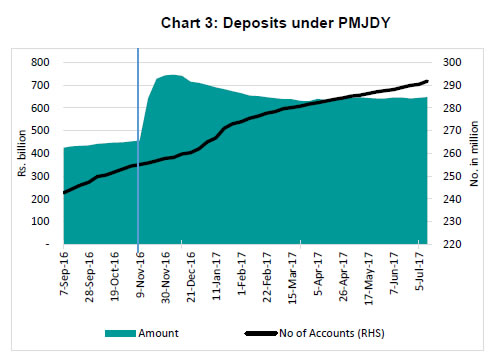
1 and 2). Demonetisation also led to a
significant increase in financial intermediation with 48 per cent increase in deposits
in Pradhan Mantri Jan-Dhan Yojana (PMJDY) accounts, with addition of 18 million
accounts post-demonetisation (November 9 to January 25, 2017). The latest data indicate
that 38.2 million new accounts were opened until July 26, 2017 since demonetisation
(Chart 3).2

II. Estimates of Excess Deposits
Against the above backdrop, this study attempts to analyse deposit ‘behaviour’
with a view to estimating ‘excess’ deposit growth due to demonetisation.
First, employing certain assumptions, a time series model is adopted to assess the
‘normal’ rate of growth in bank deposits during the demonetisation period
and then ‘excess’ growth is derived juxtaposing it with actual growth.
Second, seven categories of special accounts constituting about 30 per cent of bank
deposits are evaluated against the growth recorded during previous years. Such accounts
are selected given the lack of significant activity in these accounts during normal
times and indications of unusual cash deposits. The resulting estimates are presented
below.
II.1 Estimates based on Aggregate Banking Statistics
In what follows, the benchmark nominal rate of deposit growth is assumed under alternate
scenarios to be (i) the deposit growth in the corresponding period of 2015-16; (ii)
the average growth recorded during the corresponding periods of the previous two
years (i.e., 2014-15 and 2015-16); and (iii) the growth estimated using ARIMA model.
Scenario 1: Normal deposit growth proxied by the observed rate in 2015-16
Aggregate deposits grew by 14.5 per cent (y-o-y) during the period November 11 to
December 30, 2016, as against 10.3 per cent during the corresponding period of 2015,
indicating a 4.2 percentage point excess deposit growth due to demonetisation (Table 1). In nominal terms, excess deposits work
out to ₹ 3.8 trillion.
Assessment for the period November 11, 2016 to February 17, 2017 reveals that average
fortnightly bank deposit growth was 13.9 per cent, 3.5 percentage points in excess
of the assumed normal growth of 10.4 per cent during the corresponding period of
2015-16. With a view to factoring in some temporal tapering of deposits, if the
period up to end-March 2017 is considered, the actual deposit growth of 13.4 per
cent exceeds the estimated growth of 10.1 per cent by 3.3 percentage points.
|
Table 1: Estimated impact of demonetisation on SCBs’ aggregate
deposits
|
|
Period
|
Deposit growth
|
Scenario I
|
Scenario II
|
Scenario III
|
|
November 11, 2016 to December 30, 2016
|
Excess growth in percentage points
|
4.2
|
4.0
|
4.7
|
|
Excess growth in ₹ billion
|
3,829
|
3,608
|
4,309
|
|
November 11, 2016 to February 17, 2017
|
Excess growth in percentage points
|
3.5
|
3.3
|
4.2
|
|
Excess growth in ₹ billion
|
3,233
|
2,991
|
3,848
|
|
November 11, 2016 to March 31, 2017
|
Excess growth in percentage points
|
3.3
|
3.0
|
3.8
|
|
Excess growth in ₹ Billion
|
3,088
|
2,754
|
3,472
|
|
Note: Due to fortnightly reporting system, data have been taken from the fortnight
ending November 11, 2016 to capture the impact of demonetisation.
|
Scenario 2: Normal deposit growth proxied by average of 2014-15 and 2015-16
The average fortnightly y-o-y growth in bank deposits during November 11-December
30 of 2014-15 and 2015-16 was 10.6 per cent, while the average deposit growth for
the same period of 2016-17 was 14.5 per cent. Under this scenario, excess deposit
growth due to demonetisation is estimated at 4.0 percentage points (Table 1).
On the same basis, deposit growth for the period November 11 to February 17, 2017
was 3.3 percentage points in excess of the deposit growth of 10.7 per cent based
on average of the same period of previous two years. If the period up to end-March
2017 is considered, the excess deposit growth works out to 3.0 percentage points
above the average deposit growth of 10.4 per cent.
Scenario 3: Estimates based on the univariate forecasting model ARIMA
Deposit growth (y-o-y) forecast was also carried out using an autoregressive integrated
moving average [ARIMA (1,1)] model on fortnightly data for the period 2012-13 to
2016-17 (up to the fortnight ending October 28, 2016):
where, ŷt is the deposit growth series. Lags of the series (yt-1,…,
yt-p) are ‘autoregressive’ terms, while lags of the forecast
errors (et-1,…, et-q) are the ‘moving average’
terms. The model is found to be statistically robust and apposite for short-term
forecast (see Annex Tables 1 to 4 and Annex Chart 1).
The excess deposit growth due to demonetisation using the model works out to 4.7
percentage points over the model forecast growth of 9.8 per cent (Table 1). For the period November 11, 2016 to February 17,
2017 deposit growth was 4.2 percentage points in excess of the model forecast growth
of 9.7 per cent. When the period up to end-March 2017 is taken into account, the
excess deposit growth is 3.8 percentage points over the model forecast growth of
9.7 per cent.
II.2 Estimation of Excess Deposits based on Specific Bank Accounts
Before the discontinuation of over-the-counter exchange facility at bank branches
on November 25, 2016, about ₹ 370 billion of SBNs were tendered. A significant
amount of SBNs flowed into the following special types of accounts: Basic Saving
Bank Deposit Account (BSBDA); PMJDY Accounts; Kisan Credit Card (KCC); dormant or
inoperative accounts; co-operative banks’ accounts with SCBs; bullion trader/jewellers’
accounts; and loan accounts. The amount of unusual cash deposits has been estimated
below using data on these accounts and the following estimation methods.
Scenario 1: Month over month increase without adjusting for seasonality
Estimated cash deposits in these seven types of accounts during November-December
2016 with 52 banks were ₹ 4,358 billion. Cash deposits in these accounts during
September-October 2016 were ₹ 2,701 billion (Table
2). Thus, the variation of ₹ 1,657 billion can be assumed to be the
increase in cash deposits under these accounts due to demonetisation in the absence
of any noticeable activity in such accounts during normal times.
|
Table 2: Cash deposits in select bank accounts during Nov-Dec and
Sept-Oct 2016
|
|
(₹ billion)
|
|
Type of account
|
9-Sep to 30-Oct 2016 (52 Banks)
|
9-Nov to 30-Dec 2016 (52 Banks)
|
Increase in cash deposits due to demonetisation
|
|
(1)
|
(2)
|
(3)
|
(4)=(3)-(2)
|
|
BSBDA
|
67.0
|
264.1
|
197.0
|
|
PMJDY
|
66.7
|
664.8
|
598.1
|
|
KCC
|
142.2
|
129.8
|
-12.3
|
|
Dormant accounts
|
28.3
|
242.2
|
213.9
|
|
Co-operative banks’ accounts with SCBs
|
201.9
|
787.8
|
585.9
|
|
Bullion traders’ accounts
|
94.9
|
110.6
|
15.7
|
|
Loan accounts
|
2,100.5
|
2,158.9
|
58.3
|
|
Total
|
2,701.5
|
4,358.1
|
1,656.6
|
Scenario 2: Based on y-o-y growth of aggregate cash deposits
The estimated cash deposits in seven types of accounts with 52 banks were ₹
4,358 billion during November-December 2016 and ₹ 3,065 billion during November-December
2015. Average y-o-y growth of net deposits (deposit minus withdrawal) of all types
of accounts of SCBs during November-December for last 5 years was (-) 9.2 per cent
(Table 3). The estimated trend of cash deposits
in these accounts during November-December 2016 is ₹ 2,783 billion. Thus,
excess cash deposit during November-December 2016 works out to ₹ 1,575 billion.
|
Table 3: Net deposits in all types of bank accounts
|
|
(₹ billion)
|
|
Year
|
Net deposits in all types of accounts of SCBS during Nov-Dec (50 days)
|
% y-o-y growth
|
|
2010
|
1,835.4
|
|
|
2011
|
1,732.0
|
-5.6
|
|
2012
|
374.7
|
-78.4
|
|
2013
|
553.1
|
47.6
|
|
2014
|
370.1
|
-33.1
|
|
2015
|
457.5
|
23.6
|
|
Note: Net deposit is the difference between deposit and withdrawal.
|
III. Conclusion
Excess deposit growth in the banking system during the demonetisation period (i.e.,
November 11, 2016 to December 30, 2016) works out to 4.0-4.7 percentage points.
If the period up to mid-February 2017 is taken into account to allow for some surge
to taper-off, excess deposit growth is in the range of 3.3-4.2 percentage points.
Considering some more temporal tapering of deposits, the exercise taken up to end-March
2017 reveals that excess deposit growth would be in the range of 3.0-3.8 percentage
points. In nominal terms, excess deposits accrued to the banking system due to demonetisation
are estimated in the range of ₹ 2.8-4.3 trillion. The unusual cash deposit
in specific accounts, which are usually less active, is estimated to be in the range
of ₹ 1.6-1.7 trillion.
Overall, there appears to have been a significant increase in bank deposits due
to demonetisation, which if sustained, could have favourable impact on financial
savings and their channelisation to capital markets (See Mint Street Memo No.2:
“Financialisation of Savings into Non-Banking Financial Intermediaries)”.
Annex
|
Table 1: Unit Root Tests for Stationary
|
Null Hypothesis: Deposit growth (DEPGR) has a unit root
Exogenous: Constant, Linear Trend
|
|
|
t-Statistic
|
Prob.*
|
|
Augmented Dickey-Fuller test statistic
|
-3.39
|
0.06
|
|
Phillips-Perron test statistic
|
-4.07
|
0.01
|
|
Note: Test critical values are: -4.01 at 1% level, -3.43 at ** 5% level, * -3.14
10% level.
|
|
Table 2: Estimates of ARIMA(1,1) Model
|
|
Dependent Variable: Aggregate deposit growth rate (DEPGR)
|
|
Variable
|
Coefficient
|
t-Statistic
|
|
C
|
16.48**
|
24.81
|
|
TREND
|
-0.04**
|
-4.53
|
|
AR(1)
|
0.94**
|
35.60
|
|
MA(1)
|
-0.37**
|
-5.57
|
|
R-squared
|
0.93
|
|
|
Durbin-Watson stat
|
2.11
|
|
|
Akaike info criterion
|
2.12
|
|
|
Schwarz criterion
|
2.21
|
|
|
** Significant at 1% level.
|
|
Table 3: Serial Correlation LM Test
|
|
Correlogram Q-statistic
|
|
Lag
|
AC
|
PAC
|
Q-Stat
|
Prob.
|
|
3
|
0.04
|
0.06
|
3.85
|
0.08
|
|
10
|
-0.10
|
-0.10
|
6.54
|
0.59
|
|
Correlogram Squared Residuals
|
|
1
|
0.12
|
0.12
|
2.49
|
0.12
|
|
10
|
-0.05
|
-0.08
|
10.18
|
0.43
|
|
Note: All Q-statistics are highly insignificant suggesting no serial correlation
left in the residuals.
|
|
Table 4: Heteroskedasticity Test - ARCH
|
|
Null Hypothesis: Residuals are homoskedastic
|
|
F-statistic
|
2.46
|
Prob. F(1,160)
|
0.13
|
|
Obs*R-squared
|
2.44
|
Prob. Chi-Square(1)
|
0.12
|
Note: If ARMA process is (covariance) stationary, then all AR roots should lie inside
the unit circle.
References:
Box, George and Jenkins, Gwilym (1970), Time Series Analysis: Forecasting and Control,
San Francisco: Holden-Day.
|