|
Abstract: An analysis of data revisions relating to national accounts aggregates in India shows a general bias towards upward revisions in growth rates relative to first releases or advance estimates (AEs). Thus, the AEs need to be supplemented with other high frequency indicators of real sector to arrive at a more realistic assessment of the state of the economy.
Background
Revisions in gross domestic product (GDP) estimates are not unique to Indian national accounts. Internationally, early estimates suffer from a lack of complete information, an issue that is addressed gradually by successive revisions.
This study attempts a statistical analysis of data revisions of GDP growth rate in India, between the first release and the latest available release, from both the production and the expenditure side, and for both annual and quarterly estimates. The analysis is also extended to major components of GDP with a view to ascertain the extent of revision in each sector.
The study is organised as follows. Following the introduction in Section I, Section II presents a short survey of related literature. The scheme of release and revision of national accounts data by the Central Statistics Office (CSO) is elaborated in Section III before presenting the statistical analysis on the revisions from both the production and the expenditure side in Section IV. Section V sums up the key findings.
I. Introduction
With the release of the first advance estimates (FAE) of national income for 2017–18 on January 5, 2018, the issue of their reliability in assessing the strength of economic activity has come to the fore, especially as new data suggestive of a faster growth pick-up have become available since then1. The FAE are used in ratios underlying the Union Budget as well as in analysis supporting monetary policy. In his budget speech, the Finance Minister stated: ‘…We hope to grow at 7.2 per cent to 7.5 per cent in the second half (H2)’, which is clearly a higher rate than the implicit growth rate of 7.0 per cent for H2 in the FAE. Furthermore, for calculating the gross fiscal deficit (GFD) to GDP ratio for 2017–18 (Revised Estimates), the Union Budget for 2018–19 has taken nominal GDP as ₹ 167.8 trillion, which is higher than the FAE estimate of ₹ 166.3 trillion2. The Monetary Policy Committee (MPC) in its resolution dated February 7, 2018 stated that ‘Information available after the release of FAE by the CSO has, however, been generally positive’ and kept its gross value added (GVA) growth projection for 2017-18 higher at 6.6 per cent as against the FAE of 6.1 per cent.
II. Survey of the Existing Literature
A study of sixteen G20 countries found that there have been revisions in the early estimates of quarterly GDP and such revisions were large and in the downward direction during the crisis years of 2008 and 2009 (Shrestha and Marini, 2013). The first published estimates of annual real GDP growth rates in six3 regional members of the Asian Development Bank (ADB) were revised upwards three years later and in the latest period (Sim, de Castro and Pascua, 2009). Most of these economies also experienced positive revisions to estimates of annual real GDP growth rates in the first, second, third, and later years after their initial release. In the United States (US), it has been found that the initial monthly estimates of quarterly GDP are based on extrapolations and these get revised once relevant data becomes available: The mean absolute revisions for the quarterly estimates of GDP and gross domestic income (GDI) are slightly more than 1.0 percentage point (Landefeld, Seskin and Fraumeni, 2008).
In the Indian context, the magnitude and quality of revisions in the aggregate as well as the sectoral GDP series have been recently examined (Sapre and Sengupta, 2017). The study finds that indicator based advance estimates released by the CSO usually tend to understate the growth of the Indian economy.
III. Release and Revision of National Accounts Data by CSO
The CSO is the nodal agency for releasing data related to national income, consumption expenditure, savings and capital formation since 1956. The AEs of national income were introduced in the year 1993 and quarterly estimates in the year 1999. The AEs, which are fresh data based on the benchmark indicator method4, are revised by following a well laid out plan as and when more concrete data are obtained (Table 1).
| Table 1: Release Calendar and Revision Policy of GDP Estimates |
| First Advance Estimates (FAE) |
January 07
(T - 83 days) |
Benchmarked to Provisional Estimates of previous year. Estimates obtained by extrapolation using data available for 7/8 months. |
| First Revised Estimates (FRE) for previous year |
January 31
(T + 10 months) |
Detailed Estimates of various sectors is available. Estimates of savings, disposable income and capital formation are also provided. |
| Second Advance Estimates (SAE) / Third Quarter Estimates |
February 28
(T - 1 month) |
Benchmarked to First Revised Estimates of previous year. Estimates obtained by extrapolation using data available for 9 months. |
| Provisional Estimates (PE) / Fourth Quarter Estimates |
May 31
(T + 2 months) |
Based on indicators which now become available for the whole of financial year. |
| First Revised Estimates |
January 31
(T + 10 months) |
Revised Estimates of Budgets of Central and State Governments are available. Information of 42 crops, horticulture, animal husbandry and forestry are used. |
| Second Revised Estimates |
January 31
(T + 22 months) |
Figures available from actual expenditure of Central and State Government budgets along with data from Annual Survey of Industries. |
| Third Revised Estimates |
January 31
(T + 34 months) |
Improved coverage of central and state Government accounts, accounts of public and private corporations and accounts of local bodies. |
| T: Date of end of financial year. In India, the financial year runs from April 1 to March 31. |
Following the FAE release on January 5, 2018 (real GDP growth rate at 6.5 per cent for 2017–18), the CSO on January 31, 2018 brought out its first revised estimates (FRE) for 2016–17 (unchanged at 7.1 per cent) along with second revised estimates for 2015–16 (revised upwards by 20 basis points to 8.2 per cent) and third revised estimates for 2014–15 (revised downwards by 10 basis points to 7.4 per cent) (Table 2). With the FRE for 2016–17, the base for FAE for 2017–18 growth rates also got revised. In view of multiple rounds of data revision, it may be confusing for data users to decide on the true state of the economy, and, more specifically, the real strength of the growth momentum. The dilemma/confusion regarding the reliability of data is usually the greatest around the release of advance estimates, which is generally understood to be tentative and liable to change with the arrival of subsequent firmer datasets. The FAE for 2017-18 released on January 5, 2018 will get crystallised in the Third Revised Estimate to be released on January 29, 2021. As per the practice, the latest estimate overwrites all the previous estimates.
| Table 2: Sequence of Release in National Accounts Aggregates |
| GDP at Market Prices (in per cent) |
| |
FAE |
SAE |
PE |
FRE |
SRE |
TRE |
| 2017-18 |
6.5 |
6.6 |
- |
- |
- |
- |
| 2016-17 |
7.1 |
7.1 |
7.1 |
7.1 |
- |
- |
| 2015-16 |
7.6 |
- |
7.6 |
7.9 |
8.2 |
- |
| 2014-15 |
7.4 |
- |
7.3 |
7.2 |
7.2 |
7.4 |
| GVA at Basic Prices (in per cent) |
| 2017-18 |
6.1 |
6.4 |
- |
- |
- |
- |
| 2016-17 |
7.0 |
6.7 |
6.6 |
7.1 |
- |
- |
| 2015-16 |
7.3 |
- |
7.2 |
7.8 |
8.1 |
- |
| 2014-15 |
7.5 |
- |
7.2 |
7.1 |
6.9 |
7.2 |
| FAE: First Advance Estimates; SAE: Second Advance Estimates; PE: Provisional Estimates; FRE: First Revised Estimates; SRE: Second Revised Estimates; TRE: Third Revised Estimates. |
IV. Statistical Analysis of Revisions
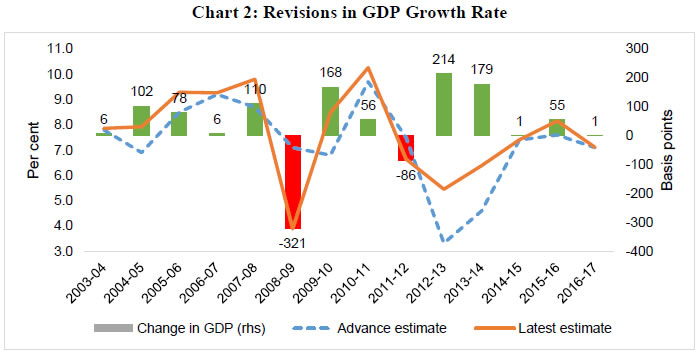
In view of the above, we have analysed the CSO’s data releases from 2003–04 onwards for annual data, and from 2002–03 onwards for quarterly data. It can be observed that during this period, the CSO revised real GVA growth estimates relative to AEs upwards in ten years, and downwards in the remaining four years (Chart 1). Average upward revision was of the order of 70 basis points, while it was only 27 basis points in the case of downward revisions. In the case of real GDP, AEs were revised upwards in twelve years (average of 81 basis points), and only in two years were there revisions in a downward direction (average of 204 basis points) (Chart 2).
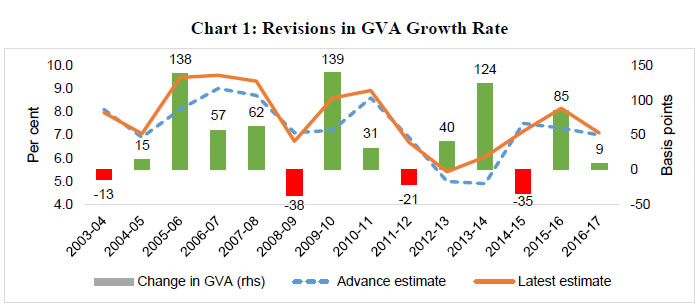
 Importantly, we also observe a ‘bias’ in revisions at the turning points of the growth cycle possibly due to the methodology used by the CSO as the sector-wise estimates are obtained using benchmark indicator approach by linear extrapolation5. The sector-wise estimates are obtained by extrapolation using, among others, the following indicators: (i) Index of Industrial Production (IIP) of first seven months of the financial year; (ii) Financial performance of listed companies in the private corporate sector for two quarters up to September; (iii) FAE of crop production; (iv) Accounts of central and state governments for the last seven to eight months; (v) Information on indicators like deposit and credit, passenger and freight earnings of railways, passengers and cargo handled by civil aviation, cargo handled at major sea ports, sales of commercial vehicles, etc., available for the first seven to eight months of the financial year.
We observe that at the ‘upturns’ in the Indian economy during 2005-06 and 2009-106 and the downturn of 2008-09, which coincided with the global financial crisis (GFC), there have been huge revisions in the subsequent estimates. In 2005-06, the AE of real GVA growth at 8.1 per cent was subsequently revised upward to 9.5 per cent (an underestimation of around 140 basis points). Similarly, in 2009-10, the CSO revised the AE real GVA growth of 7.2 per cent to 8.6 per cent in its final estimates (an underestimation of around 140 basis points). On the other hand, for 2008-09, the CSO revised real GDP growth downward from 7.1 per cent in AE to 3.9 per cent in final estimates (overestimation of around 320 basis points).
Furthermore, our analysis using a 2 x 2 tabulation reveals that the upward and downward ‘biases’ are more visible at the ‘threshold’ of 6.0 per cent GVA growth (Table 3). It is observed that out of 46 quarters registering growth higher than the ‘threshold’ (i.e., 6.0 per cent ), there was an upward ‘bias’ in GVA growth revisions (GVA growth rate was revised upward on 40 occasions and downward on only 6 occasions). Similarly, below the ‘threshold’, we observe a downward bias in GVA growth revisions (downward revisions on 11 occasions, and upward revision on only 3 occasions).
| Table 3: Pattern of GVA Growth Rate and Revisions |
| (in counts) |
| |
Revisions |
| Upward |
Downward |
| Growth Rate |
Greater than 6.0 per cent |
40 |
6 |
| Lower than 6.0 per cent |
3 |
11 |
An analysis of components of GVA shows that there had been significant revisions in three sectors, namely ‘mining and quarrying, ‘manufacturing’ and ‘financial, real estate and professional services’ (Table 4). Of all the sectors, the maximum revision took place in the ‘mining and quarrying’ sector (upward revision of 234 basis points) at the annual level. At the quarterly level, the maximum revision was observed in respect of the manufacturing sector (upward revision of around 210 basis points) which constitutes around one-fifth of the GVA.
| Table 4: Test of Equality of Mean and Median of Differences in First and Last Estimates of Real GVA/GDP Growth |
| (in percentage points) |
| |
Annual Revisions (14 years) |
Quarterly Revisions (60 quarters) |
| Variable |
Share in 2016-17 |
Mean |
Median |
Mean |
Median |
| GDP |
|
0.41 |
0.56 |
|
|
| GVA |
|
0.43 |
0.37 |
0.55 *** |
0.54 *** |
| Agriculture, forestry and fishing |
15.3 |
0.84 |
0.99 |
0.34 |
0.74 * |
| Mining and quarrying |
3.3 |
2.34 |
1.18 |
1.97 *** |
0.58 *** |
| Manufacturing |
18.2 |
2.06 |
1.75 |
2.09 *** |
1.13 *** |
| Electricity, gas, water supply and other utility services |
2.2 |
-0.20 |
-0.36 |
0.35 |
0.45 * |
| Construction |
7.8 |
1.34 |
0.51 |
0.75 |
0.60 |
| Trade, hotels, transport, communication and services related to broadcasting |
19.0 |
0.47 |
0.87 |
0.34 |
0.64 |
| Financial, real estate and professional services |
21.7 |
0.49 |
0.43 |
1.08 *** |
1.23 *** |
| Public administration, defence and other services |
12.6 |
-1.31 |
-0.81 |
-0.46 |
-1.10 ** |
Notes: 1. ***, ** and * indicates statistical significance at 1%, 5% and 10%, respectively.
2. Wilcoxon signed-rank test7 has been performed for median.
3. H0 = 0 and H1 ≠ 0 |
The CSO started releasing component-wise AEs data on the expenditure side aggregates of GDP from 2007–08 onwards. We have analysed annual data from 2007–08 onwards, and quarterly data from 2009–10 onwards. An analysis of its major components shows that there were significant upward revisions in quarterly data of ‘private final consumption expenditure (PFCE)’ (131 basis points) and ‘exports of goods and services’ (359 basis points) which constitute around 56 per cent and 20 per cent, respectively, of the GDP (Table 5).
| Table 5: Test of Equality of Mean and Median of Differences in First and Last Estimates of Real GDP Growth from the Expenditure Side |
| (in percentage points) |
| |
Annual Revisions (10 years) |
Quarterly Revisions (32 quarters) |
| Variable |
Share in 2016-17 |
Mean |
Median |
Mean |
Median |
| GDP |
|
0.38 |
0.56 |
0.71 ** |
0.36 ** |
| Private final consumption expenditure |
55.9 |
1.56 |
1.14 |
1.31 ** |
1.19 ** |
| Government final consumption expenditure |
10.3 |
-0.92 |
0.41 |
-0.12 |
2.49 |
| Gross fixed capital formation |
31.1 |
1.96 |
1.91 |
2.89 * |
0.80 |
| Change in stocks |
0.7 |
-7.39 |
-29.17 |
-3.65 |
-21.82 |
| Valuables |
1.3 |
8.23 |
4.09 |
9.31 |
6.22 |
| Exports of goods and services |
20.4 |
1.97 |
1.29 |
3.59 * |
2.04 * |
| Imports of goods and services |
21.4 |
2.99 |
2.43 |
15.33 |
2.67 ** |
| Discrepancies |
1.6 |
399.70 |
-46.67 |
-21.62 |
-96.68 |
Notes: 1. ***, ** and * indicates statistical significance at 1%, 5% and 10%, respectively.
2. Wilcoxon signed-rank test has been performed for median.
3. H0 = 0 and H1 ≠ 0 |
V. Conclusion
This study documents that on most occasions, the earlier releases underestimate real GVA and real GDP growth. This is mainly because firmer data are captured in successive rounds of revisions accompanied with gradual increase in data coverage. More importantly, we observe a bias when the growth cycle ‘turns’. As discussed above, there were substantial upward revisions in the years coinciding with the ‘upturns’ in the Indian economy, i.e., during 2005-06 and 2009-10, and a huge downward revision in the year of the global financial crisis, i.e., 2008-09. Furthermore, at the component level, ‘mining and quarrying’, ‘manufacturing’ and ‘private final consumption expenditure (PFCE)’ show significant revisions in subsequent releases relative to AEs. Improved data coverage over time is a major driving factor in the case of the manufacturing sector with information on corporate value added substituted by data from Annual Survey of Industries (ASI).
It may be advisable for data users to read GDP growth numbers carefully along with other high frequency indicators of the real economy. For example, just two days after the release of first advance estimates (FAE), i.e., on January 7, 2018, the Ministry of Agriculture and Farmers Welfare issued a press release expressing optimism about upward revisions in output of ‘agriculture, forestry and fishing’ sector. Furthermore, corporate results of the ‘early birds’ showed encouraging operating performance for 2017–18:Q3 and other new data arrivals for December 2017 were positive for industrial production, specially manufacturing. After a period of prolonged weakness, cement production registered robust growth in November-December 2017, along with continuing healthy growth in steel production. In the services sector, some of the high frequency indicators, such as commercial vehicle sales, domestic and international air passenger traffic and foreign tourist arrivals, grew at a fast pace in November-December 2017. CSO may examine relationship of these indicators with GVA of respective sectors frequently and use the revised coefficients for computing FAE. Furthermore, these sets of new information can be incorporated in state-of-the-art methods such as “Nowcasting” to produce better (potentially unbiased) estimates of economic growth relative to simply employing the reported FAE.
References:
Sim, Benson, Modesta M. de Castro, and Melissa Pascua (2009), “An Analysis of Revisions to Annual GDP Estimates of Six ADB Regional Members”, ADB Economic Working Paper Series, No. 184, December.
Landefeld, J. Steven, Eugene P. Seskin, and Barbara M. Fraumeni (2008), “Taking the Pulse of the Economy: Measuring GDP”, Journal of Economic Perspectives, Vol. 22, No. 2, pp. 193–216.
Shrestha, Manik and Marco Marini (2013), “Quarterly GDP Revisions in G-20 Countries: Evidence from the 2008 Financial Crisis”, International Monetary Fund Working Paper No. 13/60, 7 March.
Saprey, Amey and Rajeshwari Sengupta (2017), “An Analysis of Revisions in Indian GDP Data”, NIPFP Working Paper Series WP-213-2017, November.
|