Across the world, central banks, governments and financial regulators mobilised a war effort to contain the adverse impact of COVID-19. In India, banks were cushioned by policy support and were able to bolster their capital positions during 2020-21. Stress tests indicate that banks remain well capitalised and able to sustain a severe stress scenario. Financial network analysis for March 2021 reveals that outstanding bilateral exposures among the entities in the financial system grew, led by increased exposures of banks to NBFCs / HFCs, and of mutual funds to the financial system. Joint solvency-liquidity contagion analysis indicates a decline in the losses to the banking system due to idiosyncratic failure of banks. Introduction 2.1 The COVID-19 pandemic has increased the risks to financial stability, especially when the unprecedented measures taken to mitigate the pandemic’s destruction are normalised and rolled back. A key desideration will be the strength and durability of the economic recovery. Central banks across the world are bracing up to deal with the expected deterioration in asset quality of banks in view of the impairment to loan servicing capacity among individuals and businesses. 2.2 The initial assessment of major central banks is that while banks’ financial positions have been shored up, there has been no significant rise in non-performing loans (NPLs) and policy support packages helped in maintaining solvency and liquidity (Table 2.1). The economic recovery, however, remains fragmented and overcast with high uncertainty. | Table 2.1: Stress Test Results of COVID-19 pandemic by Central Banks (Contd.) | | Central Bank | Earlier Assessment | Latest Position | | Bank of England (BoE) | BoE’s ‘Desktop’ stress test in the Interim FSR (May 2020) projected that, under appropriately prudent assumptions, aggregate CET-1 capital ratio of banks would decrease from 14.8 per cent at end-2019 to 11.0 per cent by the second year of test scenario (i.e., 2021) and banks would remain well above their minimum regulatory capital requirements. | The CET-1 capital ratio increased to 15.8 per cent over the course of 2020. | | De Nederlandsche Bank (DNB) | In the DNB’s FSR for Spring 2020, the CET-1 ratio was projected to deplete from 16.5 per cent at the onset on the pandemic to 11.0 per cent by end 2022. | The CET1 ratio improved during the crisis to 17.3 per cent by end-2020. | | European Central Bank (ECB) | In its COVID-19 vulnerability analysis results (June 2020) for 86 banks comprising about 80 per cent of total assets in the Euro Area, the ECB estimated that banks’ aggregate CET-1 ratio would deplete by 1.9 percentage points to 12.6 per cent under the central scenario, and by 5.7 percentage points to 8.8 per cent under the severe scenario by end-2022. | The CET-1 ratio of Euro area banks on aggregate improved to 15.4 per cent in 2020. | | Reserve Bank of New Zealand (RBNZ) | In its FSR of May 2020, the RBNZ anticipated (a) elevated level of impairment during the course of the pandemic from the prevailing GNPA ratio of 0.62 per cent and (b) banks’ capital to fall below their minimum regulatory capital requirements in the very severe stress scenario. | As per its FSR of May 2021, the pandemic has had only a limited impact on the financial system soundness, due to government support as well as banks’ strong capital and liquidity buffers.
The GNPA ratio reduced to 0.57 per cent whereas profitability and restrictions on dividend distribution facilitated banks in building up capital, raising the Tier-I capital ratio from 13.6 to 14.7 per cent. | | US Federal Reserve | In its June 2020 stress test and additional analysis in the light of the COVID-19 event, the US Fed found that banks generally had strong levels of capital, but considerable economic uncertainty remained. It projected that, under severely adverse scenario, the CET-1 ratio of large banks would decline from an average starting point of 12.0 per cent in the fourth quarter of 2019 to 10.3 per cent in first quarter of 2022. | CET-1 ratio for large banks increased to 13.0 per cent as at end-2020. |
2.3 This chapter presents an evaluation of the soundness and resilience of the financial intermediaries in India by analysing their recent performance as reflected in audited balance sheets and offsite returns. Section II.1 provides an assessment of recent performance, asset quality, capital adequacy and risks for SCBs. It also examines their resilience against macroeconomic shocks through stress tests and sensitivity analysis. Sections II.2 and II.3 cover the recent performance and the results of stress tests on scheduled urban cooperative banks (SUCBs) and NBFCs. The concluding Section II.4 presents a detailed analysis of the network structure and connectivity of the Indian financial system and the results of contagion analysis under adverse scenarios. II.1 Scheduled Commercial Banks1 2 2.4 Aggregate deposits of SCBs rose 11.9 per cent y-o-y during 2020-21, but they have moderated during 2021-22 so far, growing by 9.7 per cent by June 4, 2021 (Chart 2.1 a). Current account and savings account (CASA) deposits grew at a faster pace than term deposits, possibly reflecting the propensity of savers to hold more liquid assets in the highly uncertain pandemic situation (Chart 2.1 b). 2.5 Bank credit growth remains subdued. During 2020-21, bank credit increased by 5.4 per cent (y-o-y), which was the lowest in the last four financial years (Chart 2.1 a) and it remains subdued in Q1:2021-22 (up to June 4). Credit by public sector banks (PSBs) and private sector banks (PVBs) increased by 3.2 per cent and 9.9 per cent (y-o-y), respectively, whereas the loan book of foreign banks (FBs) remained flat as on June 4, 2021. The overall credit to deposit (C-D) ratio continued on its declining trajectory. The incremental C-D ratio recorded an improvement during Q4:2020-21 (Chart 2.1 c) but turned negative in Q1:2021-22 (up to June 4). 2.6 Agriculture and personal loan3 books remained bright spots and recorded double digit growth in March 2021 (Chart 2.1 d). Since then (till April 2021), however, loans to these sectors have contracted by less than one per cent. In the personal loan category, housing and vehicle loans witnessed encouraging growth; vehicle loan growth exceeded its pre-COVID-19 levels for both PSBs and PVBs (Chart 2.1 e). SCBs’ credit outstanding to the industrial sector, which had contracted over the past five quarters (Chart 2.1 d), turned a corner during Q4:2020-21 but the sector’s share in total credit declined during the year (Chart 2.1 f). Growth in bank loans to the services sector remained tepid across all bank groups since the onset of the pandemic and slipped into negative zone in Q4:2020-21, with PSBs being the major contributors to the fall (Chart 2.1 d). In 2021-22 so far (till April 2021), outstanding loans to the services sector have contracted by more than one per cent as compared to end-March 2021 level. 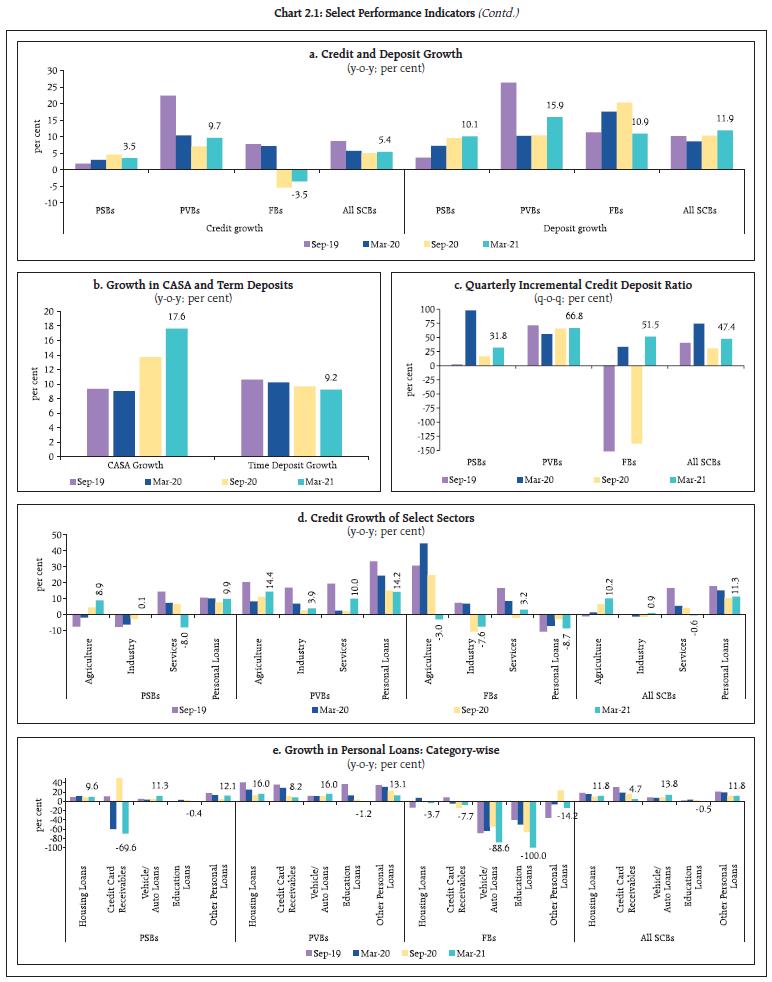
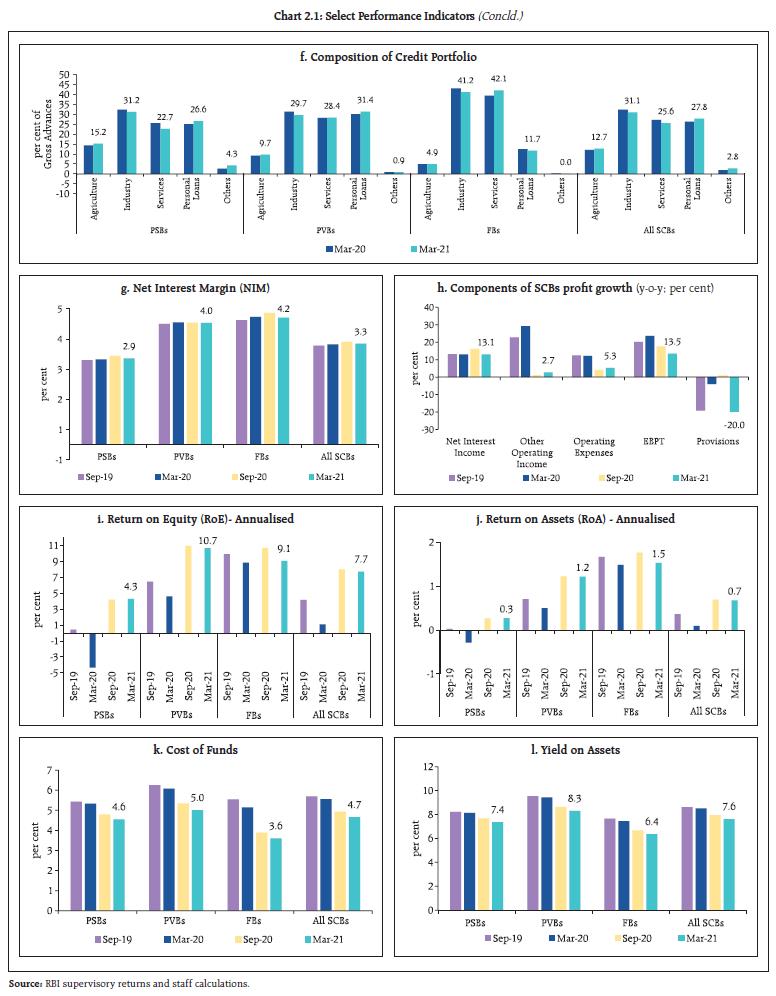 2.7 New loans extended by SCBs showed recovery in the second half of 2020-21, especially for agricultural and personal purposes (Table 2.2). New loans to the private corporate and household sectors, which nosedived during the first half, recovered in the subsequent period. Loan demand exhibited signs of revival during Q4:2020-21, especially in the share of new loans in total loans. 2.8 During 2020-21, the net interest margin (NIM) of SCBs stood at 3.3 per cent, similar to the previous year (Chart 2.1 g). The amount of provisions made during 2020-21 declined by 20 per cent (y-o-y), with risk provisions falling by 28.1 per cent. Net interest income (NII) of SCBs clocked a 13.1 per cent increase (y-o-y) in March 2021 (Chart 2.1 h). The return on assets (RoA) and return on equity (RoE) maintained their positive upturn, with PSBs recording multi-year highs whereas these ratios dipped marginally for PVBs and FBs on a sequential basis (Chart 2.1 i and Chart 2.1 j). 2.9 Further easing of monetary conditions since the onset of the pandemic was transmitted to the spectrum of interest rates. The cost of funds and yield on assets declined across bank groups to reach their lowest levels in the last two decades (Chart 2.1 k and l). | Table 2.2: Growth in New Loans by SCBs: Economic Sectors and Organisations* | | (per cent) | | Sector | Q4: 2019-20 | Q1: 2020-21 | Q2: 2020-21 | Q3: 2020-21 | Q4: 2020-21 | | Growth (Y-o-Y) | | Economic sector wise | | Agriculture | -2.0 | -22.3 | 18.0 | 4.8 | 20.5 | | Industry | 19.3 | -20.2 | -15.4 | 15.0 | -8.6 | | Services | 14.3 | -12.3 | -9.8 | -0.6 | 4.1 | | Personal loans | 11.3 | -59.1 | 4.2 | 10.6 | 35.5 | | Organisation wise | | Public sector | 36.9 | 1.4 | 26.8 | 8.4 | -11.5 | | Private corporate sector | 4.8 | -21.6 | -28.9 | 8.7 | 2.9 | | Household sector | 3.8 | -43.5 | 5.9 | 5.1 | 26.3 | | of which, Individuals | 8.0 | -50.1 | 3.8 | 4.7 | 27.4 | | Other sectors | 4.4 | 2.1 | 2.8 | 15.5 | -26.4 | | All new loans | 11.4 | -24.6 | -7.4 | 7.3 | 6.0 | | New loans in total loans (Share) | 16.6 | 10.9 | 14.4 | 15.1 | 16.7 | Note: * excluding regional rural banks (RRBs).
Source: Basic Statistical Returns -1, RBI. | II.1.1 Asset Quality and Capital Adequacy 2.10 With the asset classification standstill lifted in March 2021, a clearer picture of the quality of banks’ balance sheets has emerged. SCBs’ gross non-performing assets (GNPA) and net NPA (NNPA) as ratios of gross advances settled at 7.5 per cent and 2.4 per cent, respectively at the end of March 2021 (Charts 2.2 a and b). Furthermore, banks’ resort to restructuring under the COVID-19 resolution framework was not significant (Chart 2.2 c) and write-offs as a percentage of GNPA at the beginning of the year, fell sharply as compared to 2019-20, except for PVBs (Chart 2.2 d). Overall, GNPAs declined by 5.9 per cent, mainly due to a fall of 8.4 per cent in bad loans of PSBs (Chart 2.2 e).
2.11 The annual slippage ratio of all SCBs, measuring new accretions to NPAs as a share of standard advances at the beginning of the year, fell to 2.5 per cent in 2020-21, but rose for FBs (Chart 2.2 f). 2.12 SCBs’ overall NPA provisions contracted by 2.2 per cent (y-o-y) in March 2021, with the decline being accounted for in varying degrees by all bank groups (Chart 2.2 g). The provisioning coverage ratio (PCR) - the proportion of provisions (without write-offs) held for NPAs to GNPA - increased from 66.2 in March 2020 to 68.9 per cent in March 2021, primarily due to a relatively higher decline in GNPA. The PCR for PSBs increased, but declined for PVBs and FBs during the year (Chart 2.2 h). 2.13 Banks were able to bolster their capital positions during 2020-21 by raising equity through various modes, such as preferential allotment, qualified institutional placement (QIP), public issue, and capital infusion by the Government of India as well as through retention of profits. As a result, the capital to risk-weighted assets ratio (CRAR) of SCBs increased by 130 bps from 14.7 per cent in March 2020 to 16.0 per cent in March 2021, with PVBs improving their ratios even further (Chart 2.2 i). The tier-I leverage ratio, which is the ratio of tier 1 capital to total assets, improved marginally to 7.4 per cent in March 2021 from 6.9 per cent in March 2020, contributed by PVBs and FBs (Chart 2.2 j). II.1.2 Sectoral Asset Quality 2.14 SCBs’ GNPA ratios for two major sectors, viz., agriculture and industry declined during 2020-21, but rose for the personal loan sector (Chart 2.3 a). Within the industrial sector too, the ratio reduced for all the sub-sectors in March 2021 relative to a year ago (Chart 2.3 b). II.1.3 Credit Quality of Large Borrowers7 2.15 The share of large borrowers in the aggregate loan portfolio of SCBs stood at 52.7 per cent in March 2021, but they accounted for a share of 77.9 per cent of the total GNPAs (73.5 per cent in September 2020) (Chart 2.4 a). 2.16 The GNPA ratio for large borrowers declined across all categories of banks during H2:2020-21 (Chart 2.4 b) though there was a sequential uptick in the growth of loans in the SMA-18 category. SMA-2 category loans registered a sharp contraction after a significant chunk was recognised as NPAs following vacation of the freeze on asset classification (Chart 2.4 c). Even so, SMA-2 ratios of large borrowers of both PSBs and PVBs were higher vis-à-vis in March 2020 and in September 2020 (Chart 2.4 d). The share of the top 100 large borrowers in aggregated SCBs’ GNPAs declined y-o-y, but with a rising profile during 2020-21 (Chart 2.4 e). II.1.4 Resilience – Macro Stress Tests 2.17 The resilience of SCBs’ balance sheets to unforeseen shocks emanating from the macroeconomic environment has been assessed through macro-stress tests. By design, these stress tests have simulated hypothetical adverse configurations of the underlying macroeconomic conditions and their results are presented as stringent conservative assessments. In essence, capital and impairment ratios are simulated over a one-year horizon under a baseline, and two adverse (medium and severe) scenarios. It is emphasised that model outcomes do not amount to forecasts. They are indicative of the possible economic impairment latent in banks’ portfolios, with implications for capital planning. 2.18 The baseline scenario is derived from the steady state values of macroeconomic variables9 and indicates the central path. The medium and severe adverse scenarios were arrived at by applying 0.25 to one standard deviation (SD) and 1.25 to 2 SD negative shocks, respectively, to each of the macroeconomic variables, increasing the shocks by 25 basis points for each successive quarter (Chart 2.5). 2.19 The stress test results published in the FSR January 2021 were arrived at by employing an estimation process using slippage ratios and GNPA ratios for December 2019 as the starting point, as data for the quarter ended September 30, 2020 had been affected by the standstill on asset classification. With the vacation of standstill on asset classification in March 2021 and the data reflecting the updated asset quality position being available, stress tests presented here are based on the regular methodology (Annex 2), with the exception that reported slippages for Q4:2020-21 have been distributed between Q3 and Q4 to offset the incidence of the entire slippage resulting from removal of asset classification standstill on the results for Q4 alone. 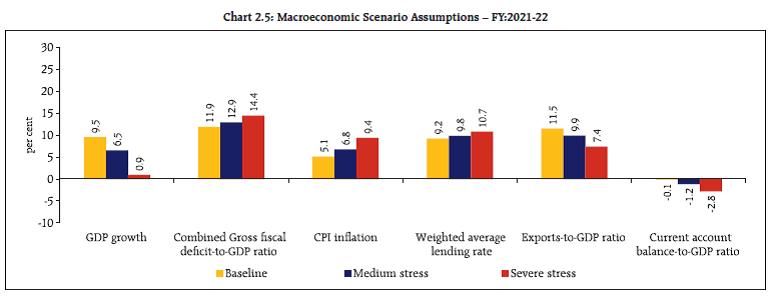
 2.20 The stress tests indicate that the GNPA ratio of all SCBs may transition to 9.80 per cent in the baseline scenario by March 2022 and can increase to 10.36 per cent and 11.22 per cent under the two stress scenarios defined earlier (Chart 2.6). Within the bank groups, PSBs’ GNPA ratio of 9.54 per cent in March 2021 edging up to 12.52 per cent by March 2022 under the baseline scenario is an improvement over earlier expectations and indicative of pandemic proofing by regulatory support. For PVBs and FBs, the transition of the GNPA ratio from baseline to severe stress is from 5.82 per cent to 6.04 per cent to 6.46 per cent, and from 4.90 per cent to 5.35 per cent to 5.97 per cent, respectively. 2.21 Under the baseline and the two stress scenarios, the system level CRAR holds up well, moderating by 30 basis points between March 2021 and March 2022 under the baseline scenario and by 130 bps and 256 bps, respectively, under the two stress scenarios (Chart 2.7 a). All 46 banks would be able to maintain CRAR well above the regulatory minimum of 9 per cent as of March 2022 even in the worst case scenario (Chart 2.7 b).
2.22 The common equity Tier I (CET-1) capital ratio of SCBs may decline from 12.78 per cent in March 2021 to 12.58 per cent under the baseline scenario and further to 11.76 per cent and 10.73 per cent, respectively, under the medium and severe stress scenarios by March 2022 (Chart 2.8 a). Even under adverse scenarios, however, no bank is expected to face a decline of CET-1 capital ratio below the regulatory minimum of 5.5 per cent (excluding capital conservation buffer [CCB]) (Chart 2.8 b). II.1.5 Sensitivity Analysis10 2.23 Top-down11 sensitivity analysis involving several single-factor shocks12 to simulate credit, interest rate, equity price and liquidity risks under various stress scenarios13 are also carried out as a robustness check to assess the vulnerabilities of SCBs, based on March 2021 data. a. Credit Risk 2.24 Credit risk sensitivity has been analysed under two scenarios – the system-level GNPA ratio is assumed to rise in a quarter by (i) 1-SD14 and (ii) 2-SD from its current level. It is observed that under a severe shock of 2-SD, the GNPA ratio of 46 select SCBs moves up from 7.5 per cent to 13.3 per cent, while the system-level CRAR would decline from 15.8 per cent to 12.0 per cent and the Tier-1 capital ratio from 13.7 per cent to 9.9 per cent. The system-level capital impairment could be about 25.7 per cent (Chart 2.9 a). 2.25 A reverse stress test shows that it requires a shock of 4.3 SD to bring down the system-level CRAR to 9 per cent. 2.26 Bank-level stress test results show that under the 2-SD shock scenario, 14 banks with a share of 39 per cent in SCBs’ total assets may fail to maintain the regulatory minimum level of CRAR (Chart 2.9 b). The CRAR would fall below 7 per cent in case of 10 banks (Chart 2.9 c) and 10 banks would record a decline of over six percentage points in the CRAR. In general, PVBs and FBs would face lower erosion in their CRARs than PSBs under both scenarios (Chart 2.9 d). b. Credit Concentration Risk 2.27 Stress tests on banks’ credit concentration – considering top individual borrowers according to their standard exposures – shows that in the extreme scenario of the top three individual borrowers of the banks under consideration failing to repay15, no bank will face a situation of fall in CRAR below the regulatory requirement of 9 per cent, although 37 banks would experience a decline of more than one percentage point in their CRARs (Chart 2.10 a and b). 2.28 Under the extreme scenario of the top three group borrowers in the standard category failing to repay16, the worst impacted four banks would have CRARs in the range of 10 to 11 per cent (Chart 2.11 a) and 39 banks would experience a decline in CRAR of more than one percentage point (Chart 2.11 b). 2.29 In the extreme scenario of the top three individual stressed borrowers of these banks failing to repay17, a majority of the banks would experience a reduction of 10 to 20 bps only in their CRARs on account of low level of stressed assets in March 2021 (Chart 2.12). c. Sectoral Credit Risk 2.30 Shocks applied on the basis of volatility of industry sub-sector wise GNPA ratio indicate varying magnitudes of increases in banks’ GNPAs. A 2-SD shock to the segments of infrastructure-energy and basic metals and metal products would reduce the system-level CRAR by 17 bps and 16 bps, respectively (Table 2.3). | Table 2.3: Decline in System Level CRAR | | (basis points, in descending order for top 10 most sensitive sectors) | | Sector | 1-SD | 2-SD | | Infrastructure - Energy (71%) | 9 | 17 | | Basic Metal and Metal Products (115%) | 9 | 16 | | Infrastructure - Transport (38%) | 3 | 7 | | Engineering (40%) | 3 | 4 | | Textiles (34%) | 2 | 4 | | Construction (26%) | 2 | 3 | | Food processing (26%) | 2 | 3 | | Infrastructure - Communication (40%) | 1 | 2 | | Vehicles, vehicle parts and transport equipments (95%) | 1 | 2 | | Petroleum (non-infra), coal products (non-mining) and nuclear fuels (92%) | 1 | 2 | Note: 1. For a system of select 46 banks.
2. Figures in parentheses represent the growth in GNPAs of that sub-sector due to 1-SD shock to the sub-sector’s GNPA ratio.
Source: RBI supervisory returns and staff calculations | d. Interest Rate Risk 2.31 The market value of investments subject to fair value for the current sample of SCBs stood at ₹19.1 lakh crore in March 2021, down from the high reached in September 2020 (Chart 2.13). About 95 per cent of these investments were classified as available for sale (AFS) and remaining as held for trading (HFT). 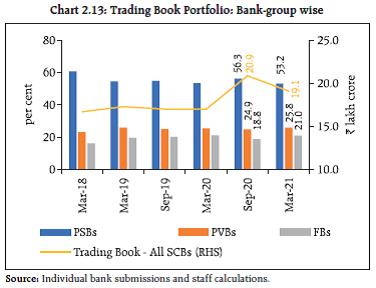 2.32 The sensitivity (PV0118) of the AFS portfolio increased marginally vis-à-vis the December 2020 position at an aggregate level, driven by FBs registering a 9.5 per cent increase whereas PSBs as well as PVBs saw a decline in their PV01 values. Some positioning in the greater than 10-year segment by FBs involved bonds held as cover for hedging derivatives, which may not be active contributors to PV01 risk. In terms of PV01 curve positioning, the tenor-wise distribution in PSBs indicated a flattening bias in the greater than 10-year maturity bucket relative to the 5-10 year tenor, whilst PVBs’ sensitivity increased at both the tails. The FBs further built upon their view on the long end of the curve, with an enhanced share in the greater than 10-year bucket (Table 2.4). | Table 2.4: Tenor-wise PV01 Distribution of AFS Portfolio | | (in per cent) | | | Total (in ₹ crore) | < 1 year | 1 year-5 year | 5 year-10 year | > 10 years | | PSBs | 227.9 (232.4) | 7.0 (7.5) | 38.3 (38.5) | 38.4 (40.8) | 16.3 (13.2) | | PVBs | 64.9 (65.1) | 17.0 (14.5) | 54.9 (55.0) | 22.0 (26.5) | 6.1 (4.0) | | FBs | 110.6 (101.0) | 3.1 (3.4) | 32.6 (38.9) | 10.8 (11.3) | 53.4 (46.3) | Note: Values in the brackets indicate December 2020 figures.
Source: Individual bank submissions and staff calculations. | 2.33 Trading profits reduced in absolute as well as percentage terms across all bank groups during Q4:2020-21 (both q-o-q and y-o-y basis), driven by yield curve movements (Table 2.5 and Chart 2.14). An increase in PV01 sensitivity and adverse movement of the yield curve, if any, may affect banks’ trading profit going forward. Nevertheless, the Government Securities Acquisition Program (G-SAP 1.0) conducted during April-June 2021 and G-SAP 2.0 announced on June 4, 2021 for Q2:2021- 22 along with the enhanced HTM limit permitted by the Reserve Bank on February 5, 2021 should help cushion mark-to-market (MTM) losses for banks. | Table 2.5: OOI - Profit/(Loss) on Securities Trading | | (in ₹ crore) | | | Mar-20 | Jun-20 | Sep-20 | Dec-20 | Mar-21 | | PSBs | 8,270
(21.5%) | 10,082
(22.9%) | 6,847
(14.9%) | 9,055
(18.4%) | 5,112
(10.5%) | | PVBs | 4,185
(8.6%) | 9,883
(22.3%) | 4,523
(10.3%) | 4,825
(10.1%) | 2,495
(5.3%) | | FBs | 229
(2.6%) | 1,731
(18.3%) | 622
(5.8%) | 12
(0.2%) | -203
(-1.8%) | Note: Figures in parentheses represents OOI-Profit/(Loss) as a percentage of Net Operating Income.
Source: RBI supervisory returns. |
2.34 The interest rate exposure of PVBs and FBs continued to be higher than that of PSBs in their HFT portfolios relative to their AFS book. The tenor-wise PV01 distribution for PVBs and FBs showed a pronounced shift to shorter tenor exposures (Table 2.6). PV01 of PSBs was almost entirely concentrated in the 5-10 year segment, although their total PV01 sensitivity remained small. | Table 2.6: Tenor-wise PV01 Distribution of HFT portfolio | | (in per cent) | | | Total (in ₹ crore) | < 1 year | 1 year- 5 year | 5 year- 10 year | > 10 years | | PSBs | 0.2 (0.8) | 4.8 (3.7) | 1.3 (14.9) | 93.9 (35.4) | 0.0 (46.0) | | PVBs | 8.1 (12.3) | 16.3 (2.5) | 49.5 (58.2) | 24.2 (25.9) | 10.0 (13.4) | | FBs | 11.1 (8.2) | 3.2 (4.4) | 47.9 (12.9) | 47.8 (62.7) | 1.2 (20.0) | Note: Values in the brackets indicate December 2020 figures.
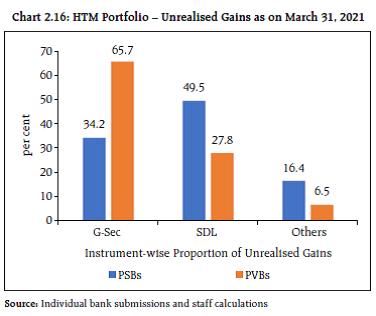
Source: Individual bank submissions and staff calculations. | 2.35 Any hardening of interest rates would depress investment income under the AFS and HFT categories (direct impact). It is assessed that a parallel upward shift of 2.5 percentage points in the yield curve would lower the system level CRAR by 84 bps and system level capital would decline by 6.3 per cent (Table 2.7). | Table 2.7: Interest Rate Risk – Bank-groups - Shocks and Impacts | | (under shock of 250 basis points parallel upward shift of the INR yield curve) | | | Public Sector Banks | Private Sector Banks | Foreign Banks | All SCBs | | AFS | HFT | AFS | HFT | AFS | HFT | AFS | HFT | | Modified Duration | 2.2 | 2.5 | 1.5 | 1.5 | 3.2 | 2.2 | 2.2 | 1.9 | | Reduction in CRAR (bps) | 87 | 37 | 264 | 84 | | Source: Individual bank submissions and staff calculations | 2.36 In March 2021, PSBs and PVBs preferred to augment their allocation of HTM investments from G-Secs through SDLs, whereas FBs maintained their portfolio in G-Secs alone (Chart 2.15). The unrealised gains of PSBs were disproportionately concentrated in SDLs, while those of PVBs were mostly in G-Secs, in line with their holdings (Chart 2.16). The Reserve Bank’s G-SAP 2.0 will allow an additional window for banks, particularly PSBs, to crystallise their SDL gains. 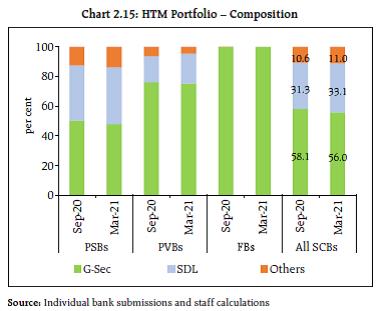
 2.37 Since October 2020, banks have been permitted to hold SLR securities acquired between September 1, 2020 and March 31, 2021 under the HTM category up to an overall limit of 22 per cent of their net demand and time liabilities (NDTL) up to March 31, 2022. This has been extended further to March 31, 2023 in relation to securities to be acquired between April 1, 2021 and March 31, 2022. PSBs’ holding of SLR securities in HTM amounted to 20 per cent of their NDTL in March 2021, while it stood at 18.8 per cent and 0.4 per cent for PVBs and FBs, respectively. e. Equity Price Risk 2.38 In this analysis, the impact of a significant fall in equity prices on banks’ CRAR is analysed. For the overall system, equity price risk is limited in view of banks’ low proportion of capital market exposures due to regulatory limits. Under the scenarios of 25 per cent, 35 per cent and 55 per cent drop in equity prices, the system level CRAR would decline by 22 bps, 31 bps and 49 bps, respectively (Chart 2.17). f. Liquidity Risk 2.39 Liquidity risk analysis aims to capture the impact of a possible run on deposits and increased demand for unutilised portions of sanctioned / committed / guaranteed credit lines. Accordingly, the assumed scenarios are that of increased withdrawals of un-insured deposits19 and a simultaneous increase in usage of the unutilised portions of sanctioned working capital limits as well as utilisation of credit commitments and guarantees extended by banks to their customers. In a scenario of sudden and unexpected withdrawals of around 15 per cent of deposits along with the utilisation of 75 per cent of unutilised portion of committed credit lines, 45 out of the 46 banks in the sample will remain resilient, using their HQLAs20 for meeting day-to-day liquidity requirements (Chart 2.18). II.1.6 Bottom-up Stress Tests: Credit, Market and Liquidity Risk 2.40 A series of bottom-up stress tests (sensitivity analyses) has been conducted for select banks21 with the reference date of March 31, 2021. The results testify to banks’ general resilience to different kinds of shocks and are in line with the findings from the top-down stress tests, in general. The average CRAR of banks would remain above the prescribed minimum of 9 per cent but stressed CRAR of three banks would fall below 9 per cent in a scenario of NPAs increasing by 50 per cent (Chart 2.19). 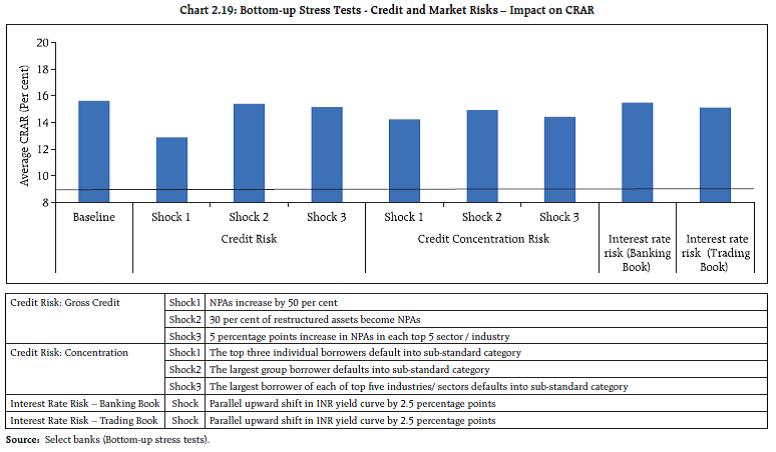 2.41 The bottom-up stress tests for liquidity risk performed on select banks indicate that they would have positive liquid assets ratios22 under the various alternative scenarios. High quality liquid assets (HQLAs) would enable banks in the sample to withstand liquidity pressures from sudden and unexpected withdrawal of deposits by depositors. Under all the scenarios, the average liquid asset ratios of the select banks are higher than under the exercise conducted in the FSR for July 2020 (Chart 2.20). II.1.7 Bottom-up Stress Tests: Derivatives Portfolio 2.42 A series of bottom-up stress tests (sensitivity analyses) on derivative portfolios of select banks23 was conducted, with the reference date as March 31, 2021. The banks in the sample reported the results of four separate shocks on interest and foreign exchange rates. The shocks on interest rates ranged from (+/-) 100 to 250 basis points, while 20 per cent appreciation/depreciation shocks were assumed for foreign exchange rates. The stress tests were carried out for individual shocks on a standalone basis. 2.43 Most of the FBs had significantly negative net mark-to-market (MTM) positions as proportions to CET-1 capital in March 2021. The MTM impact was largely muted in the case of PSBs and PVBs, except for one PVB (Chart 2.21). Such risks in derivatives portfolio are possibly residing on corporate balance sheets and it is recognised that they can only be transferred and not eliminated. An assessment of the inherent risks therefrom can be made from their hedging profile as given in their disclosures. 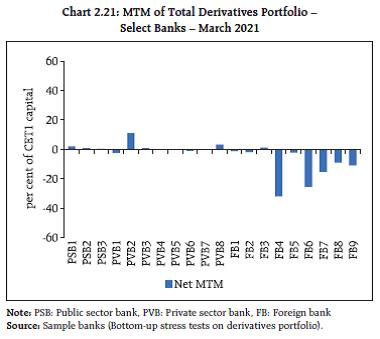 2.44 The stress test results indicate that derivatives exposure remains short in the interest rate segment, i.e., the selected banks gain on an average from an interest rate rise, which is similar to their positioning in recent times. As regards exposures to forex derivatives, they stand to benefit from INR depreciation and vice versa – a pay-off profile consistent with a short INR positioning (Chart 2.22). The pay-off profile both in respect of interest rate risk and foreign exchange risk remained asymmetric, with gains being significantly large relative to losses, possibly reflecting unrealised gains as on March 31, 2021. II.2 Scheduled Primary (Urban) Cooperative Banks 2.45 At the system level24, the GNPA ratio of scheduled primary (urban) cooperative banks (SUCBs) declined marginally from 10.4 per cent in September 2020 to 10.3 per cent in March 2021, while their provisioning coverage ratio25 ebbed from 65.1 per cent to 63.6 per cent over this period. The system-level CRAR of the SUCBs improved from 9.2 per cent in September 2020 level to 9.5 per cent in March 2021. SUCBs’ liquidity ratio26 climbed from 34.3 per cent to 35.4 per cent27. II.2.1 Stress Test – Credit Risk 2.46 The impact of credit risk shocks on the CRARs of SUCBs was simulated under four different scenarios28. Before application of any shock, four banks had CRARs below the regulatory minimum requirement of 9 per cent in March 2021. On application of a 2 SD shock to the GNPA ratio and classifying the incremental NPAs as sub-standard assets, the system-level CRAR declines to 9.1 per cent and one additional bank (five in all) fails to achieve the minimum CRAR requirement. A 2 SD shock to the GNPA ratio together with classifying additional NPAs as loss advances, results in the system-level CRAR dropping to 7.2 per cent and eight more SUCBs (twelve in all) recording CRARs below the regulatory minimum of 9 per cent (Chart 2.23). II.2.2 Stress Test - Liquidity Risk 2.47 Stress tests on liquidity carried out under two scenarios, viz., increase in cash outflows in the 1 to 28 days time bucket by i) 50 per cent; and by ii) 100 per cent, with cash inflows remaining unchanged, indicated that 17 and 30 SUCBs, respectively, (each including three SUCBs which were non-compliant even before application of the shock), may face liquidity stress29. II.3 Non-banking Financial Companies (NBFCs) 2.48 Credit extended by NBFCs rose 8.8 per cent (y-o-y) during 2020-21 after a deceleration in the preceding year that was marred by credit events in the sector and muted demand. Despite the pandemic conditions during the year, the GNPA ratio for the sector declined with a more than commensurate fall in the NNPA ratio attesting to higher provisioning, and capital adequacy improved marginally (Table 2.8). | Table 2.8: Asset Quality30 and CRARs31 of NBFCs | | (per cent) | | | GNPA Ratio | NNPA Ratio | CRAR | | Mar-2015 | 4.1 | 2.5 | 26.2 | | Mar-2016 | 4.5 | 2.5 | 24.3 | | Mar-2017 | 6.1 | 4.4 | 22.1 | | Mar-2018 | 5.8 | 3.8 | 22.8 | | Mar-2019 | 6.1 | 3.3 | 20.1 | | Mar-2020 | 6.8 | 3.4 | 23.7 | | Mar-202132 | 6.4 | 2.7 | 25.0 | | Source: RBI supervisory returns and staff calculations. | 2.49 NBFC-MFIs, which are primarily dependent on bank borrowings for funding, have been undergoing asset quality stress during the pandemic. Their GNPA ratio ballooned from 2.0 per cent of total advances in March 2020 to 4.9 per cent in March 2021 as business dislocation dampened recoveries. Furthermore, their SMA-2 advances increased from 0.2 per cent to 1.3 per cent of total advances. Decline in collection efficiency could impact the liquidity position of NBFC-MFIs negatively and have implications for the quality of their borrowings. II.3.1 Stress Test – Credit Risk 2.50 The resilience of the NBFC sector to credit risk shocks was assessed through system level stress tests conducted for a sample of 177 NBFCs33. Two scenarios were used, viz., medium and high risk involving increase in the GNPA ratio of the sector by 1 SD and 2 SD, respectively (Annex 2). 2.51 Under a high-risk shock of 2 SD, the GNPA ratio of the sector increases by more than one percentage point and the capital adequacy ratio declines marginally (Chart 2.24). 2.52 Capital adequacy ratios of seven NBFCs were below the minimum regulatory requirement of 15 per cent in March 2021. Under medium and high risk scenarios the system-level CRAR of 12.6 per cent and 14 per cent of NBFCs, respectively, would fall below the minimum regulatory requirements. II.4 Interconnectedness II.4.1 Network of the Financial System 34 35 2.53 A financial system network with financial institutions as nodes and bilateral exposures as links provides opportunities for investment, risk diversification, sourcing of funds and liquidity management. At the same time, however, the network exposes its constituents to negative externalities - spillovers and spillbacks - by creating channels through which shocks can spread, leading to contagion. The interconnectedness of financial institutions could amplify systemic shocks. For the analysis presented here, the coverage has been expanded relative to the previous issue of the FSR (January 2021) by including 31 additional entities. To this extent, data across the two periods may not be exactly comparable. 2.54 The total outstanding bilateral exposures36 among the entities in the financial system stabilised after a sharp fall during Q1:2020-21 following the onset of the COVID-19 pandemic (Chart 2.25 a). This was primarily due to increased37 exposures of SCBs to NBFCs and HFCs and of asset management companies - mutual funds (AMC-MFs) to the financial system. 2.55 SCBs had the largest bilateral exposures; however, their share declined by March 2021 on account of the shrinking inter-bank market while the share of NBFCs and HFCs rose sharply due to significant jump in their payables. Owing to the rallies in the equity markets, the share of AMC-MFs in bilateral exposures increased during 2020-21. On the other hand, the share of All-India Financial Institutions (AIFIs) and insurance companies went down marginally (Chart 2.25 b). 2.56 In terms of inter-sectoral38 exposures, AMC-MFs, followed by insurance companies, were the biggest fund providers in the system, whereas NBFCs were the biggest receiver of funds, followed by HFCs. Among the major bank groups, PSBs had a net receivable position vis-à-vis the entire financial sector whereas PVBs had a net payable position (Chart 2.26). 2.57 In March 2021, AMC-MFs, insurance companies and pension funds recorded increase in their receivables from the financial system while those of PSBs fell marginally. Among the entities which received funds from the financial system, NBFCs and HFCs recorded increases39, while payables of PVBs declined y-o-y (Chart 2.27). a. Inter-bank Market 2.58 The shares of both fund-based40 and non-fund based41 inter-bank exposures in the total assets of the banking system diminished during 2020-21 as a fallout of bank mergers and abundant liquidity in the system (Chart 2.28). 2.59 PSBs maintained their dominant position in the inter-bank market though their share dwindled, whereas the share of FBs increased42 (Chart 2.29). 2.60 About 67 per cent of the fund-based interbank market was short-term (ST) in nature, in which ST deposits had the highest share, followed by call money market exposure. Long-term (LT) loans predominated in LT fund-based inter-bank exposures (Chart 2.30). b. Inter-bank Market: Network Structure and Connectivity 2.61 The inter-bank market typically has a core-periphery network structure43 44. As on end-March 2021, there were four banks in the inner-most core and six banks in the mid-core circle. The four banks in the inner-most core included large public and private sector banks. The banks in the mid-core were large PSBs and PVBs while most of the old private sector banks, foreign banks, SFBs and SUCBs form the outer core (Chart 2.31). 2.62 The degree of interconnectedness in the banking system (SCBs), as measured by the connectivity ratio45, which had increased post-merger of PSBs in March 2020 on account of smaller number of potential connections, reduced slightly in March 2021 on account of incorporation of additional FBs in the network. The cluster coefficient46 which depicts local interconnectedness (i.e., tendency to cluster) also fell marginally (Chart 2.32).
c. Exposure of AMC-MFs 2.63 AMC-MFs maintained their position as the largest net providers of funds to the financial system in terms of inter-sectoral exposures in March 2021. Their gross receivables stood at ₹9.84 lakh crore (around 32 per cent of their average AUM) whereas their gross payables were ₹0.93 lakh crore as at end-March 2021. 2.64 The major recipients of their funding were SCBs, followed by NBFCs, HFCs and AIFIs. Their receivables from SCBs increased in Q4:2020-21 with the revival of banking sector stocks (Chart 2.33 a). 2.65 Instrument-wise, the share of equity holdings in AMC-MFs’ receivables saw a sharp increase in H2:2020-21 as equity markets remained buoyant. The share of long-term debt funding by AMC-MFs fell sharply but recovered moderately during Q4:2020-21. AMC-MFs’ holdings of CPs increased over those of CDs as corporates resorted to market borrowings in the low interest rate scenario and the banking system remained flush with liquidity (Chart 2.33 b).
d. Exposure of Insurance Companies 2.66 Insurance companies were the second largest net providers of funds to the financial system (gross receivables were at ₹6.68 lakh crore and gross payables at ₹0.54 lakh crore in March 2021). SCBs were the largest recipients of their funds, followed by NBFCs and HFCs, mainly in the form of LT debt and equity (Chart 2.34 a and b). LT debt mostly comprised of subscription to debt issued by NBFCs and HFCs. e. Exposure to AIFIs 2.67 AIFIs were net borrowers of funds from the financial system, with their gross payables and gross receivables having increased to ₹4.11 lakh crore and ₹3.89 lakh crore, respectively, in March 2021. They raised funds mainly from SCBs (primarily PVBs), AMC-MFs and insurance companies (Chart 2.35 a) through LT debt and LT deposits, of which the latter witnessed a sharp reduction in Q4:2020-21. Issuance of CPs registered a sharp uptick in H2:2020:21 (Chart 2.35 b).
f. Exposure to NBFCs 2.68 NBFCs were the largest net borrowers of funds from the financial system, with gross payables of ₹11.69 lakh crore and gross receivables of ₹1.86 lakh crore as at end-March 2021. The share of funding by SCBs grew substantially in Q4:2020-21 while that of AMC-MFs and insurance companies dipped (Chart 2.36 a). 2.69 During Q4:2020-21, the NBFC funding mix saw a decline in the share of LT debt while that of LT loans increased (Chart 2.36 b). g. Exposure to HFCs 2.70 HFCs were the second largest net borrowers of funds from the financial system, with gross payables of ₹6.93 lakh crore and gross receivables of ₹0.72 lakh crore as at end-March 2021. During Q4:2020-21, their borrowing profile was marked by a higher share of borrowings from SCBs, whereas the shares of AMC-MFs and insurance companies declined (Chart 2.37 a). The proportion of fund mobilisation through LT loans grew and that in the form of CPs contracted (Chart 2.37 b). II.4.2 Contagion Analysis47 2.71 Contagion analysis uses network technology to estimate the systemic importance of individual banks. The failure of a systemically important bank leads to greater solvency and liquidity losses for the banking system, the scale of which would depend on the capital and liquidity position of banks as well as the number, nature (whether it is a lender or a borrower) and magnitude of the interconnections that the failing bank has with the rest of the banking system. a. Joint Solvency48-Liquidity49 Contagion Losses for SCBs due to Bank Failure 2.72 In this analysis, the impact of discrete shocks on the banking system is gauged in terms of the number of bank failures that take place and the amount of solvency and liquidity losses that are incurred. 2.73 A contagion analysis of the banking network based on the end-March 2021 position indicates that the bank with the maximum capacity to cause contagion losses (Bank 1 in Table 2.9) was positioned in the inner-most core of the core-periphery network structure and its failure would lead to a solvency loss of 2.39 per cent of the total Tier 1 capital of SCBs and liquidity loss of 0.01 per cent of total HQLA of the banking system. Contagion losses due to failure of the five largest banks with the maximum capacity to cause contagion losses reduced in March 2021 vis-à-vis September 2020, both in absolute and percentage terms. Further, the failure of the bank that would cause the fifth largest contagion loss could lead to the failure of one additional bank (Table 2.9). | Table 2.9: Contagion Losses due to Bank Failure – March 2021 | | Trigger Code | % of Tier 1 capital of the Banking System | % of HQLA | Number of banks defaulting due to solvency | Number of banks defaulting due to liquidity | | Bank 1 | 2.39 | 0.01 | 0 | 0 | | Bank 2 | 2.22 | - | 0 | 0 | | Bank 3 | 1.81 | 0.04 | 0 | 0 | | Bank 4 | 1.80 | 0.22 | 0 | 0 | | Bank 5 | 1.58 | 0.11 | 0 | 1 | Note: Top five ‘Trigger banks’ have been selected on the basis of solvency losses caused to the banking system.
Source: RBI supervisory returns and staff calculations. | b. Solvency Contagion Losses for SCBs due to NBFC/ HFC Failure 2.74 Banks provide a substantial part of the funding for NBFCs and HFCs which are the largest borrowers of funds from the financial system. Therefore, failure of any NBFC50 or HFC would act as a solvency shock to their lenders. The solvency losses caused by these shocks can spread further by contagion. 2.75 By end-March 2021, idiosyncratic failure of any NBFC or HFC with the maximum capacity to cause solvency losses to the banking system could have impacted banks’ total Tier-1 capital by 2.52 per cent and 4.86 per cent, respectively, but would not have led to failure of any bank (Tables 2.10 and 2.11). | Table 2.10: Contagion Losses due to NBFC Failure – March 2021 | | Trigger Code | Solvency Losses as % of Tier -1 Capital of the Banking System | Number of Defaulting banks due to Solvency | | NBFC 1 | 2.52 | 0 | | NBFC 2 | 2.19 | 0 | | NBFC 3 | 1.85 | 0 | | NBFC 4 | 1.44 | 0 | | NBFC 5 | 1.18 | 0 | Note: Top five ‘Trigger NBFCs’ have been selected on the basis of solvency losses caused to the banking system.
Source: RBI supervisory returns and staff calculations. |
| Table 2.11: Contagion Losses due to HFC Failure – March 2021 | | Trigger Code | Solvency Losses as % of Tier -1 Capital of the Banking System | Number of Banks Defaulting due to solvency | | HFC 1 | 4.86 | 0 | | HFC 2 | 4.86 | 0 | | HFC 3 | 1.62 | 0 | | HFC 4 | 1.08 | 0 | | HFC 5 | 0.96 | 0 | Note: Top five ‘Trigger HFCs’ have been selected on the basis of solvency losses caused to the banking system.
Source: RBI supervisory returns and staff calculations. | c. Solvency Contagion Impact51 after Macroeconomic Shocks to SCBs 2.76 The contagion impact of the failure of a bank is likely to get magnified if macroeconomic shocks result in distress to the banking system in a generalised downturn of the economy. Such shocks would cause some SCBs to fail the solvency criterion, which then acts as a trigger for further solvency losses. 2.77 In the previous iteration, the shock was applied to the entity that could cause the maximum solvency contagion losses. In this iteration, however, the initial impact of such a shock on the individual bank’s capital is taken from the macro-stress tests52. 2.78 Initial capital loss due to macroeconomic shocks stood at 1.85 per cent, 7.96 per cent and 15.61 per cent of Tier-I capital for baseline, medium and severe stress scenarios, respectively. No bank failed to maintain Tier-I capital adequacy ratio of 7 per cent in any of the scenarios. As a result, there were no additional solvency losses to the banking system due to contagion (over and above the initial loss of capital due to the macro shocks) (Chart 2.38). Summary and Outlook 2.79 Unprecedented policy support has contained the impairment of balance sheets of banks in India despite the dent in economic activity brought on by waves of the pandemic. Banks’ performance and balance sheet quality have turned out to be better than anticipated at the beginning of the pandemic in terms of deposit growth, decline in GNPAs, capital adequacy and improved profitability. Stress tests indicate a limited impact of macroeconomic and other shocks on the Indian banking sector. Banks were largely shielded from the MTM losses in their portfolios subject to fair valuation, also aided by the G-SAP of the Reserve Bank. 2.80 Downside risks nevertheless remain, with stress signals emanating from the build-up in SMA advances. Banks must prepare contingency strategies to deal with segment-specific asset quality pressures, especially when regulatory reliefs are eventually rolled back. Subdued credit growth in a low interest rate scenario could impact net interest income levels adversely. 2.81 Network analysis throws light on the dominant positions occupied by mutual funds and insurance companies as purveyors of funds and by NBFCs and HFCs as recipients in the financial system. As the inter-bank market continues to contract, amidst abundant liquidity conditions, contagion risks due to failure of banks have ebbed. On the other hand, contagion risks associated with the failure of NBFCs and HFCs remain significant, pointing to the need for continued vigilance to signs of incipient stress.
|