Scheduled commercial banks (SCBs) improved their performance in terms of profitability, asset quality and capital adequacy. Macro-stress tests indicate that all banks would be able to comply with minimum capital requirements even in a severe stress scenario. Stress tests indicate that a significant number of NBFCs would be adversely impacted in the event of liquidity shocks. Network analysis points to increasing inter-bank exposure, raising contagion risks. Introduction 2.1 In 2021-22 so far, the impact of the second wave of the pandemic on the financial system has been mitigated through regulatory and other policy support measures to cushion eligible borrowers, bolster the resilience of banks and, above all, to reinvigorate the flow of credit in order to kick-start private investment. 2.2 This chapter presents an evaluation of the soundness and resilience of financial intermediaries in India by analysing their recent performance as reflected in offsite returns. Section II.1 provides an assessment of activity indicators, asset quality and capital adequacy of scheduled commercial banks (SCBs). It also examines their resilience against macroeconomic shocks through stress tests and sensitivity analysis. Sections II.2 and II.3 evaluate recent performance of urban cooperative banks (UCBs) and NBFCs, respectively, with stress tests. The concluding Section II.4 sets out an analysis of the network structure and interconnectedness of the Indian financial system and the results of contagion analysis under adverse scenarios. II.1 Scheduled Commercial Banks (SCBs)1 2 2.3 Aggregate deposits growth (y-o-y) moderated from end-March 2021 to touch 9.3 per cent by December 3, 2021 (Chart 2.1 a). Current account and savings account (CASA) deposits continued to outpace term deposits, reflecting precautionary motives in the face of uncertainty (Chart 2.1 b). 2.4 SCBs’ credit growth (y-o-y) has been inching up during the current financial year (Chart 2.1 c). Industrial advances, personal loans and service sector advances - in that order - accounted for the major share of bank credit by the end of H1:2021-22 (Chart 2.1 d). Agriculture and personal loan3 books remained the drivers of loan growth. Industrial sector credit turned positive, contributed by PVBs and FBs, after contracting over the previous two years. Credit to the services sector saw a sequential improvement but lagged other sectors, principally due to PSBs’ sliding advances to the sector (Chart 2.1 e). In the personal loans category, all segments except credit cards outstanding witnessed higher (y-o-y) growth. Housing loans, the mainstay of personal loans, maintained double digit growth (Chart 2.1 f). 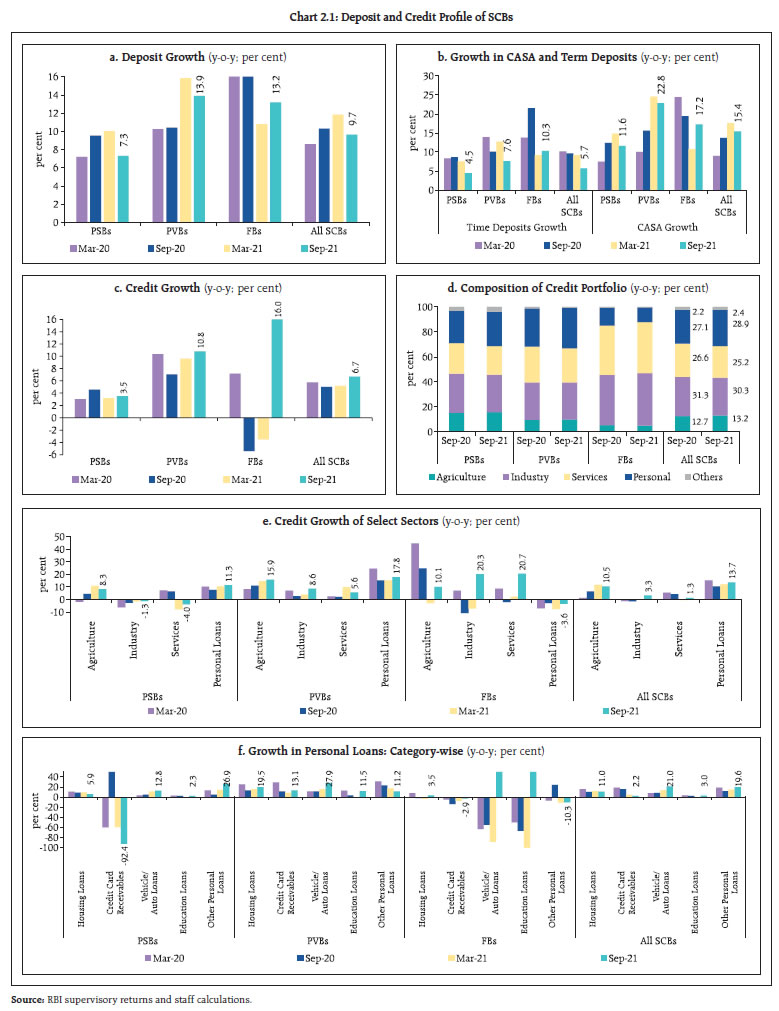 2.5 New loans extended by SCBs picked up momentum in Q2:2021-22 across sectors. Higher offtake was recorded by the private corporate and household sectors in the form of working capital and term loans (Chart 2.2 a, b and c). II.1.1 Asset Quality 2.6 SCBs’ gross non-performing assets (GNPA) ratio stood at 6.9 per cent at end-September 2021. Concomitantly, their net NPA (NNPA) ratio declined by 10 bps during H1:2021-22 (Chart 2.3 a and b). The annualised slippage ratio of SCBs inched up, with PVBs exhibiting a higher rate of deterioration in asset quality (Chart 2.3 c). The provisioning coverage ratio (PCR)4 moved up from 67.6 per cent in March 2021 to 68.1 per cent in September 2021 (Chart 2.3 d). II.1.2 Sectoral Asset Quality 2.7 In sectoral terms, the GNPA ratio for personal loans rose above its level six months ago as well as a year ago. The deterioration was led by housing and auto loans (Chart 2.4 a and b). The GNPA ratio for the industrial sector continued to decline, though some sub-sectors, viz., food processing, chemical and infrastructure (excluding electricity) registered increases over their March 2021 levels (Chart 2.4 c). 2.8 Restructuring by entities impacted by the second COVID-19 wave under Resolution Framework (RF) 2.0 stood at 1.5 per cent of total advances as at end-September 2021 which covered 81.7 per cent of the borrower accounts where restructuring under the scheme was invoked. In the case of MSME and retail loans, the restructuring was to the extent of 2.4 per cent of total sectoral advances and covered 80.0 per cent of borrower accounts where it was invoked. A clearer picture of the aggregate extent of restructuring would be available after implementation of RF 2.0 which ends on December 31, 2021 (Chart 2.4 d).
II.1.3 Credit Quality of Large Borrowers5 2.9 The share of large borrowers in GNPAs fell from 75.9 per cent in March 2020 to 62.1 per cent in September 2021 (Chart 2.5 a and b). Their loans in the special mention account (SMA6) buckets also declined (Chart 2.5 c and d). The share of the top 100 large borrowers in the total loan book shrunk marginally to 16.6 per cent while their share in SCBs’ GNPA pool fell to 5.7 per cent (Chart 2.5 e). II.1.4 Capital Adequacy 2.10 As in 2020-21, SCBs continued to bolster their capital through a mix of internal accruals and capital raising, including Tier I and II bonds, resulting in the capital to risk-weighted assets ratio (CRAR) rising to a new peak of 16.6 per cent in September 2021 (Chart 2.6 a). The system-level Tier-I leverage ratio7 stood at 7.5 per cent in September 2021 (Chart 2.6 b). II.1.5 Earnings and Profitability 2.11 For the past two years, net interest margin (NIM) of SCBs stood at 3.3 per cent (Chart 2.7 a). Their profits after tax (PAT) recorded a growth of 31 per cent (y-o-y). This was primarily due to an increase of 16 per cent in the PAT of PVBs and doubling of PSBs’ profits, driven by 30 per cent increase (y-o-y) in other operating income (OOI) and 24 per cent decline (y-o-y) in provisions (Chart 2.7 b). 2.12 The return on assets (RoA) and return on equity (RoE) maintained their rising profile, with PSBs recording multi-year highs (Chart 2.7 c and d). The cost of funds and yield on assets declined across bank groups to reach their lowest levels in the last two decades (Chart 2.7 e and f).
II.1.6 Resilience – Macro Stress Tests 2.13 The resilience of SCBs’ balance sheets to unforeseen shocks emanating from the macroeconomic environment has been assessed by using macro-stress tests through which impairment and capital ratios are projected over a one-year horizon under a baseline and two adverse (medium and severe) scenarios. The adverse scenarios are stringent conservative assessments under hypothetical adverse economic conditions and, therefore, these model outcomes should not be interpreted as forecasts. The baseline scenario incorporates the forecasted values of macroeconomic variables.8 The medium and severe adverse scenarios are arrived at by applying 0.25 to one standard deviation (SD) shocks and 1.25 to 2 SD shocks, respectively, to each of the macroeconomic variables, increasing the shocks by 25 basis points for each successive quarter (Chart 2.8). 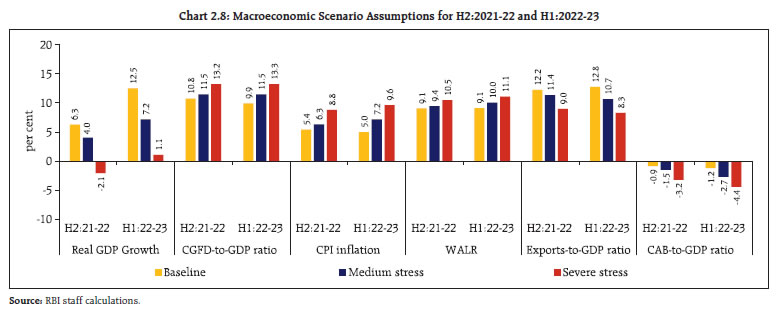 2.14 Stress tests indicate that the GNPA ratio of all SCBs may increase to 8.1 per cent by September 2022 under the baseline scenario and further to 9.5 per cent under severe stress. Within the bank groups, PSBs’ GNPA ratio of 8.8 per cent in September 2021 may deteriorate to 10.5 per cent by September 2022 under the baseline scenario; for PVBs, the share of bad loans may rise from 4.6 per cent to 5.2 per cent and for FBs, it is estimated to increase from 3.2 per cent to 3.9 per cent over the same period (Chart 2.9). On the other hand, if the stress conditions do not materialise and the situation turns optimistic relative to the baseline, GNPA ratio of all SCBs may moderate. 2.15 Stress test results indicate that the system level CRAR may decline to 15.4 per cent by September 2022 under the baseline scenario and to 14.7 per cent and 13.8 per cent under the medium and severe stress scenarios, respectively (Chart 2.10 a). All 46 banks would be able to maintain CRAR above the prescribed minimum capital level of 9 per cent as of September 2022 even in the worst case scenario (Chart 2.10 b).
2.16 The common equity Tier I (CET 1) capital ratio of SCBs may reach 12.5 per cent by September 2022 under the baseline scenario and decline to 11.9 per cent and 11.2 per cent under the medium and severe stress scenario, respectively (Chart 2.11 a). Even under adverse scenarios, no bank would face a decline of the CET 1 capital ratio below the regulatory minimum of 5.5 per cent (Chart 2.11 b). 2.17 While macro stress tests represent one method of assessing the resilience of the banking system against macroeconomic shocks, stock market indicators are also used to measure systemic risk in the banking sector. By this method, it is found that the systemic risk in the banking sector receded in 2021 from its elevated level during the first wave of the pandemic. Also, systemic risk posed by PSBs was higher than PVBs and the risk generated by the category of merged PSBs is comparatively higher than the unmerged PSBs (Box 2.1). 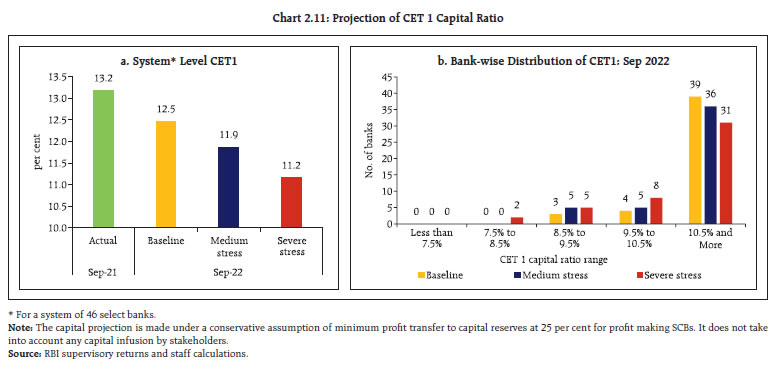
Box 2.1: Systemic Risk in the Banking Sector Assessment of systemic risk of the banking sector is an integral part of financial stability assessment and policy design. In this context, bank stock prices provide crucial forward-looking information on systemic risk. Bank stock return correlation can be used as a simple indicator of systemic risk where high values indicate a necessary condition for systemic failures (Patro et al., 2013). Conversely, when the stock return correlation is low, a triggering event is unlikely to cause systemic failure. Stock return correlations have the additional advantage of being simple, robust and not subject to model errors or data limitations. Taking daily returns of 32 major bank stocks (covering 90 per cent of the banking sector assets), correlation (rij) of the daily stock returns for each bank pair (i,j) has been computed for each calendar year9 from 2011 onwards. The systemic risk of the ith bank for a year is the average of its stock return correlation with the rest of the 31 banks for that year. The aggregate systemic risk indicator (SRI) is arrived at by averaging bank-wise SRIs. While equally weighted SRI is computed as a simple average of bank-wise systemic risk, the SRI is also computed as a weighted average with weights based on market capitalisation at the beginning of each period. The movements of the SRI indicates that systemic risk in the banking sector receded in 2021 from its elevated level during the first wave of the pandemic (Chart 1 a). Systemic risk posed by PSBs was higher than that of PVBs (Chart 1 b). A further deep dive reveals that the systemic risk generated by the category of merged PSBs10 is comparatively higher than unmerged PSBs and the gap between the market cap weighted SRI of both these groups has remained low (Charts 1 c and d). Reference: Patro, D. K., Qi, M., & Sun, X. (2013). A simple indicator of systemic risk. Journal of Financial Stability, 9(1), 105-116. | II.1.7 Sensitivity Analysis11 2.18 SCBs have been subjected to top-down12 sensitivity analysis involving several single-factor shocks13 to simulate credit, interest rate, equity price and liquidity risks under various stress scenarios14, based on their realised position for September 2021. a. Credit Risk 2.19 Two scenarios have been used to assess credit risk sensitivity, viz., rise in the system-level GNPA by one SD15 and two SD from its current level in a quarter. In the case of a severe shock (two SD), the GNPA ratio of 46 select SCBs moves up from 6.9 per cent to 12.7 per cent, system-level CRAR declines from 16.3 per cent to 12.8 per cent and the system-level capital impairment stands at 23.3 per cent (Chart 2.12 a). Further, eight banks with a share of 20.2 per cent in SCBs’ total assets may fail to maintain the regulatory minimum level of CRAR under the same scenario (Chart 2.12 b). The CRAR would fall below 7 per cent in case of 5 banks (Chart 2.12 c) while 6 banks would record a decline of over eight percentage points in the CRAR (Chart 2.12 d). PVBs and FBs, in general, would face lower erosion in CRAR than PSBs under both scenarios. A reverse stress test shows that a shock of 4.8 SD is required to bring down the system-level CRAR to 9 per cent. b. Credit Concentration Risk 2.20 Stress tests on banks’ credit concentration – considering top individual borrowers according to their standard exposures – showed that in the extreme scenario of the top three individual borrowers of the respective banks failing to repay16, no bank will face a situation of a fall in CRAR below the regulatory requirement of 9 per cent (Chart 2.13 a) although 6 banks would experience a decline of more than two percentage points in their CRARs (Chart 2.13 b). 2.21 In the extreme scenario of the top three group borrowers in the standard category failing to repay17, one bank’s CRAR could fall below 11 per cent (Chart 2.14 a) and 20 banks would experience a decline in CRAR of more than two percentage points (Chart 2.14 b).
2.22 In a scenario of the top three individual stressed borrowers of respective banks failing to repay18, a majority of banks would experience a reduction of 25 bps or less in their CRARs (Chart 2.15 a and b). c. Sectoral Credit Risk 2.23 Shocks applied to industry sub-sector wise GNPA ratios indicate varying magnitudes of increases in banks’ GNPAs and capital. A two SD shock to the energy and basic metals and metal products segments would reduce the system-level CRAR by 17 bps and 13 bps, respectively (Table 2.1). d. Interest Rate Risk 2.24 The market value of investments subject to fair value for the current sample of SCBs stood at ₹18.2 lakh crore in September 2021, dipping in two consecutive half-years (Chart 2.16). About 93 per cent of these investments were classified as available for sale (AFS) and the remaining as held for trading (HFT). Table 2.1: Decline in System Level CRAR
(basis points, in descending order for top 10 most sensitive sectors) | | Sector | 1 SD | 2 SD | | Infrastructure - Energy (100%) | 8 | 17 | | Basic Metal and Metal Products (164%) | 7 | 13 | | Infrastructure - Transport (36%) | 3 | 6 | | All Engineering (44%) | 2 | 4 | | Textiles (35%) | 2 | 4 | | Construction (29%) | 2 | 3 | | Food Processing (24%) | 1 | 3 | | Vehicles, Vehicle Parts and Transport Equipments (139%) | 1 | 2 | | Infrastructure - Communication (48%) | 1 | 2 | | Petroleum (non-infra), Coal Products (non-mining) and Nuclear Fuels (112%) | 1 | 1 | Note: For a system of select 46 banks.
Numbers in parentheses represent the growth in GNPAs of that sub-sector due to 1 SD shock to the sub-sector’s GNPA ratio.
Source: RBI supervisory returns and staff calculations. |
 2.25 The sensitivity (PV0119) of the AFS portfolio decreased vis-à-vis the June 2021 position at an aggregate level. PVBs and PSBs contributed to this by registering a decline of 10.6 per cent and 8.4 per cent, respectively, reflecting their increasing reliance on passive interest rate risk management. Although FBs saw a 5.8 per cent increase in their PV01 values in the same period, some positioning in the greater than 10-year segment by FBs involved bonds held as cover for hedging derivatives, which may not be active contributors to PV01 risk. In terms of PV01 curve positioning, the tenor-wise distribution for PSBs indicated a flattening bias in the 5-10 year bucket and greater than 10-year bucket relative to the less than 1 year and 1-5 year buckets. PVBs have built upon their views in the 1-5 year maturity bucket, while shrinking their exposure in the less than one year bucket by half on a sequential basis (Table 2.2). 2.26 As of end-September 2021, the yield curve softened to pre-second wave levels after the substantial spike observed in June 2021. Yield in buckets up to 20 years generally fell below March 2021 levels on the back of lower than anticipated government borrowing and inflation edging down towards the target. While there was a spike in the 8-10 year bucket, this may be ascribed to the change in benchmark security for yield curve computation (Chart 2.17). 2.27 Trading profits reduced in absolute as well as percentage terms across all bank groups during Q2:2021-22 (both q-o-q and y-o-y basis), driven by yield curve movements. Trading profits remained flat for PSBs, with quarterly spikes in intervening periods. In case of PVBs, trading profit halved and FBs remained in the red for the third consecutive quarter. The contribution of trading profits as a proportion of net other operating income (OOI) remained significant for PSBs while declining to low single digits for PVBs as their other income rebounded to pre-pandemic levels (Table 2.3). | Table 2.2: Tenor-wise PV01 Distribution of AFS Portfolio | | (in per cent) | | Sector | Total (in ₹ crore) | < 1 year | 1 -5 year | 5 -10 year | > 10 years | | PSBs | 204.2 (222.9) | 8.9 (9.9) | 41.6 (43.1) | 38.6 (36.9) | 10.9 (10.1) | | PVBs | 44.6 (49.9) | 15.2 (35.7) | 58.3 (49.3) | 13.7 (11.7) | 12.8 (3.4) | | FBs | 121.4 (114.8) | 4.0 (4.7) | 25.8 (27.1) | 9.7 (10.6) | 60.5 (57.5) | Note: Values in the brackets indicate June 2021 figures.
Source: Individual bank submissions and RBI staff calculations. |
| Table 2.3: OOI - Profit/(loss) on Securities Trading | | (in ₹ crore) | | | Sep-20 | Dec-20 | Mar-21 | Jun-21 | Sep-21 | | PSBs | 6,847 | 9,055 | 5,104 | 9,024 | 6,273 | | | (14.9%) | (18.0%) | (9.1%) | (17.7%) | (15.2%) | | PVBs | 4,523 | 4,825 | 2,499 | 3,669 | 1,996 | | | (10.3%) | (10.3%) | (5.4%) | (7.7%) | (4.4%) | | FBs | 622 | 12 | -223 | -417 | -204 | | | (5.8%) | (0.2%) | (-1.9%) | (-4.3%) | (-2.6%) | Note: Figures in parentheses represent OOI-Profit/(Loss) as a percentage of Net Operating Income.
Source: RBI supervisory returns. |
| Table 2.4: Tenor-wise PV01 Distribution of HFT portfolio | | (in per cent) | | | Total (in ₹ crore) | < 1 year | 1 -5 year | 5 -10 year | > 10 years | | PSBs | 0.3 (0.4) | 4.1 (2.9) | -35.0 (33.9) | 166.0 (-21.1) | -35.1 (84.3) | | PVBs | 12.3 (9.6) | 1.7 (3.8) | 61.5 (76.4) | 29.4 (5.1) | 7.4 (14.7) | | FBs | 10.6 (17.8) | -1.9 (1.4) | 30.0 (63.1) | 45.9 (25.4) | 26.0 (10.1) | Note: Values in the brackets indicate June 2021 figures.
Source: Individual bank submissions and RBI staff calculations. | 2.28 Deposit flows to SCBs have significantly outpaced credit growth in the recent period. However, the active interest rate risk across SCBs has come down, although for PSBs the size of the portfolio held in the active interest rate book has increased. The interest rate exposure of PVBs and FBs in their HFT portfolios continued to be higher than that of PSBs. The tenor-wise PV01 distribution for all SCBs showed a pronounced shift towards the 5-10 year bucket (Table 2.4). Nevertheless, banks diverged in their interest rate outlook in the short term, with PSBs envisaging yield increases in the 1-5 year and more than 10-year buckets, and PVBs maintaining long positions in all the buckets. PV01 of PSBs was concentrated in the 5-10-year segment, although their total PV01 sensitivity remained small whereas PVBs and FBs focussed on the 1-5 year and 5-10 year buckets, respectively. 2.29 Any hardening of interest rates would depress investment income under the AFS and HFT categories (direct impact). It is assessed that a parallel upward shift of 2.5 percentage points in the yield curve would lower the system level CRAR by 77 bps and system level capital would decline by 5.6 per cent (Table 2.5). 2.30 PSBs and PVBs augmented their HTM allocation through SDLs and their share of HTM portfolios increased on a y-o-y basis (Chart 2.18). The unrealised gains of PSBs were disproportionately concentrated in SDLs while those of PVBs were mostly in G-Secs, in line with their holdings (Chart 2.19). Table 2.5: Interest Rate Risk – Bank-groups - Shocks and Impacts
(under shock of 250 basis points parallel upward shift of the INR yield curve) | | | Public Sector Banks | Private Sector Banks | Foreign Banks | All SCBs | | AFS | HFT | AFS | HFT | AFS | HFT | AFS | HFT | | Modified Duration | 2.0 | 2.6 | 1.4 | 1.8 | 3.6 | 3.1 | 2.2 | 2.2 | | Reduction in CRAR (bps) | 78 | 28 | 277 | 77 | | Source: Individual bank submissions and RBI staff calculations. |
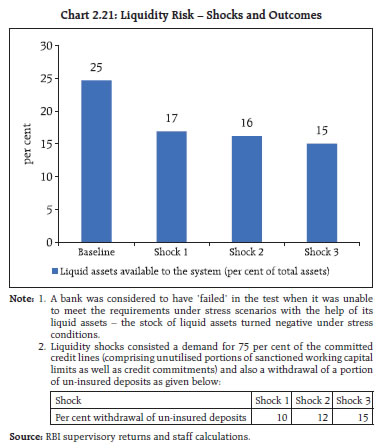
2.31 Taking advantage of the regulatory dispensation permitting banks to classify SLR securities acquired between September 2020 and March 2022 under the HTM category, banks enlarged their HTM portfolio upto 20 per cent in September 2021. PSBs’ and PVBs’ holdings of SLR securities in HTM amounted to 20.4 per cent and 19.4 per cent of their NDTL, respectively, in September 2021, while it stood at 1.2 per cent for FBs. e. Equity Price Risk 2.32 For the overall system, the impact of a significant fall in equity prices on banks’ CRAR is limited in view of banks’ low proportion of capital market exposures due to regulatory limits. In the extreme event of a 55 per cent drop in equity prices, the system level CRAR would decline by 49 bps but no bank’s CRAR would fall below 9 per cent (Chart 2.20). f. Liquidity Risk 2.33 Under the assumed scenarios of withdrawal of around 15 per cent of un-insured deposits20 and a simultaneous usage of 75 per cent of the unutilised portions of sanctioned working capital limits, all banks in the sample will remain resilient, using their HQLAs21 for meeting day-to-day liquidity requirements (Chart 2.21). II.1.8 Bottom-up Stress Tests: Derivatives Portfolio 2.34 Select banks22 have been subjected to a series of bottom-up stress tests (sensitivity analyses) on their derivative portfolios with the reference date as September 30, 2021 and involving four separate shocks on interest and foreign exchange rates carried out on a stand-alone basis. The shocks on interest rates ranged from 100 to 250 basis points on either side, while 20 per cent appreciation/depreciation shocks were assumed for foreign exchange rates. 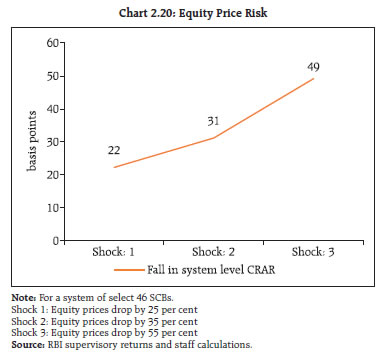
 2.35 The results indicated the following: (a) while most FBs reported significantly negative net mark-to-market (MTM) positions as a proportion of CET1 capital, the MTM impact was, by and large, muted for PSBs and PVBs (Chart 2.22); (b) banks on an average would gain from an interest rate rise; (c) positioning in forex derivatives is such that they stand to benefit marginally from INR depreciation and vice versa; (d) potential MTM gains from both rise in interest rates and depreciation of INR is lower in September 2021 than in March 2021, particularly in the latter case and (e) the fall in interest rates would trigger higher net MTM losses at end-September 2021 compared to the previous period (Chart 2.23). II.2 Primary (Urban) Cooperative Banks 2.36 Primary (urban) cooperative banks (UCBs)23 witnessed marginal credit growth as at the end of September 2021, with non-scheduled UCBs (NSUCBs) being the principal contributors (Chart 2.24 a). Priority sector lending accounted for more than half of UCBs’ outstanding credit (Chart 2.24 b). The CRAR of UCBs deteriorated slightly from March 2021 to reach 12.9 per cent in September 2021 (Chart 2.24 c).
2.37 UCBs appear to have been particularly impacted by the second wave of COVID-19, with the GNPA ratios rising sharply for both SUCBs (12.4 per cent as at the end of September 2021) and NSUCBs (18.0 per cent) (Chart 2.24 d). Provisions dipped for both categories of UCBs, resulting in PCR for the sector falling to 45.8 per cent at the end of Q2:2021-22 and the NNPA ratio rising sharply to 8.7 per cent (Chart 2.24 e and f).
Stress Testing 2.38 A select set of UCBs24 have been subjected to stress tests covering credit risk (default risk and concentration risk), market risk (interest rate risk in trading book and banking book) and liquidity risk, based on their reported financial position as on March 31, 2021. 2.39 The results show that (a) in all the five parameters tested, a few banks fail even in the baseline scenario; (b) the largest number of UCBs are impacted in scenarios involving liquidity shocks; and (c) in general, the number of NSUCBs failing/ being impacted detrimentally in adverse scenarios is larger than that of SUCBs (Chart 2.25). II.3 NBFCs25 2.40 Aggregate credit extended by NBFCs as at the end of September 2021 stood at ₹27.4 lakh crore. Loans to industry constituted the largest segment (40.0 per cent) of the credit portfolio, followed by personal loans (28.6 per cent), services (12.5 per cent) and agriculture (1.4 per cent) (Chart 2.26). Large industry and auto loans comprised the largest two sub-sectors of NBFCs’ credit portfolio with shares of 32.4 per cent and 13.1 per cent, respectively. Government owned NBFCs had a dominant position in the NBFC space, accounting for 48.6 per cent of the aggregate credit extended and 81.0 per cent of the credit to the industries sector. 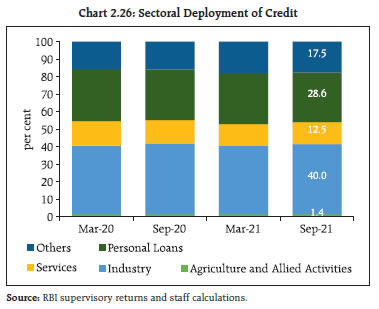 2.41 In terms of credit dispensation by category of NBFC, investment and credit companies and infrastructure finance companies predominated, with a share of 52.2 per cent and 44.0 per cent, respectively, in gross advances as on September 30, 2021 (Chart 2.27). Lending through NBFC-P2P accounts for a minuscule share of aggregate NBFC lending (₹2,093 crore as on September 30, 2021); however, there was significant traction in activity during the pandemic period, with threefold growth in both credit intermediated and number of lenders, owing to investors’ search for higher yields in a low interest rate environment (Chart 2.28). 2.42 The CRAR of NBFCs stood at 26.3 per cent as at end-September 2021, a marginal increase of 10 bps as compared to March 2021. The return on assets (RoA) improved to 1.7 per cent in September 2021 from 1.3 per cent in March 2021 (Chart 2.29).
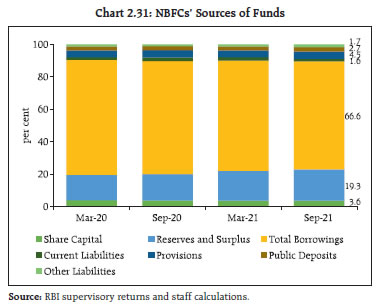
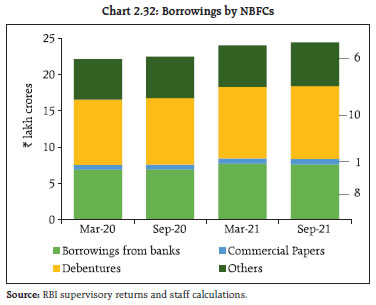
2.43 The GNPA ratio of NBFCs, which had declined in September 2020 reflecting the standstill on asset classification prevalent then, rose to reach 6.5 per cent as at the end of September 2021. GNPA in the industries sector, which forms the largest share of NBFC exposure, rose from 6.7 per cent in March 2021 to 7.9 per cent in September 2021 (Chart 2.30). Government owned NBFCs’ share in the GNPAs of the sector stood at 31.6 per cent. 2.44 Borrowings constituted almost two-thirds of NBFCs’ sources of funds (Chart 2.31). These were mainly in the form of debentures (41.0 per cent) and bank borrowings (31.2 per cent), with commercial paper (3.1 per cent) accounting for a minor share (Chart 2.32). Mutual funds were the single largest subscribers to the debentures issued by NBFCs, followed by insurance companies and banks. Stress Test26 - Credit Risk 2.45 System level stress tests for assessing the resilience of the NBFC sector to credit risk shocks have been conducted for a sample of 191 NBFCs27 under two scenarios – medium and high risk involving increase in GNPA ratio of the sector by 1 SD and 2 SD, respectively. As on March 2021 (baseline position), the GNPA ratio of the sample NBFCs stood at 6.5 per cent and CRAR at 26.6 per cent, with 10 NBFCs (accounting for 4.6 per cent of total assets of the sector as on March 31, 2021) reporting CRAR below the minimum regulatory requirement of 15 per cent (Chart 2.33). 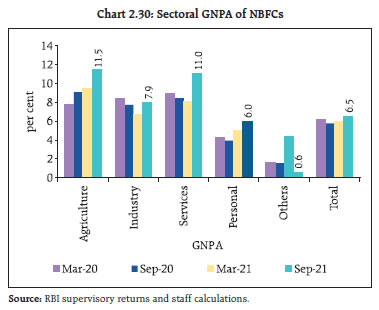
 2.46 In case of a high risk shock of 2 SD increase in the GNPA ratio, the CRAR of the sector would decline by 30 bps to 26.3 per cent, with no impact seen in the case of a 1 SD shock. The capital adequacy of the sector would remain above the minimum regulatory requirement of 15 per cent in both scenarios. However, on individual basis, under the impact of the shocks, the CRAR of 17 NBFCs – comprising 7.9 per cent of asset size of the sample – would fall below minimum regulatory requirements in the medium risk scenario, while 19 NBFCs – comprising 11.5 per cent of asset size of the sample – would be impacted similarly in the high risk scenario. Stress Test - Liquidity Risk 2.47 The resilience of the NBFC sector to liquidity shocks is assessed by capturing the impact of a combination of assumed increase in cash outflows and decrease in cash inflows28. Two scenarios are applied, viz., medium risk involving a shock of 5 per cent contraction in inflows and 10 per cent rise in outflows, and high risk entailing a shock of 10 per cent decline in inflows and 15 per cent surge in outflows. The results indicate that the number of NBFCs which would face a negative cumulative mismatch in liquidity positions over the next one year in the medium and high risk scenarios may work out to 52 (covering 24.5 per cent of the asset size of the sample) and 67 (34.7 per cent), respectively (Table 2.6). 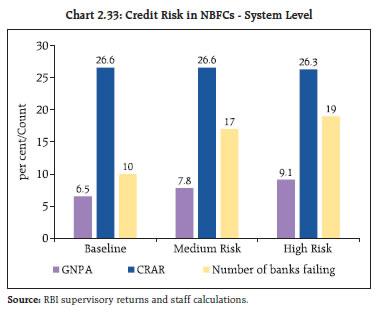
| Table 2.6: Liquidity Risk in NBFCs | | Cumulative Mismatch as a percentage of outflows over next one year | No. of NBFCs having liquidity mismatch | | Baseline | Medium | High | | Over 50 % | 10 (5.9%) | 10 (5.9%) | 11 (6.1%) | | Between 20% and 50% | 1 (0.2%) | 5 (2.8%) | 22 (9.0%) | | 20% and below | 7 (3.8%) | 37 (15.8%) | 34 (19.6%) | Note: Figures in parenthesis represent share in asset size of the sample.
Source: RBI supervisory returns and staff calculations. | II.4 Interconnectedness 2.48 In a financial system network, the component financial institutions have bilateral links amongst themselves in the form of loans to, investments in, or deposits with each other. These linkages act as a source of funding, liquidity, investment and risk diversification, but they can also transform in adverse conditions into channels through which shocks can spread, leading to contagion and amplification of systemic shocks. II.4.1 Financial System Network29 30 2.49 The total outstanding bilateral exposures31 among the entities in the financial system have been on an upswing since H1:2020-21 (Chart 2.34 a). This was primarily due to increased32 exposures of SCBs to NBFCs and HFCs and of asset management companies - mutual funds (AMC-MFs) to the financial system. 2.50 SCBs had the largest share of bilateral exposures though it remained lower than pre-pandemic levels. The shares of NBFCs and HFCs slipped marginally from their March 2021 levels. Owing to the rally in the equity markets, the share of AMC-MFs in bilateral exposures continued to grow. (Chart 2.34 b). 2.51 In terms of inter-sectoral33 exposures, AMC-MFs, followed by insurance companies, were the biggest fund providers in the system, whereas NBFCs were the biggest receiver of funds, followed by HFCs. Among the major bank groups, PSBs had a net receivable position vis-à-vis the entire financial sector whereas PVBs had a net payable position (Chart 2.35).
2.52 In September 2021, the net receivables of PSBs and AMC-MFs from the financial system increased significantly as compared to the position a year ago. Among recipients of funds from the financial system, PVBs, NBFCs and HFCs recorded large increases34 (Chart 2.36). a. Inter-bank Market 2.53 Inter-bank exposures accounted for 3 per cent of the total assets of the banking system as of September 2021. The shares of both fund-based35 and non-fund based (NFB)36 inter-bank exposures in the total assets of the banking system diminished during 2020-21 as a fallout of bank mergers and abundant liquidity in the system. In 2021-22 so far, there was some uptick, with NFB exposure (primarily letters of credit and bank guarantees) back at pre-pandemic levels (Chart 2.37).
2.54 PSBs continued to maintain their dominant position in the inter-bank market and their share increased sequentially. The share of PVBs declined over the March 2021 level, whereas that of FBs grew (Chart 2.38). 2.55 About 77 per cent of the fund-based inter-bank market was short-term (ST) in nature, in which ST deposits had the highest share, followed by ST loans and call money market exposure. Long-term (LT) loans predominated in LT fund-based inter-bank exposures (Chart 2.39). b. Inter-bank Market: Network Structure and Connectivity 2.56 The inter-bank market typically has a core-periphery network structure37 38. As of end-September 2021, there were four banks in the inner-most core and six banks in the mid-core circle. The four banks in the inner-most core included large public and private sector banks. The banks in the mid-core were large PSBs and PVBs while most of the old private sector banks, foreign banks, SUCBs and SFBs formed the outer core (Chart 2.40).
2.57 The degree of interconnectedness in the banking system (SCBs), as measured by the connectivity ratio39, which had reduced slightly in March 2021 on account of incorporation of additional FBs in the network, declined further in the next two quarters. The cluster coefficient40 which depicts local interconnectedness (i.e., tendency to cluster), increased in H1:2021-22 over March 2021 (Chart 2.41). c. Exposure of AMC-MFs 2.58 In terms of inter-sectoral exposures, AMC-MFs maintained their position as the largest net providers of funds to the financial system as of end-September 2021. Their gross receivables stood at ₹10.63 lakh crore (around 29 per cent of their average AUM) whereas their gross payables were ₹1.01 lakh crore as at end-September 2021. 2.59 The major recipients of their funding were SCBs, followed by NBFCs, HFCs and AIFIs. Their exposure to banking sector stocks continued its upward momentum since September 2020 and reached pre-pandemic levels. Receivables from other sectors of the financial system, however, declined (Chart 2.42 a). 2.60 Instrument-wise, the share of equity holdings in AMC-MFs’ receivables continued its upward trajectory since March 2020 as equity markets remained buoyant; while long-term (LT) debt, CPs and CDs declined in absolute and percentage terms (Chart 2.42 b). d. Exposure of Insurance Companies 2.61 Insurance companies were the second largest net providers of funds to the financial system (gross receivables were at ₹6.95 lakh crore and gross payables at ₹0.45 lakh crore in September 2021). SCBs were the largest recipients of their funds, followed by NBFCs and HFCs, mainly in the form of LT debt and equity (Chart 2.43 a and b). LT debt mostly comprised of subscription to debt issued by NBFCs and HFCs.
e. Exposure to AIFIs 2.62 AIFIs were net borrowers of funds from the financial system, with their gross payables and gross receivables having increased to ₹4.05 lakh crore and ₹3.45 lakh crore, respectively, in September 2021. They raised funds mainly from SCBs (primarily PVBs, although share of PSBs also grew), AMC-MFs and insurance companies (Chart 2.44 a). While LT debt remained the preferred instrument for raising funds, LT deposits declined on a sequential basis. CPs which had registered a sharp uptick as a source of AIFIs’ funding in H2:2020:21, saw an equally sharp decline in H1:2021-22 (Chart 2.44 b). f. Exposure to NBFCs 2.63 NBFCs were the largest net borrowers of funds from the financial system, with gross payables of ₹12.06 lakh crore and gross receivables of ₹1.65 lakh crore as at end-September 2021. The share of funding by SCBs remained the highest, though it decelerated in Q2:2021-22. The share of AMC-MFs increased relative to March 2021 while that of insurance companies dipped (Chart 2.45 a). During the half-year ended September 2021, the NBFC funding mix saw a decline in the share of LT debt instruments while that of LT loans increased (Chart 2.45 b).
g. Exposure to HFCs 2.64 HFCs were the second largest net borrowers of funds from the financial system, with gross payables of ₹7.38 lakh crore and gross receivables of ₹0.61 lakh crore as at end-September 2021. As at the end of FY:2020-21 and H1:2021-22, their borrowing profile was marked by a higher share of funding from SCBs and fall in that of AMC-MFs (Chart 2.46 a). The proportion of fund mobilisation through LT loans, LT debt instruments and CPs contracted since March 2021 while that through ST loans grew (Chart 2.46 b). II.4.2 Contagion Analysis 2.65 Contagion analysis uses network technology to estimate the systemic importance of individual banks. The failure of a systemically important bank leads to solvency and liquidity losses for the banking system the scale of which would depend on the capital and liquidity position of banks as well as the number, nature (whether it is a lender or a borrower) and magnitude of the interconnections that the failing bank has with the rest of the banking system. a. Joint Solvency41-Liquidity42 Contagion Losses for SCBs due to Bank Failure 2.66 In this analysis, the impact of discrete shocks on the banking system is gauged in terms of the number of bank failures that take place and the amount of solvency and liquidity losses that are incurred. 2.67 A contagion analysis of the banking network based on the end-September 2021 position indicates that the bank with the maximum capacity to cause contagion losses (Bank 1 in Table 2.7) is positioned in the inner-most core of the core-periphery network structure (Chart 2.40) and its failure would lead to a solvency loss of 2.67 per cent of the total Tier 1 capital of SCBs and liquidity loss of 0.03 per cent of total HQLA of the banking system. The analysis also shows that contagion losses due to failure of the five banks with the maximum capacity to cause contagion losses increased in September 2021 vis-à-vis March 2021, both in absolute and percentage terms, but would not lead to the failure of any additional bank (Table 2.7). b. Solvency Contagion Losses for SCBs due to NBFC/HFC Failure 2.68 Banks provide a substantial part of the funding for NBFCs and HFCs which are the largest borrowers of funds from the financial system. Therefore, failure of any NBFC or HFC would act as a solvency shock to their lenders. The solvency losses caused by these shocks can spread further by contagion. 2.69 By end-September 2021, idiosyncratic failure of the NBFC or HFC with the maximum capacity to cause solvency losses to the banking system would have impacted banks’ total Tier-1 capital by 2.28 per cent and 6.43 per cent, respectively, but would not lead to failure of any bank (Tables 2.8 and 2.9). c. Solvency Contagion Impact43 after Macroeconomic Shocks to SCBs 2.70 The contagion impact of the failure of a bank is likely to get magnified if macroeconomic shocks result in distress to the banking system in a generalised downturn of the economy. Such shocks would cause some SCBs to fail the solvency criterion, which then acts as a trigger for further solvency losses. 2.71 In the previous iteration, the shock was applied to the entity that could cause the maximum solvency contagion losses. In this iteration, however, the initial impact of such a shock on the individual bank’s capital is taken from the macro-stress tests44. 2.72 The initial capital loss due to macroeconomic shocks stood at 5.39 per cent, 9.72 per cent and 14.97 per cent of Tier-I capital for baseline, medium and severe stress scenarios, respectively. No bank fails to maintain Tier-I capital adequacy ratio of 7 per cent in any of the scenarios. As a result, there are no additional solvency losses to the banking system due to contagion (over and above the initial loss of capital due to the macro shocks) (Chart 2.47). | Table 2.7: Contagion losses due to Bank failure – September 2021 | | Trigger Code | % of Tier 1 capital of the Banking System | % of HQLA | Number of Bank defaulting due to solvency | Number of Bank defaulting due to liquidity | | Bank 1 | 2.67 | 0.03 | 0 | 0 | | Bank 2 | 2.20 | 0.23 | 0 | 0 | | Bank 3 | 1.93 | 0.03 | 0 | 0 | | Bank 4 | 1.80 | 0.59 | 0 | 0 | | Bank 5 | 1.73 | 0.04 | 0 | 0 | Note: ‘Trigger banks’ have been selected on the basis of solvency losses caused to the banking system.
Source: RBI supervisory returns and staff calculations. |
| Table 2.8: Contagion Losses due to NBFC failure – September 2021 | | Trigger Code | Solvency Losses as % of Tier -1 Capital of the Banking System | Number of Banks Defaulting due to solvency | | NBFC 1 | 2.28 | 0 | | NBFC 2 | 1.80 | 0 | | NBFC 3 | 1.78 | 0 | | NBFC 4 | 1.25 | 0 | | NBFC 5 | 1.21 | 0 | Note: Top five ‘Trigger NBFCs’ have been selected on the basis of solvency losses caused to the banking system.
Source: RBI supervisory returns and staff calculations. |
| Table 2.9: Contagion Losses due to HFC failure – September 2021 | | Trigger Code | Solvency Losses as % of Tier -1 Capital of the Banking System | Number of Banks Defaulting due to solvency | | HFC 1 | 6.43 | 0 | | HFC 2 | 4.42 | 0 | | HFC 3 | 1.60 | 0 | | HFC 4 | 1.42 | 0 | | HFC 5 | 1.33 | 0 | Note: Top five ‘Trigger HFCs’ have been selected on the basis of solvency losses caused to the banking system.
Source: RBI supervisory returns and staff calculations. | Summary and Outlook 2.73 SCBs have emerged more robust after the two waves of the pandemic, while UCBs and NBFCs’ asset quality has been dented. Stress tests indicate that banks are generally well placed to weather credit-related shocks, while UCBs and NBFCs present a more varied picture. 2.74 Going forward, as the economy recovers and credit demand rises, banks will need to ensure availability of sufficient capital to support credit growth. NBFCs and UCBs will have to be mindful of frailties on the liquidity front and ensure robust asset-liability management, apart from improving the quality of their credit portfolios. Considering the significant share of funding absorbed by NBFCs at the system level, continued attention to their financial health is warranted in the interest of financial stability.
|