The resilience of the global financial system has been tested by the recent banking turmoil and interaction between monetary policy tightening and financial sector stress. Uncertainty about the global macro-financial outlook has risen. Against this backdrop, the Indian economy and the domestic financial system remain resilient in an environment of macroeconomic and financial stability. The health of the Indian banking system is robust, fortified by non-performing loans at a multi-year low and adequate level of capital and liquidity buffers. Introduction 1.1 Since the December 2022 issue of the Financial Stability Report (FSR), the global macrofinancial environment, which was unsettled by overlapping strains from tightening of financial conditions in response to aggressive monetary policy actions, the lingering effects of the war in Ukraine and a recessionary macroeconomic outlook, was jolted in March 2023 by banking failures in advanced economies (AEs) that tested the resilience of the global financial system. In the event, forceful and swift resolution by policy authorities in the affected jurisdictions have restored stability and contained a broader spillover. The loss of confidence among depositors, amplified by mobile apps and social media, has warranted rethink on financial regulation, including run-off factors assumed for deposits and the 30-days stress period for calculating net cash outflows, and the contours of deposit insurance. While timely interventions have calmed global financial markets, uncertainty about the global economic outlook has risen and the balance of risks has tilted to the downside. The International Monetary Fund (IMF) in its April 2023 projections expects global growth to slow down further from 3.4 per cent in 2022 and bottom out at 2.8 per cent in 2023 (Chart 1.1). Meanwhile, with inflation easing grudgingly but still at elevated levels - core inflation, i.e., inflation excluding volatile food and energy prices, has been more persistent than anticipated – central banks have moderated the size of rate actions and some have paused. They remain focused, however, on returning inflation to target while employing the full range of prudential policies and liquidity management tools to address threats to financial stability (Chart 1.2). 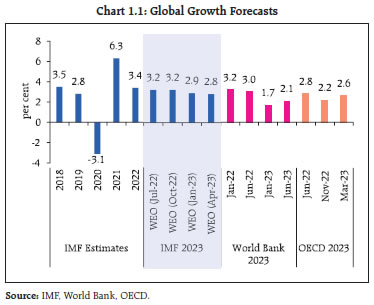 1.2 The strains in the banking sector raise the key question as to whether the recent events are isolated occurrences that could be the result of idiosyncratic risks in a few banks brought on by tighter monetary and financial conditions, or do they point to a broader systemic risk that could threaten the stability of the global financial system? During the last 15 years since the global financial crisis (GFC), global bond markets have grown much faster than nominal GDP1, financial institutions hold higher volumes of securities than before and a prolonged low interest rate regime has led to repricing of these securities, all of which increase the severity of the impact of interest rate changes. 1.3 Financial markets in emerging market and developing economies (EMDEs) have so far remained largely insulated from spillovers from the banking turmoil in the AEs. Yet, if instability recurs and is more widespread, it could prompt an increase in global risk aversion, leading to capital outflows from EMDEs as an asset class. Furthermore, some of them are faced with serious concerns on debt sustainability. Issuance conditions for sovereign debt have also deteriorated. Smaller and low-income economies are reeling under debt overhangs, difficulties in raising new debt and rollover risks. 1.4 The Indian economy has exhibited stability and resilience in these challenging conditions. Positioned to be among the fastest growing major economies despite multiple global headwinds, the momentum of growth is building up with the strengthening of domestic demand conditions, strong public investment in infrastructure, smooth funding of the financing needs of businesses and households, and business optimism. India’s purchasing managers’ indices (PMIs) continue to outperform regional and global indices for both manufacturing and services. The Indian economy is projected to grow at 6.5 per cent during 2023-24, with risks evenly balanced at this juncture. The persistence of core inflation, notwithstanding a dip in April 2023, slower global growth and potential volatility in the global financial system, however, could pose risks to the growth trajectory.  1.5 Headline inflation in India has gradually moderated from its peak of 7.8 per cent in April 2022 to 4.3 per cent in May 2023 due to the combined impact of monetary tightening, supply side measures and easing of global supply bottlenecks. Core inflation has also eased but remains above 5 per cent. The pursuit of price stability while keeping in mind the objective of growth, therefore, remains the overarching priority of the Reserve Bank. 1.6 The Indian financial system, led by a sound banking system, remains stable and supportive of the productive needs of the economy. Aided by robust earnings, adequate capital and liquidity buffers and improving asset quality, Indian banks are well positioned to sustain the upturn in the credit cycle that has been underway since early 2022 (Chart 1.3). 1.7 India’s digital public infrastructure (DPI) fosters financial innovation and competition, improves financial inclusion, and in general democratises finance. The DPI is driving economic growth and improving the efficiency and resilience of the financial system. I.1 Global Backdrop I.1.1 Macrofinancial Development and Outlook 1.8 The global economic outlook remains shrouded by elevated levels of uncertainty with sporadic bouts of volatility in financial markets triggering rapid shifts in risk-on-risk-off sentiments, with idiosyncratic shocks propagating into ripple effects and spillovers that pose threats to financial stability. This is constraining the degrees of freedom available to monetary policy in the pursuit of its mandate of macroeconomic stability. Meanwhile, some easing of inflationary pressures has emboldened a tempering of aggressive policy rate responses, fuelling expectations that the rate tightening cycle is close to running its course. The experience with the recent banking turmoil and its resolution has also prompted market participants to re-evaluate the future path of monetary policy. Financial conditions are reflecting these vicissitudes (Chart 1.4). 1.9 The slowdown in monetary tightening by central banks has resulted in bond yields declining. Mounting levels of debt and declining market liquidity, however, are unsettling market sentiments. 1.10 The impending review of the monetary policy by the Bank of Japan, including yield curve control (YCC), and the inevitability of quantitative tightening by systemic central banks to normalise their bloated balance sheets, even as patches of illiquidity in core bond markets surface, have increased the sensitivity to shocks and led to amplification of volatility in government bond and private credit markets (Chart 1.5 a, b, c and d).
1.11 The recent banking turmoil also led to sell-off in equity markets. Credit default swap (CDS) spreads rose sharply and interbank funding spreads widened (Chart 1.6 a, b, c and d). 1.12 Underlying these developments, powerful structural forces are at work, with implications for medium and longer-term prospects for the global economy. They include an aging labour force, declining growth rates in total factor productivity (TFP), and deceleration in human capital development. Consequently, global potential growth – the maximum sustainable rate at which economies can grow without generating excess inflation – is likely to decline to a 30-year low over this decade (Chart 1.7 a and b). The ensuing global slowdown might become accentuated by financial crises that appear to be recurring with rising intensity and exposing newer vulnerabilities3. 1.13 In sum, global macrofinancial risks have increased against the backdrop of heightened market volatility and an uncertain economic outlook. The global financial system’s resilience will be tested going forward and this calls for pro-active policy actions to secure financial stability in the face of new challenges. I.1.2 Other Global Macrofinancial Risks 1.14 The goals of macroeconomic and financial stability policies complement and interact with each other in normal times. As the bank runs in March 2023 in some jurisdictions revealed, aggressive withdrawal from ultra-accommodative monetary policy can pose financial stability risks when business models and risk management practices have adapted to a prolonged period of very low interest rates and abundant liquidity. In this milieu, financial stability considerations can be constraints on the conduct of independent monetary policy. Increasingly, decisions relating to monetary policy are being viewed as conditioned by the obligation to take into account the need to preserve financial stability, and this impinges on the size and timing of rate actions and/ or modulation of liquidity. 1.15 Among recent macrofinancial developments, the salient ones which have the potential to interact with global macrofinancial vulnerabilities include the banking turmoil, high levels of non-financial sector debt, leverage and liquidity risks in the non-bank financial intermediaries (NBFIs), financial fragmentation, climate change, growth of digital finance and the rising role of artificial intelligence (AI) in financial services. A. Banking Turmoil 1.16 The episodes of sudden failures of banks in the U.S. and Europe since March 2023 came after a period of prolonged easy monetary conditions in response to the pandemic, which lulled financial institutions into not reckoning with the inevitable reversal of the interest rate cycle. Unbridled maturity transformation and liquidity mismatches as well as light touch regulation and supervision amplified the risks to financial stability. Unhedged or inadequately hedged investment portfolios brought unrealised losses on balance sheets due to fire sales. Confidence runs became intensified by mobile apps and social media. These developments presented new dimensions in the interface between macroeconomic and financial stability. 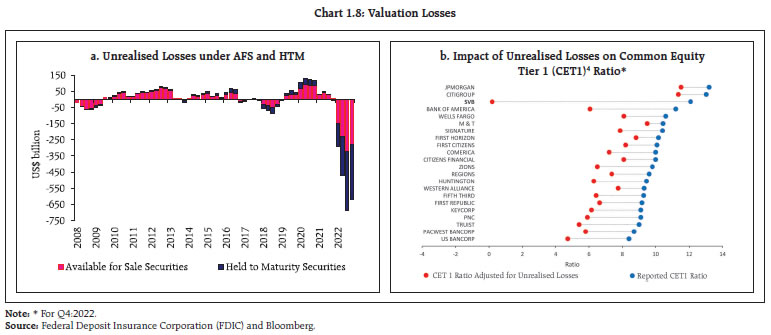 1.17 The recent banking turmoil also showed how unprepared banks were to manage the transition to rapid increases in interest rates by central banks, which exposed fault lines in their balance sheets. As rates rose, valuation losses spiked in banks, in particular in their held-to-maturity (HTM) portfolios, which are not marked-to-market. The aggregate valuation losses in the U.S. banking system grew from US$ 8 billion at the end of 2021 to more than US$ 620 billion at the end of 2022. Sizable portfolios of uninsured deposits exacerbated the impact of valuation losses on capital positions and worsened their risk profiles (Chart 1.8 a and b). 1.18 In this context, it is estimated that out of the US$ 23.1 trillion of U.S. banking system assets at end-March 20235 (a) the market value of the assets, including loan portfolio, is US$ 2.2 trillion lower than that suggested by the book value; (b) over 190 banks with assets of US$ 300 billion are potentially at risk of impairment even if only half of uninsured depositors choose to withdraw, as the mark-to-market value of their remaining assets after these withdrawals would not be enough to repay all insured deposits; and (c) after the recent fall in the value of assets, more than 2,000 banks will have negative equity relative to their non-equity liabilities6. 1.19 In comparison to prior bank runs, the speed of runs in the recent episode was unprecedented – one-day withdrawal rates were more than 20 per cent7 (Chart 1.9). 1.20 As stated earlier, the speed of the run was amplified via messaging apps and social media (Chart 1.10). 1.21 Unlike the GFC episode, the March 2023 banking turmoil is so far restricted to relatively smaller and midsized regional banks in the U.S. On the other hand, the failure of a global systemically important bank (G-SIB) in Europe was a consequence of a series of idiosyncratic problems in recent years that resulted in loss of trust among its depositors and investors. The banking turmoil offers important lessons: First, irrespective of the size of banks, contagion can only be resolved through swift and forceful interventions by public authorities. The distinction between systemic and non-systemic banks, may therefore, require a rethink as all banking crises have potential systemic implications. Second, the stability of deposits predicates the solvency of a bank. Therefore, partial deposit insurance is a dichotomy that may not work in a banking crisis, as retaining the confidence of depositors is the key to prevent bank runs. Third, the speed of modern-day bank runs demands revisit of existing liquidity regulations, which assume a smaller run-off factor for ‘stable’ deposits and a 30-days stress period for calculating net cash outflows. Finally, intrusive and comprehensive bank supervision alongside sound risk management by banks is essential to improve their resilience and lessen the probability of bank runs. Careful assessment of business models, identifying hidden losses and disincentivising excessive risk taking would be core components of this approach. Moreover, dilution of regulatory standards of any kind can trigger spillovers, necessitating distress acquisitions or bailouts. 
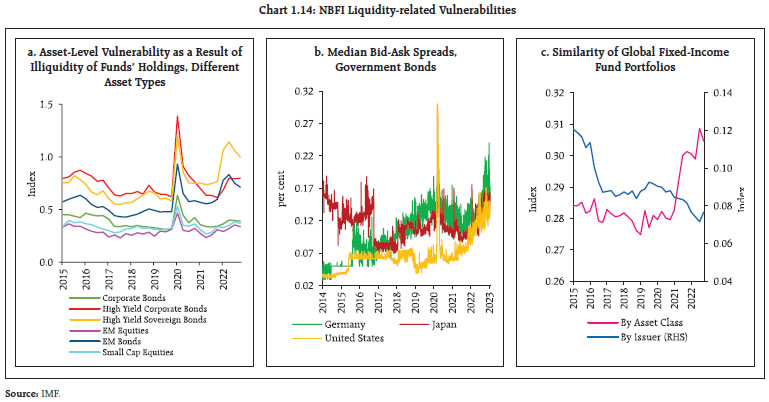
 B. Non-financial Sector Debt Burden 1.22 Debt levels in all three components of the non-financial sector, viz., governments, non-financial corporates and households remain high, though they have marginally declined from the pandemic period peaks in both AEs and EMDEs (Chart 1.11 a, b, c and d). 1.23 High levels of debt in a period of elevated interest rates and increased uncertainty make debt servicing difficult for borrowers, which remains a major vulnerability in the face of two tricky propositions. First, there is a growing chorus demanding reduction in public debt, which rose significantly during the pandemic, especially in AEs. Second, quantitative tightening by central banks could pose challenges for governments at a time when market liquidity is poor and fresh debt issuance must be absorbed by private investors. 1.24 In a tightening monetary policy cycle, high private debt levels impact aggregate demand through multiple channels. First, they lower disposable income by increasing debt service costs. Second, they strain the balance sheets of businesses and households. Third, by distributing income from debtors with high marginal propensity to consume to savers with less propensity to spend, they reduce aggregate demand, especially if the share of variable rate and short-maturity debt is high8.  1.25 EMDEs and frontier economies remain particularly vulnerable as high debt levels could create debt servicing difficulties and consequent capital outflows. Increase in bond spreads and depreciation in exchange rates may aggravate their debt burden. More recently, issuances of fresh bonds are slowing, while capital flows are yet to fully recover (Chart 1.12 a and b). According to the IMF, spreads of over 40 per cent of frontier bonds with maturity till 2025 are trading at distressed levels, i.e., 1,000 basis points above US treasuries9. C. Non-Banking Financial Intermediaries (NBFIs) 1.26 NBFIs, which now account for nearly half of all global financial assets10, play a vital role in the global financial system, fostering efficiency and diversification of risks, and as a major source of capital flows to EMDEs. During the recent banking turmoil in the U.S., depositors shifted a significant portion of their funds to NBFIs from relatively more intensely regulated and supervised banking sector. Balance sheets of NBFIs involve high degrees of liquidity and maturity transformation, making them vulnerable to economic fluctuations and prone to asset valuation changes as monetary conditions change. Their leverage and liquidity profiles carry the potential to amplify shocks, especially, with their growing interconnectedness with the rest of the financial system. 1.27 While authorities have put in guardrails to control banking sector leverage, pockets of high leverage remain among NBFIs, posing systemic concerns. Elevated levels of off-balance sheet financial leverage indicate that overall synthetic leverage may be approaching historic highs (Chart 1.13 a and b). 1.28 Hedge funds aim to generate risk-adjusted returns in all market conditions, which can magnify financial stress. Their reliance on prime brokers11, creates hidden leverage in the financial system. Significant data gaps as well as limitations in aggregating existing data make it difficult to monitor and assess the impact of NBFI leverage and impede formulation of risk-mitigating measures. 1.29 The NBFI universe covers a wide range of institutions with different business models and liquidity needs. As the market turmoil in March 2020 and the UK gilts crisis in September 2022 showed, liquidity stress in the NBFI sector can spill over to the broader financial system. Three major liquidity-related vulnerabilities associated with NBFIs are: (i) liquidity mismatches, which involve promising investors daily redemption of shares while holding illiquid assets (Chart 1.14 a); (ii) liquidity spirals that result in deterioration in funding and market liquidity due to decline in asset prices (Chart 1.14 b); and (iii) crowded trades in which entities have common exposures (Chart 1.14 c)12. 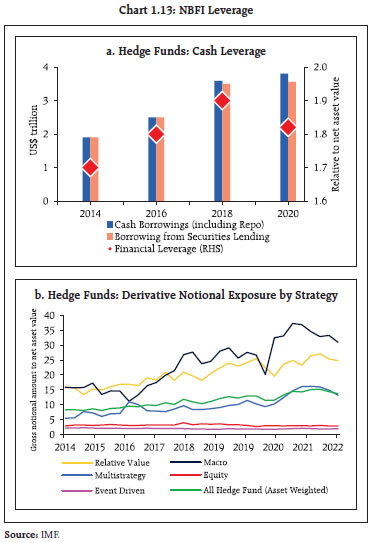
 1.30 Interconnectedness of NBFIs with the rest of the financial system has increased over the years even though the share of funding of other financial institutions (OFIs, i.e., NBFIs other than insurance corporations, pension funds and financial auxiliaries) by banks and insurance companies has come down. This can exacerbate the procyclicality of capital flows to EMDEs (Chart 1.15 a, b and c). D. Financial Fragmentation 1.31 Amidst escalating geopolitical tensions, there are serious concerns about the fragmentation of the global economy and the financial system. Impediments to flows of capital and technology have increased, with adverse implications for cross-border investment, global payment networks and asset prices through two important channels. The financial channel leads to reallocation of capital and consequent liquidity and solvency stress on financial and non-financial firms as well as households through increased risk aversion among investors and/ or through restrictions on capital flows and payments. The real channel poses restrictions on international trade, technology transfer and supply chain disruptions. The two channels are mutually reinforcing and vulnerable to adverse feedback loops, which can impact the balance sheets of both banks and NBFIs. The financial channel can increase the cost of funding, leading to decline in investments and overall profitability (Chart 1.16 a, b and c) as well as reduce foreign direct investment (FDI) – global FDI fell from a high of 5.3 per cent of GDP in 2007 to as low as 0.5 per cent in 2018, before recovering to 1.7 per cent in 2022 (Chart 1.16 d). The real channel transmission, on the other hand, could diminish risk-taking capacity of financial institutions and constrain funding of real sector growth requirements. 
 E. Climate Change 1.32 Climate change is recognised as a strong theme for coordinated policy action. Global efforts to reduce carbon emissions and transition to a greener economy would require massive investment in most countries. The average yearly investment needed to complete the transition so that emissions hit net zero by 2050 is projected at US$ 5 trillion (estimates range from US$1.9 trillion to US$ 9.2 trillion) for the next three decades (Table 1.1). | Table 1.1: Investment Requirement to reach Net Zero by 2050 | | Source | Average annual investment till 2050
(US$ trillion) | Scenario/ Scope/ Assumption | | McKinsey | 9.2 | Investments across energy supply, energy demand and land use | | Bloomberg New Energy Finance (BNEF) | 6.7 | Growth in new demand-side sectors anticipated | | International Energy Agency (IEA) | 4.5 | Energy related investment | | International Renewable Energy Agency (IRENA) | 4.4 | Energy related investment | | Rockefeller Foundation and BCG | 3.8 | Considers all type of financing related to climate impact | | Energy Transitions Commission | 3.5 | Gross investment | | Goldman Sachs | 1.9 | Incremental infrastructure investment | | Source: BNEF, Energy Transitions Commission, Goldman Sachs, IEA, IRENA, McKinsey, Rockefeller Foundation and BCG. | 1.33 Population growth, economic growth, and urbanisation are projected to lead to faster rise in emissions in EDMEs, based on current policies and stated nationally determined contributions (NDCs)13. On a per capita basis, however, emissions are lower in EMDEs (excluding China), compared to their AE counterparts (Chart 1.17 a and b). Nevertheless, substantial investments are required towards decarbonisation in EMDEs. Estimates show that EMDEs will require climate finance in the range of US$ 2 – US$ 3 trillion by 203014, which amounts to nearly half of the total annual global investment needs. Sustainable debt issuances by EMDEs have, however, declined sharply in Q1:202315 (Chart 1.17 c). 1.34 From a financial stability perspective, risks arise from physical risks (i.e., severe weather events such as floods, storms, heatwaves and fires) and transition risks (i.e., risks associated with adjusting to a low-carbon economy driven by government policies, technological developments and change in consumer preferences). Physical risks affect banks directly by increasing credit, market, operational and liquidity risks which, in turn, can impact their profitability and solvency. The effect of transition risks, on the other hand, will vary depending upon whether the transition is orderly or disorderly. A disorderly transition will result in significant adjustment costs for all economic agents, leading to stranded financial assets and increasing probability of default by borrowers. 1.35 Severe natural disaster incidents would increase system-wide non-performing loans (NPLs) and keep them at elevated levels for longer period. The gross NPL ratio is estimated to increase by 0.37 percentage points in the year after disaster events. The ratio will increase by 0.56 and 0.60 percentage points on an average in year two and three with episodes involving multiple disasters16 (Chart 1.18). 1.36 Given the effect of climate-related events on the financial sector, two major challenges can arise, viz., (i) recalibrating operations and business strategies to support green transition; and (ii) strengthening resilience in the face of rising vulnerability to adverse climate change17. Accordingly, global efforts are intensifying for collecting reliable data to identify the channels through which climate-related events affect the financial sector with a focus on rigorous stress-testing for climate risks. F. Growth of Digital Finance 1.37 Digital money and payments systems are transforming the global finance landscape, with profound implications for the international monetary and financial system. Digital innovations contribute to welfare gains by smoothening business processes and facilitating customer services. They are, however, also vulnerable to quick system-wide disruptions with amplified spillovers. Appropriate safeguards are, therefore, required to be built into their design, regulation and integration with existing systems, taking into account their ramifications for currency substitution, capital flows and financial disintermediation18. 1.38 The recent banking turmoil highlighted how transition to digital banking has altered the value of the deposit franchise19 and impacted the stability of the banking system. Empirical evidence that is now available20 shows that (a) deposit beta, which measures the sensitivity in deposit rates in response to central bank rate changes, is significantly higher among digital banks21 relative to non-digital banks; and (b) the market value of the failed Silicon Valley Bank as of December 2022 was US$ 5 billion less than the value of liabilities if the parameters of digital bank were applied. 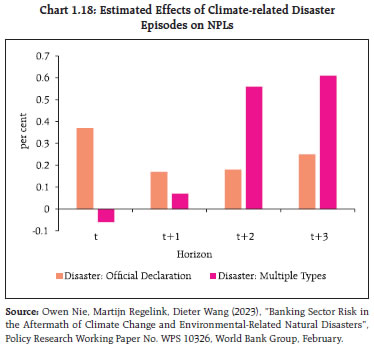 1.39 The turmoil in crypto markets throughout 2022, which included the bankruptcy of the largest crypto trading platform, and the failure of two banks in March 2023 that had significant exposure to the crypto industry, highlights the growing linkages between the traditional banking system and the crypto ecosystem (Chart 1.19 a and b). At the same time, decentralised finance (DeFi), which aims to replicate functions of traditional finance (TradFi), is emerging among the fastest-growing segments in the crypto ecosystem. G. Artificial Intelligence and Financial Services 1.40 Technological advancements aided by affordable high-end computing power have led to widespread adoption of artificial intelligence (AI) tools across different spheres. AI is reshaping financial services by its wide-ranging applications, which encompass process automation, risk assessment, credit scoring, regulatory compliance, customised financial products, and predictive analytics. AI-powered chatbots and machine learning (ML) algorithms ensure round-the-clock customer support and can detect fraudulent activities expeditiously, thereby enhancing operational efficiency and precision. 1.41 The public release of OpenAI’s generative pre-trained transformer (GPT) model in June 2020 led to a striking change in the way knowledge is acquired from the internet. While there is an animated debate on the potential impact of AI on humanity, big technology companies are in fierce competition for enhancing user experiences to gain an edge in market power in emerging technologies (Chart 1.20). 1.42 International organisations are stressing on the need for enhanced safeguards and global cooperation in this context. A proactive and informed approach for navigating risks needs to prioritise: (a) customer expectations; (b) cybersecurity threats; (c) data privacy; (d) sensitivity to ethical concerns related to bias, transparency and accountability; (e) collaboration among financial institutions and industry stakeholders for integration of processes; (f) regulatory compliance; and (g) minimising skill gap to keep pace with rapid technological changes22. 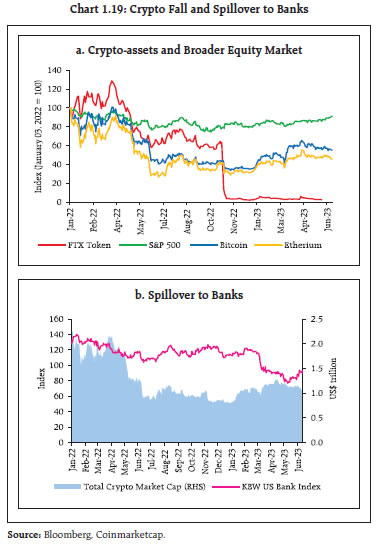

 1.43 Quantum computing can further enrich optimisation in the financial sector and enhance encryption algorithms as well as break encryption technologies. Its potential impact on AI based financial services, however, needs to be assessed carefully, with the need for development of quantum resistant encryption to safeguard sensitive financial data. Models and training data used to create AI will need to be regularly re-programmed to learn and improve to remain relevant and obviate any systemic disruption in financial services. This requires regular collaboration with stakeholders for seizing opportunities, measuring and managing risks and adjusting policies, regulations and supervisory approaches to ensure an inclusive, sustainable and secure financial intermediation. H. Commodity Markets 1.44 Prices of major commodities such as fuel and energy, metals, edible oils, wheat and maize have moderated during 2023 so far, although their future evolution would depend on fundamental factors including the strength of global demand, monetary conditions and the course of geopolitical developments (Chart 1.21 a and b). 1.45 Industrial metals prices have traded sideways and moved broadly in tandem with other risk assets. In contrast, price of precious metals, viz., gold and silver, have risen, reflecting the highly uncertain macroeconomic and financial environment (Chart 1.22 a and b). 1.46 Global food prices, which surged around the onset of the Russia-Ukraine war, have been undergoing gradual correction since mid-2022 (Chart 1.23). During 2023 so far, wheat futures have dropped by over 15 per cent, and overall cereals have recorded a 12 per cent price decline. While supplies of wheat and corn have benefited from the ‘Black Sea Grain Initiative’, geopolitical stress continues to pose risks. 1.47 Despite the moderation in prices of salient food articles, countries in the middle and low income categories continue to face food insecurity - the number of people facing acute food insecurity increased from 192.8 million in 2021 to 257.8 million in 202223 with conflicts, weather extremes, and global as well as national economic shocks acting as interrelated and mutually reinforcing drivers. 1.48 The World Meteorological Organisation24 projects a moderate probability (60 per cent chance) of the onset of El Niño during May-July 2023. This probability is expected to increase to 60-70 per cent during June-August and it is highly likely (with a chance of 70-80 per cent) that El Niño will persist into the boreal autumn (i.e., September−October) of 2023. As per the World Bank25, El Niño could affect agricultural production on more than 25 per cent of the global cropland. 1.49 The IMF expects both fuel and non-fuel commodity prices to generally decline in 2023 amidst slowing global demand (Chart 1.24). I.2 Domestic Macrofinancial Risks 1.50 The Indian economy has exhibited resilience and dynamism in spite of formidable headwinds and an uncertain global economic outlook. The rising momentum of domestic economic activity is supported by an environment of macroeconomic stability marked by moderating inflation, fiscal consolidation, external viability and financial stability. The domestic financial system has been largely immune to the recent banking turmoil in some AEs. Indian banks have reinforced their capital bases and their asset quality has improved. The aggregated balance sheet of non-banking financial companies (NBFCs) also remains healthy and assets under management (AUM) of mutual funds have recorded steady growth. These developments augur well for the prospects of financial intermediation in the context of the evolving macroeconomic and financial outlook for India.
I.2.1 Domestic Growth and Inflation 1.51 Buoyed by both private and government consumption demand, rising investment and improving consumer and business optimism, India’s real GDP grew by 5.3 per cent in H2:2022-23 and is projected to grow by 6.5 per cent in 2023-24 (Chart 1.25). 1.52 The revival in domestic demand, increasing capacity utilisation in the manufacturing sector, easing input cost pressures and more recently, improvement in profitability are catalysing the commercial sector to avail more finances from domestic as well as external sources than a year ago (Chart 1.26 a and b).
1.53 Moderation in real wages and recent signs of tempering of private consumption are emerging as constraining factors (Chart 1.27 a and b), alongside weakening external demand, which may impact export prospects (Chart 1.28 a and b). 1.54 Driven down by a broad-based moderation in prices, the headline consumer price index (CPI) inflation came down sharply from a peak of 7.8 per cent in April 2022 to 4.3 per cent in May 2023, though core inflation (i.e., excluding food and fuel items) remained somewhat higher at 5.1 per cent (Chart 1.29 a and b). A combination of monetary policy tightening and supply-side measures led to this disinflation. According to the latest households’ inflation expectations survey (June 2023), inflation expectations of households have been moderating since September 2022.
I.2.2 Corporate Sector 1.55 The improvement in demand conditions has sustained growth, earnings and profitability of the private corporate sector (Chart 1.30). 1.56 Leverage of listed private non-financial companies declined in H2:2022-23 due to lower levels of debt and increase in retained earnings (Chart 1.31a). The share of cash holdings (including balances with banks and highly liquid investments) in total assets increased during H2:2022-23 (Chart 1.31 b). The share of fixed assets in the total use of funds went marginally above 40 per cent during both H1 and H2 of 2022-23.
1.57 In India, the share of debt held by listed private non-financial companies with interest coverage ratio (ICR) below unity has been declining steadily from 2016-17. Moreover, their share in aggregate sales is low, indicating that the sub-unity ICR group is dominated by smaller companies (Table 1.2). Also, non-IT services companies have significantly higher debt servicing vulnerability vis-à-vis manufacturing companies, whereas IT companies are in the most comfortable position (Chart 1.32). 1.58 An analysis of the listed private non-financial companies with ICR below unity showed that the exposure of SCBs to them was limited to 0.5 per cent of their total loans and advances. Thus, from a systemic risk perspective, the threat to banking system stability is limited. 1.59 Start-ups across geographies are witnessing a synchronised funding crunch. Venture capital (VC) funding has seen a marked downturn across funding stages and sectors from its peak level in 2021 (Chart 1.33 a and b). | Table 1.2: Share of Debt# held by Listed Private Non-Financial Companies by ICR Categories | | Items | Audited Balance Sheet | Half-yearly (unaudited) | | 2016-17 | 2017-18 | 2018-19 | 2019-20 | 2020-21 | 2021-22 | H2:2021-22 | H1:2022-23 | H2:2022-23 | | No. of sample Companies | 3,238 | 3,231 | 3,205 | 3,163 | 3,103 | 2,963 | 2,844 | 2,690 | 2,710 | | Share in sample companies | | (per cent) | | ICR <=1** | 35.5 | 34.2 | 34.1 | 37.6 | 34.7 | 32.6 | 32.7 | 28.2 | 27.5 | | 1 < ICR <= 4 | 34.8 | 34.3 | 27.6 | 25.2 | 31.5 | 15.2 | 14.5 | 23.4 | 25.1 | | ICR > 4 | 29.6 | 31.5 | 38.3 | 37.2 | 33.8 | 52.2 | 52.8 | 48.4 | 47.4 | | Sales share of companies with ICR <1 | | (per cent) | | | Manufacturing | IT | Non-IT services | Aggregate | | 2020-21 | 6.8 | 3.0 | 44.1 | 10.5 | | 2021-22 | 5.1 | 1.6 | 36.5 | 9.3 | | 2022-23* | 3.6 | 1.3 | 20.9 | 5.4 | Note: # debt Includes total liabilities less total equity (including reserves); * based on quarterly results of 2774 companies; ** also includes companies with negative ICR.
Source: Capitaline, RBI Staff Calculations. |
 1.60 Start-ups in India are also facing funding stress26 (Chart 1.34). Tighter liquidity conditions, uncertain global macroeconomic outlook, and geopolitical fragmentation continue to pose risks that may trigger correction in valuations of these firms and a wave of consolidation. Investors are also exercising more caution due to lacklustre stock market performance of some new age technology companies, which significantly depend on foreign capital and are, therefore, more exposed to risks of tightening global financial conditions. I.2.3 Money, Government Securities and Corporate Bonds Markets 1.61 Domestic liquidity conditions have tightened with fuller monetary policy transmission. Long-term rates have plateaued since the December FSR and, in some cases, eased subsequently as markets factor in the recent fall in inflation (Chart 1.35 a and b).
1.62 Average daily absorptions under the liquidity adjustment facility (LAF) declined from ₹2.86 lakh crore during the financial year 2022-23 to ₹1.75 lakh crore in April-June 2023 (till June 20, 2023). Maturity of long-term repos, seasonal expansion in currency, variation in government spending and withdrawal of ₹2000 denomination bank notes from circulation have contributed to changes in liquidity conditions. The Reserve Bank has modulated the system-level liquidity through its main and fine-tuning operations and ensured that money market rates have generally evolved in an orderly manner (Chart 1.36). 1.63 The sovereign yield curve flattened as short and long-term yields converged, with term spreads falling to multi-period lows (Chart 1.37 a and b). In response to monetary tightening that began in April 2022, tightness in system liquidity and global monetary policy developments, short-term yields rose faster than long-term yields. In general, such ‘bear flattening27’ marks a transition. For the Indian economy, it is signalling re-anchoring of inflation expectations amidst growth momentum in underlying economic activity. 1.64 Corporate bond spreads of AAA-rated firms increased moderately but remained below the levels seen during the onset of the pandemic (Chart 1.38 a). The median spreads of listed non-convertible debentures (NCDs) over the benchmark yield of 3-year government security declined for all rating grades, both in the primary and secondary segments (Chart 1.38 b and c).
1.65 NBFCs, housing finance companies (HFCs) and public sector undertakings (PSUs) were the major issuers of corporate bonds (Chart 1.39 a). NBFCs, in particular, have raised more funds through public issues than private placement (Chart 1.39 b). Banks and corporates were the main subscribers with residents dominating the public issue space (Chart 1.39 c and d).
I.2.4 Government Finance 1.66 In 2022-23 (PA), the government achieved its budgeted gross fiscal deficit (GFD) target of 6.4 per cent of GDP, as higher subsidy payouts on the back of elevated commodity prices were offset by buoyant direct tax and Goods and services tax (GST) collections (Chart 1.40 a). Year-on-year (y-o-y) growth in capital expenditure stood at 24.2 per cent, vis-à-vis revenue expenditure growth of 7.9 per cent, reflecting the ongoing improvement in the quality of expenditure (Chart 1.40 b). 1.67 In 2023-24 (BE), the GFD is budgeted at 5.9 per cent of GDP, a reduction of 44 basis points over 2022-23 (PA) [Table 1.3]. The consolidation is sought to be achieved through containment of revenue expenditure at 11.6 per cent of GDP, with a rollback of spending on subsidies. Capital expenditure, on the other hand, is budgeted to rise to 3.3 per cent of GDP, from an average of 1.7 per cent of GDP during 2010-20, led by the Ministries of road and railways. Further, to incentivise capex by state governments, the scheme for providing financial assistance to states for capital investment has been extended to 2023-24 (BE) with an enhanced outlay of ₹1.3 lakh crore. On the receipts side, gross tax revenue is budgeted to increase by 10.1 per cent, with direct and indirect taxes expected to grow at 9.8 per cent and 10.4 per cent, respectively. The centre’s debt-to-GDP ratio at 60.1 per cent in 2021-22 is budgeted to decline to 57.8 per cent in 2023-24 as fiscal rectitude continues. | Table 1.3: Central Government Finances - Key Deficit Indicators | | (per cent of GDP) | | Item | 2021-22 | 2022-23 (PA) | 2023-24 (BE) | | Revenue Deficit | 4.4 | 3.9 | 2.9 | | Gross Fiscal Deficit | 6.8 | 6.4 | 5.9 | Note: PA – Provisional Accounts; BE – Budget Estimates.
Source: CGA and Union Budget Documents. | 1.68 Net market borrowings of the central government during 2023-24 is budgeted at 3.9 per cent of GDP28 vis-à-vis the pre-pandemic (2018-2020) average of 2.4 per cent of GDP. The weighted average yield of primary government securities (G-sec) issuances increased to 7.32 per cent in 2022-23 from 6.28 per cent in the previous financial year (Chart 1.41). 1.69 States’ fiscal position has witnessed a sharp revival from the pandemic-induced deterioration seen during 2020-21. The consolidated gross fiscal deficit (GFD) of states and Union Territories (UTs) declined from the peak of 4.1 per cent of GDP in 2020-21 to 2.8 per cent in 2021-2229 and has remained at the same level in 2022-2330 as well, which is much lower than the budget estimate of 3.4 per cent for the year. This swift consolidation was primarily driven by a decline in revenue expenditure coupled with an increase in states’ own tax revenue led by states’ GST. For 2023-2431, the states have budgeted a GFD-GDP ratio of 3.2 per cent, which is significantly lower than the indicative target of 3.5 per cent set by the central government. 1.70 Capital Expenditure (capex) of the states reached 2.5 per cent of GDP in 2021-22 and remained at the same level in 2022-23 (PA). States’ capex is budgeted to increase further to 3.2 per cent of GDP in 2023-24 (BE). Revenue expenditure, on the other hand, declined from 14.2 per cent of GDP in 2021-22 to 13.5 per cent in 2022-23 (PA). This has resulted in an improvement in the quality of expenditure - the revenue expenditure to capital outlay (RECO) ratio for the states has improved from 7.1 during 2020-21 to 5.1 in 2023-24 (BE) (Table 1.4). 1.71 Reflecting strong fiscal consolidation efforts of the states, their total outstanding liabilities have moderated significantly in the last three years. After reaching a 15-year high of 31.0 per cent of GDP at end March 2021, states’ outstanding liabilities came down to 27.9 per cent of GDP by end March 2023 (Chart 1.42). Debt service burden of the states measured in terms of interest payments to revenue receipts (IP/RR) ratio has also moderated during this period.
| Table 1.4: State Government Finances - Key Fiscal Indicators | | (per cent of GDP) | | Item | 2021-22 Accounts | 2022-23 (PA) | 2023-24 (BE) | | Revenue Deficit | 0.4 | 0.3 | 0.2 | | Gross Fiscal Deficit | 2.8 | 2.8 | 3.2 | | Primary Deficit | 1.0 | 1.2 | 1.4 | | RECO Ratio | 6.2 | 6.1 | 5.1 | Note: PA - Provisional Accounts; BE - Budget Estimates.
Source: Budget document of states and CAG. |
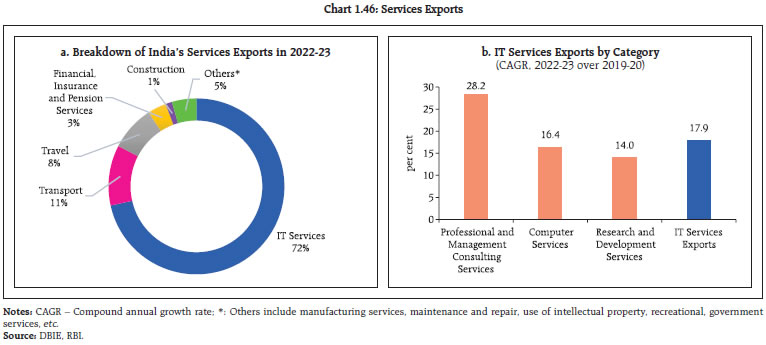
1.72 At 27.9 per cent of GDP at end-March 2023, the debt level of the states is still higher than the 20 per cent limit recommended by the Fiscal Responsibility and Budget Management (FRBM) Review Committee (2018) and warrants further consolidation. At a disaggregated level, a few large states have debt-to-GSDP ratios exceeding 35 per cent. I.2.5 External Sector and Foreign Exchange Market 1.73 External sector sustainability has improved on the back of strong exports of services and a narrowing of merchandise trade deficit, which fell to US$ 22.1 billion in May 2023 from a peak of US$ 28.0 billion in September 2022 (Chart 1.43 a and b). 1.74 India’s current account deficit (CAD) narrowed to 0.2 per cent of GDP (at current market prices) in Q4:2022-23 from 3.8 per cent and 2.0 per cent in Q2 and Q3 of 2022-23, respectively. A narrowing of the merchandise trade deficit and robust services exports were the major factors that contributed to the decline in the CAD (Chart 1.44). 1.75 As net capital inflows exceeded the CAD, there was an accretion to the foreign exchange reserves to the tune of US$ 5.6 billion on a balance of payments (BoP) basis during Q4:2022-23 (Chart 1.45). 1.76 The information technology sector has led the robust growth in exports of services. Export through technology driven innovations in professional and management consulting services, research and development, drugs and pharmaceutical products and mobile handsets are also gaining global market share (Chart 1.46 a and b). The proliferation of global capability centres (GCCs) that provide services such as automation, consulting, AI and machine learning, is instrumental in driving future growth in these dynamic areas. 1.77 Tightening of global financial conditions, repeated episodes of turbulence and heightened uncertainty have adversely impacted capital flows to EMDEs, including India. Net foreign direct investment (FDI) was lower at US$ 28.0 billion in 2022-23 relative to US$ 38.6 billion in the previous year. Global FDI flows are slowing down in recent years, driven by emergence of new regional blocs, friendshoring and reshoring, and geopolitical fragmentation32. Foreign portfolio investment (FPI) flows to India remained volatile and recorded net outflows of US$ 4.8 billion during 2022-23. External commercial borrowings (ECBs) also reported net outflows. During 2023-24 so far (till June 23, 2023), net FPI inflows amounted to US$ 10.1 billion, while net FDI and net ECB inflows amounted to US$ 2.8 billion and US$ 0.7 billion, respectively (Table 1.5). 
 1.78 Of the ECBs registered during 2022-23 (amount: US$ 26.6 billion), 48.5 per cent were explicitly hedged, 15.9 per cent were from FDI parent companies and 7.4 per cent were denominated in the Indian Rupee (INR). The remaining 28.2 per cent included loans that had natural hedge (i.e., borrowers’ business earnings in foreign currency). At end-March 2023, a major component of outstanding ECB loans remained hedged. 46 per cent of total outstanding loans remained unhedged, including loans with natural hedges (Table 1.6). 1.79 There has been a marked improvement in external vulnerability indicators. India’s foreign exchange reserves stood at US$ 596.1 billion as on June 16, 2023, which is sufficient to cover about ten months of actual imports (on a BoP basis) for 2022-23 and 97.2 per cent of total external debt. Furthermore, the external debt to GDP ratio moderated to 19.1 per cent in December 2022 from 20.0 per cent in March 2022, which augurs well for mitigating external risks and adverse effects of global spillovers (Chart 1.47). | Table 1.5: Net Capital Flows | | (US$ billion) | | Component | Financial year so far | Financial year (Apr-Mar) | | Period | 2023-24 | 2022-23 | 2022-23 | 2021-22 | | 1. FDI (Net) | April | 2.8 | 5.3 | 28.0 | 38.6 | | 2. FPI (Net) | April-June | 10.1 | -14.0 | -4.8 | -14.1 | | 3. ECB to India (net) | April-May | 0.7 | -1.9 | -4.1 | 7.4 | Note: Data on FPI for financial year so far (June 23, 2023) and corresponding period previous year and 2022-23 have been sourced from NSDL, whereas data for 2022-23 and 2021-22 are based on BoP.
Source: RBI and NSDL. |
| Table 1.6: Hedging of ECB loans | | (US$ million) | | Description | Mar-2023 | | A. ECB – Total outstanding | 1,75,797 | | B. ECB – INR denominated | 14,835 | | C. ECB – FDI Companies’ borrowings from foreign parent | 29,439 | | Of which: | | | (a) INR denominated | 10,890 | | (b) FCY denominated | 18,549 | | D. ECB – Non-Rupee and non-FDI [= A-B-C(b)] | 1,42,413 | | Of which: | | | (a) Public sector companies | 53,770 | | (b) Private companies and others | 88,643 | | E. Hedging details of non-Rupee non-FDI ECBs (i.e., D above) | | | (1) Hedging declared on registration from April 2019 | 47,501 | | Of which: | | | (a) Public sector companies | 8,306 | | (b) Private companies and others | 39,195 | | (2) Other past loans reported hedged by borrowers | 14,571 | | Of which: | | | (c) Public sector companies | 5,929 | | (d) Private companies and others | 8,642 | | F. ECB – Unhedged {D-(E1+E2)} | 80,341 | | G. Share of unhedged non-INR non-FDI ECB {(F)/(A)*100} | 46 | | Source: RBI. |
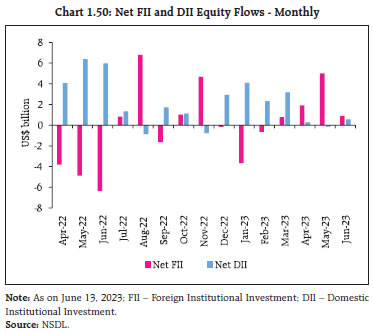
 1.80 The Indian Rupee (INR) has been trading rangebound during 2023 so far (Chart 1.48 a). Bouts of exchange rate volatility witnessed during 2022, partly driven by sharp swings in the US dollar, have tapered in recent months and since March 2023, short-term volatility is at its lowest in the last few years. The INR remains one of the most stable currencies in the world (Chart 1.48 b and c). I.2.6 Equity Markets 1.81 Reflecting the underlying strength of the Indian economy and improving growth prospects, the Indian equity market has remained among the stronger performers globally, despite volatile shifts in global liquidity flows and sentiments, monetary tightening and the recent geopolitical and banking sector turmoil (Chart 1.49). Earnings sentiment has improved sharply across most sectors. 182 out of 200 firms in the BSE 200 index reported profit growth of 5 per cent (y-o-y) and 23 per cent (q-o-q). There has been a sharp rebound among foreign institutional investors who have made net purchases of US$ 11.6 billion since March 2023 (till June 23, 2023), while domestic institutional investors continue to provide support as net buyers (Chart 1.50). 1.82 Empirical evidences suggest that the FPI flows are a major contributor to volatility spillovers in various segments of Indian financial market, largely transmitting their impact through equity market (Box 1.1). 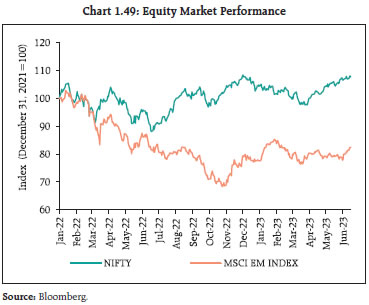
Box 1.1: Volatility Spillovers across Markets in India A rise in financial stress leads to higher market volatility, which propagates through multiple channels across asset markets. Indian markets are fairly integrated with overseas markets and foreign portfolio investments have emerged as a major channel of transmission of global spillovers. Measures of volatility spillovers across markets provide an early warning signal to identify emerging risks to financial stability. Annualised standard deviations using daily data suggest that the equity market has been the most volatile, followed by the bond market. The foreign exchange market and commodities market (proxied by gold futures market) have been comparatively less volatile (Chart 1). A total volatility spillover index, which is reported to be better at capturing spillover dynamics than generalised auto-regressive conditional heteroskedasticity (GARCH) models (Barunik et al, 2015) measures both total and directional volatility spillovers in a generalised vector autoregression (VAR) framework in which forecast-error variance decompositions are invariant to variable ordering (Diebold and Yilmaz, 2012). The time-varying total volatility spillover index is based on a VAR (of order 4) with 10-day forecast error variance over the sample period from January 2012 to April 2023. It investigates the channels of volatility transmission across asset markets, i.e., equity market (BSE Sensex), the bond market (yields of benchmark 10-year Government of India dated securities), the foreign exchange market (USD-INR exchange rate), and the commodity market (using gold as a proxy for movement in commodities). The volatility spillover table, which provides the input-output decomposition of the total volatility spillover index, indicates that spillovers from the stock market to other market segments are the largest (17.9 per cent), and the commodity market is found to be the largest recipient of volatility spillovers from other markets (16.4 per cent) (Table 1). The total volatility spillovers across all the four markets – a distillation of the various directional volatility spillovers into a single index – is 10.5 per cent, i.e. the share of the volatility forecast error variance in all four asset markets that emanates from spillovers.  As financial markets evolve and absorb different shocks over a period, an average volatility spillover number does not present secular and cyclical movements over time (Diebold and Yilmaz, 2012). Volatility spillovers using 200-day rolling samples indicate interlinkages in asset markets and their vulnerability to internal and external shocks. If the volatility spillover index crosses one standard deviation above its average value (which is 32) over the sample period, contagion risk intensifies in the domestic financial market (Chart 2). | Table 1: Volatility Spillovers across Markets | | | Equity | Forex | Bond | Gold | Directional from others | | Equity | 96.6 | 1.3 | 1.6 | 0.5 | 3.4 | | Forex | 1.5 | 86.6 | 11.0 | 1.0 | 13.4 | | Bond | 3.1 | 4.9 | 91.3 | 0.7 | 8.7 | | Gold | 13.3 | 2.3 | 0.9 | 83.6 | 16.4 | | Directional spillover to others | 17.9 | 8.4 | 13.4 | 2.2 | Total Spillover Index = 41.9*100/400 = 10.47 | | Directional spillover including own | 114.5 | 95.0 | 104.7 | 85.8 | | Source: RBI staff calculations. |
| Table 2: Causal Relationship between FPI Flows and Volatility Spillovers | | Null Hypotheses | F-statistic | P-value | | Volatility Spillovers does not Granger cause FPI | 1.28 | 0.18 | | FPI does not Granger cause Volatility Spillovers | 1.87 | 0.01 | | Source: RBI staff calculations. | The impact of capital flows on volatility spillovers in domestic market suggests that net FPI flows Granger cause volatility spillovers across markets, which confirms that the equity market is the largest contributor to volatility spillovers. Volatility spillovers were, however, not found to Granger cause FPI flows (Table 2). References: 1. Diebold, F. X., and Yilmaz, K. (2012), Better to Give than to Receive: Predictive Directional Measurement of Volatility Spillovers. International Journal of Forecasting, 28(1), 57–66. 2. Barunik, J., E. Kocenda and L. Vacha (2016), Asymmetric Connectedness on the U.S. Stock Market: Bad and Good Volatility Spillovers. Journal of Financial Markets, 27, 55-78. | 1.83 Both implied volatility based on option prices and realised volatility have been lower than other emerging market and advanced economy stock markets (Chart 1.51 a and b). Banking stocks, which witnessed a fall at the onset of the banking turmoil in the U.S. and Europe, recovered fully and continue to perform in sync with the broader index (Chart 1.52). 1.84 Based on both trailing and forward price-to-earnings ratio (P/E), Indian equities are at higher valuations compared to their peers in other countries (Chart 1.53). I.2.7 Mutual Funds 1.85 The assets under management (AUM) of the domestic mutual fund (MF) industry, excluding domestic fund of funds (FoF), declined marginally by 1.2 per cent since December 31, 2022 to ₹39.4 trillion as on March 31, 2023, but increased thereafter to ₹43.2 trillion in May 2023 (Table 1.7). 1.86 Debt-oriented schemes witnessed net redemptions to the tune of ₹1.8 lakh crore in 2022-23, largely caused by withdrawal of preferential tax treatment for investments in these funds, which brought uniformity in taxation among different fixed-income investment avenues33 (Chart 1.54 a and b).
| Table 1.7: AUM of the Domestic Mutual Fund Industry | | (₹ crore) | | As on | B30 AUM | T30 AUM | Industry AUM | | Equity | Non-Equity | Total | Equity | Non-Equity | Total | Equity | Non-Equity | Total | | Dec 31, 2022 | 4,31,793 | 2,79,095 | 7,10,889 | 12,04,743 | 20,73,103 | 32,77,847 | 16,36,537 | 23,52,199 | 39,88,735 | | Mar 31, 2023 | 4,28,396 | 2,81,797 | 7,10,193 | 11,93,975 | 20,37,863 | 32,31,838 | 16,22,371 | 23,19,660 | 39,42,031 | | May 31, 2023 | 4,66,707 | 3,01,044 | 7,67,751 | 13,00,460 | 22,52,257 | 35,52,718 | 17,67,167 | 25,53,301 | 43,20,468 | Note: T30 refers to the top 30 geographical locations in India and B30 refers to the locations beyond the top 30 cities.
Source: SEBI. |
1.87 Both debt and equity-oriented schemes, however, witnessed a reversal of flows since Q4:2022-23 and reported net inflows in April 2023 as market sentiment improved after a positive earnings outlook (Table 1.8). I.2.8 Banking Stability Indicator 1.88 The banking stability indicator (BSI)34, which provides an assessment of the state of the domestic banking system, has improved markedly. During H2:2022-23, the soundness of the banking sector improved as capital buffers reached all-time highs. Asset quality strengthened, with multi-year lows in gross NPAs and decline in restructured assets. Liquidity improved as customer deposits and liquidity coverage ratio (LCR) increased. Increase in operating expenses led to marginal deterioration in efficiency. Decline in market risk-weighted assets improved the market indicator (Chart 1.55 and 1.56). | Table 1.8: Trends in Resource Mobilisation by Mutual Funds | | (₹ crore) | | Months | Dec-22 | Jan-23 | Feb-23 | Mar-23 | Apr-23 | May-23 | | Debt Oriented Schemes | | Net Inflows/Outflows-Debt | -20,604 | -9,734 | -13,199 | -54,111 | 1,05,704 | 43,834 | | AUM-Debt | 12,65,127 | 12,62,074 | 12,54,636 | 12,09,976 | 13,25,976 | 13,74,524 | | Equity Oriented Schemes | | Net Inflows/Outflows-Equity | 7,280 | 12,472 | 15,657 | 20,190 | 5,275 | 2906 | | AUM-Equity | 15,31,894 | 15,12,952 | 15,08,342 | 15,23,282 | 15,89,149 | 1661022 | | Total | | Net Inflows/ Outflows of Funds | 4,491 | 11,373 | 9,575 | -19,264 | 1,21,435 | 57,420 | | Total AUM | 39,88,735 | 39,62,406 | 39,46,257 | 39,42,031 | 41,61,822 | 43,20,468 | | Source: SEBI. |
I.2.9 Banking System 1.89 The health of the Indian banking system is robust, fortified by a multi-year low non-performing loans and adequate level of capital and liquidity buffers. The system-level gross non-performing assets (GNPA) ratio and net non-performing assets (NNPA) ratio have sharply fallen from a high of 11.5 per cent and 6.1 per cent in March 2018 to 3.9 per cent and 1.0 per cent in March 2023 respectively. Alongside, the provisioning coverage ratio (PCR), which was as low as 40.1 per cent in June 2016, has improved to 74.0 per cent in March 2023 (Chart 1.57). 1.90 The banking system profitability improved with return on assets (RoA) increasing to 1.1 per cent in 2023 from a low of -0.2 per cent in 2018. This in turn helped the capital to risk-weighted assets ratio (CRAR)35 to reach a record high of 17.1 per cent in 2023 (Chart 1.58). Healthier balance sheets are catalysing sustained and broad-based pick-up in the momentum of credit growth, with credit flow improving to all sectors of the economy (Chart 1.59 a and b).
1.91 Despite the recent step up in bank credit growth, India’s credit-to-GDP gap remains negative since March 2013, reflecting still muted credit absorption in India relative to advanced and emerging market peers (Chart 1.60 a, b and c).
1.92 Bank deposits grew by 10.0 per cent (y-o-y) in 2022-23 and improved to 11.8 per cent in early June 2023, partly aided by the announcement of withdrawal of ₹2000 bank notes from circulation (Chart 1.61 a). Although deposits have trailed the rate of credit expansion, the structural liquidity mismatch has been narrowing and the annual incremental credit-deposit (C-D) ratio has come down from its recent peak of 141.8 per cent in November 2022 to 94.7 per cent on June 02, 2023 (Chart 1.61 b). 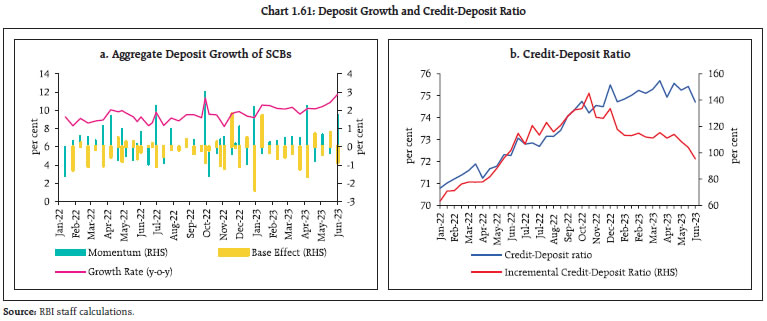
 1.93 Higher non-financial sector debt can increase economy’s sensitivity to monetary tightening and in turn impact banks’ balance sheets. Transmission of policy repo rate since May 2022 to bank lending and deposit rates has ranged between 42 and 63 per cent. Although incomplete, monetary policy transmission has been stronger in this rate tightening cycle relative to historical experience, especially in respect of outstanding loans (Chart 1.62 a and b). The transmission is still working its way through the system and its fuller effects will be seen in the coming months. 1.94 Core debt of private non-financial sector in India is at 90 per cent of GDP [non-financial corporate sector debt is 53.6 per cent and household is 36.4 per cent36] (Chart 1.63 a). In spite of the lagged co-movement between lending rates and the debt service ratio of private non-financial sector, the latter has declined by 3.0 percentage points from its mean level (between 2007 and 2022) (Chart 1.63 b). 1.95 The improvement in borrowers’ debt servicing capacity augurs well for financial stability, alongside the deleveraging in corporate balance sheets since 2015 (Chart 1.64). 1.96 More than two-thirds of total gross advances of fourteen select banks accounting for 81 per cent of the assets of SCBs (excluding SFBs and RRBs) are linked to floating-rates (Table 1.9). 1.97 44.8 per cent of the personal loans extended by these fourteen banks are housing loans, of which 94.8 per cent are at floating rates (Table 1.10). A higher share of variable rate mortgages tends to produce adverse consequences for consumption due to faster pass through of policy rates to borrowing costs37. 1.98 Retail loans grew at a compounded annual growth rate (CAGR) of 24.8 per cent from March 2021 to March 2023, almost double the CAGR of 13.8 per cent for gross advances during the same period. It formed around one-third of the total banking system’s gross loans and advances. The composition of secured and unsecured advances has changed during this period, with unsecured retail loans increasing from 22.9 per cent to 25.2 per cent and secured loans declining from 77.1per cent to 74.8 per cent. Although the GNPA ratio of retail loans at the system level was low at 1.4 per cent in March 2023, the share of special mention accounts (SMA)38 was relatively high at 7.4 per cent for SCBs and it accounted for a tenth of the retail assets portfolio of PSBs (Table 1.11). Importantly, however, SMA 1 and SMA 2 accounts, which have higher proximity to default, have shown improvement with the total ratio of these two categories falling from 4.2 per cent in March 2021 to 2.3 per cent in March 2023. Unsecured retail loans formed only 7.9 per cent of the total banking system credit. Moreover, their asset quality has improved, with GNPA ratio declining from 3.2 per cent to 2.0 per cent during this period. Thus, notwithstanding few signs of potential stress in retail loans, they do not pose an imminent risk to systemic stability. 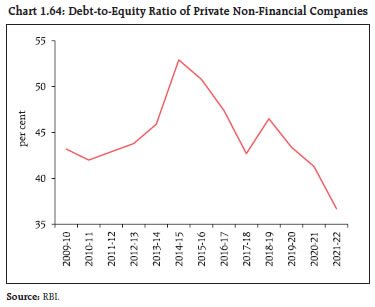
| Table 1.9: Share of Floating Rate Loans | | (per cent) | | | Public Sector Banks (PSBs) (8) | Private Sector Banks (PVBs) (6) | All SCBs (14) | | Agriculture | 91.9 | 40.9 | 79.4 | | Industry | 83.3 | 80.5 | 82.3 | | Services | 77.3 | 75.3 | 76.3 | | Personal (Retail Loans) | 70.5 | 51.7 | 60.2 | | Others | 79.1 | 26.4 | 73.9 | | Total Advances | 79.5 | 61.7 | 72.0 | Note: As on March 31, 2023; Number in parenthesis indicates number of banks covered in the analysis.
Source: Individual bank submissions. |
| Table 1.10: Housing Loans – Floating Rate | | (per cent) | | | PSBs (8) | PVBs (6) | All SCBs (14) | | Housing Loan | 92.9 | 98.0 | 94.8 | Note: As on March 31, 2023; Number in parenthesis indicates number of banks covered in the analysis.
Source: Individual Bank Submissions. |
| Table 1.11: SMA Share of Retail Advances | | | SMA-0 | SMA-1 | SMA-2 | Total | | PSBs (11) | Unsecured Retail Advances | 6.8 | 2.4 | 0.7 | 9.8 | | Secured Retail Advances | 5.4 | 2.8 | 1.0 | 9.2 | | Retail Advances | 5.7 | 2.7 | 0.9 | 9.4 | | PVBs (20) | Unsecured Retail Advances | 2.9 | 0.8 | 0.3 | 4.0 | | Secured Retail Advances | 3.9 | 1.1 | 0.4 | 5.4 | | Retail Advances | 3.6 | 1.0 | 0.4 | 5.0 | | FBs (8) | Unsecured Retail Advances | 1.9 | 1.5 | 0.6 | 4.0 | | Secured Retail Advances | 1.0 | 0.5 | 0.1 | 1.5 | | Retail Advances | 1.4 | 0.9 | 0.3 | 2.6 | | All SCBs (39) | Unsecured Retail Advances | 4.6 | 1.7 | 0.6 | 6.9 | | Secured Retail Advances | 4.7 | 2.0 | 0.7 | 7.4 | | Retail Advances | 4.7 | 1.9 | 0.7 | 7.3 | Note: As on March 31, 2023; Numbers in parenthesis indicate number of banks considered for calculation; PSBs – Public Sector Banks; PVBs – Private Sector Banks; FBs – Foreign Banks; SCBs – Scheduled Commercial Banks.
Source: RBI Supervisory Returns. | 1.99 Recent bank failures in some AEs has brought to focus the role of interest rate risk in banks’ balance sheets, especially, valuation losses in HTM portfolios, which are not marked to market. In the Indian context, the share of the HTM portfolio in the investment book has increased from 55.7 per cent in June 2020 to 64.1 per cent in March 202339 (Chart 1.65). 1.100 An assessment of unrealised losses on securities held in the HTM portfolio shows that for the majority of banks40, the losses are manageable and the impact on their common equity tier 1 (CET1) capital ratio is limited. Moreover, the shift in India’s sovereign yield curve – downward shift in 2020 and upward shift in 2022 – has been relatively less than in major AEs (Chart 1.66 a and b), containing the impact of changes in interest rates on banks’ balance sheets. In particular, the average increase in policy rates in AEs41 (excluding Japan, which continues to maintain an easy monetary policy), was 397 basis points compared to 250 basis points in India.
1.101 The median impact of unrealised losses on the CET1 ratio of select banks is 65.4 basis points (bps) with 5 per cent of the banks having a sizeable impact of 178.6 bps or more (Chart 1.67). 1.102 Furthermore, in a stressed scenario involving a 100 bps shock to the available for sale (AFS) and held for trading (HFT) portfolios – coupled with unrealised losses in HTM securities – there is a modest impact on banks’ CET1 ratios and it is assessed that all banks would meet their CET1 ratio requirement, including the capital conservation buffer (Chart 1.68). 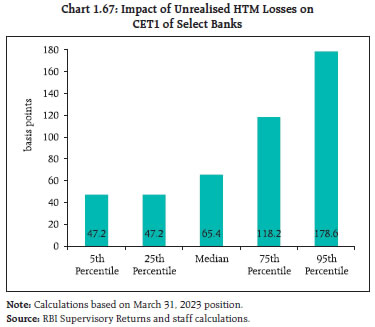

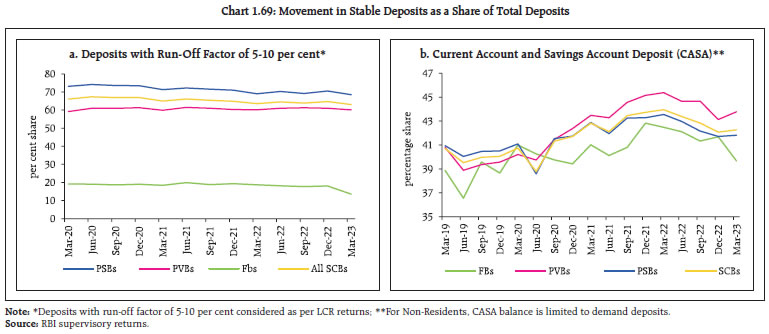 1.103 Another distinguishing feature of the recent global bank turmoil was the large share of uninsured deposits in the failed banks, which, in combination with losses on investments, triggered bank runs when deposits haemorrhaged. In the Indian context, deposits with run-off factors of 5-10 per cent form around 63.1 per cent of total deposits and current and savings accounts (CASA) constitute 42.3 per cent (Chart 1.69 a and b). Moreover, banks that have a higher share of uninsured deposits have lower HTM unrealised losses impacting their capital levels (Chart 1.70). Alongside stronger balance sheets and better corporate governance by banks, strengthening of banking regulation and supervision has contributed to better internal controls and risk management. A key plank of recent supervisory initiatives is to identify business model risks and ensure that banks do not grow at an unsustainable pace or undertake risk that is not commensurate with their risk-taking capacity. 1.104 On the back of improved profitability, banks’ capital grew faster than risk-weighted assets. SCBs’ CRAR reached a new high of 17.1 per cent in March 2023 with the median CRAR even higher at 17.9 per cent. The CET1 ratio also reached a high of 13.9 per cent with the median at 15.8 per cent (Chart 1.71 a, b and c).
1.105 Despite improvement in all major indicators such as profitability, asset quality, liquidity and solvency, Indian banks are still performing below their counterparts in other jurisdictions – they remain below first quartile for RoA and CRAR (Chart 1.72). 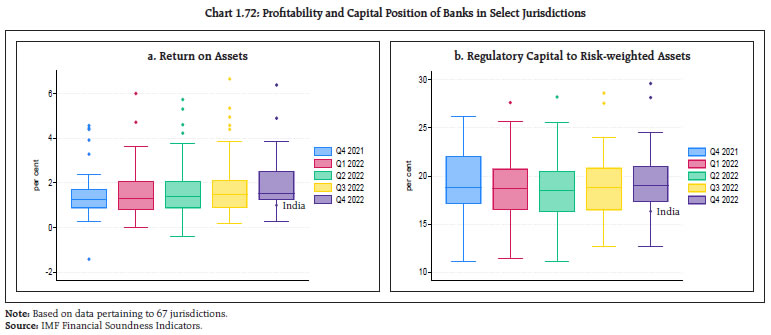
| Table 1.12: Asset Quality across NBFC Categories | | | | GNPA | SMA-0 | SMA-1 | SMA-2 | | | GNPA43 | SMA-0 | SMA-1 | SMA-2 | | NBFC-Micro Finance Institution (3.3 per cent) | Mar-21 | 5.4 | 2.3 | 2.2 | 1.0 | NBFC-Infrastructure Finance Company (40.6 per cent) | Mar-21 | 3.9 | 5.2 | 1.9 | 2.4 | | Jun-21 | 6.1 | 8.9 | 4.7 | 2.5 | Jun-21 | 3.8 | 3.0 | 0.1 | 6.9 | | Sep-21 | 5.8 | 4.4 | 4.0 | 1.5 | Sep-21 | 3.8 | 1.9 | 0.0 | 10.9 | | Dec-21 | 5.5 | 3.5 | 2.5 | 2.0 | Dec-21 | 4.0 | 0.2 | 0.0 | 3.3 | | Mar-22 | 5.5 | 1.5 | 1.2 | 1.1 | Mar-22 | 3.4 | 2.5 | 2.2 | 2.1 | | Jun-22 | 4.7 | 1.5 | 1.3 | 1.3 | Jun-22 | 3.4 | 6.9 | 1.1 | 5.4 | | Sep-22 | 4.6 | 1.1 | 1.4 | 1.1 | Sep-22 | 3.1 | 2.8 | 0.1 | 8.4 | | Dec-22 | 3.8 | 0.8 | 0.8 | 0.8 | Dec-22 | 2.8 | 1.7 | 0.0 | 7.4 | | Mar-23 | 2.5 | 0.4 | 0.4 | 8.2 | Mar-23 | 2.5 | 1.4 | 0.1 | 1.2 | | NBFC-Factor (0.1 per cent) | Mar-21 | 25.0 | 13.7 | 1.7 | 1.7 | NBFC-Infrastructure Debt Fund (1.1 per cent) | Mar-21 | 0.4 | 0.0 | 0.1 | 1.7 | | Jun-21 | 29.2 | 14.2 | 2.2 | 2.7 | Jun-21 | 0.4 | 0.0 | 0.0 | 0.6 | | Sep-21 | 26.0 | 13.8 | 1.5 | 1.1 | Sep-21 | 0.4 | 0.0 | 0.0 | 0.6 | | Dec-21 | 27.1 | 13.6 | 2.3 | 0.0 | Dec-21 | 0.8 | 0.6 | 0.1 | 0.0 | | Mar-22 | 22.0 | 11.7 | 1.3 | 0.0 | Mar-22 | 0.3 | 0.0 | 0.1 | 0.4 | | Jun-22 | 24.4 | 10.7 | 2.9 | 0.4 | Jun-22 | 0.4 | 0.0 | 0.0 | 0.1 | | Sep-22 | 20.9 | 9.1 | 1.7 | 0.8 | Sep-22 | 0.4 | 0.0 | 0.1 | 0.0 | | Dec-22 | 20.4 | 11.0 | 1.8 | 1.4 | Dec-22 | 0.7 | 0.0 | 0.0 | 0.0 | | Mar-23 | 19.7 | 9.6 | 4.0 | 0.2 | Mar-23 | 0.5 | 0.0 | 0.0 | 0.0 | | NBFC- Investment and Credit Company (54.9 per cent) | Mar-21 | 8.0 | 7.5 | 3.2 | 3.1 | Total | Mar-21 | 6.1 | 6.3 | 2.6 | 2.7 | | Jun-21 | 9.6 | 8.2 | 4.5 | 3.9 | Jun-21 | 6.9 | 5.8 | 2.5 | 5.1 | | Sep-21 | 9.0 | 7.2 | 3.9 | 3.3 | Sep-21 | 6.5 | 4.7 | 2.1 | 6.5 | | Dec-21 | 9.0 | 6.5 | 3.5 | 2.9 | Dec-21 | 6.6 | 3.6 | 1.9 | 3.0 | | Mar-22 | 7.7 | 5.7 | 3.3 | 2.2 | Mar-22 | 5.8 | 4.1 | 2.7 | 2.1 | | Jun-22 | 7.6 | 6.3 | 2.9 | 2.2 | Jun-22 | 5.6 | 6.4 | 2.1 | 3.5 | | Sep-22 | 7.2 | 5.5 | 2.8 | 2.1 | Sep-22 | 5.4 | 4.3 | 1.6 | 4.6 | | Dec-22 | 6.9 | 4.8 | 2.2 | 1.7 | Dec-22 | 5.1 | 3.4 | 1.3 | 3.9 | | Mar-23 | 4.9 | 4.8 | 2.1 | 1.1 | Mar-23 | 3.8 | 3.2 | 1.2 | 1.4 | Note: 1. Number in parenthesis indicates percentage share of each category of NBFC to total advances of NBFCs as on March 31, 2023.
2. Based on data for NBFC-D, NBFC-ND-SI and NBFC-ND (excluding Core Investment Companies) as of June 15, 2023 which are provisional.
Source: RBI Supervisory Returns. | I.2.10 Non-Banking Financial Companies (NBFCs) 1.106 Since the last issue of the FSR, the NBFC sector has witnessed a marked improvement across major soundness parameters, viz., asset quality, capital levels and liquidity. Capital levels rose, with the CRAR increasing from 26.0 per cent to 27.5 per cent between September 2022 and March 2023. The GNPA ratio (excluding core investment companies44) fell sharply from 5.4 per cent in September 2022 to 3.8 per cent in March 2023. SMAs, which are more vulnerable to slippage, have also contracted from 10.5 per cent of total advances in September 2022 to 5.8 per cent in March 2023 (Table 1.12). Restructuring of lending to large borrowers, however, saw a spike between September 2022 and March 2023 (Table 1.13). | Table 1.13: Asset Quality of Large Borrowers | | (per cent) | | | SMA-0 | SMA-1 | SMA-2 | Restructured Assets (including NPAs restructured) | | Jun-22 | 9.0 | 1.7 | 5.9 | 0.3 | | Sep-22 | 3.9 | 0.8 | 8.2 | 2.1 | | Dec-22 | 5.0 | 0.6 | 5.1 | 4.7 | | Mar-23 | 3.4 | 0.6 | 1.4 | 3.9 | | Source: RBI Supervisory Returns. |
| Table 1.14: Sources of Borrowing | | (in per cent) | | | Mar-20 | Sep-20 | Mar-21 | Sep-21 | Mar-22 | Sep-22 | Dec-22 | Mar-23 | | Debentures | 23.0 | 22.6 | 22.9 | 23.3 | 22.0 | 21.7 | 21.3 | 20.2 | | Commercial Papers | 3.0 | 3.0 | 3.0 | 3.1 | 2.7 | 2.8 | 2.8 | 2.8 | | Unsecured Debentures | 17.6 | 18.2 | 17.8 | 17.7 | 16.3 | 16.0 | 15.7 | 15.9 | | Market Borrowings | 43.5 | 43.7 | 43.8 | 44.1 | 41.0 | 40.5 | 39.8 | 38.8 | | Market Borrowings (excluding portion subscribed by banks | 39.0 | 38.2 | 38.3 | 38.7 | 35.7 | 34.5 | 34.4 | 33.7 | | Bank Borrowing as a share of total borrowings | 35.6 | 36.2 | 37.6 | 36.6 | 39.6 | 41.3 | 41.4 | 41.2 | | Source: RBI Supervisory Returns. | 1.107 Bank borrowings remained the principal source of funds and constituted 41.2 per cent of the total borrowings of NBFCs (excluding core investment companies) (Table 1.14 and Chart 1.73). 1.108 The residual maturity of nearly two-thirds of NBFCs’ borrowings has remained above one year (Chart 1.74). I.2.11 Micro, Small and Medium Enterprises (MSME)45 Sector 1.109 Credit to the micro, small and medium enterprises (MSME) sector continued to grow in the range of 13.8–18.9 per cent (y-o-y) during 2022-23 (Chart 1.75). Overall, credit to the MSME sector has been sustained by strong institutional support, which includes the Emergency Credit Line Guarantee Scheme (ECLGS) and regulatory modifications in the definition of MSMEs.
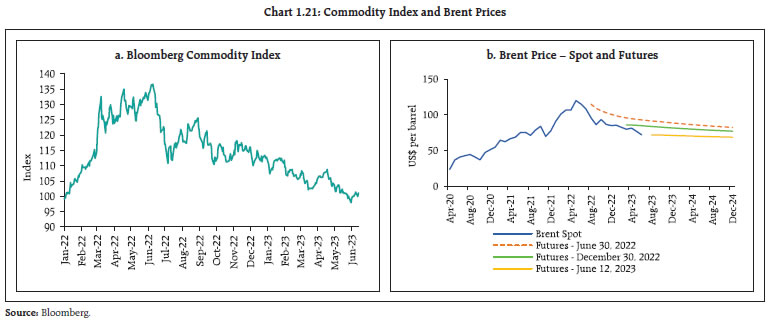
1.110 The asset quality of the MSME portfolio of SCBs improved significantly during 2022-23 with (a) the GNPA ratio declining from 9.3 per cent in March 2022 to 6.8 per cent in March 2023; (b) the GNPA ratio for advances below ₹25 crore, which are particularly vulnerable to slippage, also declining sequentially from 7.2 per cent to 6.7 per cent; and (c) SMA accounts going down from 11 per cent in March 2022 to 8.6 per cent in March 2023 (Table 1.15). Importantly, the improvement in asset quality has coincided with the expiry of regulatory forbearance and restructuring schemes introduced since 2018. 1.111 Under the ECLGS scheme, which expired on March 31, 2023, SCBs accounted for almost ninety per cent of total disbursals (₹2.91 lakh crore). Contact intensive services and traders were the major sectors availing ECLGS loans. 1.112 Disaggregated analysis of borrowers availing the ECLGS indicates that one-sixth of accounts and one-twentieth of the amount disbursed turned non-performing. Stress was predominant in the micro enterprises segment, with nearly one-fifth of borrowers and a tenth of the amount disbursed turning delinquent (Chart 1.76). 1.113 Sector-wise analysis of NPAs indicates that services and trade, which formed one third of the ECLGS disbursements, remain stressed and accounted for nearly half of the total delinquency under the ECLGS in these cohorts (Chart 1.77).
| Table 1.15: MSME Asset Quality Profile | | (per cent) | | | PSBs + PVBs | | 0 days past due | SMA 0 | SMA 1 | SMA 2 | GNPA | | Mar-22 | 79.7 | 6.4 | 3.5 | 1.1 | 9.3 | | Jun-22 | 79.6 | 6.4 | 3.5 | 2.2 | 9.8 | | Sep-22 | 81.6 | 6.7 | 1.9 | 2.1 | 7.7 | | Dec-22 | 82.2 | 6.3 | 2.0 | 2.0 | 7.4 | | Mar-23 | 84.6 | 5.1 | 2.6 | 0.9 | 6.8 | | Source: RBI Supervisory Returns and Staff Calculations. |
I.2.12 Microfinance 1.114 Credit to the microfinance sector has grown by 21.5 per cent (y-o-y) during 2022-23, with all non-SCB lenders recording double digit portfolio growth. SCBs’ microfinance portfolio, which had declined sequentially during the first three quarters of the year, picked up momentum in the fourth quarter of the year. After the regulatory review of the definition for assets qualifying as microfinance asset, NBFCs have seen strong growth. NBFC-MFIs and SCBs accounted for nearly three-fourth of lending to the microfinance sector (Chart 1.78). 1.115 Overall delinquency in the microfinance segment, measured in terms of 90+ days past due (dpd), declined across lender cohorts. Delinquency in SCBs’ microfinance portfolio is, however, still at elevated levels with a seventh of the portfolio under stress. Similarly, portfolio at risk of slippage, measured by 31-89 dpd, declined across lender categories (Chart 1.79 a and b).
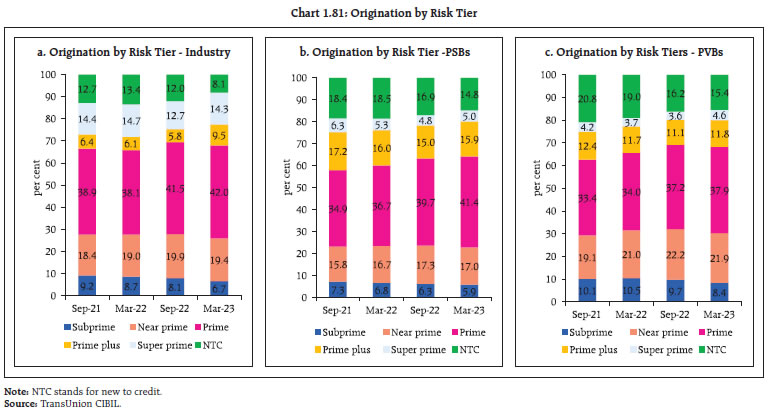
I.2.13 Consumer Credit 1.116 Consumer credit, which showed signs of moderation in Q3:2022-23, is gaining traction again with inquiry volumes across most segments growing in Q4:2022-23 (Chart 1.80). 1.117 The quality of incremental credit has improved, with the share of lower rated borrowers46 declining at the overall industry level as well as at bank group level (Chart 1.81 a, b and c). Although lower-rated borrowers formed 45.7 per cent of originations, they represented only 33.2 per cent of the amount originated at the industry level. 1.118 The distribution by risk tier47 shows improvement in the customer mix across all categories of lenders. On the other hand, the personal loan transition matrix showed moderation in risk tiering, with downgrades from super-prime and prime-plus category exceeding upgrades in sub-prime and near-prime customers (Table 1.16 and 1.17). 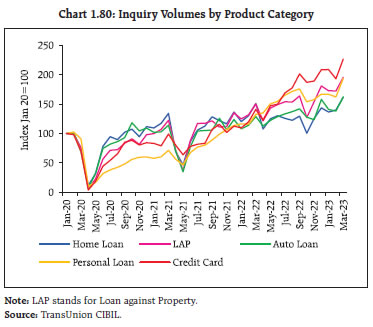
| Table 1.16: Consumer Distribution by Risk Tier and Lender Category | | (as a per cent of credit active consumers) | | | Select NBFCs (24) | All NBFCs | All PSBs | All PVT Banks | Industry | | Score Band | Mar-22 | Mar-23 | Mar-22 | Mar-23 | Mar-22 | Mar-23 | Mar-22 | Mar-23 | Mar-22 | Mar-23 | | Subprime | 25.9 | 22.3 | 31.6 | 27.2 | 33.0 | 28.4 | 16.5 | 15.3 | 27.4 | 24.2 | | Near prime | 23.3 | 25.4 | 23.3 | 24.9 | 26.3 | 26.6 | 15.5 | 16.2 | 22.4 | 22.8 | | Prime | 35.4 | 37.2 | 32.8 | 35.6 | 26.4 | 27.7 | 34.2 | 35.7 | 30.4 | 32.5 | | Prime plus | 14.0 | 13.3 | 11.3 | 11.0 | 10.9 | 12.0 | 21.9 | 22.6 | 14.3 | 14.7 | | Super prime | 1.5 | 1.8 | 1.0 | 1.3 | 3.5 | 5.2 | 11.9 | 10.2 | 5.6 | 5.8 | | Total | 100 | 100 | 100 | 100 | 100 | 100 | 100 | 100 | 100 | 100 | | Below Prime | 49.1 | 47.8 | 54.9 | 52.1 | 59.2 | 55.0 | 32.1 | 31.4 | 49.8 | 46.9 | | Source: TransUnion CIBIL. |
| Table 1.17: Transition Matrix - Personal Loans (Unsecured) | | (per cent) | | | | Risk Tier as of March 2023 | Score Tier Downgrade | Score Tier Upgrade | | Subprime | Near prime | Prime | Prime Plus | Super Prime | | Risk Tier as of March 2022 | Subprime | 71.0 | 18.3 | 8.4 | 2.0 | 0.2 | 0.0 | 29.0 | | Near prime | 21.6 | 32.1 | 35.4 | 10.2 | 0.7 | 21.6 | 46.3 | | Prime | 8.8 | 16.8 | 47.7 | 24.9 | 1.8 | 25.6 | 26.7 | | Prime plus | 4.0 | 9.5 | 28.9 | 52.1 | 5.4 | 42.5 | 5.4 | | Super prime | 2.3 | 7.9 | 22.8 | 27.6 | 39.4 | 60.6 | 0.0 | | Source: TransUnion CIBIL. | 1.119 The proportion of portfolios at 90 dpd or beyond, which serves as a measure of impairment in consumer credit, has improved during 2022-23 across all bank cohorts (Table 1.18). I.2.14 Housing Market 1.120 The all-India house price index (HPI)48 recorded its highest increase over the last seventeen quarters (4.6 per cent, y-o-y) in Q4:2022-23. On a sequential (q-o-q) basis, HPI has been rising over the last one year and inched up further by 0.6 per cent during Q4. 1.121 With strong demand for houses in the post-pandemic period, the house price gap (actual less trend) is closing after a period of around three years. A positive house price gap is an early warning indicator of concentration of credit and vulnerability in the housing market (Chart 1.82). | Table 1.18: Delinquency Levels in Aggregate Consumer Credit across all Product Categories | | (per cent) | | | PSB | PVB | NBFC / HFC | FinTech | | Mar-22 | 3.4 | 1.8 | 2.4 | 2.1 | | Apr-22 | 3.5 | 1.7 | 2.7 | 2.2 | | May-22 | 3.5 | 1.7 | 2.6 | 2.2 | | Jun-22 | 3.4 | 1.8 | 2.4 | 2.2 | | Jul-22 | 3.3 | 2.0 | 2.1 | 2.1 | | Aug-22 | 3.2 | 1.8 | 2.2 | 2.0 | | Sep-22 | 3.3 | 1.7 | 2.0 | 2.2 | | Oct-22 | 3.3 | 1.7 | 2.0 | 2.4 | | Nov-22 | 3.2 | 1.6 | 2.0 | 2.6 | | Dec-22 | 3.4 | 1.6 | 1.8 | 2.8 | | Jan-23 | 3.4 | 1.6 | 1.7 | 2.5 | | Feb-23 | 3.3 | 1.5 | 1.7 | 2.2 | | Mar-23 | 3.1 | 1.4 | 1.4 | 2.0 | Note: Based on 90 days past due balances; Methodology for computing delinquency has been modified and accordingly previous data has been revised.
Source: TransUnion CIBIL. | 1.122 During Q4:2022-23, house sales grew by 21.6 per cent and new launches also maintained healthy growth, reflecting strength in demand by end-users as well as investors. The rise in unsold inventory resulted in an uptick in the inventory overhang in Q4:2022-23 (Chart 1.83 a and b). 1.123 The share of residential housing loans in total loans has increased over the last eleven years to 14.2 per cent in March 2023 from 8.6 per cent in March 2012. During this period, the share of commercial real estate (CRE) in total loans has hovered between 2.0-2.9 per cent. Total exposure of the banking system to real estate stood at 16.5 per cent of total loans in March 2023. Given the secured nature of these loans and loan to value (LTV) ratio regulations, loan defaults remain less than 2 per cent (Chart 1.84 a and b).
I.2.15 Financial System Stress Indicator49 1.124 In the last issue of the FSR, the financial system stress indicator (FSSI) was presented as a monitoring tool for aggregate stress levels in the Indian financial system. The FSSI shows that the overall stress in the domestic financial system eased in Q4:2022-23 relative to Q3:2022-23, driven by general improvement in stress factors across banking and non-banking sectors. Financial market stress indicators were mixed, with equity markets witnessing stress following the banking turmoil in some of the AEs and money market risk indicators rose due to increase in spreads of commercial paper (CP) and certificates of deposit (CDs) over treasury bills and higher volatility in CP market. On the other hand, forex market indicators remained stable and bond market indicators improved as spreads and volatility reduced. Real sector indicators improved while mutual fund risk indicators rose marginally due to redemption pressures (Chart 1.85 and 1.86).
I.2.16 Systemic Risk Survey 1.125 As per the systemic risk survey conducted in May 2023, risk perception across all major categories of systemic risk except institutional risk has receded. Global spillovers remained in the ‘high’ risk category. Financial market risk declined to the ‘medium’ risk category from ‘high’ risk. Macroeconomic risk remained in the ‘medium’ risk category and was perceived to have moderated. 1.126 Major drivers of global risks such as risks to global growth, commodity price risk and risk emanating from monetary tightening in AEs were perceived to have moderated. All the drivers of financial market risk were gauged to have decelerated to ‘medium’ risk category from the ‘high’ risk category in the previous survey. 54 per cent of the respondents reported that their confidence in the stability of the global financial system has declined over the last six months whereas 94 per cent of the respondents’ confidence in the Indian financial system over this period either increased or remained unchanged. Following the recent banking sector turmoil in AEs, 82 per cent of the respondents strongly/moderately agreed that it has aggravated risks of global recession. 1.127 As per the survey response, global growth slowdown has emerged as the foremost financial stability risk, followed by tight global financial conditions, volatility in capital flows and rise in commodity prices (Chart 1.87). 1.128 Underscoring the resilience of the Indian banking sector, more than half of the respondents assessed that the prospects of the banking sector have improved. 77 per cent of the respondents expected either improvement in banking sector asset quality or expected it to remain unchanged over the next six months, attributable to factors such as improved corporate earnings in major sectors, improvement in credit profiles of corporates, sustained economic recovery, and improved monitoring and risk assessment by banks. Around half of the respondents expected marginal to considerable improvement in credit demand over the next six months owing to factors such as public investment in the infrastructure sector, improvement in corporate lending, increase in working capital demand by corporates, increase in consumption and investment demand, pick up in domestic economy particularly manufacturing sector, and decline in inflation. Summary and Outlook 1.129 The global economy is facing heightened uncertainty amidst moderating but still high inflation and persisting geopolitical tensions. The resilience of the global financial system is being tested by the recent banking turmoil and interaction between monetary tightening and financial sector stress. EMEs could face significant challenges if global growth decelerates faster than anticipated, financial strains re-emerge, and risk aversion increases. Policy trade-offs are becoming more challenging although recent forceful actions by central banks provide comfort that financial stability would be preserved without conceding the fight against inflation. 1.130 Despite a challenging global macroeconomic backdrop, the Indian economy and the domestic financial system remain resilient. The health of the banking system is a positive in this environment, with improving profitability and asset quality and sufficient levels of capital and liquidity buffers.
|