After years of lacklustre growth, the global economy seems poised for a turnaround. Amidst uncertainties surrounding the contours of fiscal reforms in the United States (US) and persistent populist urges across the global political economy, the underlying expectations of a smooth transition from accommodative monetary policy regimes to a normal rate cycle is evident in the behaviour of equity and fixed income markets. Domestically, government’s commitment to fiscal consolidation and political stability are providing comfort to investors about the continuation of reforms. However, revival of investment demand is important so as to make higher growth rates sustainable. The impact of demonetisation on exchange rates and portfolio flows was fleeting, while the liquidity condition eased significantly. Against asset quality concerns, credit intermediation by public sector banks (PSBs) has retrenched and that by Non-banking Financial Companies (NBFCs) and mutual funds has increased significantly. Going forward, growth is expected to pick up further. While inflation has fallen, focus remains on keeping the inflation close to 4 per cent on a durable basis. At the same time, there is a need to guard against complacency over the prevailing benign conditions in the global financial and commodity markets. Global backdrop 1.1 After years of lacklustre growth, the global economy seems headed for a turnaround as can be seen in the improvements in industrial production and the purchasing managers’ index (PMI), and financial conditions of advanced economies (AE) approaching a neutral condition (Charts 1.1 and 1.2). Notwithstanding concerns over rising protectionism, populism and emerging geopolitical conflicts, the world economic outlook for 2017 looks brighter as compared to 20161. Several factors seem to be contributing to this positive outlook –– the end of a big decline in resource sector investment spending, moderation of fiscal austerity in Europe with the Eurozone achieving faster growth than the US in 2016 and inflation just under the European Central Bank (ECB)’s target of 2 per cent, stimulus in China, moderating US dollar strength, prospects of an inflation uptick in Japan, partial reversal of commodity prices and market expectations of a somewhat moderated monetary accommodation withdrawal path in the US. 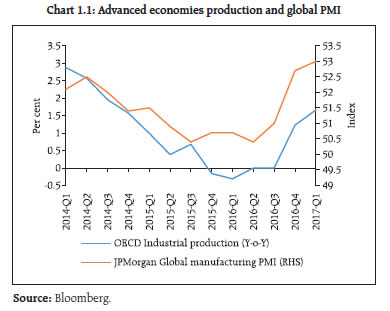 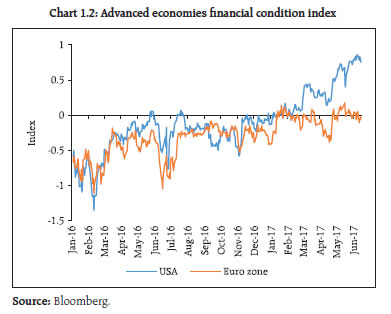 1.2 However, concerns remain amidst these positive sentiments. For instance, weaknesses in US output in Q1 2017, Chinese trade data for April pointing to moderating demand for imports and uncertainty about the US administration’s tax and fiscal policy. Geopolitical risks are elevated though the real concern is the perceived weakening of international institutional mechanisms to deal with them. At the same time, one has to await the on-going churning in political processes across the world to assess how much of the rhetoric on protectionism and populism will ultimately materialise. 1.3 In the meanwhile, notwithstanding the US decision to pull out of the Trans Pacific Partnership (TPP), there has been a steady increase in global trade (Chart 1.3) and there is a belief that rather than overhauling the existing trade agreements, the current US administration will only tweak them in an effort to address domestic political economy concerns. Furthermore, the US dollar in trade weighted terms has stopped rising, adding sheen to anything reported in dollar terms, such as trade (Chart 1.4). 1.4 A stronger growth outlook, resurgence in trade and the end of the dollar’s strength (Chart 1.4) have also reversed the commodity-driven emerging market-centred deflation that started in 2014, though recent Chinese efforts to restrict credit and curb leverage have started impacting the commodity space (Chart 1.5). 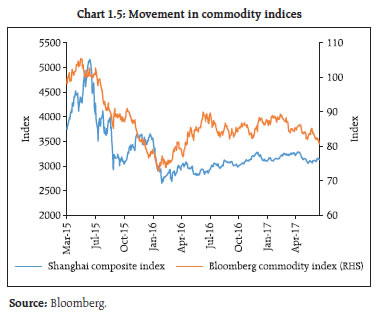 1.5 The global interest rate cycle, however, is yet to synchronise. Among the G-3 central banks, there appears to be a sequence towards withdrawal of monetary accommodation, with the FED ahead of the ECB and the ECB ahead of the Bank of Japan (BoJ). More importantly, from a financial market perspective, the FED appears to be moving cautiously towards paring back its balance sheet size, though the Triffin dilemma4 continues. Interestingly there is an alternative view that the FED’s release of collateral may be expansionary – rather than contractionary – enabling market participants to access secured funding markets. Such expansionary dimension of FED balance sheet size change is independent of the manner in which such changes happen. Illustratively, any non-investment of maturity proceeds by FED can be seen as initial investment and subsequent sale (release) of treasury (collateral). 1.6 One of the most significant changes in the world economy in the past couple of decades has been a decline in real interest rates and a commensurate increase in indebtedness. There is a view that the increase in indebtedness is partially attributable to central banks ‘obsession with near term price stability’ which means that so long as the increase in near term inflation is limited (partly held back by both the tailwinds of globalisation and credibility of central banks), they have little incentive to restrain the build-up of financial imbalances. Hence, there is a need for a more useful definition of a natural interest rate, which also ensures that ‘…the financial side of the economy to be on an even keel –– so that financial imbalances do not build up…’ (Borio, 2017)5. On the other hand, according to an OECD publication6, by extending the debt maturity profile, OECD sovereigns have bought some insurance against refinancing risks at the cost of some duration risks. Significantly, one of the negative fallouts of the more immediate ultra-low rates in the AEs has been a significant deficit in both public and private pension schemes. IMF’s Global Financial Stability Report (GFSR – October, 2016) attributes the shortfall in defined benefit schemes to falling interest rates, which increases the present value of future obligations and low asset returns (especially, on safe assets such as sovereign bonds). 1.7 In a major departure from past business cycles wherein credit growth acceleration preceded an uptick in gross domestic product (GDP) growth, growth in private credit to non-financial corporations is slowing. In developed markets, credit gains have been modest while the private sector in emerging market economies (EMEs) (ex-China) has been deleveraging since mid-2015. The consequences of deleveraging in the context of normalisation of developed market interest rates will continue to be a challenge. In the meanwhile, corporate earnings in developed markets reflect the general upbeat economic outlook. Analysts estimate that the Q1 top line growth in key developed markets of the US, Eurozone and Japan will be the strongest in 6-7 years. In terms of a sectoral analysis, good earnings’ performance of cyclicals, financials and commodities also point to resilient global activity. At the same time, markets outside the US look better placed to benefit from stronger global growth. US profit margins are forecast to increase only modestly from an already elevated level, while margins outside the US are likely to have more scope of increase from current levels (Chart 1.6). 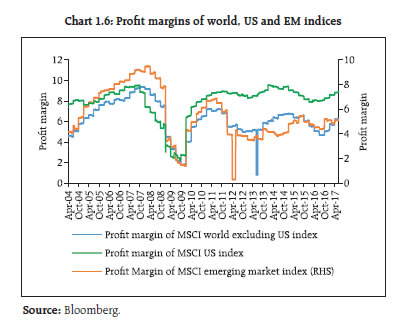 1.8 In the meanwhile, portfolio flows to emerging markets in 2017 show a tilt towards the debt component which is a little puzzling in the context of the US interest rate cycle (Chart 1.7). 1.9 US capital markets have sharply outperformed since November 2016. The continued outperformance of US equity is far from certain, specifically in the context of the FED’s tightening. Moreover, in terms of both the cyclically adjusted price-to-earnings ratio (CAPE7) and the nominal price-to-earnings (PE) metric, US markets appear to be relatively expensive. With continental European growth rebounding and strong first quarter earnings in developed markets, more broad based gains in equity markets across advanced economies (AEs) appear to be taking shape, although significant volatility, induced by Chinese deleveraging in the short run cannot be ruled out. Emerging markets may appear to be relatively attractively valued vis-à-vis the AEs (Chart 1.8) and are likely to attract investment flows. 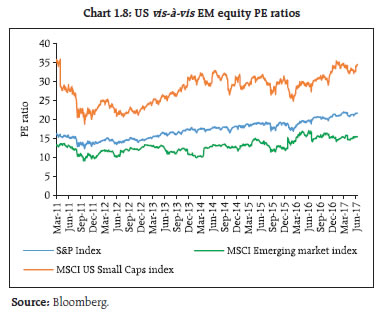 1.10 With regard to the risks to global macro-financial stability, all equity market based volatility indicators are at or near their post-crisis lows. The underlying feeling of a smooth transition from a global accommodative monetary policy regime to the usual rate cycle is evident. The faith that such a transition is likely to be gradual implies that even the long term treasury bond yields are off their Q1 2017 peak. As for the outlook on commodity prices, hopes of reflation trade led commodity indices to a moderately strong finish last year. However, a decline of 2.5 per cent in the Bloomberg Commodity Index during Q1 2017, largely driven by energy prices, points to the risks to the underlying reflation trade consensus. 1.11 Coming to the banking sector, according to a study by the European Banking Authority (EBA) the adoption of International Financial Reporting Standards 9 (IFRS 9), which take effect globally from January 1, 2018, is expected to increase provisions by almost 30 per cent as compared to current standards and reduce Common Equity Tier 1 (CET1) ratios by up to 75 bps. While the Basel Committee on Banking Supervision (BCBS) has given discretion to national authorities to apply transitional measures to ease the impact on capital, banks are already taking steps to protect their regulatory ratios, although it is unclear as to whether add-ons on account of IFRS 9 will be a part of Supervisory Review and Evaluation Process (SREP) in the current assessment cycle globally (the impact of the introduction of Ind AS on Indian banks is given in Chapter III, Box 3.1). 1.12 Earlier issues of Financial Stability Report (FSR) highlighted the natural inclination of financial risk migrating to sectors with less regulatory oversight. A recent Financial Stability Board (FSB) report8, covering data up to end-2015 from 28 jurisdictions and representing over 80 per cent of global GDP, throws up interesting trends. While banks continued to grow in 2015, their share in financial systems declined for the fourth consecutive year, particularly in the Euro area. The assets of other financial intermediaries (OFIs)9 were equal to 150 per cent of total GDP at end-2015, surpassing the previous high-point of 139 per cent prior to the financial crisis. The narrow measure of shadow banking10 that may lead to financial stability risks grew 3.2 per cent to $34 trillion in 2015 for these jurisdictions, excluding China. This is equal to 69 per cent of aggregate GDP of the 27 jurisdictions and 13 per cent of their financial system assets. The unimpaired growth in shadow banking has implications for bank led macro-prudential norms. Domestic economy 1.13 The latest Union Budget announcements and the expectations of accelerated reforms and political stability further reinforced the overall positive business sentiment. The Budget reduced fiscal deficit from 3.9 per cent of GDP in 2015-16 to 3.5 per cent in 2016-17. Considering various aspects of Fiscal Responsibility and Budget Management (FRBM) Committee recommendations11 as also increasing capital expenditure and support to poorer households, small businesses and the rural sector, the fiscal deficit for 2017-18 has been pegged at 3.2 per cent of GDP with a commitment to achieving a fiscal deficit target of 3 per cent in the following year. Markets reckon that gradual fiscal consolidation, significant disinflation and exchange rate stability provide the congenial environment for shifting the balance of policy focus to structural reforms. Continuing slowdown in investment growth 1.14 Real gross value added (GVA) growth decelerated to 6.6 per cent in 2016-17 as compared with 7.9 per cent in 2015-16, largely reflecting slowdown in services, in particular construction and financial, real estate and personal services. Moreover, fixed investment growth also decelerated in 2016-17 on account of over-indebtedness and excess capacity in certain sectors besides the sluggish global growth in the past. However, for sustainability of higher growth rates, revival in investment demand is essential. Going forward, reforms in foreign direct investment and real estate sector, implementation of goods and services tax (GST), and revival in external demand are likely to contribute to a better growth outlook. GVA growth is expected to be higher at 7.3 per cent in 2017-1812. Inflation 1.15 Retail inflation measured by year-on-year variation in consumer price index (CPI) declined to a historic low of 2.18 per cent in May 2017. There has been a sharp fall in food inflation from 6.3 per cent in April 2016 to (-)0.2 per cent in May 2017. CPI inflation excluding food and fuel that remained sticky during H2:2016-17 at around 4.9 per cent, dipped to 4.3 per cent in April and 4.2 per cent in May 2017, largely reflecting the impact of decline in global crude oil prices on transport and communication and moderate price pressures in services (Chart 1.9). CPI inflation is expected to be in the range of 2.0 – 3.5 per cent in the first half of the year and 3.5 – 4.5 per cent in the second half13. Fiscal conditions 1.16 A committee that recently reviewed the earlier arrangements for FRBM Act recommended14 enacting a new Debt and Fiscal Responsibility Act after repealing the earlier Act and creating a fiscal council to bring fiscal discipline both at the Centre and in the States and the strengthening of the national balance sheet. The committee suggested achieving a national debt ceiling of 60 per cent of GDP (40 per cent for the Centre and 20 per cent for the States) by 2023. It also recommended a gradual reduction in the Centre’s fiscal deficit target to 2.5 per cent by 2023. 1.17 While the government’s commitment to returning to rule based fiscal discipline is commendable, there are a few issues that need attention. One is the deterioration in the States’ fiscal conditions and the other is increased leverage of public sector undertakings (PSUs) (Chart 1.10). In the case of States, there is an increasing tendency to borrow outside the budget through parastatals as these are non-transparent in the sense that they do not add to outstanding debt even though their servicing burden falls on the budget. In the meantime, the absolute and relative (to the Centre) size of net market borrowings of State governments has been rising sharply (Chart 1.11), though their market liquidity has not improved commensurately. This has implications for the further development of secondary market in government bonds, besides periodic redemption pressures. Developments in financial markets 1.18 Demonetisation, as such, did not affect the day-to-day functioning of the securities market given that transactions in securities market are done through banking channels. With robust mechanisms and processes in place, the securities markets continued to function normally, despite a temporary blip. In fact the markets recovered faster than expected (Chart 1.12) and moved to a higher territory reflecting positive sentiments. Increased investments in the securities market was also reflected in the upward trend in mutual fund investments wherein the gross mobilisation increased from ₹13.99 trillion in November to ₹14.14 trillion and further to ₹16.16 trillion in December 2016 and January 2017 respectively. The capital markets (Chart 1.12), moved to a higher territory reflecting these positive sentiments, touching their life time highs on June 5, 2017. Higher domestic yields and market expectations about a somewhat measured pace of US rate hikes have also contributed to the return of portfolio flows to the capital market. Further, a number of global reports and assessments16, over the last two years, have shown that India has considerably improved its policies, practices and economic profile. Further, India has become the sixth largest manufacturing country in the world, up from ninth previously. Overall equity markets registered a smart growth.   1.19 Turnover in equity markets, both in cash and derivatives segments, showed significant increase and is becoming more broad-based particularly through investments in mutual funds. Such diversification of the investor base augurs well for the resilience of Indian equity markets. 1.20 The sudden spurt in banking sector liquidity following demonetisation and its consequent impact on the government bond yield curve and money market rates had implications for the management of liquidity and expectations. A sharp downward adjustment in yields in November 2016, coinciding with the US presidential election outcome and hawkish FED language in December, led to profit booking (Chart 1.13) with attendant pressures on the exchange rate and a temporary reversal in equity flows as well.  1.21 As regards liquidity18 in government bonds, it generally remains higher during the lean seasons (January-March) vis-à-vis the busy seasons for government borrowings, irrespective of the interest rate cycle (Chart 1.14). This is understandable as fresh stocks of government securities issued through the primary auction take time to seep into the trading portfolio before a trading call on interest rates can be taken. However, trading seems to be inhibited by frequent bond auctions. Interestingly, the relationship between secondary market liquidity and G-Sec/OIS19 spread (5-year) shows no strong co-movement (Chart 1.15) implying that there are factors beyond liquidity that drive OIS-G-Sec spreads. Non-deliverable OIS (NDOIS) traded offshore can be a significant source of such a distortion since paying/ receiving OIS in offshore markets are driven by the interest rate view on India and not necessarily driven by the underlying lack of liquidity of government bond market.   Credit growth and the role of banks 1.22 The banks’ share in the flow of credit, (Chart 1.16) which was around 50 per cent in 2015-16 declined sharply to 38 per cent in 2016-17. However, the aggregate flow of resources to the commercial sector was not affected owing to a sharp increase in private placements of debt by non-financial entities and net issuance of commercial papers (CPs); the aggregate share of these two in total credit flow to commercial sector increased to 24.3 per cent in 2016- 17. Moreover, there is increasing intermediation of credit by mutual funds (analysed in Chapter III, paragraph 3.22). House prices 1.23 The annual increase in the all-India residential property price index (RPPI) was 8.3 per cent in Q3 2016-17, which was lower than the previous year (Chart 1.17). The gross non-performing advances (GNPA) ratio for housing finance assets20 at 1.2 per cent as in March 2017 was marginally lower than the 1.3 per cent in March 2016. The retail housing segment at this juncture does not seem to pose any significant systemic risks. Accordingly, the Reserve Bank recently reduced risk weights and standard asset provisioning for individual housing loans as a countercyclical measure (Chapter III, Table 3.1). Corporate sector21 Current trends 1.24 Performance of select non-government nonfinancial (NGNF) listed companies improved in the second-half of 2016-17 as compared to corresponding period of 2015-1622 (Table 1.1). | Table 1.1: Select financial ratios of performance of NGNF listed companies | | | First-half of 2015-16 | Second-half of 2015-16 | First-half of 2016-17 | Second-half of 2016-17 | | Sales growth (y-o-y) (per cent) | -3.9 | 2.2 | 1.9 | 5.4 | | Net profit to average* total asset (per cent) | 2.4 | 2.6 | 3.0 | 2.5 | | Solvency ratio & (per cent) | 21.3 | 19.0 | 27.4 | 20.6 | | Debt to equity ratio # | 0.38 | 0.39 | 0.33 | 0.32 | | Interest coverage ratio $ (number of times) | 4.5 | 4.2 | 6.0 | 4.4 | | Interest payment^ to average* borrowings (per cent) | 14.8 | 15.0 | 13.6 | 15.3 | Note: * Average is based on outstanding opening and closing positions for the half year.
& Solvency ratio is defined as sum of profit after tax (PAT) and depreciation to total debt.
# Debt is taken as long term borrowings and equity is the net worth.
$ ICR is defined as ratio of EBITDA to interest expense, where EBITDA is earnings before interest, taxes, depreciation and amortisation, which is derived as EBITDA = EBIT + depreciation and amortisation. EBIT is earnings before interest and taxes.
^ Annualised interest payment is used.
Source: RBI (Half-yearly statements of select NGNF listed companies). | Corporate leverage23 Trend 1.25 During the year ended March 2017, 40.2 per cent of NGNF listed companies in the select sample witnessed decline in total borrowings, while the total borrowings remained the same for around 20 per cent of the sample companies. Though the total borrowings increased for only about 40 per cent of the sample companies, this increase was much higher than the decline that other companies recorded, resulting in a net increase of about 4 per cent in the total borrowings for the entire sample during 2016-17 (Table 1.2). Table 1.2: NGNF listed companies: Change in corporate borrowings
(Comparison of total borrowings of individual companies in two periods) | | (per cent) | | Change in total borrowings of individual companies | Proportion of companies | Share of companies in total borrowings | Variation in total borrowings (y-o-y) | | Mar-16 | Mar-17 | | Companies with total borrowings decreased | 40.2 | 44.8 | 35.1 | -18.3 | | Companies with total borrowings increased | 39.9 | 55.1 | 64.7 | 22.4 | | Companies with total borrowings remained same | 19.9 | 0.1 | 0.1 | 0.0 | | Total | 100.0 | 100.0 | 100.0 | 4.1 | Note: For common companies in samples for the above periods.
Source: RBI (Half-yearly statements of select NGNF listed companies). |
| Table 1.3: NGNF listed companies: Tail risk in corporate leverage | | (per cent) | | Leverage | Number of companies
(as percentage of total companies) | Share of companies in total debt of the sample | | Sep'15 | Mar'16 | Sep'16 | Mar'17 | Sep'15 | Mar'16 | Sep'16 | Mar'17 | | Negative Net worth or DER >= 2 | 10.6 | 10.9 | 11.5 | 10.4 | 23.1 | 20.6 | 16.0 | 27.6 | | Negative Net worth or DER >= 3 | 9.2 | 9.9 | 10.5 | 9.5 | 20.6 | 19.0 | 14.5 | 19.5 | | Source: RBI (Half-yearly statements of select NGNF listed companies) | Tail risk 1.26 Share of debt of ‘leveraged24’ companies in the sample increased from 20.6 per cent to 27.6 per cent during the period 2016-17. However, the share of total debt of ‘highly leveraged25’ companies showed a smaller increase during the same period (Table 1.3). Debt servicing capacity 1.27 The debt servicing capacity and leverage of ‘weak26’ companies in the sample deteriorated considerably in 2016-17. Analysis shows that around 17 per cent of the sample companies were ‘weak’ as at end March 2017, compared to 16.4 per cent in March 2016. The share of these ‘weak’ companies in total debt of the sample increased to 30.2 per cent during the second half of 2016-17 from 28.7 per cent during the second half of 2015-16. However, the debt-equity ratio (DER) of these ‘weak’ companies declined to 1 from 1.8 during the same period. The proportion of ‘leveraged weak27’ companies in the sample declined to 5 per cent from 5.7 per cent during this period. The share of ‘leveraged weak’ companies in total debt of the sample also declined (Chart 1.18). Sectoral analysis 1.28 The total borrowings by companies in chemical, computer, electrical machinery, hotel, iron & steel, papers, pharmaceutical, real estate, rubber and transport industries decreased during 2016 -17. On the other hand, cement, construction, power, food products and textile industries showed some increase in borrowings. Automobile and telecommunication industries showed a substantial increase in borrowings (Chart 1.19). 1.29 A risk profile of select industries as at end March 2017 showed that the telecommunication industry had the largest debt with negative profitability. The industry also had relatively high leverage. The power, construction and iron & steel industries suffered from relatively high leverage and high interest burden (Chart 1.20). Corporate sector risks 1.30 The corporate sector stability indicator and map29 (Chart 1.21) show that the overall risks to the corporate sector have further moderated in 2016-17. However, the risks due to lower demand (as seen from turnover)30 continues to impact the profitability. Sensitivity tests: resilience 1.31 The resilience of the NGNF listed companies to potential shocks from domestic interest rates and operating profits were assessed using sensitivity tests. 1.32 Stress tests (Chart 1.22) on sample companies reveal that decline in operating profits by 25 per cent (scenario 1) will increase the ‘share of debt’ held by weak companies by 2 per cent in H2:2016-17, whereas that increase would have been 5.8 per cent in H1:2016-17 under similar scenario. The share of ‘debt at risk31’ will increase by 7.8 per cent if domestic interest rate increases by 250 basis points (scenario 2) in H2:2016-17. Under the combined effect of both the scenarios, there would be a significant increase in number of weak companies and share of ‘debt at risk’ by around 17 per cent and 12 per cent respectively in H2:2016-17 .  1.33 Tests of resilience of leveraged weak companies show that under scenario 1 shock, ‘debt at risk’ of these companies will increase by about 1 per cent in H2:2016-17, the lowest in preceding three half years. On the other hand, under scenario 2 shock, ‘debt at risk’ of such companies will increase by around 5 per cent in H2:2016-17, the highest in the preceding three half years (Chart 1.23).
|