Credit growth of scheduled commercial banks (SCBs) picked up, with public sector banks (PSBs) registering near double digit growth. Capital adequacy of the SCBs improved after the recapitalisation of PSBs. With the bulk of the legacy Non-Performing Assets (NPAs) already recognised in the banking books, the NPA cycle seems to have turned around. Provision coverage ratio (PCR) of all SCBs rose sharply to 60.6 per cent in March 2019 from 52.4 per cent in September 2018 and 48.3 per cent in March 2018, increasing the resilience of the banking sector. Macro-stress tests for credit risk indicate that under the baseline scenario, SCBs’ gross non-performing assets (GNPA) ratio may decline from 9.3 per cent in March 2019 to 9.0 per cent in March 2020. Recent developments in the Non-banking financial companies (NBFC) sector have brought the sector under greater market discipline as the better performing companies continued to raise funds while those with Asset-Liability Mismatch (ALM) issues and/or asset quality concerns were subjected to higher borrowing costs. Given these developments, a thematic study in this Report explores the various regulatory and supervisory issues to grapple with emerging complexities. It specifically points to a possible adverse selection bias in the asset choices of NBFCs / Housing finance companies (HFCs). Total bilateral exposures between entities in the financial system have reached ₹36.3 trillion as on end-March 2019. Mutual funds (AMC-MFs) have reduced their investment in Commercial Papers (CP) and debt of NBFCs and HFCs. Consequently, NBFCs and HFCs are relying more on long-term bank loans for their funding. Joint Solvency-Liquidity contagion losses to the banking system due to idiosyncratic failure of banks show that the losses as on March 2019 are significantly lower than in March 2018 (FSR June 2018) due to a better capitalised public sector banking system. Solvency contagion losses to the banking system due to idiosyncratic HFC/NBFC failure show that the failure of largest of these can cause losses comparable to those caused by the big banks, underscoring the need for greater surveillance over large HFCs/NBFCs. Section I Scheduled commercial banks1 2.1 This section discusses the soundness and resilience of scheduled commercial banks (SCBs) under two broad sub-heads: i) performance and ii) resilience using macro-stress tests through scenarios and single-factor sensitivity analyses.2 Performance 2.2 Aggregate credit growth based on domestic operations on a year-on-year (y-o-y) basis improved marginally to 13.2 per cent in March 2019 from 13.1 per cent in September 2018. SCBs’ deposit growth increased from 8.7 per cent in September 2018 to 9.9 per cent in March 2019 in their domestic operations (Chart 2.1 a). 2.3 Among bank groups, public sector banks (PSBs) registered a credit growth of 9.6 per cent in March 2019, while private sector banks’ (PVBs) credit growth remained strong at 21.0 per cent (Chart 2.1b). PSBs’ deposit growth remained sluggish at 6.5 per cent whereas that of private sector banks continued to be in double digits at 17.5 per cent. Foreign banks’ (FBs) credit and deposit growth also improved to 12.0 per cent and 17.6 per cent respectively in March 2019. 2.4 SCBs’ net interest income growth improved to 16.5 per cent in March 2019 as compared to 15.9 per cent in September 2018. Despite higher growth in operating expenditure in March 2019 as compared to September 2018, SCBs were able to maintain positive earnings before provisions and taxes (EBPT) growth. On a y-o-y basis, growth in total provisions5 of SCBs declined in March 2019 (Chart 2.1b). 2.5 The share of net interest income in total operating income declined in March 2019 as compared to September 2018 (Chart 2.1c). PVBs’ net interest margin (NIM) improved while that of PSBs and FBs declined marginally between September 2018 and March 2019. Bank-wise, the NIMs of 24 banks declined in March 2019 as compared to September 2018 (Chart 2.1e). 2.6 Aggregate provisions in 2018-19 were about 106 per cent of EBPT thus impacting profitability. PSBs continued to make losses and their profitability ratios remained weak, whereas that of PVBs and FBs improved (Chart 2.1f and 2.1g). Asset quality and capital adequacy 2.7 The increased pace at which NPAs were recognised led to the NPA cycle peaking in March 2018. With most of the NPAs already recognised, the NPA cycle turned around with GNPA ratio declining to 9.3 per cent in March 2019 (Chart 2.2a). There was convergence of stressed advances ratio with GNPA ratio across all bank groups (Chart 2.2c). The y-o-y growth in GNPAs also decelerated across all bank groups (Chart 2.2d). 2.8 The provision coverage ratio (PCR) of all SCBs increased sharply from 52.4 per cent in September 2018 to 60.6 per cent in March 2019 (Chart 2.2e). Y-o-Y growth in NPA provisions of SCBs was, however, lower in March 2019 at 14.7 per cent as compared to 40 per cent in September 2018 due to the base effect of March 2018 (Chart 2.2f). 2.9 SCBs’ capital to risk-weighted assets ratio (CRAR) improved from 13.7 per cent in September 2018 to 14.3 per cent in March 2019 after recapitalisation of PSBs. PSBs’ CRAR improved from 11.3 per cent to 12.2 per cent during the period. There was a marginal decline in CRAR of PVBs (Chart 2.2g). There was also a marginal decline in SCBs’ Tier I leverage ratio between September 2018 and March 2019 (Chart 2.2h). 2.10 Bank-wise distribution of asset quality shows that the number of banks having very high GNPA ratio (more than 20 per cent) came down in March 2019 as compared to September 2018. This implies a broader improvement in asset quality. Bank-wise distribution of capital adequacy indicates that there were more banks having their CRAR at more than 12 per cent in March 2019 as compared to September 2018 (Chart 2.2i and 2.2j). 2.11 There was a wide dispersion of capital ratios and the provision coverage ratios observed among SCBs. PSBs, in particular, showed a range of 42 per cent to 74 per cent in PCRs. To make the capital numbers comparable, the required amount of provisions is determined assuming a constant PCR of 70 per cent and suitable adjustments based on actual provisions maintained vis-à-vis calculated provisions were done in CET 1 capital to determine the provision adjusted CET 1 ratio. The results show that the provision adjusted CET 1 ratio for 14 PSBs was lower (with a maximum of about a 4-percentage point drop in the CET 1 ratio) as compared to their reported CET 1 as on end-March 2019 (Chart 2.2k). While an analysis of the provisions’ shortfall is susceptible to changes based on the assumed PCR level, the relative ordering of banks based on provision adjusted CET 1 will remain unaffected. Sectoral asset quality 2.12 The asset quality across broad sectors improved in March 2019 as compared to September 2018, except agriculture which showed a marginal increase in GNPA ratio (Chart 2.3a). Improvements in asset quality in the 'industry' sector were noticeable across all bank groups (Chart 2.3b). 2.13 Among the sub-sectors within industry, stressed advances ratios of all major sectors declined in March 2019 as compared to September 2018 (Chart 2.3c). Credit quality of large borrowers9 2.14 Share of large borrowers in SCBs’ total loan portfolios and their share in GNPAs was at 53.0 per cent and 82.2 per cent respectively in March 2019; this was lower compared to 54.7 per cent and 83.9 per cent in September 2018. In the large borrower accounts, the proportion of funded amount outstanding with any signs of stress (including SMA- 0, 1, 2, restructured loans and NPAs) came down from 25.3 per cent in September 2018 to 20.9 per cent in March 2019. SMA-210 loans also declined by 27 per cent between September 2018 and March 2019. Top 100 large borrowers accounted for 16.5 per cent of SCBs’ gross advances and 18.6 per cent of GNPAs (Chart 2.4). Risks Banking stability indicator 2.15 The banking stability indicator (BSI)11 gives a mixed picture. While banks’ asset quality and soundness improved, balance sheet liquidity i.e., proportion of liquid assets and stable liabilities, as also profitability need improvement (Chart 2.5). Resilience - Stress tests Macro stress test - Credit risk12 2.16 The resilience of the Indian banking system against macroeconomic shocks was tested through macro-stress tests for credit risk. These tests encompassed a baseline and two (medium and severe) adverse macroeconomic risk scenarios (Chart 2.6). The baseline scenario assumed the continuation of the current economic situation in future13. The adverse scenarios were derived based on standard deviations in the historical values of each of the macroeconomic variables separately, that is, univariate shocks: up to one standard deviation (SD) of the respective variables for medium risk and 1.25 to 2 SD14 for severe risk (10 years historical data). The horizon of the stress tests is one year. 2.17 The stress tests indicate that under the baseline scenario, the GNPA ratios of all SCBs may come down from 9.3 per cent in March 2019 to 9.0 per cent by March 2020 (Chart 2.7). Among the bank groups, PSBs’ GNPA ratios may decline from 12.6 per cent in March 2019 to 12.0 per cent by March 2020 under the baseline scenario, whereas PVBs’ GNPA ratios may decline from 3.7 per cent to 3.2 per cent and that of FBs may come down from 3.0 per cent to 2.9 per cent. 2.18 Under the assumed baseline macro scenario, CRAR for a system of 55 banks is projected to come down from 14 per cent in March 2019 to 12.9 per cent in March 2020. Further deterioration of CRAR is projected under stress scenarios (Chart 2.8a). 2.19 As many as five SCBs may have CRAR below the minimum regulatory level of 9 per cent by March 2020 without taking into account any further planned recapitalisation by the government. However, if macroeconomic conditions deteriorate, nine SCBs may record CRAR below 9 per cent under a severe macro-stress scenario (Chart 2.8b). 2.20 Under the baseline scenario, the CET 1 capital ratio may decline from 11 per cent to 10.1 per cent in March 2020. Five SCBs may have a common equity CET 1 capital ratio below the minimum regulatory required level of 5.5 per cent by March 2020. Under a severe stress scenario, the system level CET 1 capital ratio may decline to 9.1 per cent by March 2020. Five SCBs may have a CET 1 ratio below 5.5 per cent by March 2020 (Chart 2.9), highlighting the need for timely infusion of equity capital into these banks. Sensitivity analysis: Bank level16 2.21 A number of single-factor sensitivity stress tests17 based on March 2019 data, were carried out on SCBs to assess their vulnerabilities and resilience under various scenarios.18 Their resilience with respect to credit, interest rate and liquidity risks was studied through a top-down19 sensitivity analysis. Credit risk 2.22 Under a severe shock of 2 SD20 (that is, if the GNPA ratios of 54 select SCBs move up to 15.6 per cent from 9.4 per cent), the system-level CRAR will decline from 14.0 per cent to 10.3 per cent and Tier 1 CRAR will decline from 12 per cent to 8.3 per cent. The impairment in capital at the system level could thus be about 29.7 per cent. The results of the reverse stress test show that it requires a shock of 2.9 SD to bring down the system-level CRAR to 9 per cent. Bank-level stress tests’ results show that 21 banks21 having a share of 58.6 per cent of SCBs’ total assets might fail to maintain the required CRAR under a shock of a 2 SD increase in the GNPA ratio (Chart 2.10). PSBs were found to be severely impacted with the CRAR of 19 of the 21 PSBs likely to go down below 9 per cent in case of such a shock. 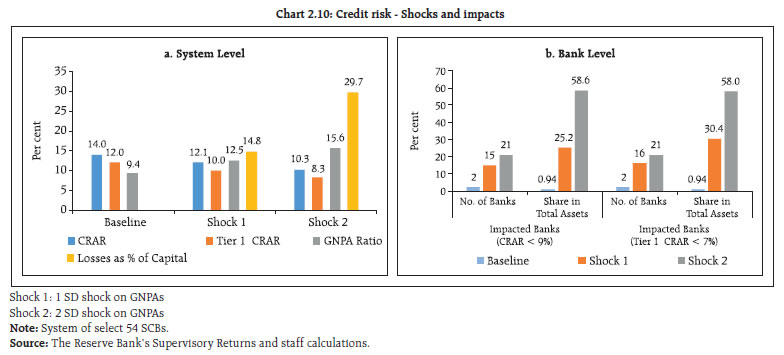 2.23 Distribution of CRAR among select SCBs shows that under a 2 SD shock on the GNPA ratio, CRAR will come down below 7 per cent for as many as 17 SCBs, mostly PSBs (Chart 2.11). PVBs and FBs experience a lesser shift in CRAR under a 2 SD shock while PSBs dominate the right half of the distribution (Chart 2.12). Credit concentration risk 2.24 Stress tests on banks’ credit concentration, considering top individual borrowers according to their stressed advances, showed that in the extreme scenario of the top 3 individual borrowers failing to repay22, the impact would be significant for 8 SCBs. These banks account for 14.6 per cent of the total assets of SCBs. The impact on CRAR at the system level under the assumed scenarios of failure of the top 1, 2 and 3 stressed borrowers will be 61, 92 and 115 basis points (Chart 2.13). 2.25 Stress tests on banks’ credit concentration, considering top individual borrowers according to their exposures, showed that in the extreme scenario of the top 3 individual borrowers failing to repay,23 the impact would be significant for seven SCBs. These seven SCBs account for 11.7 per cent of the total assets of SCBs (Chart 2.14). The impact on CRAR at the system level under the assumed scenario of default by all the top 3 individual borrowers will be 150 basis points. 2.26 Stress tests using different scenarios, based on the information of top group borrowers in the banks’ credit exposure concentrations, showed that the losses could be around 6.4 per cent and 12.1 per cent of the capital at the system level under the assumed scenarios of default by the top group borrower and by the top 2 group borrowers respectively.24 As many as 8 SCBs will not be able to maintain their CRAR level at 9 per cent if the top 3 group borrowers default (Table 2.1). 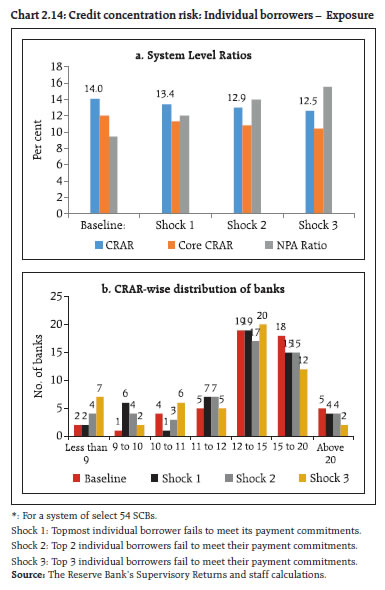
| Table 2.1: Credit concentration risk: Group borrowers – Exposure | | Shocks | System level* | Bank level | | CRAR | Core CRAR | NPA Ratio | Losses as % of Capital | Impacted Banks
(CRAR < 9%) | | Baseline (Before Shock) | 14.0 | 12.0 | 9.4 | --- | No. of Banks | Share in Total Assets of SCBs
(in %) | | Shock 1 | The top group borrower fails to meet its payment commitments. | 13.2 | 11.1 | 12.8 | 6.4 | 3 | 3.1 | | Shock 2 | The top 2 group borrowers fail to meet their payment commitments. | 12.5 | 10.4 | 15.8 | 12.1 | 5 | 5.1 | | Shock 3 | The top 3 group borrowers fail to meet their payment commitments. | 11.8 | 9.7 | 18.4 | 16.9 | 8 | 13.8 | Note: For a system of select 54 SCBs.
Source: The Reserve Bank’s Supervisory Returns and staff calculations. | Sectoral credit risk 2.27 A sensitivity analysis to assess bank-wise vulnerabilities due to their exposures to certain sub-sectors was performed. Sub-sector wise shocks based on respective historical standard deviations (SD) of GNPA ratios were considered to assess the credit risks due to the banks’ exposure to vulnerable sub-sectors. 2.28 With a 1 SD and 2 SD shock on the GNPA ratios of some sub-sectors, the corresponding increase in the GNPAs of 54 banks in different sub-sectors is shown in Table 2.2. The resulting losses due to increased provisioning and reduced incomes were taken into account to calculate banks’ stressed CRARs and RWAs. 2.29 The results show that shocks to the metal segment will lead to a decline of 22 bps in system level CRAR under a severe 2 SD shock, whereas power sector exposure will lead to around 21 bps decline in system level CRAR under a similar shock (Table 2.3). | Table 2.2: Growth in GNPAs due to sub-sector specific shocks - March 2019 | | | Mining | Food Processing | Petroleum | Cement | Metals | Jewellery | Construction | Transport | Power | Telecom | | 1 SD Shock | 31% | 24% | 36% | 42% | 46% | 28% | 32% | 27% | 38% | 54% | | Source: The Reserve Bank’s Supervisory Returns and staff calculations. |
Table 2.3: Decline in the system level CRAR (bps)
(in descending order) | | | 1 SD shock | 2SD shock | | Metal | 12 | 22 | | Power | 11 | 21 | | Transport | 4 | 7 | | Construction | 2 | 4 | | Food processing | 2 | 3 | | Telecom | 1 | 2 | | Jewellery | 1 | 2 | | Cement | 1 | 1 | | Petroleum | 1 | 1 | | Mining | 1 | 1 | | Source: The Reserve Bank’s Supervisory Returns and staff calculations. | Interest rate risk 2.30 The market value of the trading book portfolio as per extant available for sale (AFS) / held for trading (HFT) valuation norms for a sample of 54 SCBs accounting for more than 99 per cent of the total assets of the banking system stood at about ₹17.3 trillion as on end-March 2019 (Chart 2.15). About 90 per cent of the investments were classified as AFS. 2.31 There is a general reduction in PV0125 of the AFS portfolio in PSBs and FBs whereas a marginal increase was observed in PVBs. The trading gains for PSBs have been substantial in the current financial year. The high interest rate sensitivity of PSBs may have led to locking in larger trading gains possibly leading to a reduction in PV01 values. In terms of PV01 curve positioning, the tenor-wise distribution of PV01 indicates that about 49 per cent of the PV01 is accounted for by the 5-10-year tenor investments for PSBs while the major PV01 risk contributor for PVBs and FBs appears to be the investments in the 1-year to 5-year tenors (Table 2.4). 2.32 As regards the HFT portfolio size, PVBs and FBs have significant interest rate exposure therein relative to their AFS book, although the same for PVBs has declined as compared to December 2018. Interestingly, while PVBs have shed exposures in the 1-5-year tenor in March 2019, both PSBs and FBs have significantly added positions in the same tenor (Table 2.5).
Table 2.4: Tenor-wise PV01 distribution of AFS portfolio (in per cent)
(Values in the brackets indicate December 2018 figures) | | | Total PV01
(in ₹ billion) | < 1 year | 1 year- 5 year | 5 year- 10 year | > 10 years | | PSBs | 2.6 (2.7) | 3.7 (3.8) | 28.4 (31) | 49.5 (44.4) | 18.5 (20.7) | | PVBs | 0.51 (.49) | 16.1 (14.6) | 42.7 (44.1) | 28.8 (30.9) | 8.0 (10.4) | | FBs | 0.31 (.37) | 10.5 (8.8) | 70 (76.5) | 16.1 (9.1) | 3.4 (5.6) | | Source: The Reserve Bank’s Supervisory Returns and staff calculations. |
Table 2.5: Tenor-wise PV01 distribution of HFT portfolio (in per cent)
(Values in the brackets indicate December 2018 figures) | | | Total PV01
(in ₹ billion) | < 1 year | 1 year- 5 year | 5 year- 10 year | > 10 years | | PSBs | 0.01 (0.04) | 2 (2.8) | 28.8 (5.6) | 69.2 (83.5) | 0.0 (8.2) | | PVBs | 0.09 (0.12) | 28.6 (8.3) | 14.1 (52.4) | 53.1 (38.0) | 12.2 (1.3) | | FBs | 0.12 (0.07) | 10.6 (14.2) | 54.0 (30.4) | 30.7 (45.0) | 4.6 (10.4) | | Source: The Reserve Bank’s Supervisory Returns and staff calculations. | 2.33 For investments under available for sale (AFS) and held for trading (HFT) categories (direct impact) a parallel upward shift of 2.5 percentage points in the yield curve will lower the CRAR by about 82 basis points at the system level (Table 2.6). At the disaggregated level, six banks accounting for about 11.1 per cent of the total assets were impacted adversely and their CRAR fell below 9 per cent. The total loss of capital at the system level is estimated to be about 6.7 per cent. 2.34 The book value of the Held to Maturity (HTM) portfolio for a sample of 54 SCBs accounting for more than 99 per cent of the total assets of the banking system stood at about ₹21.9 trillion as on end-March 2019. Of the ₹15.8 trillion HTM book of the PSBs, about 61.3 per cent by value was accounted by G-Secs and about 29.5 per cent was accounted for by State Development Loans (SDLs). The comparative figures for PVBs were about 84.4 per cent G-Secs and 14.6 per cent SDLs in a HTM portfolio of ₹6.2 trillion (Chart 2.16). 2.35 Read in conjunction with Chart 1.24, about ₹2.4 trillion of relatively less liquid SDLs are included in the trading book portfolio of PSBs. A lack of secondary market liquidity in this segment has implications for valuation. Equity price risk 2.36 Under the equity price risk, the impact of a shock of a fall in equity prices on bank capital and profits were examined. The system-wide CRAR would decline by 57 basis points from the baseline under a stressful 55 per cent drop in equity prices (Chart 2.17). The impact of a drop in equity prices is limited for the overall system considering the regulatory limits prescribed for banks’ exposures to capital markets due to which they typically have a low proportion of capital market exposures on their balance sheets. Liquidity risk: Impact of deposit run-offs on liquid stocks 2.37 The liquidity risk analysis captures the impact of deposit run-offs and increased demand for the unutilised portions of credit lines which have been sanctioned/committed/guaranteed. Banks in general may be in a position to withstand liquidity shocks with their high-quality liquid assets (HQLAs).26 In assumed scenarios, there will be increased withdrawals of un-insured deposits27 and simultaneously there will also be increased demand for credit resulting in withdrawal of the unutilised portions of sanctioned working capital limits as well as utilisation of credit commitments and guarantees extended by banks to their customers. Table 2.6: Interest rate risk – Bank groups - shocks and impacts
(under shock of 250 basis points parallel upward shift of the INR yield curve) | | | Public Sector Banks | Private Sector Banks | Foreign Banks | All SCBs | | AFS | HFT | AFS | HFT | AFS | HFT | AFS | HFT | | Modified Duration | 2.8 | 2.2 | 1.3 | 1.1 | 1.2 | 1.7 | 2.2 | 1.4 | | Reduction in CRAR (bps) | 108 | 36 | 111 | 82 | | Source: The Reserve Bank’s Supervisory Returns and staff calculations. |
2.38 Using their HQLAs required for meeting day-to-day liquidity requirements, 47 of the 54 banks in the sample will remain resilient in a scenario of assumed sudden and unexpected withdrawals of around 10 per cent of the deposits along with the utilisation of 75 per cent of their committed credit lines (Chart 2.18). Bottom-up stress tests 2.39 A series of bottom-up stress tests (sensitivity analyses) were conducted for the select sample banks,28 with the reference date as 31st March, 2019. The results of the bottom-up stress tests carried out by select banks also testified to the banks’ general resilience to different kinds of shocks. While confirming the top-down stress tests results in general, the bottom-up stress tests show that owing to better capitalisation of PSBs, average CRAR remains above 9 per cent, though some banks had their stressed CRAR positions falling below the regulatory minimum of 9 per cent (Chart 2.19). 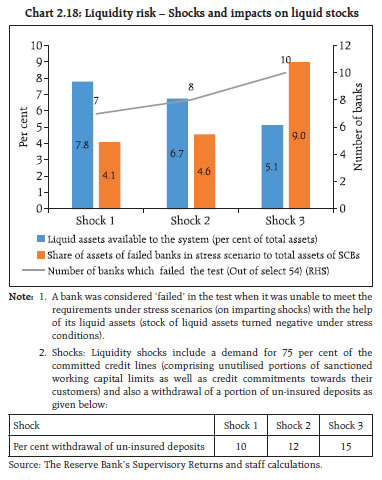 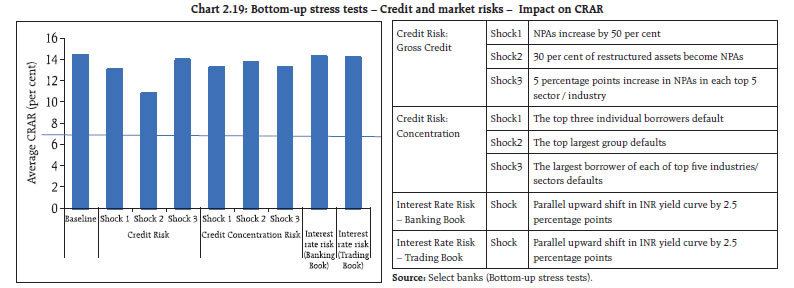 2.40 The results of bottom-up stress tests for liquidity risk show a significant impact of liquidity shocks on select banks. Liquid assets ratios29 reflect the liquidity position of (select) banks under different scenarios. The results show that HQLAs enable the banks in the sample to sustain themselves against the liquidity pressure from sudden and unexpected withdrawal of deposits by depositors (Chart 2.20). The banks have higher liquid asset ratios compared to the exercise last year. Stress testing the derivatives portfolio of banks: Bottom-up stress tests 2.41 A series of bottom-up stress tests (sensitivity analyses) on derivative portfolios were conducted for select sample banks30 with the reference date as on March 31, 2019. The banks in the sample, reported the results of four separate shocks on interest and foreign exchange rates. The shocks on interest rates ranged from 100 to 250 basis points, while 20 per cent appreciation/depreciation shocks were assumed for foreign exchange rates. The stress tests were carried out for individual shocks on a stand-alone basis. 2.42 Chart 2.21 plots the mark-to-market (MTM) impact as a proportion of CET 1 capital - as can be seen therein, the impact of the sharp moves are mostly muted in the individual banks , particularly PSBs and PVBs. However, since risks can only be transferred and not eliminated, there’s a possibility that such risks are possibly residing in the corporate balance sheets. With the adoption of Indian accounting standards (Ind AS) in NBFCs and companies by Ministry of Corporate Affairs (MCA), it has however become easier for banks to ascertain the hedging profile of their clients and thereby reassess the counterparty exposures being run. The nature of corporate hedging profile has implications for secondary market liquidity under stressed conditions as well. 2.43 The stress test results showed that the average net impact of interest rate shocks on sample banks were negligible. The results of the scenario involving appreciation of INR point to the effect of the shock continuing to normalise in March 2019 after a previous spike (Chart 2.22). Section II Scheduled urban co-operative banks Performance 2.44 At the system level,31 the CRAR of scheduled urban co-operative banks (SUCBs) remained unchanged at 13.6 per cent between September 2018 and March 2019. However, at a disaggregated level, four SUCBs’ CRAR32 was below the minimum required level of 9 per cent. GNPAs of SUCBs as a percentage of gross advances declined from 8.2 per cent to 6.4 per cent and their provision coverage ratio33 increased from 48.5 per cent to 60.3 per cent during the same period. Further, SUCBs’ RoAs remained unchanged at 0.7 per cent and their liquidity ratio34 declined from 34.1 per cent to 33.5 per cent during the same period. Resilience - Stress tests Credit risks 2.45 The impact of credit risk shocks on the SUCBs’ CRAR was observed under four different scenarios.35 The results show that even under a severe shock of an increase in GNPAs by 2 SD, the system-level CRARs of SUCBs remained above the minimum regulatory requirement. At the individual level, however, a number of SUCBs (21 out of 54) may not be able to maintain the minimum CRAR. Liquidity risks 2.46 A stress test on liquidity risks was carried out using two different scenarios: i) 50 per cent and ii) 100 per cent increase in cash outflows in the 1 to 28 days’ time bucket. It was assumed that there was no change in cash inflows under both the scenarios. The stress tests’ results indicate that 25 banks under the first scenario and 36 banks under the second scenario may face liquidity stress.36 Section III Non-banking financial companies 2.47 There were 9,659 non-banking financial companies (NBFCs) registered with the Reserve Bank as on March 31, 2019, of which 88 were deposit-accepting (NBFCs-D) and 263 systemically important non-deposit accepting NBFCs (NBFCs-ND-SI).37 All NBFC-D and NBFCs-ND-SI are subject to prudential regulations such as capital adequacy requirements and provisioning norms along with reporting requirements. Recent developments 2.48 Even as their importance in credit intermediation is growing, recent developments in the domestic financial markets have brought the focus on the NBFC sector (including housing finance companies or HFCs) especially with regard to their exposures, quality of assets and asset-liability mismatches (ALM). The liquidity stress in NBFCs reflected in the third quarter of the last financial year (September - December 2018) was due to an increase in funding costs as also difficulties in market access in some cases. Despite the dip in confidence, better performing NBFCs with strong fundamentals were able to manage their liquidity even though their funding costs moved with market sentiments and risk perceptions (Chart 2.23). 2.49 NBFCs depend largely on public funds which account for 70 per cent of the total liabilities of the sector. Bank borrowings, debentures and commercial papers are the major sources of funding for NBFCs. Bank borrowings have shown an increasing trend as the share of bank borrowings to total borrowings have increased from 21.2 percent in March 2017 to 23.6 percent in March 2018 and further to 29.2 percent in March 2019. During the same period, dependence on debentures declined from 50.2 percent in March 2017 to 41.5 percent in March 2019 (Chart 2.24). This indicates that banks are compensating for the reduced market access for NBFCs in the wake of stress in the sector. The top 10 NBFCs accounted for more than 50 per cent of total bank exposure to the sector while the top 30 NBFCs (including government owned NBFCs) accounted for more than 80 per cent of the total exposure. 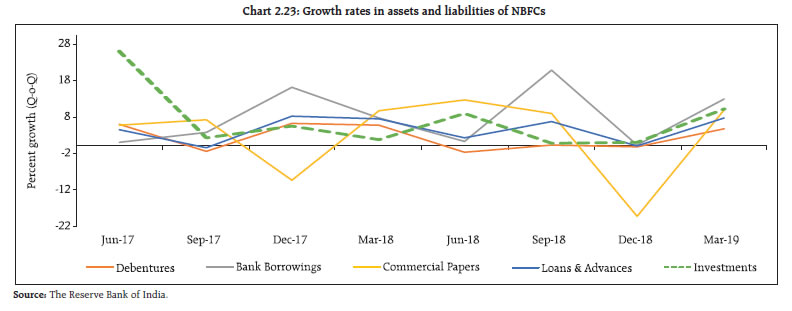 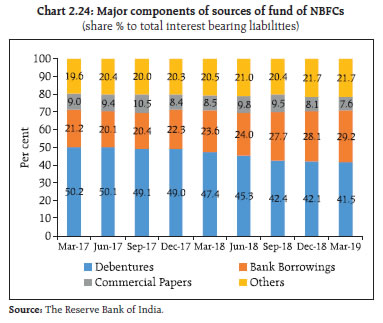 2.50 In the CP market, the absolute issuance of CPs by NBFCs have declined sharply relative to its level pre - IL&FS default (Chart 2.25). During the stress period, CP spread of all entities had increased, particularly that of NBFCs, highlighting a reduced risk-appetite for them. Subsequently, the CP spread for NBFCs has reduced and its gap vis-à-vis other issuers has narrowed (Chart 2.26). Thus, in a way the IL&FS stress episode brought the NBFC sector under greater market discipline as the better performing companies continued to raise funds while those with ALM and/or asset quality concerns were subjected to higher borrowing costs. 2.51 Post crisis, while banks’ overall exposure to NBFCs increased (Chart 2.24), their subscription to CPs of NBFCs continued to decline (Chart 2.27). Performance 2.52 The consolidated balance sheet size of the NBFC sector grew by 20.6 per cent to ₹ 28.8 trillion during 2018-19 as against an increase of 17.9 per cent to ₹24.5 trillion during 2017-18. 2.53 The NBFC sector’s net profits increased by 15.3 per cent in 2018-19 as compared to 27.5 per cent in 2017-18. RoA was 1.7 per cent in 2018-19 (Tables 2.7 and 2.8). Asset quality and capital adequacy 2.54 GNPAs of the NBFC sector as a percentage of total advances increased from 5.8 per cent in 2017-18 to 6.6 per cent in 2018-19. However, the net NPA ratio declined marginally from 3.8 per cent in 2017-18 to 3.7 per cent in 2018-19. As on March 2019, the CRAR of the NBFC sector moderated at 19.3 per cent from 22.8 per cent in March 2018 (Table 2.9).40 Resilience - stress tests System level 2.55 Stress tests for the credit risk for the NBFC sector as a whole for the year ended March 2019 were carried out under three scenarios: Increase in GNPA by (i) 0.5 standard deviation (SD), (ii) 1 SD and (iii) 3 SD. The results indicate that in the first scenario, the sector’s CRAR declined from 19.5 per cent to 17.9 per cent. In the second scenario, it declined to 15.3 per cent and in the third scenario it declined to 11.7 per cent. | Table 2.7: Aggregated balance sheet of the NBFC sector: y-o-y growth38 | | (per cent) | | Particulars | Mar-18 | Mar-19 | | 1. Share capital | 6.0 | 6.3 | | 2. Reserves and surplus | 18.7 | 14.6 | | 3. Total borrowings | 19.6 | 19.6 | | Of which 3.1 Debentures | 13.1 | 5.2 | | 3.2 Bank borrowings | 34.4 | 47.9 | | 3.3 Commercial paper | 13.3 | 4.0 | | 4. Current liabilities and provisions | 22.4 | 48.7 | | Total Liabilities / Assets | 17.9 | 20.6 | | 1. Loans and advances | 21.1 | 18.6 | | 2. Investments | 12.9 | 24.4 | | 3. Others | 26.7 | -2.0 | | Income/Expenditure | | | | 1. Total income | 11.4 | 17.8 | | 2. Total expenditure | 9.6 | 17.8 | | 3. Net profit | 27.5 | 15.3 | | Source: The Reserve Bank’s Supervisory Returns. |
| Table 2.8: Select ratios of the NBFC sector | | (per cent) | | | 2017-18 | 2018-19 | | 1. Capital market exposure to total assets | 10.5 | 9.5 | | 2. Real estate exposure to total assets | 6.7 | 6.0 | | 3. Leverage ratio39 | 3.2 | 3.4 | | 4. Net profit to total income | 14.1 | 15.3 | | 5. RoA | 1.7 | 1.7 | | Source: The Reserve Bank’s Supervisory Returns. |
| Table 2.9: Select ratios of the NBFC sector | | (per cent) | | | GNPA Ratio | NNPA Ratio | CRAR | | 2014-15 | 4.1 | 2.5 | 26.2 | | 2015-16 | 4.5 | 2.5 | 24.3 | | 2016-17 | 6.1 | 4.4 | 22.1 | | 2017-18 | 5.8 | 3.8 | 22.8 | | 2018-19 | 6.6 | 3.7 | 19.3 | | Source: The Reserve Bank’s Supervisory Returns. | Individual NBFCs 2.56 The stress tests’ results for individual NBFCs indicate that under the first two scenarios, around 8 per cent of the companies will not be able to comply with the minimum regulatory capital requirements of 15 per cent. Around 13 per cent of the companies will not be able to comply with the minimum regulatory CRAR norms under the third scenario. Section IV Consumer credit and developments in Non-banking space - A thematic exploration 2.57 Given the significant growth in consumer credit in recent years, emerging trends in the sector are analysed with specific focus on asset quality issues across originators to locate any underlying trend. The implications of asset selection issues underlined in the consumer credit sector with specific focus on NBFC/HFC segment as also some topical issues related to asset allocation in Debt Mutual Funds are explored subsequently. I. Consumer Credit 2.58 Consumer credit sector is well served by banks, NBFCs as also Housing Finance Companies (HFCs) in specific segments. Hence, the relative efficacy of credit disbursal across various channels is also of policy interest. 2.59 Tables 2.10-2.13 tabulate the key movements in relative shares in four consumer credit products, viz. auto loan, home loans and loans against properties and personal loans. As can be seen therein, the relative shares of various intermediaries are fairly stable during the period December 2016 to December 2018 with the credit in each of the specific segments growing at a compounded annual rate of above 20 per cent. | Table 2.10: Relative Share in Auto-Loans | | | Dec-16 | Mar-17 | Sep-17 | Mar-18 | Jun-18 | Sep-18 | Dec-18 | | PSB | 30% | 27% | 31% | 31% | 30% | 31% | 30% | | PVB | 37% | 38% | 38% | 38% | 39% | 37% | 38% | | NBFC | 32% | 34% | 31% | 30% | 30% | 30% | 30% | | Total (₹ Billion) | 2,737 | 2,816 | 3,296 | 3,682 | 3,766 | 3,787 | 4,089 | | Source: TransUnion.CIBIL |
| Table 2.11: Relative Share in Home-Loans | | | Dec-16 | Mar-17 | Sep-17 | Mar-18 | Jun-18 | Sep-18 | Dec-18 | | PSB | 41% | 39% | 41% | 41% | 40% | 41% | 41% | | PVB | 17% | 17% | 17% | 17% | 17% | 16% | 16% | | NBFC | 1% | 1% | 2% | 1% | 2% | 2% | 2% | | HFC | 41% | 42% | 41% | 41% | 42% | 41% | 42% | | Total ₹ (Billion) | 12,104 | 12,433 | 14,049 | 15,656 | 16,204 | 17,020 | 17,431 | | Source: TransUnion.CIBIL |
| Table 2.12: Relative Share in Loans Against Properties | | | Dec-16 | Mar-17 | Sep-17 | Mar-18 | Jun-18 | Sep-18 | Dec-18 | | PSB | 14% | 14% | 15% | 15% | 15% | 15% | 15% | | PVB | 30% | 31% | 31% | 33% | 33% | 31% | 33% | | NBFC | 27% | 25% | 23% | 20% | 19% | 21% | 19% | | HFC | 29% | 30% | 31% | 32% | 34% | 33% | 34% | | Total (₹ Billion) | 2,354 | 2,440 | 2,745 | 3,135 | 3,228 | 3,442 | 3,497 | | Source: TransUnion.CIBIL |
| Table 2.13: Relative Share in Personal Loans | | Member Class | Dec-16 | Mar-17 | Sep-17 | Mar-18 | Jun-18 | Sep-18 | Dec-18 | | PSB | 47% | 47% | 46% | 44% | 43% | 42% | 42% | | PVB | 40% | 41% | 41% | 42% | 42% | 42% | 42% | | NBFC | 13% | 13% | 14% | 14% | 16% | 17% | 15% | | Total (₹ Billion) | 1,843 | 1,989 | 2,376 | 2,831 | 3,009 | 3,253 | 3,490 | | Source: TransUnion.CIBIL | 2.60 Given the substantial growth rate in exposure to these sectors, a possible concern is dilution in credit standards. A look at the evolution in delinquency levels in each of the segments shows that NBFCs as a group have been leading delinquency levels in almost all the sub-segments of consumer credit (except in Loans against property where it stands a close second to PSBs) when uniform delinquency norm of 90 days past due (dpd) is applied (Tables 2.14-2.17). 2.61 While the comparative analysis of delinquency in the asset class across financial intermediaries is important, from a financial stability perspective, the possible existence of localised asset stress in any segment of financial intermediation is of relevance too. For this purpose, an analysis in each of the categories of financial intermediaries as to the proportion of assets being held by the financial intermediaries with twice the industry level of delinquencies is being made. The factor 2 is being used, somewhat arbitrarily, to look at the asset share of firms which form the right-hand tail in terms of delinquencies. Tables 2.18-2.21 gives the relevant details. For instance, with reference to Auto-loans, as on December 2018, NBFCs with twice the industry level delinquency (i.e. twice of 2.9 per cent) constitute 29.8 per cent of the NBFC assets. With reference to delinquencies in two major asset categories, viz. Home Loans and Loans against properties, asset share of NBFCs/HFCs with higher levels of delinquencies form 19.3 per cent and 11.5 per cent of their combined assets respectively, as on December 2018. | Table 2.14: Relative delinquency levels in Auto-Loans | | | Dec-16 | Mar-17 | Sep-17 | Mar-18 | Jun-18 | Sep-18 | Dec-18 | | PSB | 3.2% | 3.5% | 3.0% | 2.8% | 3.0% | 2.9% | 2.7% | | PVB | 2.2% | 1.7% | 1.6% | 1.6% | 1.5% | 1.7% | 1.5% | | NBFC | 6.4% | 5.8% | 5.9% | 4.4% | 4.6% | 4.8% | 4.6% | | Industry | 4.0% | 3.7% | 3.5% | 2.8% | 3.0% | 3.1% | 2.9% | | Source: TransUnion.CIBIL |
| Table 2.15: Relative delinquency levels in Home-Loans | | | Dec-16 | Mar-17 | Sep-17 | Mar-18 | Jun-18 | Sep-18 | Dec-18 | | PSB | 2.0% | 2.1% | 2.1% | 1.9% | 2.1% | 2.0% | 1.9% | | PVB | 0.7% | 0.6% | 0.7% | 0.7% | 0.7% | 0.8% | 0.7% | | NBFC | 4.1% | 3.8% | 3.5% | 2.9% | 3.8% | 3.7% | 3.9% | | HFC | 1.2% | 1.0% | 1.5% | 1.3% | 1.6% | 1.6% | 1.7% | | Industry | 1.6% | 1.5% | 1.7% | 1.5% | 1.7% | 1.7% | 1.7% | | Source: TransUnion.CIBIL |
| Table 2.16: Relative delinquency levels in Loans Against Properties | | | Dec-16 | Mar-17 | Sep-17 | Mar-18 | Jun-18 | Sep-18 | Dec-18 | | PSB | 4.4% | 4.5% | 4.9% | 5.1% | 6.2% | 6.8% | 6.7% | | PVB | 1.2% | 1.0% | 1.1% | 1.1% | 1.3% | 1.6% | 1.6% | | NBFC | 3.8% | 3.4% | 4.3% | 4.1% | 4.8% | 4.3% | 5.1% | | HFC | 1.4% | 1.2% | 1.8% | 1.7% | 2.0% | 2.0% | 2.2% | | Industry | 2.5% | 2.3% | 2.8% | 2.6% | 3.1% | 3.2% | 3.5% | | Source: TransUnion.CIBIL |
| Table 2.17: Relative delinquency levels in Personal Loans | | Member Class | Dec-16 | Mar-17 | Sep-17 | Mar-18 | Jun-18 | Sep-18 | Dec-18 | | PSB | 0.6% | 0.7% | 0.6% | 0.4% | 0.5% | 0.4% | 0.3% | | PVB | 0.4% | 0.4% | 0.4% | 0.5% | 0.5% | 0.5% | 0.5% | | NBFC | 0.6% | 0.6% | 0.8% | 0.8% | 0.9% | 0.9% | 1.0% | | Industry | 0.6% | 0.6% | 0.6% | 0.6% | 0.7% | 0.6% | 0.6% | | Source: TransUnion.CIBIL |
| Table 2.18: Relative asset share of firms with high delinquency levels in Auto-Loans | | | >2x 90+ Rate | >2x 90+ Rate | >2x 90+ Rate | >2x 90+ Rate | >2x 90+ Rate | >2x 90+ Rate | >2x 90+ Rate | | Share of Balances | Share of Balances | Share of Balances | Share of Balances | Share of Balances | Share of Balances | Share of Balances | | Member Class | Dec-16 | Mar-17 | Sep-17 | Mar-18 | Jun-18 | Sep-18 | Dec-18 | | PSB | 8.1% | 9.4% | 13.1% | 20.4% | 20.2% | 11.0% | 9.7% | | PVB | 0.4% | 0.3% | 0.3% | 0.3% | 0.3% | 0.3% | 0.2% | | NBFC | 31.8% | 33.9% | 32.2% | 30.1% | 29.7% | 29.6% | 29.8% | | Total | 13.3% | 14.3% | 14.4% | 15.5% | 15.7% | 13.2% | 12.7% | | Source: TransUnion.CIBIL |
| Table 2.19: Relative asset share of firms with high delinquency levels in Home-Loans | | | >2x 90+ Rate | >2x 90+ Rate | >2x 90+ Rate | >2x 90+ Rate | >2x 90+ Rate | >2x 90+ Rate | >2x 90+ Rate | | Share of Balances | Share of Balances | Share of Balances | Share of Balances | Share of Balances | Share of Balances | Share of Balances | | Dec-16 | Mar-17 | Sep-17 | Mar-18 | Jun-18 | Sep-18 | Dec-18 | | PSB | 17.0% | 14.7% | 11.9% | 20.6% | 25.2% | 17.3% | 19.1% | | PVB | 0.9% | 1.4% | 0.2% | 0.3% | 1.2% | 1.1% | 1.3% | | NBFC | 46.7% | 40.2% | 41.1% | 38.4% | 50.0% | 50.9% | 54.6% | | HFC | 5.5% | 5.2% | 16.0% | 18.4% | 19.4% | 9.7% | 18.0% | | Total | 10.3% | 8.9% | 12.5% | 16.5% | 19.4% | 12.5% | 16.5% | | NBFC & HFC | 6.9% | 6.4% | 16.9% | 19.1% | 20.6% | 11.2% | 19.3% | | Source: TransUnion.CIBIL |
| Table 2.20: Relative asset share of firms with high delinquency levels in Loans against properties | | | >2x 90+ Rate | >2x 90+ Rate | >2x 90+ Rate | >2x 90+ Rate | >2x 90+ Rate | >2x 90+ Rate | >2x 90+ Rate | | Share of Balances | Share of Balances | Share of Balances | Share of Balances | Share of Balances | Share of Balances | Share of Balances | | Dec-16 | Mar-17 | Sep-17 | Mar-18 | Jun-18 | Sep-18 | Dec-18 | | PSB | 18.6% | 38.7% | 20.8% | 20.2% | 19.5% | 19.1% | 18.9% | | PVB | 0.4% | 0.3% | 0.3% | 0.5% | 0.4% | 0.5% | 0.7% | | NBFC | 27.8% | 40.7% | 30.2% | 26.2% | 25.0% | 22.3% | 26.9% | | HFC | 4.4% | 4.5% | 3.8% | 8.4% | 3.2% | 3.0% | 2.9% | | Total | 11.2% | 16.8% | 11.4% | 10.9% | 9.4% | 9.2% | 10.2% | | Banks | 5.2% | 10.6% | 6.0% | 5.8% | 5.4% | 5.5% | 5.8% | | NBFC & HFC | 15.5% | 20.9% | 15.0% | 15.1% | 11.0% | 10.6% | 11.5% | | Source: TransUnion.CIBIL |
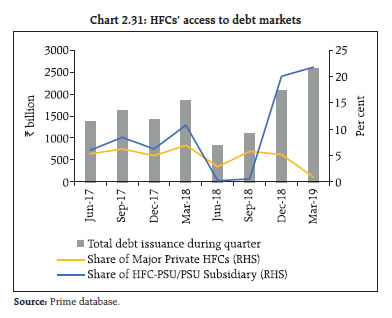
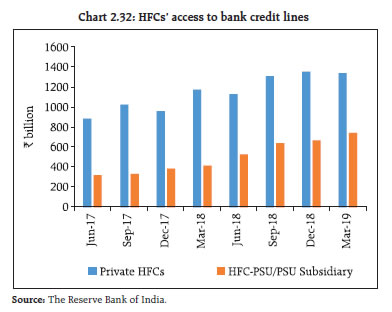
| Table 2.21: Relative asset share of firms with high delinquency levels in Personal Loans | | | >2x 90+ Rate | >2x 90+ Rate | >2x 90+ Rate | >2x 90+ Rate | >2x 90+ Rate | >2x 90+ Rate | >2x 90+ Rate | | Share of Balances | Share of Balances | Share of Balances | Share of Balances | Share of Balances | Share of Balances | Share of Balances | | Dec-16 | Mar-17 | Sep-17 | Mar-18 | Jun-18 | Sep-18 | Dec-18 | | PSB | 11.5% | 7.4% | 6.0% | 8.2% | 7.9% | 6.2% | 4.0% | | PVB | 2.3% | 2.1% | 2.8% | 0.3% | 5.0% | 5.4% | 5.3% | | NBFC | 3.3% | 14.1% | 5.1% | 27.8% | 23.2% | 26.3% | 13.1% | | Total | 8.9% | 7.5% | 6.2% | 9.0% | 11.0% | 11.1% | 7.6% | | Source: TransUnion.CIBIL | 2.62 To conclude, the NBFC and HFC portfolio choice seems to have an adverse selection bias. The proximate cause of such bias as also supervisory efforts to address some of the systemic dimension are discussed below. II. Developments in Non-banking credit intermediation space 2.63 As per estimates of the flow of resources to the commercial sector in 2018-19, the non-bank share in credit was at 26.6 per cent of the aggregate domestic sources. While the share is showing a declining trend relative to 2017-18 (39.1 per cent), non-bank sources nevertheless constitute a significant part of credit flows to the commercial sector. On the other hand, mutual funds are expanding their scope in financial intermediation (though their principal characteristic is the pass-through nature of investment) which is a reflection of the financial sector’s development. From a regulatory perspective, however, the growing financial networks along with their potential to trigger a contagion often tend to create policy ambivalence straddling financial market development and financial market stability. This part deals with recent market developments as also certain emerging concerns related to the sector encompassing non-banking financial companies (NBFCs) including housing finance companies (HFCs) and mutual funds (MFs). A. Non-banking finance companies and housing finance companies 2.64 NBFCs operate in niche areas with significant diversity in the origination of underlying assets and therefore a common denominator approach is not enough for grasping the nature of stress in their finances. For this purpose, possible signs of asset stress in two major categories of non-banking credit intermediaries – asset finance companies (AFCs) and loan companies (LCs) are examined in a separate analysis. This analysis is based on data for five major AFCs and four major LCs. 2.65 NBFCs' and HFCs’ relative access to funding is explored subsequently which encompasses tradable short-term instruments, long term instruments and banking sector exposure. Finally, the issues of market access as also possible balance sheet stress for HFCs are examined. (i) NBFCs 2.66 For the purpose of this analysis, the NBFC portfolios were segregated into commercial and retail segments41. Charts 2.28 and 2.29 profile the portfolio movements in AFCs and LCs since June 2016. As per these charts, retail assets were the key drivers of portfolio size, growth and delinquencies for both the classes of NBFCs during the period under review. For the sake of uniformity, the delinquency in this context is based on a uniform 90-days past due (dpd) norm even as the regulatory norm for delinquency was 120 dpd for 2016-17 and 90 dpd for 2017-18 while from 2018-19 onwards, the delinquency classification is based on an expected credit loss (ECL) based impairment classification. As has been highlighted in the EBA survey reported in Chapter III, the 90 dpd norm (incurred loss approach) can be quite at variance with an ECL based impairment assessment. Market access 2.67 With regard to access to market (commercial papers and privately placed debt), the sample size is enhanced to 28 private NBFCs across loan companies, investment companies, asset finance, infrastructure finance and core investment companies. As Charts 2.30 a and b show, total issuance of debt during a given quarter showed an upward trend since September 2018 although the relative share of NBFCs in the issuances has been on a decline. The bank lines outstanding showed a secular increase over the same period while the relative share of CPs issued by NBFCs in total outstanding CPs showed a marginal decline in March 2019. Impact of funding sources on asset choice 2.68 The various funding lines throw up a difficult optimisation choice for NBFCs. Over-reliance on bank funding makes the NBFCs uncompetitive over a host of financial products where the sector has to compete with banks and hence under such circumstances, NBFCs’ portfolio choices may tend to have an adverse selection bias. Funding with private debt has implication for NBFCs' profitability while inducing an interest rate mismatch in key product segments where NBFC products are (notionally) benchmarked to money market rates for competitive reasons. Finally, over-reliance on CP funding has an inbuilt liquidity risk as has already been explained. (ii) Housing Finance companies (HFCs) 2.69 Given that different HFCs have differential access to financial markets based on their pedigree, for the purpose of this analysis the top 15 housing finance companies were sub-divided into two groups – private HFCs and PSU/PSU subsidiary HFCs. Moreover, within the cohort of private HFCs, a leading traditional housing finance company which has differential access relative to other private HFCs was excluded to assess market access issues, if any. 2.70 Table 2.22 lists the relative importance of various financial instruments in the HFCs’ balance sheets. Clearly, access to non-convertible debenture markets is an important factor, yet access to the market for private HFCs has fallen disproportionately in recent times (Chart 2.31). On the other hand, bank exposure to private HFCs marginally declined over Q4:2018-19 although such exposures may not factor in portfolio buyouts undertaken by some banks (Chart 2.32). Incidentally, it is possible that compulsion to securitise and reduce balance sheets may lead to a situation where the HFCs end up holding riskier asset pools in their residual portfolios. Market access of HFCs 2.71 As can be seen from Table 2.22, the relative proportion of bank lines in HFCs’ liability structures increased over the past one year although, private HFCs showed a marginal decline in Q4:2018-19 in absolute amounts. Yet, as mentioned with regard to NBFCs, bank lines are not a sustainable funding proposition for HFCs in the housing finance market for competitive reasons. Significant reliance on these lines may have implications for adverse selection in the mortgage portfolios which banks too compete for. HFCs’ asset portfolio structures raise a few more issues. Share of non-mortgage loans portfolio in total loans for top 5 HFCs increased from 29 percent in March 2016 to 46 per cent in December 2018 as per the data made available by National Housing Bank (NHB). Such a portfolio construction away from individual housing loans can largely be rationalised based on the fact that spreads on high quality individual loans are below 2 per cent.44 However, industry level delinquency in the individual mortgage portfolio in 2018-19 (till Q3) was running at about 1.5-1.7 per cent (refer Table 2.15). Given the fact that non-mortgage portfolios are inherently riskier (Table 2.16 outlines delinquency of Loans against property portfolio across financial intermediaries), funding of such portfolios with both short-term CPs / shorter maturity debt has liquidity risk implications during times of uncertainty. | Table 2.22: Liability structures of major HFCs43 | | Particulars | March 2018 | March 2019 | | Non-Convertible Debentures | 46.2% | 44.4% | | Banks /NHB/FIs/Term Loans | 23.9% | 28.9% | | Public Deposits | 11.1% | 11.4% | | Commercial Papers | 10.8% | 7.5% | | ECBs, Other FCBs | 2.9% | 3.3% | | Others | 5.1% | 4.5% | | Source: NHB. |
  2.72 The Reserve Bank has taken quite a few measures to improve access to long term liability instruments for financial intermediaries in general. This includes, inter-alia, actions taken to infuse liquidity in the system by conducting Open Market Operations (OMOs) in addition to regular LAF auctions, enhancing the single borrower limit for exposure of banks to NBFCs, reducing the minimum average maturity requirement for ECBs in the infrastructure space to three years (from five years) and talking-up the liquidity position in its pronouncements. To shore up public confidence as also to increase systemic resilience, the Reserve Bank has put out draft liquidity guidelines for public comments. On its part, the National Housing Bank (NHB) has enhanced the refinance limits that can be accessed by eligible HFCs to tide over temporary mismatches; it has started monitoring the weekly liquidity position of the top 15 HFCs which account for more than 95 per cent of the total asset size of all HFCs. (iii) Contagion analysis 2.73 For a comprehensive review of the importance of NBFCs / HFCs in the financial system and their systemic impact, the potential solvency losses caused by the failure of NBFCs / HFCs are also required to be estimated. The quantum of solvency contagion losses45 to the banking system caused by idiosyncratic failure of a stand-alone private NBFC / HFC shows that such losses are dominated by HFCs, as the top 5 solvency loss inducing institutions are all HFCs. As can be discerned from Chart 2.33, the systemic impact of an HFC’s failure has significantly lessened as the PSB banking space has got better capitalised. 2.74 The major contributors to contagion losses are: a. Size: Size is often posited as an important measure of systemic importance. However, size as a measure of systemic risk, does not capture the entire story and can sometimes also be misleading since the contagion losses do not decline in a linear fashion with size. b. The banking sector’s exposure to HFCs: The banking sector’s exposure to HFCs, more specifically the health of the banks which are exposed to HFCs being subjected to solvency losses is an equally important determinant of contagion losses since propagation of losses due to failure of banks is what contagion losses aim to capture. The traditional approach to capturing the systemic importance of an entity typically misses out on the interaction of poorly capitalised NBFCs/HFCs with weakly capitalised banks. B. Mutual funds 2.75 Mutual funds (MF) are the largest net providers of funds to the financial system. Hence, from a market interconnectivity perspective, MFs are intertwined intimately with the rest of the financial system (paragraph 2.98 and 2.99). Consequently, any disruption in the MF market has immediate and significant spill overs in the asset markets. The issues with regard to credit concentration in MF portfolios as also more generally issues of valuation in fixed income markets and the spillovers in money market rates highlighted by IL&FS induced dislocation were discussed in detail in the December 2018 FSR. Now in the context of recent events with regard to default of obligations in a few closed ended MF schemes, a contrast with regard to asset allocations in open ended and closed ended debt schemes is explored. Further, given the fact that the nature of recent defaults has primarily involved debt obligations backed by pledging of shares of group companies, the nature, evolution and quantum of such exposures is explored separately (Box 2.1). Incidentally, the issues of effective leverage and other prudential considerations in the context of pledging of shares by promoters have been discussed in previous issues of FSR (December 2014 paragraphs 3.32-3.33 and December 2013 paragraphs 3.51 – 3.55). 2.76 Recent events related to fixed maturity plans (FMPs) and prior events related to IL&FS demonstrated that the realised risk in debt plans (both open and close ended) had spillover effects. In this regard, it may be appropriate to contrast the ‘risky’ investment profiles in FMPs vis-à-vis open ended debt schemes (OEDs) of ‘comparable’ mandates to assess the nature of risks engendered by both classes of investments. | Table 2.23: Instrument distribution of select OEDs and FMPs | | Nature of Investment | Proportion in OEDs (per cent) | Proportion in FMPs (in per cent) | | Corporate Debt | 93.28 | 78.01 | | SDL | 0.83 | 16.43 | | Commercial Paper | 1.26 | 0.94 | | G-Secs | 0.95 | 0.04 | | Certificate of Deposit | 0.36 | 1.77 | | Equity | 0.23 | 0.17 | | T-Bills | 0.04 | 0.00 | | Others | 3.04 | 2.63 | | Source: Mutual Funds' monthly disclosures, Prime data base. | 2.77 For the purposes of comparing the investment profiles, 44 open ended debt schemes offered by top AMCs (accounting for more than 90 per cent of total AUM) encompassing the corporate bond fund, the credit risk fund and the medium duration fund were chosen. 623 FMPs active as on December 2018 were considered. To begin with, a comparison of debt instruments across the two groups showed broad convergence with corporate debt being by far the dominant investment in both the cases (Table 2.23). 2.78 The ratings distribution of debt instruments for the portfolio of December 2018 (Chart 2.34) shows that in contrast to OEDs, FMPs had a better rating profile of corporate debt investments in terms of the proportion of AAA rated assets. The corporate debt ratings are as on December 31, 2018 and hence do not reflect defaults in FMP schemes. 2.79 However, an analysis of relative issue concentration shows a different picture. For the FMPs, top 5 holdings across schemes form at least 40 per cent of the aggregate corporate debt portfolio, whereas the concentration of both top 5 and top 3 investments with respect to OEDs are lower (Charts 2.35 and 2.36). Plausibly, given that the corpus of FMPs is smaller, diversifying investments into smaller parcels may not be remunerative and hence, on an ex-ante basis, risk management is largely done through credit ratings. While such policies are sensible, as recent events demonstrated, idiosyncratic risks remain. 2.80 Given the concentration issues highlighted in the debt funds as also the important role that credit ratings play in investment decisions, the regulatory framework with regard to rating agencies has important investment implications across financial intermediaries. SEBI recently notified the following specific disclosures regarding a rating action so that the investors are better informed of the underlying rationale for the ratings and are able to take more informed investment decisions: i. Any support from a parent/ group/ government factored into a rating with an expectation of infusion of funds towards timely debt servicing, including the name of such entities, along with the rationale for such expectations. ii. When subsidiaries or group companies are consolidated to arrive at a rating, a list of all such companies along with the extent and rationale of consolidation. iii. A specific section on ‘Liquidity’, highlighting parameters like liquid investments or cash balances, access to unutilised credit lines, liquidity coverage ratio and adequacy of cash flows for servicing maturing debt obligations. CRAs need to also disclose any linkages to external support for meeting near term maturing obligations. 2.81 SEBI has also directed CRAs to review their rating criteria with regard to the assessment of holding companies and subsidiaries in terms of their interlinkages, holding company’s liquidity, financial flexibility and support to the subsidiaries. Further, CRAs have to analyse the deterioration in the issuer’s liquidity conditions and also take into account any asset-liability mismatch. CRAs may also treat sharp deviations in bond spreads of debt instruments vis-à-vis relevant benchmark yields as a material event. 2.82 Further, as directed by SEBI, CRAs need to publish their average one-year rating transition rate over a 5-year period on their respective websites so that investors can understand the historical performance of the ratings assigned by the CRAs. CRAs also need to furnish data on sharp rating actions in the investment grade rating category to stock exchanges and depositories for disclosure on their websites on a half-yearly basis. 2.83 Another risk that has recently manifested itself has been MFs’ exposures to corporates against pledges of promoters’ shares. Box 2.1 discusses recent market developments in this regard. 2.84 The developments in NBFCs/HFCs as also the MF segment imply inherent risks in the underlying business models that highlight implicit trade-offs in yields and liquidity/credit risk. Yet, given the systemic spillovers entailed by the sector, and the importance of non-banking financial intermediation specifically with regard to certain sectors that are traditionally disadvantaged in accessing bank credit, non-banking financial intermediation is more relevant than ever before. As regards the role of mutual funds in credit intermediation, both open and closed ended schemes provide a source of steady demand for fixed coupon long term assets and an opportunity for corporates to diversify sources of debt capital. Most importantly they also provide bespoke liability structures, an important trigger for innovations in fixed income markets apart from matching issuers’ cash flow profiles; for these reasons, they also occasionally encounter liquidity and valuation issues. Hence, it is particularly important to tune the oversight infrastructure to specifically contextualise the trade-offs in the context of the business of a specific firm / fund. This may not completely eliminate the risks but will go a long way in containing the spill overs. Box 2.1: Pledging of shares by promoters of listed companies High level of pledging by promoters is seen as a warning signal, indicating the company’s poor health and probably a situation where the company is unable to access funding through other options. Further, the increased pledging activity is risky for any company as debt repayment will leave no room for the company’s growth. As a general trend, promoters pledge shares when managing existing debt becomes tough for them which eventually leads them to an increased debt trap, which is detrimental for investor interests. In a falling market in particular, pledged shares are under pressure as diminished share prices bring down the collateral value, prompting lenders to either demand additional margins or sell the shares to protect their interests. Either of the actions can have a negative impact on stock prices, thereby eroding the wealth of the investors. Such a movement is of particular concern when increase in the risk of underlying exposure accompanies falling share prices. In effect, debt instruments backed by equity shares have a downside that is akin to that of a short put option on the underlying shares. 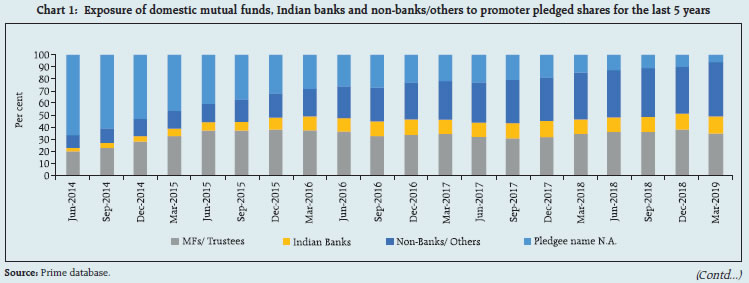 Chart 146 plots the relative evolution of exposures acrossvarious investor groups to promoter pledged shares. Asper chart 1, the reported share of Mutual Funds in totalexposure to promoter pledged shares was around 20 percent in quarters ending June-2014 and September -2014.Since then, it has increased to over 30 per cent but hasremained fairly stable in the later years. However, thereis a significant increase in the reported share of Non-Banks/others over the last 5 years. The reported shareof Non-Banks/others in total promoter pledged sharesis higher than that of Mutual funds for the two latestfinancial years i.e. from June 2017 to March 2019. The reported share of domestic banks in total exposure topromoter pledged shares has also increased over theperiod. The aggregate exposure as on March 2019 stoodat ₹2.25 trillion, marginally lower than that in December2018 at ₹2.34 trillion. SEBI has mandated two kinds of disclosures by listed companies: (i) event-based disclosures, which must be made as and when the shares are pledged and (ii) periodic disclosures along with quarterly filings with stock exchanges. For event-based disclosures, SEBI has made it mandatory for promoters to disclose details of encumbered shares, which includes pledges, lien or any such transaction in line with Regulation 31 of the SEBI (Substantial Acquisition of Shares and Takeovers) Regulations, 2011. For periodic disclosures, SEBI has amended clause 35 of the Listing Agreement, thereby modifying the format for reporting shareholding patterns. Further, it may enable certain threshold-based triggers to enable prompt necessary action on the part of all stakeholders. In addition, SEBI has tightened the operational framework of pledging shares over a period of time. Moreover, overarching investment restrictions including limits for issuer and group exposures by mutual fund schemes are already in place. | Section V Network of the financial system47 2.85 A financial system can be visualised as a network if we consider the financial institutions as nodes and the ‘bilateral exposures’ between them as links joining these nodes. Financial institutions establish links with other financial institutions for efficiency gains and risk diversification, but these same links lead to risk transmission in case of a crisis. 2.86 The total outstanding bilateral exposures48 among the entities in the financial system increased by 15.4 per cent from ₹31.4 trillion in March 2018 to ₹36.3 trillion in March 2019 (Chart 2.37 a). 2.87 As on end-March 2019, SCBs continued to be dominant players accounting for nearly 46.2 per cent of the financial system’s bilateral exposures. In other words, SCBs’ bilateral exposures to all other entities in the financial system (including other SCBs) was 46.2 per cent of the total lending and borrowings in the financial system (Chart 2.37 b). 2.88 Share of asset management companies - mutual funds (AMC-MFs), NBFCs and HFCs – stood at 14.5 per cent, 12.7 per cent and 8.7 per cent respectively as on end-March 2019. The long-term trend has been a declining share of SCBs and an increasing share of AMC-MFs, NBFCs and HFCs. There were fluctuations in this trend in the last three quarters (Chart 2.37 b). 2.89 Share of insurance companies and all-India financial institutions (AIFIs) was nearly unchanged in the range of 8-8.5 per cent each over the last few quarters. In contrast, pension funds’ (PFs) share in total bilateral exposures increased but in absolute terms, it was still quite small at about 1 per cent as on end-March 2019. 2.90 In terms of inter-sectoral49 exposures, AMC-MFs followed by the insurance companies were the biggest fund providers in the system, while NBFCs followed by HFCs and SCBs were the biggest receivers of funds. Within the SCBs, however, PVBs had a net payable position vis-à-vis the entire financial sector, whereas PSBs and FBs had a net receivable position (Chart 2.38). 2.91 AMC-MFs’ net receivables from the financial sector, which had been growing at a significant rate, registered a decline during H1:2018-19, followed by a pick-up during H2:2018-19. In contrast, PSBs’ net receivables registered a significant jump during H1:2018-19 followed by a decline during H2:2018-19. For HFCs, there was a moderation in the growth of their net payables to the financial sector in 2018-19. During the same period, there was a jump in NBFCs’ net payables, largely due to a growth in the payables of big government-owned NBFCs (Chart 2.39). The inter-bank market 2.92 The size of the inter-bank market (fundbased50 and non-fund-based51) has consistently declined over the last few years when considered as a proportion of the banking system’s total assets. During the last year (March 2018 to March 2019), fund-based inter-bank exposures declined from 4.1 per cent to 3.7 per cent of the total bank assets (Chart 2.40). This is generally in line with the global experience wherein due to liquidity coverage ratio (LCR) norms, unsecured inter-bank markets are increasingly being replaced by secured funding lines. However, the rate at which the inter-bank market is shrinking has declined. This is possibly due to banks’ greater alignment with LCR norms with the passage of time. 2.93 PSBs continued to be the biggest player as a group in the inter-bank market with a share of 53.5 per cent (in comparison to a share of 62.5 per cent in the total bank assets) followed by PVBs at 32.7 per cent (share of 30.8 per cent in total bank assets) and FBs at 13.7 per cent (share of only 6.7 per cent in total bank assets) as on end-March 2019 (Chart 2.41). 2.94 As on end-March 2019, 72 per cent of the fund-based inter-bank market was short-term (ST) in nature in which the highest share was of ST deposits followed by ST loans and call money (Call). The composition of long-term (LT) fund based inter-bank exposure shows that LT loans had the highest share followed by LT deposits (Chart 2.42). The inter-bank market: Network structure and connectivity 2.95 The inter-bank market usually has a core-periphery structure. The network structure52 of the banking system53 at March-end 2019 shows that there were five banks in the inner-most core and eight banks in the mid-core. Chart 2.43 depicts the core-periphery structure of the inter-bank market as on end-March 2019. A similar analysis for every quarter over the last five years indicates how inter-connectedness has evolved over time. During the last five years, the number of banks in the inner-most core ranged between two and five. These were usually the biggest PSBs or PVBs. 2.96 Most foreign banks and almost all ‘old’ private banks were usually in the outermost periphery making them the least connected banks in India. The remaining PSBs and PVBs along with a few major FBs made up the mid and outer-cores. 2.97 The degree of interconnectedness in the banking system (SCBs), as measured by the connectivity ratio,54 has been declining slowly over the last few years. This is in line with a shrinking inter-bank market as mentioned earlier. The cluster coefficient,55 which depicts local interconnectedness (that is, the tendency to cluster), remained almost constant in the last five years, registering a mild decline only recently. This indicates that clustering/ grouping within the banking network has not changed much over time (Chart 2.44). Exposure of AMCs-MFs 2.98 AMC-MFs were the largest net providers of funds to the financial system. Their gross receivables were around ₹9,865 billion (around 41 per cent of their average AUM as on March 2019), and their gross payables were around ₹637 billion in March 2019. 2.99 The top 3 recipients of their funds were SCBs followed by NBFCs and HFCs. While their receivables from SCBs (in terms of percentage share) went up, their receivables from NBFCs and HFCs came down in the last few quarters (Chart 2.45 a). 2.100 An instrument-wise break-up of AMC-MFs’ receivables shows that AMC-MFs reduced their CPs and long-term debt led funding of NBFCs and HFCs in favour of certificates of deposit (CDs) and equity led funding of banks (Chart 2.45 b). Exposure of insurance companies 2.101 Insurance companies had gross receivables of ₹5,659 billion and gross payables of around ₹210 billion making them the second largest net providers of funds to the financial system as on end-March 2019. 2.102 Like AMC-MFs, a break-up of their gross receivables indicates that the top 3 recipients of their funds were SCBs followed by NBFCs and HFCs. LT debt and equity accounted for almost all the receivables of the insurance companies, with little exposure to short-term instruments. There was no significant change in the shares of different borrowers and different instruments (Charts 2.46a and b). Exposure to NBFCs 2.103 NBFCs were the largest net borrowers of funds from the financial system with gross payables of around ₹8,446 billion and gross receivables of around ₹723 billion as on end-March 2019. A break-up of gross payables indicates that the highest funds were received from SCBs followed by AMC-MFs and insurance companies. The share of SCBs has been on an increasing trend for the last few quarters (Chart 2.47a). 2.104 The choice of instruments in NBFCs’ funding mix clearly demonstrates the increasing role of LT loans (provided by SCBs and AIFIs) and a declining share of CPs (primarily subscribed to by AMC-MFs and to a lesser extent by SCBs) and LT debt (held by insurance companies and AMC-MFs) (Chart 2.47b). 2.105 A disaggregated look at NBFCs56 indicates that the share of general NBFCs (Loan or investment companies) in total NBFCs’ payables was about 32 per cent. Among specialised NBFCs, the share of NBFCs – infrastructure finance companies (NBFC – IFCs) was the highest at 47 per cent, followed by NBFC – asset finance at 20 per cent. The instrument preference expectedly varied depending on the NBFC type. NBFC - IFCs relied more on LT debt and less on LT loans and commercial paper as compared to other classes of NBFCs (Charts 2.48a and b). Exposure to housing finance companies 2.106 HFCs were the second largest borrowers of funds from the financial system with gross payables of around ₹5,884 billion and gross receivables of only ₹430 billion as on end-March 2019. HFCs’ borrowing patterns were quite similar to that of NBFCs except that AIFIs also played a significant role in providing funds to HFCs. Share of AMC-MFs in providing funding to HFCs came down sharply in the last three quarters. In contrast, the relative share of other groups, particularly SCBs increased significantly (Chart 2.49 a). 2.107 As is the case of NBFCs, LT debt, LT loans and CPs were the top three instruments through which HFCs raised funds from the financial markets, though their funding mix was in a flux in the last six quarters. Reliance on CPs (subscribed to by AMCs and to a lesser extent by SCBs) which had increased considerably in H1:2018-19 saw a sharp fall in H2:2018-19. This was compensated by an increasing share of LT loans (from banks and AIFIs) and LT debt (Chart 2.49 b). The CP and CD Markets: A closer look57 2.108 Among all the short-term instruments through which financial institutions raise funds from each other, CPs and CDs are the most important. In the CP market, AMC-MFs are the biggest investors and HFCs, NBFCs and AIFIs are the biggest issuers. In the CD market, AMC-MFs are the biggest investors and PVBs are by far the biggest issuers, followed by PSBs. In the last two quarters, AMC-MFs reduced their CP exposure and increased their CD exposure considerably (Charts 2.50 and 2.51). Contagion analysis58 Joint solvency59-liquidity60 contagion losses to the banking system due to idiosyncratic bank failure 2.109 A contagion analysis is a network technique used for estimating the systemic importance of different banks. Failure of a bank which is systemically more important leads to greater solvency and liquidity losses to the banking system. Solvency and liquidity losses, in turn, depend on the initial capital and liquidity position of the banks along with the number, nature (whether it is a lender or a borrower) and magnitude of the interconnections that the failing bank has with the rest of the banking system. 2.110 In this analysis, banks are hypothetically triggered to fail one at a time and their impact on the banking system is seen in terms of the number of subsequent bank failures that take place and the amount of solvency and liquidity losses that are incurred (Chart 2.52). 2.111 A contagion analysis of the banking network61 indicates that if a bank with the maximum capacity to cause contagion losses fails (labelled as Bank 1 in Table 2.24), it will lead to a solvency loss of 5.5 per cent of the total Tier 1 capital of the banking system, a liquidity loss of 3 per cent of total liquid assets and the failure of two banks. The losses as on March 2019 were much lower than those in March 2018 (FSR June 2018) due to a better capitalised public-sector banking system (Table 2.24). Table 2.24: Top 5 banks with maximum contagion impact – March 2019
(joint solvency-liquidity contagion) | | Trigger Bank | Solvency Losses as a % of Tier 1 Capital | Liquidity Losses as a % of HQLA | Number of Defaulting banks due to Solvency | Number of Defaulting banks due to Liquidity | Total Number of defaulting banks | | Bank 1 | 5.5 | 3.0 | 2 | 0 | 2 | | Bank 2 | 5.3 | 4.3 | 4 | 0 | 4 | | Bank 3 | 3.8 | 2.9 | 1 | 0 | 1 | | Bank 4 | 3.1 | 4.3 | 1 | 2 | 3 | | Bank 5 | 2.6 | 0.3 | 1 | 0 | 1 | Note: Top 5 ‘trigger banks’ were selected on the basis of solvency losses caused to the banking system.
Source: The Reserve Bank’s Supervisory Returns and staff calculations. | Solvency contagion losses62 to the banking system due to idiosyncratic NBFC/HFC failure 2.112 As noted earlier, NBFCs and HFCs are among the largest borrowers of funds from the financial system. A substantial part of this funding comes from banks. Therefore, failure of any NBFC or HFC will act as a solvency shock to its lenders. The solvency losses caused by these shocks can further spread by contagion. 2.113 We assess the quantum of solvency contagion losses to the banking system caused by the idiosyncratic failure of a stand-alone NBFC63/ HFC. The results are presented in Tables 2.25 and 2.26. Failure of the HFC with the maximum capacity to cause solvency losses to the banking system (labelled as HFC 1) will lead to a loss of 5.8 per cent of the total Tier 1 capital of the banking system and a failure of one bank. Failure of the NBFC with the maximum capacity to cause solvency losses to the banking system (labelled as NBFC 1) will lead to a loss of 2.7 per cent of total Tier 1 capital and a failure of one bank. Solvency contagion losses64 to the banking system due to macroeconomic shocks 2.114 The contagion impact of the failure of a bank is likely to be magnified if macroeconomic shocks result in distress in the banking system in a situation of a generalised downturn in the economy. Macroeconomic shocks are given to the SCBs, which cause some of the SCBs to fail the solvency criterion, which then act as a trigger causing further solvency losses. The initial impact of macroeconomic shocks on individual bank's capital was taken from the macro-stress tests, where a baseline and two (medium and severe) adverse scenarios were considered for March 202065. | Table 2.25: Top 5 HFCs with maximum contagion impact - March 2019 | | Trigger | Solvency losses as a % of total Tier 1 capital of banks | Number of defaulting banks | | HFC - 1 | 5.8 | 1 | | HFC - 2 | 3.1 | 0 | | HFC - 3 | 2.9 | 2 | | HFC - 4 | 2.3 | 1 | | HFC - 5 | 1.5 | 0 | Note: Top 5 ‘trigger HFCs’ were selected on the basis of solvency losses caused to the banking system.
Source: The Reserve Bank’s Supervisory Returns and staff calculations. |
| Table 2.26: Top 5 NBFCs with maximum contagion impact - March 2019 | | Trigger | solvency losses as a % of total Tier 1 capital of banks | Number of defaulting banks | | NBFC - 1 | 2.7 | 1 | | NBFC - 2 | 1.9 | 1 | | NBFC - 3 | 1.8 | 0 | | NBFC - 4 | 1.7 | 0 | | NBFC - 5 | 1.5 | 0 | Note: Top 5 ‘trigger NBFCs’ were selected on the basis of solvency losses caused to the banking system.
Source: The Reserve Bank’s Supervisory Returns and staff calculations. |
2.115 Initial capital loss due to macroeconomic shocks is 8.3 per cent, 12.5 per cent and 17.0 per cent of Tier 1 Capital for baseline, medium and severe stress scenarios, respectively. The number of banks failing due to macroeconomic shocks are 4 for baseline, 6 for medium and 7 for severe stress scenarios. 2.116 The contagion impact overlaid on the outcome of the macro stress test shows that additional solvency losses due to contagion (on top of initial loss of capital due to the macro shocks) to the banking system in terms of Tier 1 capital are limited to 1 per cent for baseline, 1.6 per cent for medium and 2.6 percent for severe stress. Also, the additional number of defaulting banks due to the contagion (excluding initial defaulting banks due to the macro shocks) are one for baseline, one for medium and six for severe stress (Chart 2.53 a & b).
|