Global economic activity continues to face significant headwinds since the second-half of 2018 culminating in global growth forecast placed lower at 3.3 percent in 2019. Adverse geopolitical developments and trade tensions are gradually but predictably taking a toll on business and consumer confidence. In response, advanced economies' (AEs) central banks have eased their monetary policy stance. While asset prices and global capital flows initially recovered in response, the markets appear to be deeply conditioned by the implied ‘Fed put’ and any significant reassessment would require re-rating of a host of issues relating to emerging market and developing economies (EMDEs) with a risk of sharp adjustments. Furthermore, lack of investments in traditional non-renewable energy sources may have implications for oil deficit emerging market (EM) economies like India as renewable sources of energy are inadequate to plug the medium-term demand-supply gap. Domestic economy hit a soft patch in the last quarter of 2018-19 as private consumption, the key driver of Gross Domestic Product (GDP), turned weak. This along with subdued new investment pipeline and a widening current account deficit have exerted pressure on the fiscal front. This has implications for the government’s market borrowing programme and market interest rates. GDP growth is expected to pick up in 2019-20. Reviving private investment demand remains a key challenge going forward while being vigilant about the spillover from global financial markets. Global Backdrop 1.1 The global economic growth is expected to slow down in 2019. In its latest forecast, the International Monetary Fund (IMF)1 has revised global growth for 2019 to 3.3 per cent (Chart 1.1), a 20 basis points (bps) downgrade from its January 2019 projection and a 40 bps downgrade from its October 2018 forecast. Global economic growth is likely to recover in the second half of this year and is projected to be at 3.6 per cent for next year. A sharp downward adjustment has been witnessed with respect to the Euro area where growth projections of major economies like Germany and Italy were slashed by 50 basis points each. The growth projection for the US economy is also lower by 20 basis points at 2.3 per cent, though it posted a robust 3.1 per cent (annualised) growth in Q1:2019. The recent forecast also confirms that China’s growth appears to have bottomed out. The global Purchasing Managers' Index (PMI) (Chart 1.2) however points to a sharp ebbing of activities as it moved to contractionary territory in May 2019. The OECD composite leading indicators also point to softness, while US consumer confidence is holding up following a temporary blip in December 2018 (Chart 1.3). The unemployment rate in the US also witnessed a half a century low in April 2019. Growth in emerging market and developing economies (EMDEs) is expected to moderate from 4.5 per cent in 2018 to 4.4 per cent in 2019 before picking up to 4.8 per cent in 2020. 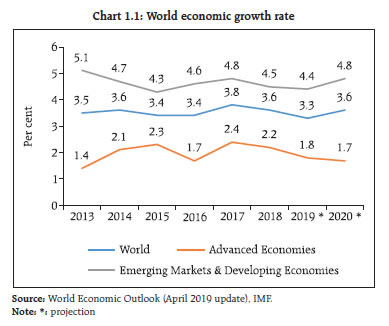 1.2 Financial conditions in the US and the Euro zone are a study in contrast although in both these cases the monetary policy stance has considerably softened since the beginning of the year. The recent loosening in financial conditions (Chart 1.4) in the US is largely driven by the swings in equity markets as also the softening of investment grade credit spreads. In contrast, the subdued short-term economic and inflation outlook in the Euro zone and political uncertainty heralded by the recently concluded European parliamentary elections have prompted market intermediaries to reassess the sovereign risks of some of the not-so-well performing Euro zone economies which, along with the risk of a sovereign-bank doom loop2, has made financial conditions significantly tighter relative to the US. 1.3 The underlying global macro-financial conditions coupled with geopolitical uncertainty have potentially increased spillover risks to EMDEs. These spillover risks are tracked in this report through the following dimensions: -
Implications of central banks’ actions on asset prices; -
Geopolitical risks and trade protectionism; -
Commodity market behaviour; and, -
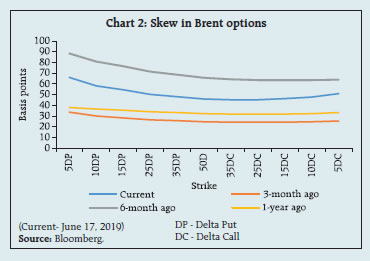
Capital flows. i. Implications of central banks’ actions on asset prices 1.4 Central banks’ actions continue to be the dominant factor affecting the pricing of risky assets thereby influencing capital allocations. Chart 1.5 shows the sharp rise in global equity valuations following the dovish interest rate signalled by the US Federal Reserve (Fed) in January 2019 and further reinforced by the Federal Open Market Committee's (FOMC) meeting on June 18-19 2019, notwithstanding a relative softening in forward earnings’ estimates (Chart 1.6). Sanguine sentiments also prevail in both credit and foreign exchange markets (Charts 1.7 and 1.8). Such largely policy induced reactions of market mechanisms have a potential downside making subsequent adjustments to market realities more sharp and expensive. This could have significant implications for asset prices with attendant spillovers in flows to EMDEs. ii. Geopolitical risks and trade protectionism 1.5 The threat posed by recent trade tensions, both on the Sino-US and EU-US fronts, as also escalation of hostilities in geopolitical hotspots which are key commodity producers, pose near-term risks. The World Economic Outlook (WEO), April 2019 forecasts a more muted world trade volume growth at 3.4 per cent relative to its prior forecast in January 2019. The monthly changes in global trade volume and value (Chart 1.9) also show a synchronous decline in recent months. More relevant from an EMs’ perspective, both their import and export volumes in recent months have declined implying generally subdued demand conditions (Chart 1.10). Such a decline in volumes has been in addition to and despite the weak pricing power of producers globally. iii. Commodity market behaviour 1.6 The bullish analyst outlook of the energy sector for Q3 and Q4 of 2019, driven by global demand expectations as also supply constraints due to geopolitical factors is driving the recent momentum in oil (Chart 1.11 a) although more recently the downside macro-risks arising out of evolving trade conflicts between US and China have dampened the momentum. The Energy Information Administration (EIA) forecasts that US crude oil production will average 12.4 million barrels per day (b/d) in 2019 which is the highest in a decade. This implies a significant acceleration in supply of US crude during Q2-Q4:2019.Understandably the September 2019 Brent options showed no specific trading bias (Chart 1.12). The shape of the futures curve in oil and its implications for future supply is given in Box 1.1. The base metals space, however, continues to bear the effect of both trade tensions as well as lingering uncertainties with respect to the robustness of Chinese demand (Chart 1.11 b). 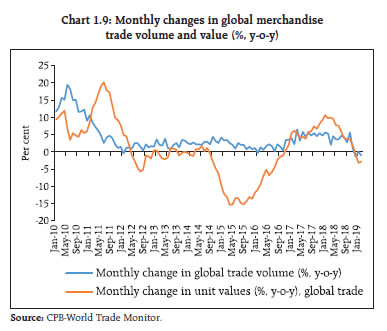 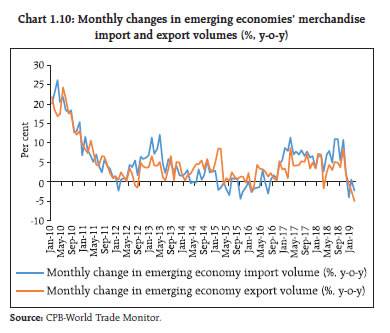 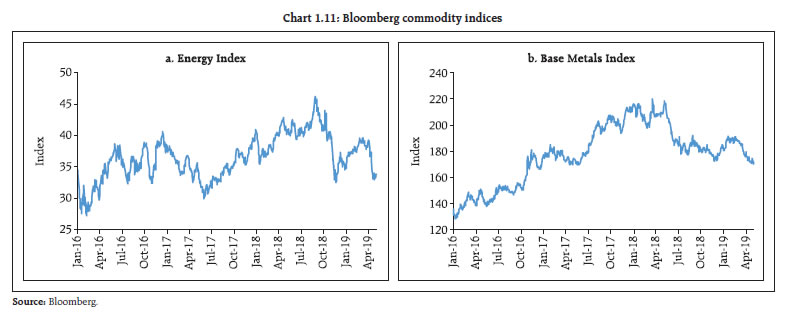 iv. Capital flows 1.7 The re-pricing of risks in the wake of the US Fed’s interest rate repositioning since January 2019 has affected risky credits as well as equity price volatility (Chart 1.13). The re-pricing in the high yield (HY) sector is of particular concern, given the general leveraged position of the US corporate balance sheet (Chart 1.14) although realised default in the US speculative grade is yet to show signs of any significant stress (Chart 1.15). Concurrently, EM investment grade credit has also undergone a re-rating following the Fed’s reassessment, which could impact financial flows to EMs. 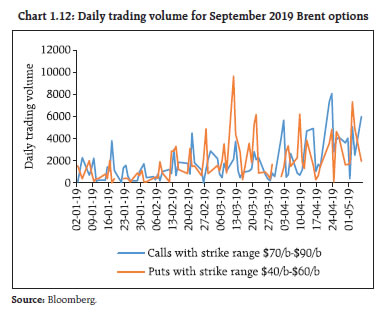 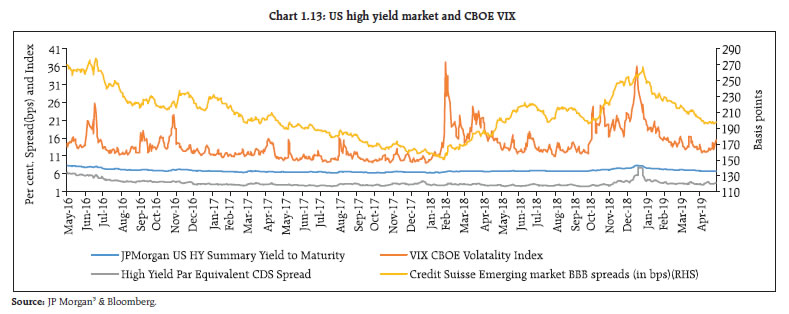 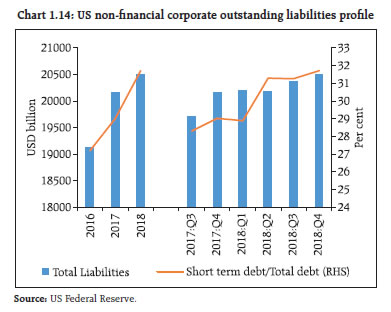 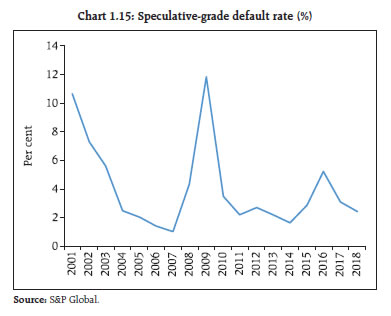 1.8 The recently released BIS global liquidity indicators (as on April 30, 2019) show that the annual growth rate of the US dollar credit to non-bank borrowers residing outside the United States, specifically for emerging market economies slowed further across the board during the last year (Chart 1.16). The aggregate annual growth rate in credit to non-residents (denominated in USD, euro and JPY) at 2 per cent as of end-Q4:2018 was the lowest since the global financial crisis (GFC). Further analysis for EMs shows that while there is a declining trend in terms of growth in bank loans as also in debt securities, the former shows a much sharper decline (Chart 1.17). This may have implications for emerging markets as sizeable emerging market debt is due for a roll over during 2020-22 (Chart 1.18). 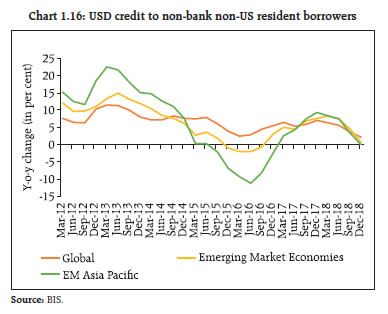 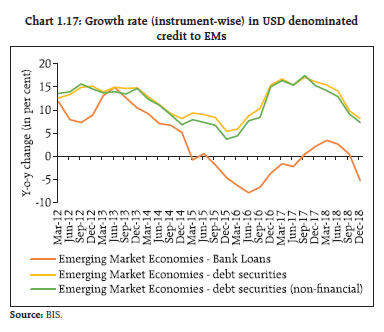  1.9 As regards EM local currency bonds, JP Morgan EM bond portfolio index’s 12 month returns show that the hedged portfolio returns well exceeded the unhedged returns, but were below their local currency counterparts (Chart 1.19). This implies that while EM bond yields have softened, the currency returns, on average, have been mixed. In a significant ‘risk-off’ environment, unwinding of local currency bond portfolios could pose significant risks. The Bloomberg EM carry index (representing eight EM currencies) has bounced off the late 2018 lows implying that the ‘carry’ motivation to invest may potentially re-emerge, although available data indicates that EM hard currency investing is way ahead of investments in local currency bonds. 1.10 Besides, EM currency evolution too has implications for debt flows to EMs. The depreciation in the EM currency index and appreciation in the dollar index is mostly symmetric. However, following the easing of monetary policy stance in the US as well as in the Euro area, the EM currency index has appreciated marginally (Chart 1.20). Meanwhile, consistent with generally weak unhedged USD denominated returns, local currency bond flows to EMs have significantly lagged behind hard currency flows to these markets. 1.11 Overall, the key risk drivers from the EMDEs’ perspective are sudden ebbing of the risk appetite brought in by geopolitics including trade conflicts as also sudden reversals in market expectations due to developments in advanced economies (AEs). Given the current global scenario, the US political and economic policies seems to be the fulcrum of EMDEs’ financial stability with its ‘inflation rate’ as the key risk driver, amidst other random blows that the EMDEs constantly face. The markets appear to be deeply conditioned by the implied ‘Fed put’4 on asset prices and any significant reassessment on their part would potentially require re-rating of a host of EMDE related issues with potentially sharp adjustments. EMDEs with significant current account deficits need to be on guard for spillover risks. 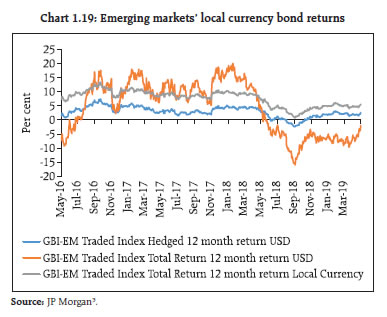 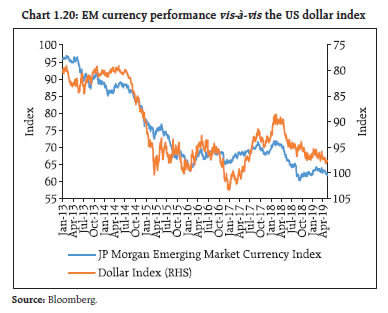 Box 1.1: Oil prices – Future(s) gazing Oil is the single most important commodity in terms of economic impact. Spot oil prices react to demand-supply imbalances. Given the fact that a significant part of this commodity comes from some of the most geopolitically sensitive regions, oil prices are naturally susceptible to idiosyncratic supply shocks. Given the substitution process currently at work between crude oil, natural gas and renewables, how the relative demand for individual commodities pans out is an area of intense economic as well as geopolitical interest that requires an examination of the relative demand for oil in the immediate future as is embedded in the current prices of various instruments. The Brent crude prices have witnessed bouts of volatility with backwardation, that is, the spot price of the commodity is higher than the futures price (Chart 1). Oil price related literature posits that this backwardation is because of relative demand-supply differentials with demand outstripping the supply in the spot oil market. A possible bearish sentiment in underlying oil prices can also be gleaned from studying the skew in Brent options market, with the skew structure being flat to favouring the puts in the periodic snap shots studied (Chart 2). The possible impact of future oil prices embedded in the futures market can be explored by tracking the returns profile of the S&P 500 energy index (Chart 3). The chart shows that the uptick in WTI prices from June 2017 onwards has not led to a corresponding positive movement in the S&P 500 oil & gas equipment & services energy index. Consistent with a somewhat bearish non-renewable energy outlook, oil majors appear to be exploring cheaper, simpler and smaller deep-water drilling projects which are less expensive to execute as compared to the riskier off-shore projects.5 In other words, given the current pitch for replacing non-renewable sources with renewable energy sources, investments in conventional energy production are restrained. 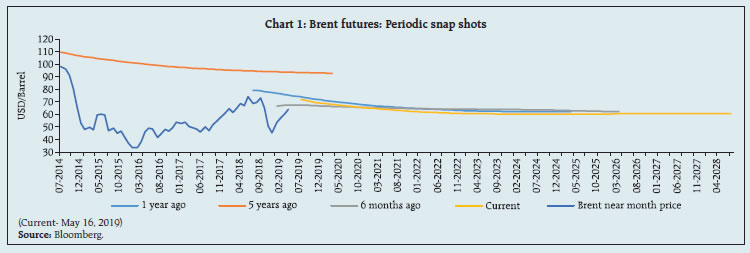
 While the overall trend in energy intensity is declining, middle and low-income countries still have significantly higher energy intensity implying that any significant movements in prices are likely to affect these nation groups’ output disproportionately (Chart 4). For some emerging markets a significant part of the power generation is still sourced from coal based thermal power and replacing it with renewable sources will take time. Even major advance economies seem to be tilting towards conventional energy sources. In order to produce thermal power in an environmentally sustainable manner availability of low ash coal with high calorific value is a pre-requisite. Yet, lack of investment in coal extraction globally, given the current prices may impair the availability of such high-grade raw material.
| Domestic macro-financial developments A. Internal Balance 1.12 Economic activity weakened in the second half of 2018-19, with Q4:2018-19 recording 5.8 per cent growth in GDP, bringing down the annual growth for 2018-19 to 6.8 per cent from the previous year’s 7.2 per cent. The main drivers of GDP – investment and consumption – both turned weak. The gross fixed capital formation (GFCF) and private final consumption expenditure (PFCE) at constant (2011-12) market prices have displayed a lower growth rate of 3.6 per cent and 7.3 per cent respectively in Q4:2018-19 (Chart 1.21). This together with a subdued new investment pipeline (Chart 1.22) and a widening current account deficit (Chart 1.27) have been putting pressure on the fiscal front. However, the Nikkei India Manufacturing Purchasing Managers Index showed an improvement from 51.8 in April 2019 to 52.7 in May 2019 with consumer goods leading the upturn. The CII-IBA Financial Conditions Index rose to 68.1 in Q1:2019-20 compared to 62.9 in Q4:2018-19 owing to expectation of improvement in the overall financial conditions in the economy. Further, as per the Reserve Bank’s Second Bi-monthly Monetary Policy Statement for 2019-20, GDP growth is projected to show gradual improvements from 6.4-6.7 per cent for H1:2019-20 and 7.2-7.5 per cent for H2:2019-20. 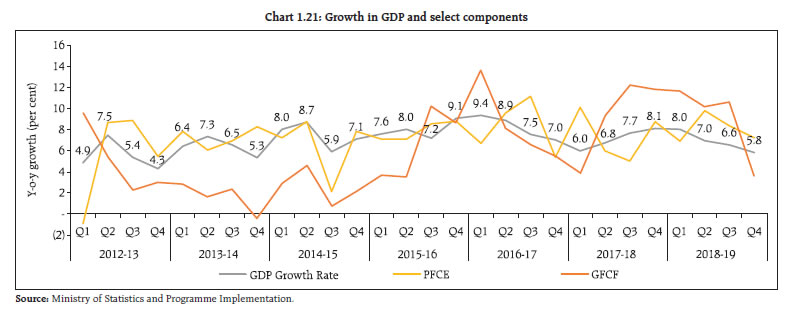 1.13 These developments have implications for the government’s market borrowing programmes. Separately, the state finances are getting expansive as there is an increase in market borrowings (Chart 1.23). To some extent these fiscal pressures are also spilling over to the parastatals. Traditional captive investors in government securities, especially banks, have changed their strategies to focus on state development loans (SDLs) which have the advantage of higher yields and these are increasingly finding their way into their HTM portfolios even as more liquid central government securities are moving elsewhere (Charts 1.24 and 1.25). Even the mutual funds’ fixed-maturity plans (FMPs) are latching on to SDLs prioritizing yield pick up over liquidity (Table 2.23). B. External balance a. Current account 1.14 Export growth was robust during H1:2018-19 but slowed down during H2:2018-19 (Chart 1.26). For the year as a whole, India’s merchandise exports' growth moderated to 8.6 per cent in 2018-19 from 10.0 per cent in the previous year. India’s current account deficit widened to 2.6 per cent of GDP in April-December 2018 from 1.8 per cent a year ago. With global growth and trade projected to slow down further, exports could face challenges in 2019-20. b. Capital account 1.15 During April-December 2018, while net FDI flows were modestly higher, net FPI outflows of USD 10.1 billion were largely a reflection of global risk aversion because of various factors. Nevertheless, net FPI flows turned positive in Q4:2018-19. Among other components of capital flows, net short-term trade credit recorded a sharp decline during April-December 2018 (Chart 1.27). 1.16 FPI flows during the January-March 2019 quarter were the highest in a quarter in two years with equity inflows of USD 4.9 billion in March 2019 alone. Further, FPI investments in hybrid instruments experienced a sharp increase during February-March 2019 with a total inflow of USD 523 million during this period (Chart 1.28 and 1.29). 1.17 A look at valuation of Indian equities shows that they appear to be elevated relative to the other BRIC economies (Chart 1.30). As regards the relative quality of Bloomberg estimated earnings as can be seen through 2017-18 and 2018-19, it appears that the Sensex EPS earnings were generally overestimated during the onset of the financial year and such an overestimation appears to be routinely corrected in the course of the year (Chart 1.31). Such a trend appears to be quite at variance with the MSCI-Asia Pacific earnings’ estimates. Given the already elevated valuation, a gradual normalisation of the global liquidity pool and the realised earnings outlook will play a critical role in sustaining global investor flows. C. Financial markets 1.18 The recent volatility in India VIX was mirrored in foreign exchange (Fx) implied volatility as also in Fx realised volatility. While there is no specific lead and lag relationship between Fx implied volatility and India VIX, all the three market indicators are significantly off their lows in the current calendar year (Chart 1.32). Trends in the residential property market 1.19 Despite higher growth in housing credit by scheduled commercial banks, housing inflation continued to soften in 2018-19 (Chart 1.33). Activity in the housing market, which regained momentum in the first half of 2018, continued to keep pace in the second half of the year. Sales picked up in 2018, mainly displacing unsold inventory in key housing markets (Chart 1.34). Above all, while 2018 witnessed a significant 76 per cent increase in new house launches across Tier 1 cities, 59 per cent of these launches were concentrated in two cities, Mumbai and Pune. Further, dominance of affordable low ticket sized compact homes in new launches coupled with a dip in the house price-to-income ratio across cities which is an indicator of better housing affordability, signals green shoots in the housing market going forward (Chart 1.35). Overall assessment and the systemic risk survey6 1.20 India's financial system remains stable despite some dislocation of late. In the latest systemic risk survey (SRS), participants perceived financial market risks as a high-risk category affecting the financial system while global risks, risk perception on macroeconomic conditions and institutional positions are perceived as medium risks affecting the financial system. About 50 per cent of the respondents feel that the prospects of Indian banking sector are going to improve marginally in the next one year aided by the stabilisation of the process under Insolvency and Bankruptcy Code (IBC) which will also play a key role in improving the confidence in the domestic financial system.
|