While the capital to risk weighted assets ratio (CRAR) of the scheduled commercial banks at 12.8 per cent as of
September 2014 is satisfactory, going forward, the banking sector, particularly the public sector banks (PSBs)
would require substantial capital to meet regulatory requirements with respect to additional capital buffers.
With the increased regulatory focus on segregating the cases of wilful defaults and ensuring the equity
participation of promoter(s) in the losses leading to defaults, there is a need for greater transparency in the
process of carrying out a net economic value impact assessment of large Corporate Debt Restructuring (CDR)
cases. Another aspect that impinges upon the banks’ asset quality is corporate leverage and its impact on banks’
balance sheets, particularly ‘double leveraging’ through holding company structures and the pledging of shares
by promoters.
Indian stock markets have seen a rapid growth in recent months. While the retail investor base still remains
comparatively low, India’s stock markets have been attracting substantial amounts of foreign investments,
increasing the risks of reversal. The Securities and Exchange Board of India (SEBI) has introduced an additional
safety net in the form of core settlement guarantee fund to mitigate risks from possible default in settlement of
trades and to strengthen risk management framework in the domestic capital markets.
With a view to improving participation of actual users / hedgers and the quality of price discovery in the market,
the Forward Markets Commission (FMC) has revised position limits which are linked to estimated production
and imports of the underlying commodities.
To deal with issues relating to unauthorised deposit acceptance and financial frauds, the State Level Coordination
Committee (SLCC) mechanism has been strengthened under the initiative of the Financial Stability and
Development Council (FSDC).
Progress on the global regulatory reforms programme
3.1 The financial sector reform programme,
initiated under the aegis of G20 as a response to the
global financial crisis was primarily aimed at correcting
the weaknesses in financial regulation and supervision
mainly in some advanced jurisdictions that caused or
aggravated the global crisis. A broad agreement has
been arrived at with regard to the contours and design
of most of the proposed regulatory reform measures
(for example, banking capital and liquidity regulations,
‘too-big-to-fail’, shadow banking and OTC derivatives,
among others) and the implementation of these
measures is being taken forward based on clear
principles and timelines.1 The implementation is
being coordinated by the Financial Stability Board (FSB) with active involvement of national regulatory,
supervisory and policymaking authorities and
international standard-setting bodies seeking to make
the global financial system safer, more resilient to
shocks and more efficient in catering to the needs of
the real sector for promoting strong and sustainable
economic growth.
Basel III: Banking capital and liquidity standards
Improvement in capital ratios of international
banks
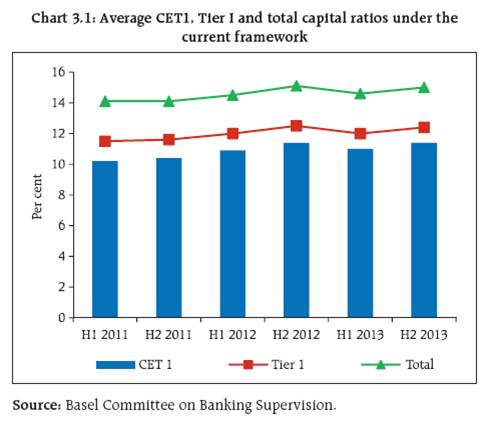
3.2 Regulatory initiatives on banking capital and
liquidity have contributed to the strengthening of
the global banking system. The capital ratios of large
internationally active banks have shown improvement over the last three years.2 The average common equity
Tier I (CET1) capital ratio of these banks rose from
10.2 per cent to about 11.4 per cent of their risk-weighted
assets (RWAs) during the second half of
2013 under the currently applicable regulatory
framework (Chart 3.1). If all the provisions of the
Basel III framework were to be applied on the
December 2013 position, the average CET1 capital
ratio of these banks would fall from 11.4 per cent to
10.2 per cent due to the new definition of eligible
capital under Basel III, deductions that were not
previously applied at the common equity level of
Tier I capital in most countries and increases in RWAs.
The transition, however, is specifically provided for
by Basel III to moderate the immediate impact on
balance sheets.
3.3 As banks adapt themselves to new regulatory
and business realities, the impact on profitability may
raise concerns about their ability to build capital
buffers and meet credit demand. These banks may
require a fundamental overhaul of their business
models, including a combination of re-pricing in
existing business lines, reallocation of capital across
activities or retrenching altogether.
Augmentation of capital: The ‘efficiency-redundancy’
paradigm
3.4 Although the Basel Committee’s global
regulatory standards on bank capital adequacy will
strengthen capital ratios in the long run, they may
also lead to increase in the cost of capital, which in
turn will affect the cost of lending and economic
growth and may force banks into aggressive and
riskier innovations to maintain their return on equity
(RoE). The issue has also created debates over the efficiency-redundancy trade-off involved in extra
capital that banks are mandated to raise. Furthermore,
an improvement in capital ratios per se may not
necessarily lead to improvements in the capacity of
banking institutions and their contribution to
economic development as capital ratios may increase
on account of many factors.
 3.5 Previous Financial Stability Reports (FSRs)
have discussed issues relating to the possibility of
manoeuvring of risk-weights, especially under
internal models-based approaches for different types
of risks under the Basel framework. In order to
strengthen the comparability of implementation
across jurisdictions, the Basel Committee has started
an analysis of the discretions in risk-weight
prescriptions to understand how much they contribute
to unwarranted variations in capital standards. This
has been highlighted by some recent studies3 on the
variation of risk-weighted assets in the banking book
and the trading book. Going forward, some of these discretions may be removed in 2015.4 Further, Basel
Committee is examining prescription of other policy
measures and benchmarks to ensure more consistency
as part of Regulatory Consistency Assessment Process.
3.6 The introduction of a minimum Tier I
leverage ratio of 3 per cent by Basel Committee on
Banking Supervision (BCBS), was aimed at constraining
the build-up of leverage in the banking sector and
reinforcing risk-based capital requirement measures
with a simple and non-risk based ‘backstop’ measure.
The Reserve Bank has prescribed that banks should
strive to achieve a minimum Tier 1 leverage ratio of
4.5 per cent during the parallel run period.
Proposals for tougher capital measures for
addressing ‘too-big-to-fail’
3.7 Policy proposals on the adequacy of loss-absorbing
and recapitalisation capacity of Global
Systemically Important Banks (G-SIBs)5 has been
under consideration in the form of a common
minimum requirement for their ‘gone-concern loss-absorbing
capacity’ (GLAC). In the recently released
set of principles6 for public consultation on the loss-absorbing
capacity of G-SIBs in resolution, FSB has
proposed a single specific minimum Pillar 1 ‘total
loss-absorbing capacity (TLAC)’ requirement to be set
within the range of 16–20 per cent of RWAs under the
condition that the minimum level should be at least
twice the Basel III Tier I leverage ratio requirement.
3.8 The objective of the TLAC requirements is to
ensure that G-SIBs have adequate loss absorbing and recapitalisation capacity necessary to ensure that in
and immediately following a resolution, critical
functions can be continued without tax payers’ funds
or financial stability being put at risk. Implementation
of TLAC and the final calibration of the common Pillar
1 minimum TLAC requirement will take into account
the results of this consultation and the Quantitative
Impact Study and market survey which will be carried
out in early 2015.
3.9 TLAC requirements are not applicable to any
Indian bank as none of them is a G-SIB. However, it
may not be possible to rule out the risk of spill over
impact on emerging market and developing economies
(EMDEs) due to the adverse impact of the TLAC
proposal on G-SIBs.
Assessment of impact of higher capital requirements
3.10 Some studies7 show that, ceteris paribus, if
the ratio of common equity for a given loan is
increased by 2 per cent, banks will require to raise
the lending rate by 40 basis points (bps) in US and
19 bps in Europe, to maintain a level of 12 per cent
RoE. It has been observed that the banks tend to pass
on the increased cost to the lending spread without
any adjustments to other heads of income. Increased
cost of lending might impact the credit off-take from
banking sector.
3.11 Various studies to assess the impact of
implementation of Basel III on growth point towards
the negative impact of higher capital requirements
on GDP.8 Analytical work also shows that Basel III requirements will have spill over effects in the nonbank
financial sector due to shifting of credit to the
non-bank financial sector. A few other studies on the
assessment of the impact of implementation of Basel
III specifically focus on EMDEs.9
Capital levels of Indian banks
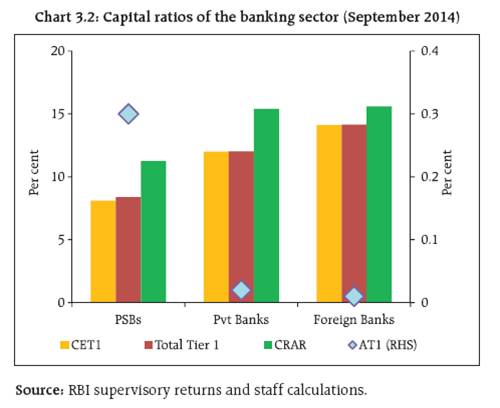
3.12 India has implemented Basel III capital
framework from April 1, 2013. The CRAR for Indian
banks under Basel III as of September 2014 stood at
a satisfactory level of 12.8 per cent (as against 13 per
cent as of March 2014). Banks are expected to remain
under pressure on account of additional requirements
towards the capital conservation buffer, the
countercyclical capital buffer and supervisory capital
under pillar 2 (Chart 3.2). While all bank groups met
the segregated requirements of minimum CET1 and
Tier I capital ratios as at the end of September 2014,
if the additional requirement of 2.5 per cent in the
form of CET1 for meeting the capital conservation
buffer is considered in future, then the capital
requirements, especially of public sector banks
(PSBs), would go up further.
 3.13 Apart from the cost implications of raising
additional capital, banks will face challenges in terms
of depth, liquidity and sufficient appetite in India’s
capital markets for such risk bearing Additional
Tier I (AT1) capital instruments. In the absence of a
wider retail market, few select investor categories
and institutional investors, mainly insurance
companies might end up holding much of the AT1
instruments issued by banks (Chart 3.3). Since such
institutional investors mostly hold such securities
till maturity, feedback for pricing of such instruments
through secondary market trades are conspicuously
absent. In the absence of effective market making,
the banks may have to bear higher costs for issue of
such instruments relative to their international peers.
This issue further underlines the need for
development of a robust non-government debt
market.
3.14 On its part, as owner of the dominant part
of the banking industry, the Government of India
has made capital infusion of `586 billion in PSBs in
the last four years (2011-14) and plans to further
infuse an amount of `112 billion in 2014-15. Capital
infusion has broadly been carried out by way of
preferential allotment of equity by the banks. The
government is planning to bridge this gap by diluting
its stake in some PSBs to 52 per cent to enable banks
to raise capital from the market. Tentative calculations
show that PSBs require significant capital injection
in order to sustain even a moderate 15 per cent
compounded annual growth rate (CAGR) in RWAs.
Market valuations of PSBs and implicit sovereign
guarantee
3.15 Capital raising efforts by PSBs other than the
capital infusion by the government, face challenges
because of their relatively low equity valuations
compared to their private sector peers. The previous
FSR had raised issues about the low valuation of PSBs.
Despite implicit backing from the government, the
low equity valuations are justified by the options
pricing model for valuation of equity. The implicit
sovereign guarantee cannot be treated directly in this
model because if the value of a firm falls below the
face value of debt, then compensation to debtors is
assumed to be made up by the sovereign, but no
compensation will be forthcoming to equity investors.
Hence, the fortunes of equity investors are unaffected
by an implicit sovereign guarantee of debt. The
ultimate improvement in valuations can only come
from commensurate improvements in asset quality,
governance structures and operational efficiency.
Liquidity coverage ratio (LCR) norms
3.16 According to the guidelines issued by the
Reserve Bank on the liquidity coverage ratio (LCR) in
June 2014, banks were permitted to reckon
government securities to the extent allowed by the
Reserve Bank under its Marginal Standing Facility
(MSF) as Level 1 High Quality Liquid Assets (HQLA)
under LCR. Subsequently, banks have been allowed
(with effect from January 1, 2015) to include
government securities held by them up to another 5
per cent of their net demand and time liabilities
(NDTL) within their mandatory Statutory Liquidity
Ratio (SLR) requirement (see Box 3.2 for details). Such
government securities reckoned as HQLAs for the
LCR are to be valued at an amount not greater than
their current market value.11
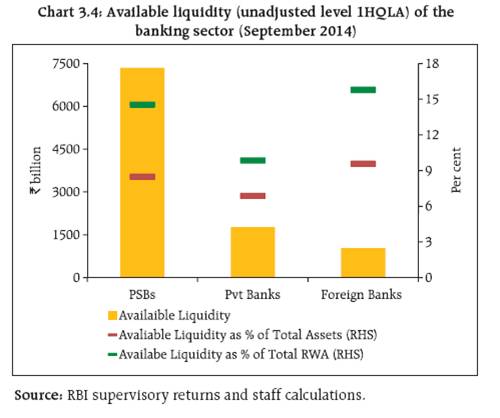
3.17 As of September 2014, the banking sector had
a liquidity buffer, represented by unadjusted level 1
HQLA12, of over `10 trillion which was around 8.2 and
13.5 per cent of total banking sector assets and RWAs
respectively (Chart 3.4). However, since LCR has to be
adopted in each significant currency separately, the
implementation of Basel III LCR norms for the foreign exchange portfolio of Indian banks may have
profound implications for the way the business is
being conducted hitherto. Currently, the foreign
exchange business model for Indian banks involves
running negative gaps (the duration of assets longer
than that of liabilities), with negligible foreign
currency HQLA backing. Moreover, overseas branches
being the major source of foreign exchange liabilities
may themselves be subject to host country liquidity
regulations, including implementation of Basel III
norms on a location by location basis (i.e. gross) and
not aggregate (i.e. net) basis, which may be further
adding to cost. After negative carry in prospective
HQLA in major currencies are taken into account, the
profitability of overseas operations as well as foreign
exchange book of major banks is likely to be materially
affected. The issue requires careful cost benefit
analysis of maintaining overseas operations of Indian
banks as well as an appropriate strategy to deal with
emerging liquidity regulations.
 Shadow banking
3.18 The role of the ‘shadow banking system’,
defined as ‘credit intermediation involving entities
and activities outside the regular banking system’, as
a source of systemic risk was an important learning
outcome of the global financial crisis. Its importance
stemmed not only from its direct role in supplying
credit or liquidity to the economy but also due to its
interconnectedness with the more closely regulated
banking system.
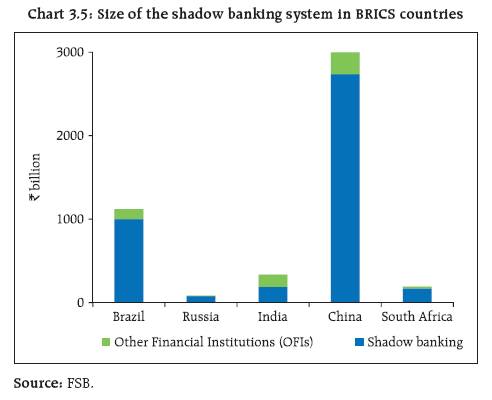
3.19 According to the FSB methodology and
classification, the size of the shadow banking sector
in India is estimated to be around USD 190 billion,
which is the 15th largest in the world. Among the
BRICS, India has the third largest shadow banking
sector (Chart 3.5).
Regulation of non-banking finance companies
3.20 The G20/FSB led reform proposals initiated
in this regard were aimed at developing appropriate
monitoring and regulatory frameworks to mitigate
the potential build-up of risks in and through the shadow banking system. The FSB approach was based
on first capturing the data and information with
respect to all kinds of non-bank credit intermediation
and then concentrating on the areas of non-bank
credit intermediation where maturity/liquidity
transformation and/or flawed credit risk transfer and/
or leverage could potentially create important
systemic risks. In the Indian financial system what
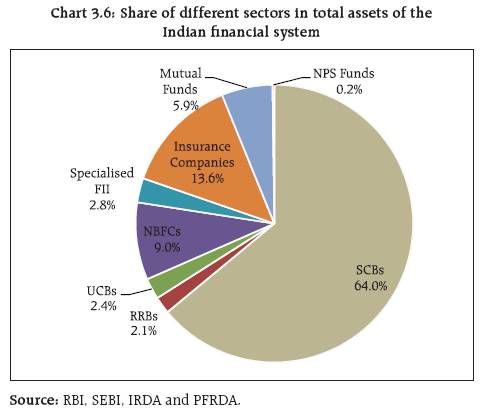
has been reckoned as shadow banking by the FSB are
predominantly non-banking financial companies
(NBFCs), which have been under prudential
regulation for a long time and account for a relatively
small share of the total assets of the Indian financial
system (Chart 3.6).
 3.21 However, given the significant
interconnectedness of NBFCs with the rest of the
financial system, especially banks (Table 3.1) they
could impact banks under conditions of stress and
may face difficulties if banks show reluctance to lend
to them in case of a liquidity crunch.
3.22 Considering these aspects, regulations for
NBFCs have been tightened (Box 3.1). Furthermore,
efforts were also made to assess the size and profile
of actual shadow banking entities. From a preliminary
reconciliation of the database of the Ministry of Corporate Affairs (MCA), Government of India, on
companies registered under the Companies Act, 1956
and classified under ‘Financial Intermediation, except
Insurance and Pension Funding’ and ‘Activities
auxiliary to Financial intermediation’, it is observed
that many of these companies though not registered
with the Reserve Bank might be carrying on (nonbanking)
financial activities. Financial statements of
many such companies reveal that a significant
number of them could be termed as NBFCs as per the
Principal Business Criteria (PBC) specified by the
Reserve Bank. Such companies include a small
number of deposit taking companies and also
companies whose applications for registration were
cancelled by the Reserve Bank on various grounds.
Table 3.1: Exposure of banks, AMCs and insurance
companies to top NBFCs13 |
(` billion) |
Mar
2012 |
Mar
2013 |
Mar
2014 |
Sep
2014 |
Banks |
1513 |
1453 |
2919 |
1495 |
AMCs |
83 |
624 |
756 |
912 |
Insurance Companies |
780 |
880 |
965 |
1023 |
Source: RBI supervisory returns and staff calculations. |
Box 3.1: Salient Features of Revised Regulatory Framework for NBFCs
i) The minimum Net Owned Fund (NOF) criterion for
existing NBFCs (those registered prior to April 1999)
has been increased to `20 million. NBFCs have been
allowed till March 2017 to achieve the required
minimum levels.
ii) In order to harmonise and strengthen deposit
acceptance regulations across all deposit taking
NBFCs (NBFCs-D) credit rating has been made
compulsory for existing unrated asset finance
companies (AFCs) by March 31, 2016. Maximum
limit for acceptance of deposits has been harmonised
across the sector to 1.5 times of NOF.
iii) In view of the overall increase in the growth of the
NBFC sector, the threshold for defining systemic
significance for non-deposit taking NBFCs has been
revised to `5 billion from the existing limit of `1
billion. Non-deposit taking NBFCs shall henceforth
be categorised into two broad categories: NBFCs-ND
(those with assets less than `5 billion) and NBFCs-
ND-SI (those with assets of `5 billion and above –
deemed as systemically important) and regulations
will be applied accordingly. NBFCs-ND will be
exempt from capital adequacy and credit
concentration norms while a leverage ratio of 7 has
been introduced for them.
iv) For NBFCs-ND-SI and all NBFCs-D categories, tighter
prudential norms have been prescribed - minimum Tier I capital requirement raised to 10 per cent (from
earlier 7 per cent in a phased manner by end of
March 2017), asset classification norms (from 180
days to 90 days in a phased manner by the end of
March 2018) in line with that of banks and increase
in provisioning requirement for standard assets to
0.40 per cent in a phased manner by March 2018.
Exemption provided to AFCs from the prescribed
credit concentration norms of 5 per cent has been
withdrawn with immediate effect. Additional
corporate governance standards and disclosure
norms for NBFCs have been issued for NBFCs-D and
NBFCs-ND.
v) NBFCs with assets of less than `5 billion shall not
be subjected to prudential norms if they are not
accessing public funds and those not having
customer interface will not be subjected to conduct
of business regulations.
vi) Assets of multiple NBFCs in a group shall be
aggregated to determine if such consolidation falls
within the asset sizes of the two categories.
Regulations as applicable to the two categories will
be applicable to each of the NBFC-ND within the
group. Reporting regime has been rationalised with
only an annual return prescribed for NBFCs of assets
size less than `5 billion.
3.23 A preliminary exercise to map the universe
of ‘finance’ companies currently not registered with
the Reserve Bank shows that the relative proportion
of the segment of un-registered companies in terms
of asset size may be much lower than companies
under Reserve Bank’s regulation. Thus, a large
number of small companies populating the NBFC
sector do not appear to be posing a major risk to
systemic stability (Table 3.2). Nonetheless, they give
rise to issues with regard to consumer protection as
well as reputational risks for the regulator. In this
regard the State Level Coordination Committee
(SLCC)14 mechanism has been strengthened under
the initiative of the Financial Stability and
Development Council (FSDC) to improve surveillance and deal with issues such as unauthorised deposit
acceptance and financial frauds.
Need to bring government owned NBFCs under
prudential regulations
3.24 In addition to NBFCs in the private sector,
there are some (central and state) government owned
finance companies (not being banks) registered with
the Reserve Bank as NBFCs, which account for
significant proportion of the total assets and business
of the NBFC sector. Government owned NBFCs hold
37 per cent of the assets of the entire NBFC sector
but are exempt, at present, from certain regulatory
prudential norms of the Reserve Bank. These NBFCs
are highly leveraged with a leverage ratio of 6.4
(leverage of state government owned NBFCs at 8.8
and central government owned NBFCs at 6.2) as
compared to 3.3 for the entire sector. Their aggregate
outside liabilities are around `3.8 trillion of which
`385 billion are in the form of bank borrowings.
3.25 While these NBFCs have been playing a useful
role in financing certain critical infrastructure sectors,
and certain degree of forbearance might have been
warranted in the initial stages, there is a need to bring
all deposit taking and systemically important
government owned companies under the prudential
regulatory framework as applicable to other NBFCs,
especially in view of the rationalisation of regulations
(and where necessary, alignment with banking sector
regulations).
Table 3.2: Size-wise distribution of NBFCs registered with the Reserve Bank |
Assets size category (in `) |
Number of companies |
Total Assets size
(in ` billion) |
Proportion of Number of
Companies (%) |
Proportion of
Total Asset Size (%) |
Above 1 billion |
454 |
11621 |
3.8 |
89.6 |
500 Million to 1 billion* |
686 |
490 |
5.7 |
3.8 |
Up to 500 million |
9555 |
854 |
79.4 |
6.6 |
Data not available |
1334 |
NA |
11.1 |
|
* Data pertains to 384 reporting companies |
Indian banking sector’s health and asset quality:
Focus on PSBs
Regulatory forbearance
3.26 The extent of restructured assets in the
banking sector, especially PSBs, is a cause of serious
concern (see Chapter II for details). The relatively
higher possibility of slippages in restructured
standard advances is required to be factored in by
banks from the capital adequacy perspective. Even
in ‘business as usual’ conditions (as against ‘stressed
conditions’), any restructured advance which would
be generally categorised by a rating agency as a sub-investment
grade, carries much higher probability of
turning into non-performing asset (NPA) than a
standard asset. Since banks, traditionally have been
short term working capital providers, their
appreciation of idiosyncratic risks in infrastructure
projects seems to have been inadequate. Hence, the
appraisals of most of the project loans have been the
prerogative of a handful of merchant banks. However,
since the compensation of merchant banks is linked
to closure of funding and the decision to fund the
respective projects still rests with the banks, it is
necessary that the banks strive for a more detailed
understanding of the risk-return profile of the
underlying projects before committing funds,
whenever project appraisal is outsourced.
3.27 While it may be somewhat legitimate to
justify regulatory forbearance in times of major
crises, forbearance for extended periods and as a
cover to compensate for lenders/borrowers’
inadequacies engenders moral hazard. Furthermore,
going forward, with the initiation of risk based
supervision as well as implementation of Basel II
advanced norms for credit, accounting discretions
such as restructuring will have no impact on capital
requirements since such processes incorporate
capital provisioning based on expected losses , (i.e.
internal rating based approach for credit risk under
Basel II or the Risk Based Supervision model initiated
by the Reserve Bank) and would largely align regulatory capital with economic capital rendering
discretionary accounting forbearance of little
consequence. Hence, an early end to regulatory
forbearance may be the right step. In addition,
governance reforms along the lines suggested by the
P.J. Nayak Committee will build in inherent checks
and balances on the risks and returns of the credit
portfolio thereby leading to more informed risk
taking.
Reduction in cases referred under CDR in the last
six months
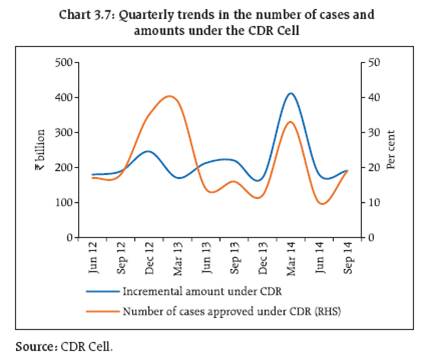
3.28 Out of the total number of cases referred to/
approved under CDR, 49 per cent have been
successfully implemented till date. Further, it is
observed that the number of cases referred to the
CDR cell has come down in the recent past
(Chart 3.7). One of the reasons for this reduction
could be the Reserve Bank’s move to allow banks to
restructure their large credits with aggregate exposure
(AE) of `1 billion and above outside CDR under the
Joint Lenders’ Forum (JLF) constituted under the
provisions of the ‘Framework to Revitalise the
Distressed Assets in the Economy’ which became
effective from April 1, 2014. (Box 3.2).
 3.29 There is also a need to review and strengthen
the accountability mechanism in the entire process
of reference, approval and implementation or exit
under CDR. Adequate disclosures on the eventual
cost-benefit profile of approved CDR cases (for
successful as well as failed cases) will help in forming
policy and aid proper use of scarce resources. With
increased regulatory focus on segregating cases of
wilful defaults and ensuring adequate equity
participation of promoter(s) in the losses leading to
defaults, there is a need for greater transparency in
carrying out a net economic value impact assessment
and audit of big ticket CDR cases.
Corporate leverage
3.30 A related issue that impinges on the banks’
asset quality is the understanding of corporate
leverage and assessment of the impact on banks’
balance sheets. A report of the International
Monetary Fund (IMF) has flagged that trends in
corporate leverage ratios in emerging Asia (including
India) represented a ‘fault line’, with the potential
to amplify shocks as global liquidity conditions
tighten, interest rates rise and growth slows.15 In the
Indian context, various reports on indebtedness
among Indian companies (and business groups at the
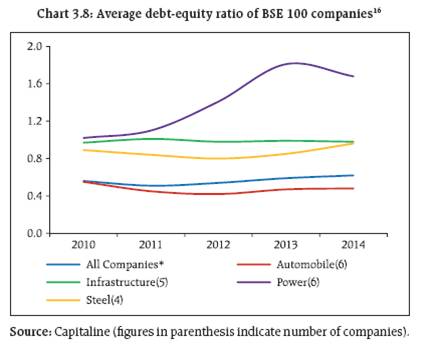
aggregate level) have pointed towards increasing
corporate leverage (debt-to-equity) ratios, though the
Indian scenario is somewhat different with many
cash rich companies coexisting with debt ridden
companies (Chart 3.8). The euphoria during the
boom period might have driven many Indian
companies towards huge expansion/acquisition
programmes. For many such companies the slowdown
in the post-global financial crisis has been a shock
and there is some evidence that several of them are
on the path of deleveraging and the debt equity ratios
of many corporates seem to be stabilising, if not
tapering.
3.31 With renewed focus on speedy regulatory
clearances for projects and their implementation, the
profitability of corporate entities is expected to
improve once the stalled projects reach the stage of
commercial operations, thus also helping the cause
of the asset quality of the banking system.
Simultaneously, it may be pertinent to examine the
implications of certain corporate practices in India
relating to multi-layered structures and pledging of
shares by promoters which will improve an assessment
of vulnerabilities and the remedies thereof while
helping redefine regulatory and supervisory responses.
Effective leverage under holding company/SPV
structures
3.32 While the holding company structure has
evolved primarily to consolidate a group’s holdings
in various companies/projects, concerns emanate
when such holding companies start acting as
operating entities. The evolution of special purpose
vehicles (SPVs) may also be associated with the need
to reduce bankruptcy costs (and hence risks to
lenders). A practice popularly known as ‘double
leveraging’ has been prevalent, especially in the
infrastructure space since companies that undertake mega projects need not raise a lot of resources while
satisfying their equity contributions. In a typical
double leveraging, a holding company raises debt on
its balance sheet and infuses it as equity in SPVs.
From the lenders’ perspective, a debt-to-equity ratio
of 2:1 at the holding company level could transform
into a leverage of 8:1 at the SPV level. While there
could be some merit in such practices, risk assessments
by banks need to capture this effectively.
 Implications of pledging of shares by promoters
3.33 The December 2013 FSR raised certain
concerns over pledging of shares by promoters. This
report examines the issue further from the lenders’
perspective. A majority of Indian companies are
family owned/controlled, as substantial levels of
promoter shareholding are concentrated within the
family hold (Table 3.3). The promoter shares can be
significant collateral for a typical company if it wants
to expand leverage. Pledging of shares is practiced in
other advanced economies too, but it has taken a
significantly different form in India.17 In the case of
a typical Indian company, the promoters pledge
shares not for funding ‘outside’ business ventures
but for the company itself. By pledging shares, the
promoters have no personal liability other than to
the extent of their pledged shares. In some instances
the shares pledged by unscrupulous promoters could
go down in value and the promoters may not mind
losing control of the company as there is a possibility
of diversion of funds before the share prices
collapse.18 While a lender has the option of selling
the shares when prices fall and hit a point that can
be called a default event, this can still have impact
on minority shareholders through market impact
costs, as with the invoking of the pledge, the pledged
shares will have to be sold immediately.
Table: 3.3: Industry-wise position on proportion of promoters’ pledged shares (as of March 2014) |
(in per cent) |
Sector |
Indian
Promoters |
Foreign
Promoters |
Total
Promoters’
Holding |
Promoters'
Ownership
Pledged |
Banks |
49.0 |
0.7 |
49.7 |
0.1 |
Engineering |
35.8 |
0.5 |
36.3 |
11.2 |
Financial Services |
47.4 |
1.1 |
48.4 |
7.6 |
FMCG |
27.9 |
3.2 |
31.1 |
11.7 |
Infrastructure |
69.8 |
1.1 |
70.9 |
14.7 |
Information Technology |
43.0 |
4.9 |
47.9 |
11.2 |
Manufacturing |
50.5 |
7.0 |
57.5 |
18.1 |
Media and Entertainment |
44.3 |
5.2 |
49.4 |
24.9 |
Petrochemicals |
54.8 |
5.3 |
60.1 |
8.7 |
Pharmaceuticals |
47.1 |
6.0 |
53.1 |
5.4 |
Services |
46.3 |
9.7 |
56.1 |
25.5 |
Telecommunication |
51.4 |
5.8 |
57.3 |
12.8 |
Miscellaneous |
53.1 |
2.8 |
55.9 |
12.6 |
Total |
51.6 |
4.7 |
56.3 |
14.2 |
Source: National Stock Exchange. |
3.34 In view of the prevalence of promoters
pledging a substantial portion of their shares, the
resultant leverage could be a concern not only for
shareholders but also for the health of the financial
system. This issue calls for a closer examination,
especially in the current scenario of buoyancy in stock
prices wherein the collateral in the form of pledged
shares may appear to justify higher leverage. In this
regard, the fundamental question is one related to
implications from a company’s perspective of the
practice wherein a company’s own shares can be
pledged to raise debt on its balance sheet.
Move towards a diversified banking system in India
3.35 The final guidelines for setting up ‘Payments
Banks’19 and ‘Small Finance Banks’20 have been issued on November 27, 2014. The primary objective of setting
up these differentiated banks will be to further increase
financial inclusion. The payments banks target at
providing small savings accounts and payments/
remittance services to the migrant labour workforce,
low income households and small businesses by
enabling high volume-low value transactions in deposits
and payments/remittance services in a secured
technology-driven environment. On the other hand, the
small finance banks shall help in provision of savings
vehicles primarily to unserved and underserved sections
of the population and supply of credit to small business
units, small and marginal farmers, micro and small
industries, and other unorganised sector entities,
through ‘high technology-low cost’ operations.
3.36 While a small finance bank will engage in
basic lending activities, a payments bank will be
limited to only accepting deposits up to a maximum
of `100,000 per individual customer. Further, the
small finance banks could also undertake other non-risk
sharing simple financial services such as
distribution of mutual fund units and insurance and
pension products. They can also become category II
authorised dealers in the foreign exchange business
for clients’ requirements. The scope of activities for
payment banks on the other hand will require them
to maintain a minimum 75 per cent of demand
deposit balances in SLR securities with a maturity up
to one year, besides maintaining Cash Reserve Ratio
(CRR) requirements. They will be allowed to deposit
a maximum of 25 per cent in other SCBs for
operational purposes and liquidity management.
Asset reconstruction companies (ARCs)
3.37 In view of sudden spurt in sale of NPAs by
banks (mainly the PSBs facing asset quality pressures)
to ARCs during recent quarters, the previous FSR had
highlighted certain aspects related to the functioning
of ARCs and the need for a review of the regulatory
framework for the sector. A well capitalised and efficient ARC sector may play an important role in
the coming years in reconstruction and resolution of
stressed assets. There are 14 ARCs currently
functioning in India, out of which two have majority
ownership by public sector institutions, six have
shareholding which is a mix of the public and private
sectors (including foreign institutions), while the
remaining six are fully owned by the private sector.
Indian banks, both public sector and privately owned,
have a significant level of ownership stake in ARCs.
With further opening up of the economy, it is
expected that the ARC sector will attract substantial
fresh foreign investments.21
Impact of changes in regulatory norms
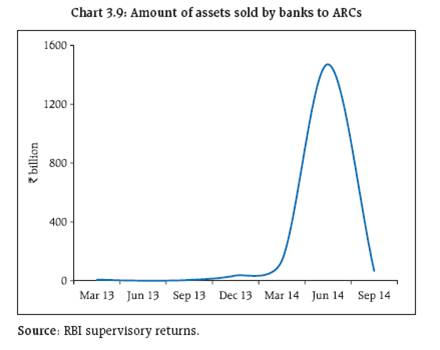
3.38 ARCs have witnessed very high growth in
recent times riding on the business opportunities
arising out of a high level of NPAs in the banking
sector. The fourth quarter of the previous financial
year (2013-14) and the first quarter of 2014-15 saw a
surge in their asset acquisition, with a number of
transactions being closed at aggressive prices. The
quarter ended September 30, 2014 however,
witnessed a sharp decline in acquisition (Chart 3.9).
 3.39 The fall in asset acquisition by ARCs during
the last quarter may have been partly due to the
revised regulations introduced by the Reserve Bank
in August 2014. The revision of regulations enhanced
‘skin in the game’ for ARCs by mandating increased
investment in security receipts (SRs) from 5 per cent
to 15 per cent, linking the calculation of management
fee with the net asset value (NAV) of SRs rather than
the outstanding SRs issued as hitherto. The rationale
behind these regulatory changes was to incentivise
realisation and thereby expediting the process of
recoveries/restructuring as NAV of SRs is calculated
on the basis of the likely rate of recovery of stressed
assets. With the regulatory changes effected in August
2014, ARCs will need to focus on actual redeeming
of security receipts as it is no longer possible for them
to base their profit model on the basis of management
fees (details in Box 3.2). In the near term, ARCs may
find it difficult to align their pricing to the expectations
of the selling banks and the selling banks also may not have yet reconciled to a realistic sale price
expectation for the assets that they want to offload,
resulting in the reduction in sales during the second
quarter ended September 2014.
3.40 Some other regulatory measures introduced
in the guidelines for ARCs, inter alia, are greater
disclosures on the part of ARCs, membership in the
Joint Lenders’ Forum (JLF) in order to participate in
a corrective action plan for restructuring stressed
assets, lowering the threshold level to enforce the
Securitisation and Reconstruction of Financial Assets
and Enforcement of Security Interest (SARFAESI) Act,
providing more time to ARCs to conduct due diligence
on stressed assets on the auction block, a shorter
period for valuation of SRs and a shorter planning
period for reconstruction. It is expected that a greater
degree of transparency in the sector will support its
long term sustainability as an effective institutional
response to controlling NPAs.
Box 3.2: Important Regulatory and Supervisory Measures
Dealing with domestic systemically important banks
(D-SIBs): Based on the internationally agreed reform
measures, the framework for dealing with D-SIBs in
India was issued in July 2014. The assessment
methodology incorporates major indicator categories:
size, interconnectedness, substitutability and
complexity. Based on their systemic importance scores
in ascending order, banks are slotted into four different
buckets and will be required to have additional CET1
capital ranging from 0.20 per cent to 0.80 per cent of
risk-weighted assets depending on the bucket that they
are slotted into. The computation of systemic importance
scores will be carried out at yearly intervals and the
banks classified as D-SIBs will be disclosed in August
every year starting from 2015.
Capital and provisioning requirements for bank
exposures to entities with unhedged foreign currency
exposure: Corporates’ unhedged foreign currency
exposures have been an area of concern not only for
individual corporates but also for the financial system as
a whole. The final guidelines, issued in January 2014, provide a methodology to be adopted by banks to
compute incremental provisioning and capital
requirements. More specifically, the incremental
provisioning requirements are to be calculated as per
the ratio of likely loss due to foreign exchange movement
to a company’s earnings and depreciation and
incremental capital will need to be provided accordingly.
It is expected that these measures will incentivise
corporates to hedge their foreign currency exposure and
also enable banks to develop capabilities to measure
and manage currency-induced risks.
Capital requirements for bank exposures to Central
Counterparties (CCPs): In order to promote central
clearing through well managed CCPs, in January 2014
banks were advised that their clearing exposure to a
Qualifying CCP (QCCP) would be kept outside of the
exposure ceiling of 15 per cent of its capital funds
applicable to a single counterparty. Other exposures to
QCCPs such as loans, credit lines, investments in the
capital of CCP, liquidity facilities, etc. will continue to be within the existing exposure ceiling of 15 per cent of
capital funds to a single counterparty. However, all
exposures of a bank to a non-QCCP should be within
this exposure ceiling of 15 per cent.
Countercyclical capital buffer: Taking into consideration
the evolution of the Indian economy and other relevant
factors including the BCBS document on this aspect, a
countercyclical capital buffer (CCB) was prescribed for
banks that in addition to their private sector lending,
takes into account other relevant factors such as the
incremental C-D ratio for a moving period of three years
(along with its correlation with the credit-to-GDP gap
and GNPA growth), the industry outlook assessment
index (along with its correlation with GNPA growth) and
interest coverage ratio (along with its correlation with
the credit-to-GDP gap). Decisions on CCB may be preannounced
with a lead time of four quarters. The lower
threshold (L) where the CCB is activated was
recommended at 3 percentage points of the credit-to-
GDP gap, provided its relationship with GNPA remains
significant and the upper threshold (H) where the CCB
is at its maximum was stipulated at 15 percentage
points of the credit-to-GDP gap.
Revitalising distressed assets: A framework for
revitalising distressed assets in the economy was
operationalised by the Reserve Bank with effect from
January 2014. In essence, the framework outlines a
corrective action plan that will incentivise an early
identification of problem accounts which are considered
viable and their timely restructuring and taking prompt
steps for recovery or sale of unviable accounts. The
salient features of the framework include: a) A Central
Repository of Information on Large Credits (CRILC) has
been set up to collect, store and disseminate credit data
with respect to borrowers having aggregate fund-based
and non-fund based exposure of `50 million and above,
b) All commercial banks are required to mandatorily
report their credit information on their borrowers/
customers, c) NBFC-ND-SI, NBFCs-D and all NBFC-factors
(notified NBFCs, for short) are also required to furnish
such information, d) Banks were advised to furnish
details of all current accounts with outstanding balance
(debit or credit) of `10 million and above, and e) Banks
are required to monitor stress in borrowal accounts
through three categories of special mention accounts
(SMAs).
Liquidity Coverage Ratio (LCR): Taking into account
the final guidelines issued by BCBS, the Reserve Bank
issued its final guidelines on LCR, Liquidity Risk
Monitoring Tools and LCR Disclosure Standards’ in June
2014, keeping in view country-specific considerations as
well. Therefore, besides the usual phase-in arrangements
and definitional aspects, the guidelines by the Reserve
Bank also consider the range of high quality liquid assets
(HQLAs) available in Indian financial markets and their
liquidity features. As a result, investment in government
securities to the extent of 2 per cent of NDTL was
allowed to be included as level 1 HQLAs. Subsequently,
banks have now (with effect from January 1, 2015) been
permitted to reckon government securities held by
them up to another 5 per cent of their NDTL within the
mandatory SLR requirement as level 1 HQLAs. Further,
eligible common equity shares with 50 per cent haircut
have been allowed to be included as level 2B HQLAs.
Liquidity risk monitoring tools have also been suitably
prescribed in RBI’s standards. Accordingly, four
additional returns have been prescribed for banks: the
LCR, LCR by significant currencies, available
unencumbered assets, funding concentration and other
information on liquidity by banks.
Sale of NPAs to Asset Reconstruction Companies
(ARCs): In February 2014, as part of the Framework for
Revitalising Distressed Assets in the Economy, banks
have been allowed to: a) Reverse excess provision on
sale of NPAs to profit and loss account to the extent of
cash received on account of sale of NPAs is more than
the net book value of the NPAs, b) Amortise the loss on
sale of NPAs to ARCs where the sale consideration is
less than net book value (with regard to NPAs sold up to
March 31, 2015) over a period of two years, c) Sell
financial assets to Securitisation/Reconstruction
Companies (SCs/RCs) which are reported as SMA-2 by
the bank/FI to CRILC, and d) Use countercyclical/
floating provisions for meeting any shortfall on sale of
NPAs (i.e., when the sale is at a price below the net
book value). These measures are aimed at incentivising
banks to sell their NPAs to SCs/RCs, who in turn are
expected to act as a supportive system for stressed
asset management with greater emphasis on asset
reconstruction.
Depositor Education and Awareness (DEA) Fund
Scheme, 2014: Pursuant to the enactment of the
Banking Laws (Amendment) Act, 2012, a separate
section has been inserted in the Banking Regulation Act,
1949 relating to the Depositor Education and Awareness
(DEA) Fund. As per the scheme, which is applicable to
all commercial and co-operative banks in the country,
the amounts to be credited to the DEA Fund shall be the
credit balance in any deposit account maintained with a
bank which has not been operated for ten years or more,
or any amount remaining unclaimed for ten years or
more. The bank shall calculate the cumulative balances
in all such accounts, as on the day prior to the effective
date and transfer the amount to the DEA Fund on the
last working day of subsequent month along with the
accrued interest. The DEA Fund will be utilised for
promoting depositors’ interest and for such other
purposes which may be necessary for promoting
depositors’ interests as specified by the Reserve Bank
from time to time.
Draft guidelines for differentiated bank licences: The
final guidelines on payments banks and small banks
have been issued by the Reserve Bank (paragraphs 3.35
and 3.36).
Developments in cross-border supervision:
-
Basel core principles: In compliance with the FSAP
(2011) assessment of the Reserve Bank as
‘Materially Non-compliant’ in respect of three
Basel Core Principles (BCP) which include BCP 25
(Revised Principle 13) on ‘Home-Host
relationships’, the Reserve Bank has made
significant progress regarding supervisory
information sharing and cooperation with
jurisdictions where Indian banks are operating. As part of this process, the Reserve Bank has already
entered into 20 Memoranda of Understanding
(MoU) and one Letter for Supervisory Co-operation
with overseas regulators/supervisors.
-
Supervisory colleges: With a view to improving
cooperation and information exchange between
home and host supervisors, the Reserve Bank
arranged a supervisory college with respect to two
major Indian banks in 2013-14 (Bank of Baroda and
Bank of India). Supervisory colleges were hosted
earlier for State Bank of India and ICICI Bank
Limited in 2012-13.
-
Inspection of overseas branches/subsidiaries of
Indian banks: Global operations of Indian banks
are spread across 54 countries. In order to assess
the financial position, systems and control of
overseas branches, an inspection of eight banks in
five overseas jurisdictions covering almost 60 per
cent of the total overseas assets of Indian banks
was undertaken in 2012-13. In 2013-14, an
additional six banks in six jurisdictions covering
another 20 per cent of the asset ownership were
inspected.
Appointing NBFCs as Business Correspondents: To
hasten financial inclusion, the Reserve Bank has
undertaken certain measures including allowing
commercial banks to appoint NBFCs as Business
Correspondents (BCs) (only NBFCs-ND are eligible to act
as banks’ BCs). While appointing NBFCs as BCs, banks
have to ensure that their funds shouldn’t co-mingle with
those of the NBFCs. The banks also have to restrict
NBFCs-ND while functioning as BCs from adopting
practices such as offering savings or remittance functions
only to their own customers and avoiding the forced
bundling of services offered by them and the bank.
Development financial institutions: Dependence
on special funding dispensations
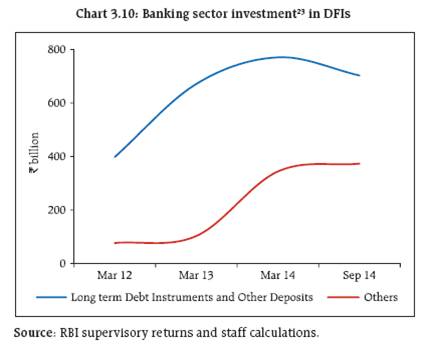
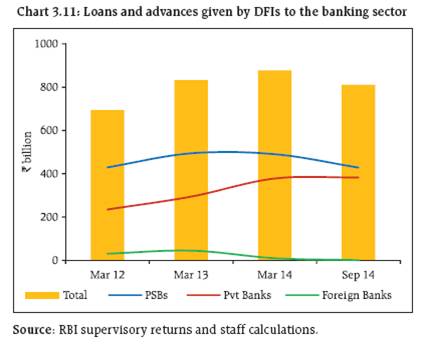
3.41 Development financial institutions (DFIs) like
National Bank for Agriculture and Rural Development
(NABARD), Small Industries Development Bank of
India (SIDBI) and National Housing Bank (NHB), among others have been playing an important role
in the refinancing needs of banks and financial
institutions in niche sectors. The banks subscribe to
long term debt instruments issued by these
institutions and also avail refinance facilities from
them. However, certain peculiar features in the funding arrangements of DFIs may need a review in
the evolving regulatory and business scenario,
especially those pertaining to mandated contributions
by banks to some special funds like the Rural
Infrastructure Development Fund (RIDF).22 The RIDF
and certain other special funds, mainly in the nature
of refinance funds, have been established within
these DFIs for providing financial assistance to
sectors such as micro, small and medium enterprises
(MSME) and housing, and to institutions such as cooperative
banks and regional rural banks (RRBs).
These funds are growing rapidly and now utilise a
major portion of shortfalls of the priority sector
lending of banks. The banking sector’s total
investment in long term bonds and special funds
taken together amounted to over ` 1 trillion as of
September 2014. Simultaneously, outstanding loans
and advances given by DFIs to the banking sector
were over `800 billion during the same period. This
indicates towards a possibility that a substantial
amount of funds originally dedicated by banks for
special purposes are getting back on to their balance
sheets (Charts 3.10 and 3.11).
 Financial inclusion efforts by banks
3.42 The Reserve Bank had adopted financial
inclusion as one of its major projects in January 2010.
Subsequently, the financial inclusion initiative is
being led by a technical group on financial Inclusion
and financial literacy, under the FSDC sub-committee,
involving all financial sector regulators and other
government and non-government agencies. Banks
have been advised to devise financial inclusion plans
(FIPs) congruent with their business strategies and
comparative advantages to make them an integral part
of their corporate business plans. The initiative
included targets required to be set by banks for
opening banking outlets, Business Correspondent (BC)
outlets opened in urban locations, opening of basic
savings bank deposit accounts (BSBDAs), overdraft (OD) facility availed in BSBDAs and farm and nonfarm
credit such as Kisan Credit Cards/ General Credit
Cards (KCCs/GCCs) transactions in (Business
Correspondent – Information and Communication
Technology) (BC-ICT) accounts. Some important
points on progress made during the first half under
the financial inclusion plan for 2014-15 are provided
given in Box 3.3.
Convergence with the Pradhan Mantri Jan Dhan
Yojana (PMJDY)24
3.43 The objectives of PMJDY launched by the
Government of India are mostly in sync with the
financial inclusion objectives being advocated by the
Reserve Bank. The implementation plan for PMJDY
leverages on the policies laid down by the Reserve
Bank under financial inclusion. The comprehensive
FIP format devised by the Reserve Bank captures the
required data which is being used by banks to report
on the progress made under PMJDY also.
3.44 Going forward banks will have to revise their
targets set under FIPs so as to match with the targets allocated to them by the government under PMJDY.
The timeline for providing banking services in
villages with populations below 2,000 under the
roadmap may be advanced from March 2016 to
August 2015. With revised targets for opening of basic
bank accounts in place, banks will have to ensure
opening of at least one bank account in each
household by January 26, 2015.
3.45 While offering an overdraft facility of `5000,
banks will need to follow proper due diligence and
satisfactory operations in the account for six months.25
In addition, banks are advised to undertake financial
awareness campaigns in association with IBA so as to
educate customers with regard to the facilities offered
under the accounts opened under PMJDY.
Extending PMJDY to insurance and pension services
3.46 Given the low levels of penetration of
insurance and pension, there is a case for subsequently
extending or replicating a project on the lines of
PMJDY, to include the provision of insurance and
pension services for the common man.
Box 3.3: Financial Inclusion Plan: Progress up to September 2014
Progress made by domestic public and private sector
banks (including RRBs) under their financial inclusion
plan for the six month period from April 2014 to
September 2014 includes:
An increase of 62,948 banking outlets during the current
half year taking the total number of banking outlets to
446,752 as at the end of September 2014. BSBDAs reached
305 million for the half year ended September 2014
showing an increase of 62 million accounts during this
period. There was considerable increase in the opening
of BSBDAs during August/September 2014 in view of
government’s initiative under the Pradhan Mantri Jan
Dhan Yojana (PMJDY).
Nearly 57 million accounts had been opened under
PMJDY as at the end of September 2014. BC-ICT
transactions in BSBDAs showed steady progress with 220
million transactions for the half year ended September
2014 as against 329 million transactions recorded for
year ended March 2014.
KCCs which reflect flow of credit towards farm sector
entrepreneurial activities increased by 1.2 million during
the half year ended September 2014. GCCs which reflect
flow of credit towards non-farm sector entrepreneurial
activities increased by 1.3 million during the half year
ended September 2014. As at end September 2014, 8.8
million accounts were outstanding with a balance of
`1,165 billion.
Regulation of securities market
Trends in offshore derivatives instruments (ODIs)
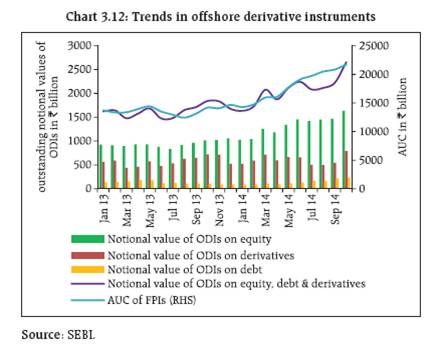
3.47 Indian stock markets have seen rapid growth
during the last 2-3 quarters, reflecting the confidence
of investors in the fundamental strengths and
prospects of the Indian economy. While the
participation of the retail investor base still remains
comparatively narrow and shallow, the potential and
performance in terms of returns delivered by India’s
stock markets have been attracting substantial
amounts of foreign investments through offshore
derivatives instruments (ODIs).26
3.48 While foreign participation in Indian stock
markets adds to the depth and liquidity, it also
increases the risks of sudden episodes of heightened
volatility due to several global and domestic factors.
During the current phase of high growth in Indian
stock market valuations, investments through ODIs
also saw rapid growth and the notional values and
assets under custody touched the highest levels in
October 2014 (since 2008) (Chart 3.12).
3.49 The previous FSR had covered the major
changes in the regulatory framework for foreign
portfolio investors (FPIs) effected by the Securities
and Exchnage Board of India (SEBI) which was aimed
at, among other things, tightening the ‘know your
client’ norms for issuance of ODIs. The regulations
barred ‘unregulated’ foreign funds from dealing in
ODIs even though their investment managers were
under the regulation of their concerned regulators.
The regulations for FPIs have been further
strengthened with respect to requirements that the
entities subscribing to ODIs shall be from the
countries and jurisdictions which are members of
relevant international standards setting bodies like
International Organization of Securities Commissions (IOSCO) and Bank for International Settlements (BIS)
and signatories to relevant multilateral and bilateral
Memoranda of Understanding (MoUs) with SEBI.
Subscription to ODIs from residents in countries
identified in the public statement of the Financial
Action Task Force (FATF) has been prohibited as
compliance with international regulations for Anti-
Money Laundering and Combating the Financing of
Terrorism (AML/CFT).27 Entities having opaque structures have been prohibited from subscribing to
ODIs. Further the investment restrictions applicable
to FPIs which require that the purchase of equity
shares of each company by a single FPI or an investor
group shall be below 10 per cent of the total issued
capital of an Indian company, have been made
applicable to the ODIs also.
 Faster growth in the derivatives segment of equity
markets
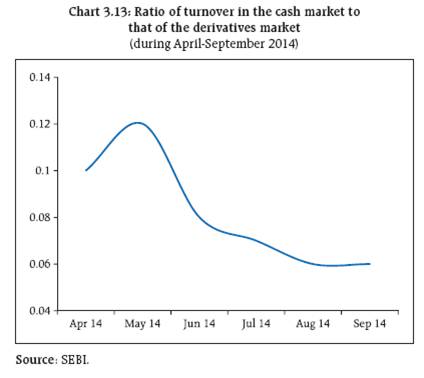
3.50 The previous FSR had raised the importance
of trends showing higher growth in the volumes of
equity derivatives as compared to that in cash market
segments. The ratio of turnover of cash markets to
that of derivatives markets continued its declining
trend during the first six months of the current
financial year 2014-15 (Chart 3.13).
Systemic risks from mutual funds: The Indian
context
3.51 The Global Financial Stability Report (GFSR)
(October 2014) observed that since 2007, mutual
funds (MFs), exchange traded funds (ETFs) and
households have become the largest owners of US
corporate and foreign bonds, accounting for 30 per
cent of the total holdings. Globally, from a financial
stability perspective, credit intermediation through
asset managers and markets has certain advantages
over that through banks, as the investment risk is
borne largely by investors and the liquidity is
provided mostly by markets. However, funds
investing in credit instruments have a number of
features that could result in elevated financial
stability risks. The previous FSR highlighted the
structural characteristics of the Indian mutual fund
industry which make it less prone to financial
stability risks with appropriate fencing provided by
SEBI regulations. Furthermore, retail participation in
the mutual fund industry is low as typically
corporates have a major share in the total Asset under
Management (AuM) which is around 47 per cent. In
addition, retail investors exhibit more ‘sticky’
behaviour in terms of holding to investments made
in mutual funds.
 Holding pattern in the mutual fund industry
3.52 Across the globe, there is rich diversity in the
mutual fund sector as the asset management industry
offers a mix of traditional and alternative fund
products to a wide and diverse investor space
covering banks, corporate entities, insurance funds,
pension funds, sovereign wealth funds (SWFs) and
high net worth individuals (HNIs)/retail investors.
The spread of Indian asset management is
comparatively limited and concentrated in terms of
investor categories, investment products and
geographical reach (Chart 3.14).
 3.53 Corporates hold close to half of the total AuM
followed by HNIs and retail investors. The market is
highly concentrated as the five largest metropolitan
cities account for an almost three-fourth share of
total AuM. While the range of investment products
and fund schemes has expanded over the years,
income oriented schemes attract a major share of
investments followed by the liquid/money market
and growth oriented schemes. It has been observed
that in growth (equity) oriented schemes a major part
of the investment for the long term is by retail
investors, as compared to other investor categories.
3.54 The GFSR (October 2014), observed that the
risk of a run may be intensified by the increased
holdings of mutual funds.28 Shares of different
investors in composition of equity and non-equity
AuM in 2014 in different tenure holding baskets
ranging from extremely short term to long term,
indicates that in the Indian context retail investors
exhibit a tendency to hold mutual fund investments
for longer durations in the case of both equity as well
as non-equity investments (Charts 3.15 and 3.16).
This tendency of retail investors may also reveal their
vulnerability in falling behind the market when there
is a reversal in trend due to any reason, including
heavy selling by corporate or institutional investors. However, the principle of fair valuation adopted by
MFs as per SEBI’s directives in February 2012 ensures
fair treatment to all investors, existing as well as
those seeking to purchase or redeem units of MF
schemes. Adoption of this principle takes away the
incentive from investors to redeem prior to other
investors, thereby reducing the redemption pressure
on the scheme and risk of a run.
 Concentration in equity portfolio holdings in
mutual funds across schemes by AMCs
3.55 During the half year from April 2014 to
September 2014, deployment in equity by mutual
funds has surged about 50 per cent. There are 41
AMCs having AuM of `9,594.14 billion and the
distribution indicates a high degree of concentration
in the hands of a few AMCs, under a Pareto 80-20
principle. An analysis of portfolio holdings in equity
of the top ten AMCs29 along with their top ten
holdings in equity stocks shows that the portfolio
holdings of AMCs comprise quite a few common
stocks indicating preference towards a select group
of stocks (Table 3.4 and Chart 3.17).
Table 3.4: Select indicators on concentration in the
Indian mutual fund industry |
Equity AuM as percentage of total AuM |
31.6 |
Top-10 AMCs equity AuM as percentage of total equity AuM |
77.7 |
Top-10 stocks in each of top-10 AMCs/Total AuM of top-10 AMCs |
30.7 |
AuM of top-10 stocks overall as percentage of total equity AuM
of top-10 AMCs |
22.8 |
Share of equity AuM of top-4 AMCs as percentage of total
equity AuM |
49.0 |
| Source: AMCs. |
 3.56 An analysis of the total exposure of top ten
AMCs to top ten stocks vis-à-vis the weightage of top
ten stocks (on the basis of market capitalisation) in
the index (CNX Nifty 100) also shows considerable
concentration levels in AMCs’ equity investments.
While top ten stocks account for 46 per cent of the
total market capitalisation of the index, the share of
top ten stocks in the AuM of top ten AMCs is around
74 per cent, indicating a strong preference towards
a select group of most liquid stocks. Although there
are regulations limiting the exposure of AMCs/
schemes to particular scrip, a significantly high degree
of concentration by the mutual fund sector may need
to be further monitored from a wider perspective of
its implications for stability and developing the
securities market.
Financial market infrastructure
3.57 As part of the Committee on Payment and
Settlement Systems (CPSS)30 and FSB, the Reserve
Bank is committed to implementing the CPSS-IOSCO
‘Principles for Financial Market Infrastructure’
(PFMIs). On the directions of the FSDC subcommittee,
an Inter-Agency Implementation Group
(IAIG) comprising members from the Reserve Bank,
SEBI and the Forward Markets Commission (FMC)
was constituted for monitoring the implementation
of PFMIs in India. The Clearing Corporation of India
Limited (CCIL) has been identified as an important
FMI under the regulation of the Reserve Bank.
Importance of cyber security and possible conflict
in priorities of PFMIs
3.58 With increasing use of electronic payments
and internet and mobile banking information
security and operational reliability challenges have
become very important from the financial stability
perspective. One of the clauses31 under PFMIs requires that an FMI operator’s business continuity
plans must ‘be designed to ensure that critical
information technology (IT) systems can resume
operations within two hours following disruptive
events’ and that there can be ‘complete settlement’
of transactions ‘by the end of the day of the
disruption, even in the case of extreme circumstances’.
However, a rush to comply with this requirement
may compromise the quality and completeness of
the analysis of causes and far-reaching effects of any
disruption. Restoring all the critical elements of the
system may not be practically feasible in the event
of a large-scale ‘cyber attack’ of a serious nature on a
country’s financial and other types of information
network infrastructures. This may also be in conflict
with Principle 16 of PFMIs which requires an FMI to
safeguard the assets of its participants and minimise
the risk of loss, as in the event of a cyber attack
priority may need to be given to avoid loss, theft or
fraudulent transfer of data related to financial assets
and transactions.
Legal entity identifiers for India
3.59 The Reserve Bank of India selected CCIL to
act as a local operating unit (LOU) for issuing globally
compatible legal entity identifiers (LEIs) in India.
Infrastructure in this regard has been set up, and the
use of LEI codes is likely to be mandated for OTC
derivatives transactions and large borrowers (legal
entities) in a phased manner.
Payment and settlement systems
Increasing use of electronic modes of transactions
3.60 The payment and settlement system
infrastructure in the country continued to perform
without any major disruptions. Development in the
system is evidenced by increasing use of electronic
modes of transaction settlements. Close to 90 per cent of the total settlement volumes was done
through retail electronic modes as of August 2014.
The share of paper-based clearing also declined
marginally over the last year (Charts 3.18 and 3.19).
Security issues and risk mitigation measures related
to ‘card not present’ transactions
3.61 Reserve Bank’s instructions on card
transactions’ security and risk mitigation, which have
been issued from time to time since 2009, mandate
the use of an additional factor of authentication (AFA)
for all ‘card not present’ (CNP) transactions. This was
earlier applicable to ‘card transactions’ in India with
cards issued by banks in India. Recently, instances
came to notice where entities, through adoption of
alternate business/payment models, were violating
these instructions on ‘card not present’ transactions
which were being effected without the mandated
additional authentication/validation even where the
underlying transactions were essentially taking place
between two residents in India.
3.62 In view of this, instructions were issued to
banks advising them that where cards issued by banks
in India are used for making ‘card not present’
payments towards purchase of goods and services
provided within the country, such transactions have
to be through a bank in India and the transaction
should necessarily be settled only in Indian currency
in adherence to extant instructions on security of
card payments as well as foreign exchange guidelines.
Core settlement guarantee fund, Default Waterfall
and Stress Test
3.63 Continuing with the objective ‘to promote
orderly and healthy growth of the securities market
in India’ along with safeguarding the markets from
systemic risks, SEBI has introduced a new layer of
safety net in the form of ‘core settlement guarantee
fund’ to mitigate risks from possible default in
settlement of trades and strengthen risk management
framework in the domestic capital markets.
3.64 The new structure aims at enhancing the
robustness of the present risk management system
of the clearing corporations to enable them to deal
with defaults of the clearing members much more
effectively. The granular norms related to core
settlement guarantee fund (SGF), stress testing and
default procedures would bring greater clarity and
uniformity as well as align the same with international
best practices while enhancing the robustness of the
present risk management system in the clearing
corporations (Box 3.4).
Box 3.4: SEBI Guidelines on Core SGF, Default Waterfall and Stress Test
SEBI has issued detailed guidelines on Core SGF,
Default Waterfall and Stress Test, with the following
objectives:
a) create a core fund (called core settlement guarantee
fund), within the SGF, against which no exposure is
given and which is readily and unconditionally
available to meet settlement obligations of clearing
corporation in case of clearing member(s) failing to
honour settlement obligation,
b) align stress testing practices of clearing corporations
with FMI principles (norms for stress testing for
credit risk, stress testing for liquidity risk and
reverse stress testing including frequency and
scenarios),
c) capture in stress testing, the risk due to possible
default in settlement of both institutional and non-institutional
trades,
d) harmonise default waterfalls across clearing
corporations
e) limit the liability of non-defaulting members in view
of the Basel capital adequacy requirements for
exposure towards Central Counterparties (CCPs),
f) ring-fence each segment of clearing corporation
from defaults in other segments, and
g) bring in uniformity in the stress testing and the risk
management practices of different clearing
corporations especially with regard to the default of
members.
The default waterfall in any segment will generally
follow the following order –
-
Monies of defaulting member
-
Insurance, if any
-
Clearing Corporations’ (CC) resources (equal to 5
per cent of MRC)
-
Core SGF (within it also penalties and then CC to
bear loss first to extent of 25 per cent of segment
MRC, then pro rata allocation to all contributors)
-
Proportion of remaining CC resources (excluding CC
contribution to core SGFs of other segments and
INR 100 Crore) equal to ratio of segment minimum
required corpus (MRC) to sum of MRCs of all
segments.
-
CC/Stock Exchange contribution to Core SGFs of
other segments and remaining CC resources to
extent approved
-
Capped additional contribution of non defaulting
members (pre-specified by CC)
-
Pro-rata haircut to pay-outs
Financial safety net: Deposit Insurance and
Credit Guarantee Corporation (DICGC)
3.65 A strong deposit insurance system is a
necessary component of financial stability
arrangements in any jurisdiction. The previous FSRs
have highlighted some issues and challenges facing
the deposit insurance system in India which include,
inter alia, those related to the adequacy of the Deposit
Insurance Fund and coverage of deposit insurance,
apart from ensuring compliance with the Core
Principles for Effective Deposit Insurance Systems.32
3.66 One of the core principles stresses on the
requirement for funding (including assured liquidity
funding) mechanisms necessary to ensure prompt
reimbursement of depositors’ claims and for banks
to bear the cost of deposit insurance. At present in
India, the DICGC maintains three distinct funds/
accounts: the Deposit Insurance Fund (DIF), the
Credit Guarantee Fund (CGF), and the General fund
(GF). Out of these, DIF is primarily used for
settlement of claims from depositors and is sourced
out of the premium paid by the insured banks and
the investment income received from (and reinvested in) central government securities. There is also an
inflow of small amounts into this fund out of the
recoveries made by the liquidators/administrators/
transferee banks. DICGC, thus, builds up its DIF
through transfer of excess of income over expenditure
each year after payment of income tax. This fund is
used for settlement of claims of depositors of banks
taken into liquidation/reconstruction/amalgamation.
The size of DIF was around `441.5 billion as at end-
June 2014 (Chart 3.20).
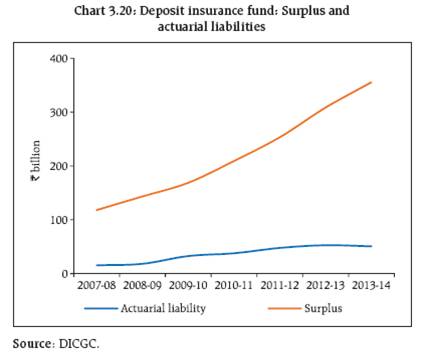 3.67 DIF consists of actuarial liabilities and
accumulated surplus. Actuarial liabilities are the
claims of depositors paid out from DIF by DICGC over
the years and have witnessed a moderate growth at
12 per cent primarily because there was no failure
by any major bank during this period. DICGC’s
liabilities crystallised largely on account of failure of
co-operative banks implying some inherent
weaknesses in the management of these institutions.33
Pension sector
3.68 In the coming decades, developing countries
like India will grow older much faster and that too
at relatively low income levels. The Pension policy
in India has traditionally been based on employment
contracts and service conditions and has been
financed through employer and employee
participation. As a result, its coverage has been
restricted to the organised sector and a vast majority
of the workforce in the unorganised sector has
remained outside the formal channels of old age
financial support. Therefore, in view of the need for
containing fiscal liabilities under control and
transiting towards a sustainable pension system in
India a product like the National Pension Scheme
(NPS) needs to be pushed with greater vigour. While
the Pension Fund Regulatory and Development Authority (PFRDA) can take a lead role in generating
awareness and disseminating information about NPS,
NPS needs to grow into a popular movement where
all the stakeholders in the economy need to play an
important role.
Inconsistencies in tax treatment of the NPS and
other traditional pension systems
3.69 The NPS is voluntary whereas the Employee
Provident Fund (EPF) is mandatory. The Employee
Provident Fund Organisation (EPFO) is legally
mandated and therefore, EPF accounts are maintained
by corporates from the point of view of legal liability
and guaranteed returns are determined each year by
the government. Issues related to seamless portability
across corporates and awareness about the product
pose further challenges vis-à-vis other retirement
products. There is a need for clarity regarding tax
treatment of NPS as the decision on the EET (Exempt,
Exempt, Taxable) status is still pending.
Commodity derivatives markets
Initiatives for improving hedger participation in
commodity markets
3.70 To improve hedging in the market, the FMC
has exempted participants making an early ‘pay-in’
of commodities to the exchanges from payment of
all margins except the mark-to-market margin. Also,
the positions taken by members who pre-pay the
margin is not to be counted towards position limits
and spread margin benefits are also allowed to such
participants.
3.71 The computation methodology for open
position limits for agricultural and non-agricultural
commodities have been revised. In case of agricultural
commodities, overall exchange wide gross position
limit shall be capped at 50 per cent of the estimated
production and imports. For members of the
exchange, position limits shall be 10 times of the
client level position limit or 20 per cent of the market
wide open interest whichever is higher. Client level
position limits shall be the numerical position limits as decided from time to time or 5 per cent of the
market-wide open interest whichever is higher. In
case of agricultural commodities and agricultural
products, the client level position limit shall be
limited to 1 per cent of the total production and
import. The near month position limits have also been
revised for agricultural commodities and have been
restricted to 50 per cent of the overall position limits.
3.72 For improving transparency, the commodity
futures exchanges have been directed to disclose on
their websites, positions of top 10 trading clients in
‘buy side’ as well as ‘sell side’ in order of maximum
open interest, the hedge position allocated to various
hedgers, the delivery intent of the hedgers on a daily
basis in an anonymous manner. In addition the
exchanges also have to disclose, the pay-in and payout
of commodities made by top 10 clients including
hedgers on their website 10 days after completion of
settlement, for the information of the market.
|