Central banks monitor developments in property prices in view of their prime objectives of price stability, financial stability and growth. The Reserve Bank of India initiated an information system on residential property prices, viz. ‘Residential Asset Price Monitoring System’, to track movements of residential property prices in India. The information for this purpose is being collected from 35 scheduled commercial banks/ housing finance companies, based on transaction level data on housing loans disbursed across 13 cities. The property price data considered for this purpose is the valuation price of the property as appraised by the concerned bank/HFC. Based on the data compiled on a quarterly basis, a Residential Property Price Index is constructed for each city and at All-India level. The data provided evidence of steady rise in house prices during the past four-and-a-half years. House price inflation which was at its peak during 2012-13, has stabilized in the recent period. I. Introduction: Asset prices provide useful information on the state of the economy. Booms and busts in asset markets give rise to economic imbalances. Changes in asset prices affect consumption spending through its effect on household wealth as well as consumer confidence. Bernanke and Gertler (1999) referred to a balance sheet channel connecting asset prices and economy to a greater extent. Asset price changes can also have impact on banking and financial sectors of the economy through mortgage channel. A decline in the value of asset reduces the value of available collateral which in turn adversely affects the borrower’s creditworthiness. Volatility in house prices can generate wasteful speculative investment, which has adverse impact on economic stability. Central banks monitor developments in residential and commercial property prices keeping in view their prime objectives of price stability, financial stability and growth. Housing market is a key link in the chain of events impacting the economy. Mortgages being one of the biggest financial transaction of households and housing-loan being the major component of households’ liabilities, central banks track property prices for fine-tuning their micro-prudential supervision and regulation. Large decline in property prices can induce financial instability. Central banks’ concern regarding changes in housing market arises due to these reasons, as observed by Gerlach (2012). The ‘Second Geneva Report on World Economy’ observed that inflation targeting central banks can achieve better performance by adjusting their policy instruments in response to asset price forecasts along with inflation and growth forecasts. Measurement of house prices and compilation of house price indices are challenging tasks, unlike commodity prices. Depending on the availability of house price data and their sources, the compilation method for house price indices, which serve as aggregate measures of house prices, also varies (Eurostat 2011). In India, capturing reliable data on property prices is extremely challenging. Though there are various data sources such as government registration authorities, builders, real estate agents, individual buyers and sellers, housing societies etc.; banks and housing finance companies are comparatively practicable and reliable sources of property/house price data, due to their prominent role in institutional financing for housing as well as timely data availability in electronic form. In view of this, Reserve Bank of India initiated a ‘Residential Asset Price Monitoring Survey’ in July 2010, for collecting residential property prices in the form of transaction level housing loan data from scheduled commercial banks and housing finance companies (HFC) on quarterly basis. II. Prelude to Residential Asset Price Monitoring Survey Considering the significance of real estate property price data for central banks, RBI had set up an ‘Expert Group on Asset Price Monitoring System’ in 2009, with the objective of developing an effective information system on asset prices, in a manner that could be useful for monetary policy and financial stability purposes. The Group recommended to collect real estate property sale/resale price data pertaining to selected 13 centres, directly from scheduled commercial banks and housing finance companies (HFC). These centres1 were selected based on the twin considerations of housing loan disbursement by banks as well as their regional representation. Further, the Group recommended compilation of a real estate price index using data generated from the system, on a quarterly basis with financial year 2009-10 as base year. As Banks/HFCs appraise properties before sanctioning housing loans and these appraisal values are comparatively reliable estimates of property prices, the Group recommended use of such appraisal values for constructing the index, rather than transaction prices.The Group envisaged that the real estate price index based on such data has the potential of becoming a reliable national-level price index. III. Evolution of Residential Asset Price Monitoring Survey The quarterly ‘Residential Asset Price Monitoring Survey’ was launched in July 2010. In the first round of this survey, 42 scheduled commercial banks/ HFCs were requested to provide requisite housing loan transaction data, for the selected 13 centres, for the period January 2009 to June 2010. For most of the banks, the information required for the survey was not forming part of their internal systems. Therefore, banks initially found it cumbersome to cull out the requisite data, which led to severe delays in data submission and poor response from banks. Only 8 banks reported in the first round of the survey. Banks were requested to put in place a system to capture the desired data and were also requested to extract data for the previous periods for increasing the coverage. The regular interactions with banks/HFCs and the relentless follow up efforts resulted in improved data reporting over time. IV. Survey Design & Methodology IV.1 Coverage Presently, the survey covers selected 35 Banks/HFCs2. However, around 30-32 banks/HFCs are reporting in each quarter. These Banks/HFCs report housing loan transaction in 13 cities viz; Greater Mumbai, Chennai, NCR Delhi, Bengaluru, Hyderabad, Kolkata, Pune, Jaipur, Greater Chandigarh, Ahmedabad, Lucknow, Bhopal and Bhubaneswar. IV. 2 Data items collected The data items captured in the survey include variables such as, type of the property (residential/ commercial), address of the property, type of transaction (under-construction/ ready-construction/resale), floor space area of the structure, date of first disbursement of loan, cost of property, valuated/ estimated price of the property by the bank, first borrower (male/ female/ partnership firm/ proprietary concerns/ company/ others), occupation of first borrower (employed/ self-employed/ others), gross assessed monthly income of the borrower, loan amount, maturity period and Equated Monthly Installment (EMI). IV. 3 Residential Property Price Index (RPPI) - Methodology The data received for the survey is used to construct City-level as well as All-India Residential Property Price Index (RPPI)3. The assumptions underlying the construction of the index are; (a) the composition of stock of properties remains constant over a certain period of time, (b) unit prices of properties are representative of the sub-category where they belong and (c) the record of stock of properties with commercial banks are adequate for construction of index (Report of Expert Group on APMS, 2010). For compilation of the index, residential property transactions in each city are stratified into 3 area classes viz. small, medium and large, depending on floor space area and the per unit prices of properties in each area class are computed for each transaction. For each of these area classes, the median unit prices are computed and the corresponding price relatives are derived. The city-level RPPI for each city is constructed using Laspeyre’s Price Index method, with the proportion of total loan amount sanctioned in each area class of the city in the base year 2009-10 as weights. The All-India RPPI is constructed using weighed average of city-level indices, with weights as proportion of residential housing stock in the respective city as per Census 2011. The detailed methodology for compiling City-wise and All-India RPPI is given in Annex-I. For constructing city-wise indices, the Expert Group recommended using the proportionate distribution of total loan amount sanctioned in the base year as weight, to arrive at a measure of capital appreciation. Alternatively, to get a measure of price appreciation, the proportionate number of house transactions can be used as weights. However, the city-wise RPPI constructed using both these weights provided similar figures. Similarly, All-India RPPI constructed using weights as proportion of housing stock in each city as well as the proportion of housing loan transactions in each city yielded similar results. However, the weighting based on city-wise housing stock is as per Census 2011 data and hence it is not subject to the limitation of reported transactions. V. Survey Results V.1 Trends in House Prices: City-wise and All-India The housing market witnessed an upward trend in prices during the past four and half years, as evident from the steady rise in RPPI from 107 in Q1:2010-11 to 172 in Q3:2014-15; an increase of almost 61 per cent (Table 1). The highest growth in RPPI was recorded in Jaipur at around 78 per cent, whereas the lowest growth was recorded in Greater Chandigarh and Hyderabad at around 40 per cent, over this period. The trends in house prices during Q1:2010-11 to Q3:2014-15, as indicated by All-India RPPI, is displayed in Chart 1. 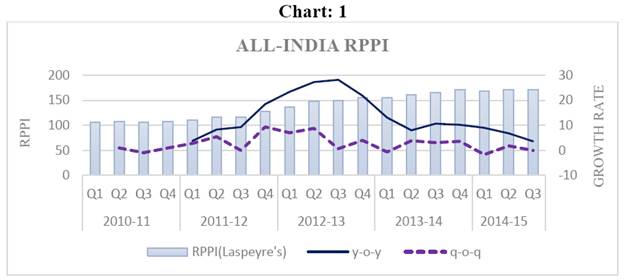 The house price inflation, as measured by the annual growth rate in RPPI, increased gradually from about 4 per cent in Q1:11-12 to almost 28 per cent in Q3:12-13, however the trend reversed thereafter and it slid below 4 per cent in Q3:2014-15. House price inflation in most of the cities witnessed its peak during the quarters of 2012-13. The y-o-y growth in RPPI at All-India level during Q1:2011-12 to Q3:2014-15 is presented in Chart 1. The house price inflation for small, medium and large houses4 also followed similar path, though no specific pattern was observed in the relative movement of house price inflation in these size-classes (Chart 2). The area-class wise and city-wise distribution of transactions in the last five quarters is given in Table 5 & 6 respectively. V.2. Comparison of RPPI with Housing Rent Index The year-on-year growth in All-India CPI-Housing Index5 and All-India RPPI were compared to examine relative movement in house price inflation and housing rent inflation. It is observed that during FY: 2012-13, house prices had been growing at a higher rate than that of housing rent. However, in the subsequent quarters, house price inflation and housing rent inflation moved hand-in-hand (Chart 3). IV.3. Comparison of RPPI with Gold price and BSE SENSEX6 Gold and Equity provide alternative avenues of savings for households vis-à-vis housing. A comparison of return on these assets is presented in Chart 4. Growth in equity prices, which was in the negative territory during Q2: 2011-12 to Q1: 2012-13, picked up subsequently and moved to positive territory and shot up further in FY: 2014-15; whereas house price growth started to fall by the last quarter of FY: 2012-13 and approached equity prices growth during FY: 2013-14. Though gold prices witnessed higher growth rate in FY: 2011-12, a declining trend in growth was observed in the subsequent year, which further slipped to negative domain during FY: 2013-14. The variability among growth rates of residential property prices, gold and equity reduced comparatively during Q3:2012-13 to Q4:2013-14. IV.4. Residential property price indices of select countries A comparison of annual growth in residential property price indices of India with those of select countries viz., United States (US), United Kingdom (UK), China, Malaysia and Indonesia is presented in Chart 5. House price inflation in the United States and United Kingdom have been moving slightly in the upward direction since Q1:2013-14. However, as in the case of India, house price inflation in other Asian countries viz; China, Indonesia and Malaysia have been contracting in the recent few quarters. The details of the residential house price indices of select countries used for this analysis are given in Annex-III. IV.5 RPPI and Housing Credit The movements in RPPI is compared with that of credit to housing sector in India in Chart 6. A co-movement in RPPI and housing credit was observed with a highly significant correlation coefficient of 0.95. IV.6. Comparison of RPPI with HPI and RESIDEX The Reserve Bank also compiles quarterly House Price Index (HPI) based on property transaction registration data obtained from ‘Department of Registration and Stamps’ of State Governments of select ten cities. The coverage of property registration data is more robust as compared to property loan data collected from banks/HFCs, as all house transactions are not financed by banks/HFCs. Although HPI is constructed based on Laspeyre’s method, the city-wise coverage, house size-classes, weights used for averaging, base year and compilation procedure7 differ from that of RPPI. However, RPPI has the advantage of reduced time-lag in obtaining survey data, as compared to that of HPI. A comparison of All-India RPPI with All-India HPI indicated that both the indices were moving almost together (Chart 7). The annual growth in RPPI and HPI also moved together in most quarters. In addition to this, National Housing Bank also compiles a quarterly residential property price index, RESIDEX, in 26 cities of India. As NHB is not compiling All-India level RESIDEX presently, the city-level RPPIs were compared with corresponding RESIDEX figures. Parallel directional movements have been observed in the y-o-y growth of RESIDEX and RPPI in some cities, though the magnitudes were different. Besides timeliness, the survey also has the advantage of capturing additional information such as; Loan amount, EMI, Income of the borrower etc.,. Such information is used to compute important measures for policy purposes, such as; Loan-to-Value ratio, EMI-to-Income ratio and House Price-to-Income ratio. IV.7. Loan-to-Value (LTV) ratio Loan- to-value ratio is one of the macro-prudential tools used by banks to control their exposure to decline in house prices. The Reserve Bank of India prescribed an upper limit of 80 per cent on LTV for housing loans above 20 lakh and 90 per cent for housing loans up to 20 lakh respectively, with effect from December 23, 2010. The movements in quarterly median Loan-to-Value ratio as well as its quartiles during the period from Q1:2009-10 to Q3:2014-15 is presented in Chart 8. A decreasing trend was observed in median LTV over the quarters, indicating increased cautiousness of banks in sanctioning housing loans. Median LTV ratios were comparatively higher in case of housing loans sanctioned in Chennai and Hyderabad, whereas it was lower for Greater Chandigarh, in the recent period (Table 2). 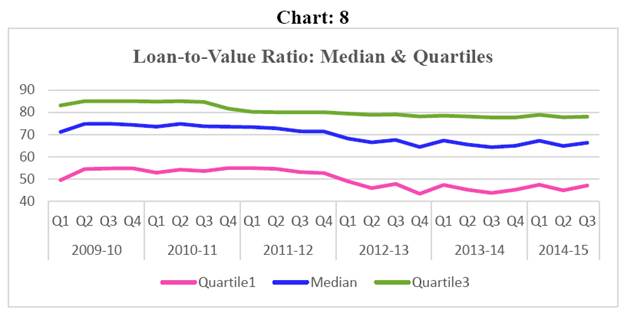 The proportion of loans with higher LTV ratios also has been declining over the quarters and this decline was steeper in case of housing loan transactions with higher LTV ratio (more than 80 per cent) (Chart 9). IV.8. EMI-to-Income ratio The EMI- to- Income ratio measures the affordability of housing loan to the borrower. It is the portion of gross monthly income of the borrower utilized to pay regular monthly EMI. The movements in quarterly median EMI-to-Income ratio for the period from Q1:2009-10 to Q3:2014-15 is presented in Chart 10. It is observed that, median EMI-to-Income ratio increased from 35 per cent in Q1:2009-10 to 41 per cent in Q3: 2011-12; however it declined thereafter and has remained at 36 per cent since Q4:2012-13 till Q2:2014-15. Subsequently, an upturn was witnessed in Q3: 2014-15. While higher median EMI-to-Income ratios were observed in case of home-owners in Mumbai and Ahmedabad, the ratios were comparatively lower for those in Greater Chandigarh, Lucknow and Bhubaneswar in the recent period (Table 3). IV.9. Loan-to-Income (LTI) ratio The Loan-to-Annual Income ratio indicates the amount borrowed for housing in terms of annual income of the borrower and it is a measure of affordability. The median LTI ratio witnessed moderation since Q1:2012-13 and remained around 2.8 thereafter. However, an upturn was witnessed in Q3:2014-15 indicating reduced affordability (Chart 11). The proportions of housing loan transactions with higher LTI ratios also moderated from Q1:2012-13 onwards; however it increased from Q4:2013-14 and moved further up in Q3:2014-15 (Chart 12). IV.10. House Price-to-Income ratio The house price affordability is also measured in terms of median house price-to-monthly income ratio of the borrower. It indicates the average number of monthly incomes required to own a house. The movement in quarterly median house price-to-income ratio is displayed in Chart 13. The median house price-to-income ratio ranged from 55 to 61 during the period from Q1:2009-10 to Q3:2014-15. Median house price-to-income ratios were higher for houses in Mumbai and Ahmedabad, whereas lower ratios were observed for houses in Bhubaneswar and Hyderabad (Table 4). V. Limitations The survey results are based on data on housing loan transactions reported by select banks/HFCs during the quarter in select cities. Accordingly, the sampling method adopted is not random; however the coverage is adequate to ensure the representativeness of sample. Further, house transactions without financing of banks/HFCs are not covered for compiling RPPI. The house prices considered for construction of RPPI is the valuation price rather than the transaction price and the property valuation method followed by banks may not be uniform across banks and across cities. For constructing City-wise RPPI, only those observations with per square feet price lying within 3σ-limits were considered, in order to reduce extreme value bias. Similarly, in calculation of median LTV ratio and median EMI-to-Income ratio, observations with corresponding ratio less than or equal to unity were only considered. Also, these ratios were computed based on the available data, as some of the data items (eg: borrower’s income) were not provided by all banks/HFCs. VI. Summary: The Reserve Bank of India monitors movements of house prices in India through various modes. The quarterly Residential Asset Price Monitoring Survey is one of such methods to capture residential property prices in India through the banking system. The survey results revealed moderation in house price inflation in the recent six quarters, as in other Asian countries. The variability between house price inflation and housing rent inflation has decreased over the years. Housing provides comparable returns vis-a-vis Gold and Equity, in terms of annual growth. The affordability of housing, indebtedness of households and leverage of lender Banks/HFCs did not indicate any major variations in macro-prudential norms prescribed. References: - Ben Bernanke & Mark Gertler, 1999. ';Monetary policy and Asset Price Volatility,'; Economic Review – Federal Reserve Bank of Kansas City, Fourth quarter, pp 17-51
- Eurostat (2011), “Handbook on Residential Property Prices Indices (RPPIs)” (jointly published with IMF, ILO, OECD, UNECE and World Bank).
- Reserve Bank of India (2010), “Report of Expert Group on Asset Price Monitoring System”, Press Release, April
- Reserve Bank of India (2012), “House Price Index”, RBI Monthly Bulletin (October), 1891-1894.
- Stephen G. Cecchetti, Hans Genberg, John Lipsky, and Sushil Wadhwani (2000), “Asset Prices and Central Bank Policy”, Geneva Reports on the World Economy 2, Centre for Economic Policy Research.
- Stefan Gerlach (2012), “Housing Markets and Financial Stability”, Speech at the National University of Ireland, Galway, 20 April 2012.
Annex-I Methodology for compiling Residential Property Price Index (RPPI) The detailed procedure of compiling City-wise and All-India RPPI is as follows. City-level RPPI: For compiling city-level RPPI, residential property transactions in each city are stratified into 3 area classes (Small, Medium and large) depending on Floor Space Area (FSA). Properties with FSA less than 750 square feet are classified as ‘Small’ sized properties and properties with FSA between 750-1200 square feet are classified as ‘Medium’ sized properties and properties with FSA greater than 1200 square feet are classified as ‘Large’ sized properties. The data on per square feet (psf) prices of properties in each area class are scrutinized and unacceptable data points are removed using z-score8. Then the City-level RPPI is constructed by using weighted average of price-relative’s (Laspeyre’s method) method. Following two steps are involved in construction of City-level RPPI.
Annex –II: Data Tables | Table 1: City-wise and All-India Quarterly Residential Property Price Indices | | City | Greater Mumbai | Chennai | NCR Delhi | Bengaluru | Hyderabad | Kolkata | Pune | Jaipur | Greater Chandigarh | Ahmadabad | Lucknow | Bhopal | Bhubaneswar | All-India | | FY:09-10 | 100 | 100 | 100 | 100 | 100 | 100 | 100 | 100 | 100 | 100 | 100 | 100 | 100 | 100 | | Q1:10-11 | 109 | 105 | 102 | 111 | 102 | 103 | 111 | 107 | 103 | 106 | 138 | 111 | 100 | 107 | | Q2:10-11 | 106 | 106 | 106 | 116 | 102 | 110 | 116 | 112 | 99 | 112 | 135 | 107 | 112 | 108 | | Q3:10-11 | 106 | 110 | 98 | 116 | 107 | 110 | 120 | 110 | 105 | 113 | 136 | 108 | 117 | 107 | | Q4:10-11 | 107 | 113 | 98 | 119 | 109 | 112 | 123 | 110 | 103 | 109 | 144 | 118 | 110 | 108 | | Q1:11-12 | 112 | 111 | 104 | 121 | 113 | 112 | 126 | 105 | 106 | 109 | 139 | 127 | 99 | 111 | | Q2:11-12 | 117 | 120 | 111 | 123 | 113 | 114 | 132 | 109 | 113 | 119 | 146 | 130 | 118 | 117 | | Q3:11-12 | 113 | 113 | 114 | 120 | 118 | 118 | 136 | 110 | 122 | 122 | 154 | 128 | 119 | 117 | | Q4:11-12 | 135 | 123 | 122 | 127 | 118 | 120 | 138 | 116 | 128 | 135 | 148 | 135 | 112 | 128 | | Q1:12-13 | 146 | 129 | 132 | 133 | 114 | 128 | 151 | 145 | 143 | 148 | 163 | 147 | 116 | 137 | | Q2:12-13 | 160 | 133 | 152 | 137 | 123 | 141 | 155 | 146 | 148 | 153 | 167 | 154 | 118 | 149 | | Q3:12-13 | 161 | 143 | 139 | 146 | 123 | 149 | 160 | 162 | 151 | 159 | 188 | 168 | 127 | 150 | | Q4:12-13 | 172 | 148 | 146 | 147 | 118 | 146 | 168 | 170 | 161 | 164 | 191 | 174 | 123 | 156 | | Q1:13-14 | 177 | 152 | 147 | 148 | 123 | 146 | 171 | 157 | 139 | 148 | 177 | 144 | 118 | 155 | | Q2:13-14 | 182 | 149 | 151 | 155 | 129 | 147 | 178 | 165 | 149 | 157 | 191 | 162 | 122 | 161 | | Q3:13-14 | 188 | 153 | 159 | 157 | 127 | 153 | 182 | 163 | 156 | 159 | 206 | 175 | 133 | 166 | | Q4:13-14 | 196 | 165 | 162 | 160 | 131 | 162 | 183 | 193 | 150 | 168 | 212 | 174 | 130 | 172 | | Q1:14-15 | 184 | 158 | 160 | 166 | 133 | 166 | 191 | 180 | 144 | 158 | 219 | 177 | 137 | 169 | | Q2:14-15 | 189 | 160 | 161 | 170 | 138 | 167 | 190 | 203 | 146 | 163 | 226 | 183 | 141 | 172 | | Q3:14-15 | 182 | 178 | 164 | 174 | 143 | 153 | 193 | 190 | 144 | 166 | 215 | 193 | 143 | 172 |
| Table 2: City-wise Quarterly Median Loan-to-Value (LTV) ratio | | (In per cent) | | City | Gr. Mumbai | Chennai | NCR Delhi | Bengaluru | Hyderabad | Kolkata | Pune | Jaipur | Gr. Chandigarh | Ahmadabad | Lucknow | Bhopal | Bhubaneswar | All-India | | Q1:09-10 | 72 | 73 | 67 | 64 | 72 | 73 | 76 | 72 | 59 | 64 | 73 | 65 | 78 | 71 | | Q2:09-10 | 74 | 76 | 71 | 70 | 71 | 80 | 81 | 76 | 77 | 67 | 75 | 71 | 8 | 75 | | Q3:09-10 | 75 | 77 | 72 | 70 | 72 | 80 | 80 | 74 | 70 | 67 | 71 | 74 | 77 | 75 | | Q4:09-10 | 73 | 77 | 73 | 72 | 71 | 78 | 80 | 71 | 65 | 69 | 75 | 73 | 72 | 74 | | Q1:10-11 | 70 | 77 | 72 | 72 | 75 | 80 | 78 | 68 | 61 | 67 | 80 | 74 | 78 | 74 | | Q2:10-11 | 70 | 80 | 75 | 75 | 76 | 80 | 78 | 71 | 69 | 68 | 81 | 71 | 63 | 75 | | Q3:10-11 | 68 | 78 | 76 | 72 | 74 | 77 | 77 | 72 | 68 | 68 | 73 | 70 | 57 | 74 | | Q4:10-11 | 69 | 77 | 74 | 73 | 74 | 75 | 77 | 67 | 68 | 73 | 73 | 75 | 63 | 74 | | Q1:11-12 | 69 | 76 | 73 | 74 | 74 | 74 | 76 | 74 | 68 | 74 | 71 | 71 | 71 | 73 | | Q2:11-12 | 70 | 77 | 70 | 74 | 74 | 74 | 75 | 75 | 68 | 69 | 72 | 72 | 69 | 73 | | Q3:11-12 | 66 | 76 | 70 | 73 | 75 | 73 | 74 | 70 | 63 | 66 | 71 | 69 | 67 | 71 | | Q4:11-12 | 67 | 75 | 70 | 72 | 74 | 73 | 75 | 67 | 62 | 67 | 72 | 70 | 72 | 71 | | Q1:12-13 | 63 | 76 | 67 | 71 | 75 | 70 | 71 | 69 | 53 | 60 | 65 | 68 | 66 | 68 | | Q2:12-13 | 59 | 74 | 61 | 69 | 75 | 70 | 71 | 67 | 49 | 58 | 67 | 70 | 70 | 67 | | Q3:12-13 | 63 | 73 | 68 | 70 | 72 | 70 | 70 | 61 | 50 | 59 | 66 | 69 | 66 | 68 | | Q4:12-13 | 61 | 69 | 63 | 65 | 70 | 68 | 67 | 59 | 45 | 57 | 65 | 64 | 66 | 64 | | Q1:13-14 | 63 | 72 | 64 | 69 | 73 | 68 | 70 | 67 | 52 | 66 | 69 | 69 | 69 | 67 | | Q2:13-14 | 61 | 72 | 64 | 65 | 72 | 67 | 68 | 61 | 50 | 60 | 64 | 67 | 70 | 65 | | Q3:13-14 | 59 | 71 | 60 | 64 | 71 | 68 | 68 | 63 | 52 | 62 | 65 | 70 | 68 | 64 | | Q4:13-14 | 61 | 70 | 59 | 68 | 70 | 67 | 69 | 62 | 58 | 61 | 67 | 69 | 67 | 65 | | Q1:14-15 | 65 | 72 | 63 | 67 | 73 | 71 | 69 | 69 | 59 | 65 | 70 | 68 | 70 | 67 | | Q2:14-15 | 61 | 70 | 61 | 66 | 71 | 68 | 68 | 62 | 58 | 61 | 61 | 69 | 71 | 65 | | Q3:14-15 | 64 | 70 | 64 | 66 | 71 | 68 | 69 | 66 | 61 | 63 | 62 | 70 | 69 | 66 |
| Table 3: City-wise Quarterly Median EMI-to-Income Ratio | | (In per cent) | | City | Gr. Mumbai | Chennai | NCR Delhi | Bengaluru | Hyderabad | Kolkata | Pune | Jaipur | Gr. Chandigarh | Ahmadabad | Lucknow | Bhopal | Bhubaneswar | All-India | | Q1:09-10 | 37 | 34 | 25 | 35 | 36 | 31 | 40 | 40 | 23 | 34 | 26 | 36 | 59 | 35 | | Q2:09-10 | 38 | 35 | 25 | 34 | 39 | 29 | 42 | 38 | 22 | 38 | 23 | 36 | 51 | 36 | | Q3:09-10 | 38 | 33 | 25 | 34 | 36 | 33 | 42 | 36 | 21 | 40 | 27 | 36 | 62 | 36 | | Q4:09-10 | 37 | 33 | 22 | 30 | 35 | 35 | 42 | 35 | 33 | 40 | 27 | 36 | 65 | 36 | | Q1:10-11 | 38 | 33 | 29 | 27 | 36 | 31 | 40 | 35 | 33 | 40 | 27 | 36 | 54 | 35 | | Q2:10-11 | 38 | 35 | 23 | 36 | 37 | 36 | 46 | 35 | 32 | 40 | 28 | 36 | 44 | 36 | | Q3:10-11 | 40 | 34 | 29 | 37 | 40 | 41 | 45 | 37 | 35 | 37 | 37 | 36 | 32 | 37 | | Q4:10-11 | 42 | 38 | 32 | 36 | 39 | 33 | 39 | 37 | 33 | 34 | 31 | 34 | 36 | 37 | | Q1:11-12 | 42 | 38 | 33 | 38 | 38 | 35 | 41 | 38 | 37 | 37 | 32 | 36 | 36 | 38 | | Q2:11-12 | 43 | 41 | 38 | 40 | 35 | 36 | 43 | 37 | 36 | 40 | 31 | 37 | 37 | 40 | | Q3:11-12 | 44 | 42 | 38 | 39 | 37 | 37 | 44 | 38 | 40 | 42 | 34 | 36 | 42 | 41 | | Q4:11-12 | 42 | 42 | 38 | 39 | 37 | 35 | 43 | 33 | 39 | 43 | 34 | 35 | 36 | 40 | | Q1:12-13 | 43 | 38 | 35 | 35 | 34 | 35 | 42 | 34 | 28 | 40 | 31 | 31 | 31 | 38 | | Q2:12-13 | 42 | 35 | 34 | 32 | 33 | 35 | 39 | 32 | 26 | 41 | 31 | 31 | 31 | 36 | | Q3:12-13 | 41 | 37 | 35 | 34 | 34 | 35 | 40 | 31 | 31 | 40 | 29 | 31 | 33 | 37 | | Q4:12-13 | 41 | 34 | 35 | 34 | 34 | 34 | 38 | 29 | 31 | 40 | 30 | 34 | 31 | 36 | | Q1:13-14 | 40 | 35 | 34 | 34 | 34 | 33 | 37 | 29 | 29 | 40 | 31 | 34 | 29 | 36 | | Q2:13-14 | 40 | 34 | 35 | 34 | 32 | 34 | 38 | 30 | 31 | 39 | 31 | 32 | 34 | 36 | | Q3:13-14 | 40 | 34 | 34 | 35 | 32 | 34 | 38 | 31 | 30 | 41 | 31 | 34 | 33 | 36 | | Q4:13-14 | 42 | 34 | 33 | 35 | 33 | 33 | 39 | 37 | 30 | 41 | 30 | 33 | 32 | 36 | | Q1:14-15 | 43 | 34 | 34 | 34 | 31 | 31 | 39 | 30 | 30 | 43 | 32 | 31 | 31 | 36 | | Q2:14-15 | 42 | 34 | 34 | 34 | 33 | 34 | 38 | 31 | 29 | 44 | 29 | 33 | 30 | 36 | | Q3:14-15 | 44 | 41 | 39 | 38 | 36 | 37 | 44 | 36 | 35 | 44 | 32 | 37 | 34 | 40 |
| Table 4: City-wise Quarterly Median House Price-to-Income Ratio | | City | Gr. Mumbai | Chennai | NCR Delhi | Bengaluru | Hyderabad | Kolkata | Pune | Jaipur | Gr. Chandigarh | Ahmadabad | Lucknow | Bhopal | Bhubaneswar | All-India | | Q1:09-10 | 54 | 59 | 56 | 60 | 60 | 47 | 60 | 56 | 73 | 63 | 55 | 57 | 62 | 57 | | Q2:09-10 | 56 | 62 | 57 | 57 | 60 | 45 | 61 | 57 | 67 | 63 | 53 | 57 | 64 | 58 | | Q3:09-10 | 59 | 62 | 55 | 62 | 61 | 50 | 62 | 57 | 93 | 69 | 52 | 55 | 68 | 60 | | Q4:09-10 | 62 | 63 | 51 | 52 | 61 | 53 | 64 | 51 | 75 | 70 | 54 | 56 | 84 | 60 | | Q1:10-11 | 62 | 61 | 50 | 46 | 61 | 52 | 60 | 56 | 80 | 71 | 52 | 55 | 67 | 58 | | Q2:10-11 | 62 | 63 | 47 | 56 | 59 | 50 | 72 | 56 | 73 | 64 | 55 | 56 | 72 | 59 | | Q3:10-11 | 65 | 60 | 50 | 59 | 65 | 59 | 68 | 57 | 81 | 66 | 57 | 58 | 67 | 61 | | Q4:10-11 | 61 | 57 | 54 | 55 | 56 | 48 | 56 | 54 | 68 | 50 | 52 | 49 | 62 | 56 | | Q1:11-12 | 61 | 58 | 58 | 55 | 53 | 48 | 58 | 52 | 67 | 54 | 50 | 52 | 60 | 57 | | Q2:11-12 | 62 | 59 | 61 | 55 | 49 | 49 | 60 | 49 | 60 | 60 | 48 | 53 | 57 | 58 | | Q3:11-12 | 64 | 58 | 58 | 54 | 50 | 51 | 62 | 53 | 72 | 63 | 53 | 53 | 61 | 58 | | Q4:11-12 | 62 | 59 | 58 | 54 | 51 | 48 | 60 | 56 | 72 | 68 | 54 | 52 | 56 | 58 | | Q1:12-13 | 64 | 54 | 56 | 51 | 42 | 47 | 60 | 53 | 62 | 66 | 51 | 48 | 46 | 57 | | Q2:12-13 | 63 | 50 | 57 | 48 | 47 | 49 | 57 | 55 | 58 | 66 | 51 | 45 | 47 | 56 | | Q3:12-13 | 63 | 53 | 56 | 50 | 49 | 50 | 58 | 56 | 68 | 65 | 54 | 49 | 53 | 56 | | Q4:12-13 | 63 | 53 | 58 | 53 | 50 | 50 | 59 | 53 | 73 | 65 | 55 | 53 | 49 | 57 | | Q1:13-14 | 62 | 52 | 57 | 52 | 47 | 49 | 55 | 46 | 56 | 61 | 51 | 49 | 43 | 55 | | Q2:13-14 | 62 | 51 | 61 | 54 | 43 | 50 | 58 | 55 | 64 | 64 | 54 | 50 | 48 | 57 | | Q3:13-14 | 67 | 52 | 64 | 56 | 45 | 49 | 59 | 56 | 60 | 65 | 54 | 50 | 48 | 59 | | Q4:13-14 | 67 | 53 | 61 | 52 | 48 | 50 | 62 | 72 | 54 | 68 | 51 | 50 | 47 | 58 | | Q1:14-15 | 68 | 52 | 62 | 53 | 44 | 46 | 61 | 52 | 57 | 72 | 53 | 50 | 44 | 58 | | Q2:14-15 | 68 | 52 | 61 | 54 | 47 | 50 | 61 | 55 | 52 | 72 | 54 | 51 | 46 | 59 | | Q3:14-15 | 67 | 54 | 63 | 58 | 51 | 53 | 65 | 56 | 56 | 65 | 54 | 54 | 52 | 60 |
| Table 5: Area class-wise distribution of transactions | | (In per cent) | | City | Area Class | Q2:13-14 | Q3:13-14 | Q4:13-14 | Q1:14-15 | Q2:14-15 | Q3:14-15 | | Greater Mumbai | Small | 67.0 | 70.8 | 69.8 | 70.4 | 68.3 | 70.6 | | Medium | 23.1 | 21.3 | 21.8 | 21.7 | 22.1 | 21.3 | | Large | 9.9 | 7.8 | 8.4 | 7.8 | 9.7 | 8.1 | | Chennai | Small | 23.1 | 21.6 | 21.0 | 22.6 | 21.9 | 48.9 | | Medium | 46.8 | 46.9 | 44.6 | 46.3 | 46.0 | 27.5 | | Large | 30.0 | 31.5 | 34.3 | 31.1 | 32.1 | 23.5 | | NCR Delhi | Small | 13.0 | 13.1 | 12.9 | 16.7 | 17.9 | 18.7 | | Medium | 34.5 | 32.6 | 33.3 | 36.3 | 34.6 | 35.0 | | Large | 52.5 | 54.3 | 53.7 | 47.0 | 47.5 | 46.3 | | Bengaluru | Small | 5.3 | 6.9 | 5.0 | 6.3 | 6.1 | 7.8 | | Medium | 37.0 | 36.1 | 36.9 | 39.0 | 37.5 | 36.0 | | Large | 57.7 | 57.0 | 58.1 | 54.7 | 56.5 | 56.2 | | Hyderabad | Small | 7.1 | 7.2 | 6.9 | 7.4 | 8.2 | 7.9 | | Medium | 37.6 | 35.5 | 36.9 | 31.7 | 34.0 | 34.5 | | Large | 55.3 | 57.3 | 56.2 | 60.9 | 57.9 | 57.6 | | Kolkata | Small | 26.4 | 29.3 | 28.6 | 43.1 | 33.7 | 26.9 | | Medium | 47.9 | 46.4 | 48.0 | 39.4 | 45.8 | 47.4 | | Large | 25.7 | 24.3 | 23.4 | 17.6 | 20.5 | 25.7 | | Pune | Small | 37.9 | 39.8 | 40.1 | 40.5 | 39.1 | 43.6 | | Medium | 45.3 | 44.7 | 43.2 | 43.2 | 43.6 | 41.5 | | Large | 16.8 | 15.5 | 16.6 | 16.3 | 17.4 | 15.0 | | Jaipur | Small | 17.6 | 16.8 | 17.8 | 15.0 | 16.5 | 16.6 | | Medium | 40.3 | 41.0 | 40.9 | 42.2 | 40.1 | 36.7 | | Large | 42.1 | 42.2 | 41.3 | 42.8 | 43.4 | 46.7 | | Greater Chandigarh | Small | 13.1 | 11.0 | 11.0 | 12.2 | 13.1 | 9.8 | | Medium | 23.9 | 23.6 | 24.8 | 22.8 | 29.0 | 31.7 | | Large | 63.0 | 65.3 | 64.2 | 64.9 | 57.9 | 58.5 | | Ahmedabad | Small | 26.4 | 23.4 | 20.9 | 23.2 | 22.2 | 28.7 | | Medium | 40.3 | 42.2 | 42.1 | 42.4 | 39.3 | 36.9 | | Large | 33.2 | 34.4 | 37.0 | 34.5 | 38.5 | 34.4 | | Lucknow | Small | 22.2 | 18.4 | 19.9 | 16.8 | 16.7 | 17.5 | | Medium | 27.5 | 27.9 | 26.5 | 31.1 | 26.0 | 26.7 | | Large | 50.3 | 53.7 | 53.6 | 52.1 | 57.4 | 55.8 | | Bhopal | Small | 27.8 | 26.1 | 26.0 | 27.6 | 28.8 | 29.6 | | Medium | 43.5 | 47.2 | 44.7 | 43.7 | 44.3 | 47.3 | | Large | 28.6 | 26.7 | 29.3 | 28.7 | 26.9 | 23.1 | | Bhubaneswar | Small | 5.3 | 4.3 | 5.0 | 4.7 | 6.5 | 4.7 | | Medium | 31.0 | 31.4 | 30.7 | 23.1 | 28.0 | 27.8 | | Large | 63.7 | 64.3 | 64.3 | 72.2 | 65.5 | 67.4 |
| Table 6: City-wise distribution of housing loan transactions covered in the survey | | (In per cent) | | City | Q2:13-14 | Q3:13-14 | Q4:13-14 | Q1:14-15 | Q2:14-15 | Q3:14-15 | | Gr. Mumbai | 18.2 | 19.4 | 19.7 | 19.0 | 19.6 | 19.3 | | Chennai | 10.6 | 10.3 | 9.2 | 9.1 | 9.4 | 8.4 | | Delhi | 18.4 | 16.3 | 17.4 | 19.0 | 16.6 | 17.2 | | Bengaluru | 14.1 | 13.4 | 14.7 | 13.7 | 14.8 | 14.1 | | Hyderabad | 7.0 | 6.6 | 6.9 | 6.1 | 5.9 | 6.3 | | Kolkata | 5.2 | 4.9 | 4.9 | 5.5 | 5.6 | 5.4 | | Pune | 11.4 | 12.6 | 11.3 | 12.0 | 12.3 | 12.2 | | Jaipur | 3.1 | 3.7 | 2.5 | 3.5 | 3.5 | 3.4 | | Chandigarh | 1.2 | 1.2 | 1.3 | 1.3 | 1.3 | 1.5 | | Ahmedabad | 5.2 | 5.8 | 5.8 | 5.9 | 6.1 | 6.5 | | Lucknow | 2.0 | 2.3 | 2.5 | 2.1 | 2.2 | 2.5 | | Bhopal | 2.1 | 2.3 | 2.5 | 1.6 | 1.7 | 1.9 | | Bhubaneswar | 1.4 | 1.2 | 1.4 | 1.1 | 1.0 | 1.4 | | Total | 100 | 100 | 100 | 100 | 100 | 100 |
| Country | Index | Organization | Coverage and data source | Methodology | Periodicity | | United States | FHFA-HPI | Federal Housing Finance Agency (FHFA) | Whole country- Mortgage transactions from
Fannie Mae and Freddie Mac. | Weighted repeat-sales index | Quarterly | | United Kingdom | ODPM-HPI | Office of Deputy Prime Minister (ODPM) | Whole country- Survey of Mortgage Lenders and Council of Mortgage Lenders | Mixed-adjusted, measures the average value of transacted dwellings | Quarterly | | China | Sale Price Index of second handed building in Beijing | National Statistics Office | Capital city (Beijing)- Sale price data on second-hand transactions in Beijing. | Fixed base index | Monthly | | Malaysia | Residential Property Price Index- All Dwellings | Bank Negara Malaysia | Whole country- Valuation and Property Services Department | Average of observations | Quarterly | | Indonesia | House Prices, Residential | Bank of Indonesia | 8 cities- Data on selling prices is collected from Developers. | Weighted chain-based index | Quarterly |
Annex –III: Residential Property Price Indices in select countries Source: Residential Property Price Statistics, BIS.
|