3.1 As at end-March 2015, India’s co-operative banking sector comprised of 1,579 Urban Co-operative Banks (UCBs) and 94,178 Rural Co-operative Credit Institutions, including short-term and long-term credit institutions (Chart 3.1). During 2014-15, the UCBs witnessed a moderation in their asset growth and an increase in their net profits. During 2013-14, the balance sheets of all rural co-operative banks, except the short-term State Co-operative Banks (StCBs), witnessed either deceleration or reversal in growth. The state level short term and long-term rural co-operatives witnessed a decline in net profits. Urban co-operative banks 3.2 The consolidation of the UCBs continued as the number of UCBs came down from 1,606 in 2013 to 1,579 in 2015 (Chart 3.1). The Reserve Bank had ordered closure of six UCBs in September 2014 on account of charges of money laundering. Performance of UCBs 3.3 Growth in assets of UCBs witnessed moderation during 2014-15 as compared to the previous year (Chart 3.2). Slowdown in growth of assets was led by lower growth in ‘other assets’ of UCBs. Loan & advances grew by about 12 per cent and contributed significantly to the total increase in assets in 2014-15. 3.4 The UCBs performed well in terms of return on equity (RoE). Net interest margin (NIM), however, marginally moderated (Chart 3.3). There was a deceleration in growth of both interest income and interest expense while the growth in other income and other operating expenses increased during 2014-15 (Chart 3.4).
Asset quality 3.5 The gross non-performing advances (GNPAs) ratio witnessed an increase in 2014-15 over the previous year (Chart 3.5) with the GNPA ratio rising to 6.0 per cent at end-March 2015 from 5.7 per cent at end-March 2014. Net NPA ratio also increased from 2.2 per cent to 2.7 per cent during the same period. At end-March 2015, provisions grew at a lower rate than the increase in gross NPAs (Chart 3.6) resulting in a lower provisioning coverage ratio as compared to the previous years.
Developments with regard to UCBs 3.6 The High Powered Committee on Urban Co-operative Banks (Chairman: Shri R. Gandhi) recommended, inter alia, that the UCBs registered under Multi-state Co-operative Societies Act, 2002 and with business size (deposits plus advances) of ₹ 200 billion or more may be considered for conversion into commercial banks while UCBs of smaller size willing to convert to small finance banks (SFBs) can apply to the Reserve Bank for conversion if they fulfill all the eligibility criteria and the selection process prescribed by the Reserve Bank and if the licensing window for SFBs1 is open. In line with the committee’s observation on the growing deposits and advances of the UCBs, it is noteworthy that while the number of UCBs have fallen due to the mergers and amalgamations, the number of Tier II UCBs have been on the rise (from 412 at end March 2013 to 442 at end-March 2014 and further to 447 at end-March 2015).2 3.7 There has been a perceptible increase in the size of deposits and advances of UCBs (Charts 3.7 and 3.8). The capital base of the scheduled UCBs has also been increasing and six of the UCBs in 2014 qualified as per the minimum paid-up equity capital criteria for becoming small finance banks in 2014. The number of such UCBs stood at eight as at end-March, 2015. 3.8 The share of UCBs in the best rated category under the CAMELS model, ‘A’, increased from 24.7 per cent in 2013-14 to 28.4 per cent in 2014-15. However, the share of banking business under this category recorded a decline during 2014-15 (Chart 3.9). 3.9 The credit to deposit ratio has remained flat during the year. However, the investment to deposit ratio for all UCBs, has declined for two consecutive years (39.2 per cent in 2013 to 36.3 per cent in 2014 and further to 34.7 per cent in 2015). The SLR investment has witnessed a moderation while the non-SLR investments have witnessed an improved position over the previous year (Chart 3.10). Scheduled UCBs 3.10 There were 50 scheduled UCBs at end-March 2015 and their share in total assets of all UCBs increased, albeit marginally, over the years (Chart 3.11). 3.11 The balance sheet of scheduled UCBs expanded by 12 per cent in 2014-15 as against 15 per cent in 2013-14. While growth in deposits and loans and advances contributed the most in balance sheet expansion in 2013-14, the slow-down in 2014-15 was led by lower growth in other assets and liabilities. 3.12 Expenditure growth remained relatively higher than growth in income in 2014-15. Contribution of interest expenses to expenditure growth fell from 81.4 to 77.7 per cent in 2014-15. 3.13 The profitability indicators of scheduled UCBs remained stable during the period 2013-15 (Chart 3.12). Priority sector advances of UCBs 3.14 Priority sector advances of UCBs have increased from 48.9 per cent in 2013-14 to 49.4 per cent of their total advances during the period 2014-15. Credit to small enterprises and housing of the UCBs increased from the 2013 levels and continues to dominate the priority sector advances of these co-operatives with an urban focus. Advances to the agricultural sector continued to decline (Chart 3.13). However, the percentage of priority sector advances directed toward weaker sections (micro credit and micro and small enterprises) have improved during 2014 - 2015, indicating enhanced commitment to financial inclusion (Chart 3.14). Rural co-operative banks 3.15 The share of short-term credit co-operatives, comprising StCBs, District Central Co-operative Banks (DCCBs) and Primary Agricultural Credit Societies (PACS), stood at about 93 per cent of the total assets of the rural co-operative credit institutions as on March 31, 2014 while the long-term credit cooperatives accounted for the remaining (Table 3.1). | Table 3.1: A profile of rural co-operatives (as on March 31, 2014) | | (₹ billion) | | Item | Short-term | Long-term | | StCBs | DCCBs | PACs | SCARDBs | PCARDBs | | 1 | 2 | 3 | 4 | 5 | 6 | | A. Number of Cooperatives | 32 | 370 | 93042 | 20 | 714 | | B. Balance Sheet Indicators | | | | | | | i. Owned Funds (Capital +Reserve) | 129.9 | 273.7 | 189.2 | 68.7 | 53.0 | | ii. Deposits | 1043.7 | 2368.9 | 819.0 | 15.4 | 7.4 | | iii. Borrowings | 610.0 | 726.9 | 958.4 | 157.5 | 144.4 | | iv. Loans and Advances | 1031.2 | 2030.03 | 1300.5* | 204.0 | 128.9 | | v. Total Liabilities/Assets | 1904.1 | 3734.6 | 2124.3+ | 310.3 | 279.7 | | C. Financial Performance | | | | | | | I. Institutions in Profits | | | | | | | a. Number | 26 | 331 | 43327 | 8 | 372 | | b. Amount of Profit | 9.8 | 15.2 | 110.5 | 1.6 | 2.7 | | ii. Institutions in Loss | | | | | | | a. Number | 6 | 36 | 37662 | 11 | 340 | | b. Amount of Loss | 0.9 | 3.5 | 91.2 | 5.1 | 5.1 | | iii. Overall Profits (+)/Loss (-) | 8.9 | 11.7 | 19.3 | -3.5 | -2.4 | | D. Non-performing Assets | | | | | | | i. Amount | 57.0 | 209.0 | 296.3++ | 72.6 | 48.1 | | ii. As percentage of Loans Outstanding | 5.5 | 10.3 | 22.8 | 35.6 | 37.3 | | E. Recovery of Loans to Demand Ratio (Per cent) | 82.5 | 78.3 | NA | 33.3 | 43.9 | Note : * Loans & advances outstanding, + working capital, ++ total overdues, NA= not available
Source : NABARD and NAFSCOB. | Short term rural credit – StCBs and DCCBs 3.16 The balance sheet of both state and district co-operatives expanded during 2013-14, however, the expansion slowed down in 2013-14 for the DCCBs (Chart 3.15). This moderation has been on account of a fall in reserves. Income of StCBs in 2013-14 grew by 9.7 per cent as against an increase of 13 per cent in their expenditure during the same period. Major component that contributed to the variation in expenditure was a steep increase in provisioning and contingencies. The growth in net profits of DCCBs has decelerated sharply during 2013-14 on account of growth in both interest and non-interest expenses. The NPAs of DCCBs increased during the year 2013-14. In terms of financial stability indicators, the StCBs outperformed the DCCBs (Table 3.2). 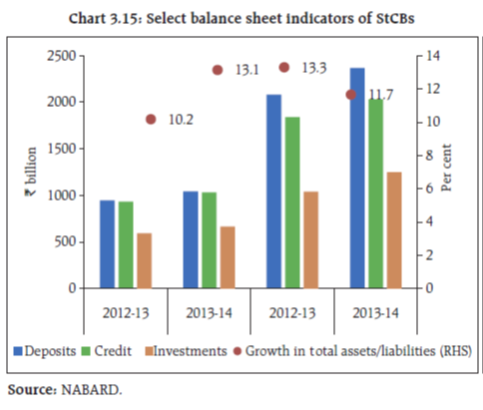
| Table 3.2: Soundness indicators of rural co-operative banks (short-term) | | (₹ billion) | | Item | StCBs | DCCBs | | As at end-March | Percentage Variation | As at end-March | Percentage Variation | | 2013 | 2014P | 2012-13 | 2013-14P | 2013 | 2014P | 2012-13 | 2013-14P | | 1 | 2 | 3 | 4 | 5 | 6 | 7 | 8 | 9 | | A. Total NPAs (i+ii+iii) | 56.3 | 57.0 | 4.1 | 1.2 | 180.5 | 209.0 | 12.1 | 15.8 | | i. Sub-standard | 20.6 | 20.7 | 28.7 | 0.5 | 78.7 | 100.2 | 25.0 | 27.3 | | | (36.6) | (36.3) | | | (43.6) | (47.9) | | | | ii. Doubtful | 19.9 | 26.1 | -17.1 | 31.2 | 76.2 | 86.9 | 7.3 | 14.0 | | | (35.4) | (45.9) | | | (42.2) | (42.6) | | | | iii. Loss | 15.8 | 10.2 | 5.3 | -35.4 | 25.6 | 21.9 | -5.2 | -14.4 | | | (28.1) | (17.9) | | | (14.2) | (10.5) | | | | B. NPA-to-Loans Ratio (%) | 6.1 | 5.5 | | | 9.9 | 10.3 | | | | C. Recovery-to-Demand Ratio (%) (as on 30 June of previous year) | 94.8 | 82.5 | | | 80.0 | 78.3 | | | P : Provisional.
Notes : 1. Figures in parentheses are percentages to total NPAs.
2. Due to conversion of figures in ₹ billion the total figures may not add up to exact total.
Source : NABARD. | 3.17 During 2013-14, the NPA ratio of StCBs fell across all regions except the southern region. The southern region showed an increase in NPA ratio (4.3 to 5.4 per cent) although the recovery ratio for the region increased as well. 3.18 At the district level, the DCCBs in the southern region saw a marginal increase in NPA ratio in 2013-14 and the recovery ratio at the district level also declined during the year. During 2013-14, the recovery ratio fell at the district level across all regions except western (71.4 to 75.2 per cent) and central regions (63.5 to 70.8 per cent). Primary agricultural credit societies (PACS) 3.19 After witnessing a growth in credit outstanding in 2012-13, the rate of credit growth of PACS slowed down in 2013-14 (Chart 3.16). 3.20 The overall borrower to member ratio, which is a useful indicator of access to credit from PACS, continued to fall from 2011-12 levels. Farmers – small and marginal–remain the majority members of the PACS and also have the highest borrower to member ratio among all groups. The borrower-member ratio has declined over the previous three years (Chart 3.17). 3.21 During 2013-14, the percentage of loss-making PACS remained stable and the percentage of PACS making profits increased marginally to 46.6 per cent (Chart 3.18). The eastern region, followed by the north-eastern region, continue to remain the weakest performing region with the loss-making PACS outnumbering the profit-making PACS (Chart 3.19). The northern and the central region continue to remain the strongest as the number of profit-making PACS are much higher than that of the loss-making PACS. Long term rural credit – state co-operative agriculture and rural development banks (SCARDBs) 3.22 Balance sheet growth for SCARDBs decelerated from eight per cent in 2012-13 to about one per cent in 2013-14. The growth in reserves and loans and advances has been outweighed by negative growth in ‘other liabilities’ and ‘other assets’. Among expenses, the share of operating expenses has fallen on account of fall in non-wage expenses that has off-set the increase in the wage expenses. Long term rural credit – primary co-operative agriculture and rural development banks (PCARDBs) 3.23 The balance sheet contraction in 2013-14 as opposed to balance sheet expansion during 2012-13, was broad based on account of fall in ‘other liabilities’, loans and advances and ‘other assets’ (Charts 3.20 and 3.21). 3.24 In 2013-14, income of PCARDBs increased at a higher rate than their expenditure. The NPA ratio of SCARBDs declined marginally while that of PCARDBs remained almost stable in 2013-14. However, the recovery ratio for both SCARDBs and PCARDBs has shown improvement (Table 3.3). | Table 3.3: Soundness indicators of rural co-operative banks (long-term) | | (₹ billion) | | Item | SCARDBs | PCARDBs | | As at end-March | Percentage Variation | As at end-March | Percentage Variation | | 2013 | 2014P | 2012-13 | 2013-14P | 2013 | 2014P | 2012-13 | 2013-14P | | 1 | 2 | 3 | 4 | 5 | 6 | 7 | 8 | 9 | | A. Total NPAs (i+ii+iii) | 67.5 | 72.6 | 4.9 | 7.5 | 49.8 | 48.1 | 7.7 | -3.4 | | i. Sub-standard | 28.2 | 31.0 | -4.9 | 10.3 | 23.2 | 22.1 | 10.6 | - 4.7 | | | (41.7) | (42.8) | | | (46.6) | (46.0) | | | | ii. Doubtful | 38.1 | 41.4 | 10.5 | 8.7 | 26.2 | 25.6 | 5.0 | -2.2 | | | (56.4) | (57.0) | | | (52.6) | (53.3) | | | | iii. Loss | 1.2 | 0.1 | 602.2 | -91.7 | 0.43 | 0.37 | 27.7 | -14.0 | | | (1.8) | (0.2) | | | (0.9) | (0.8) | | | | B. NPA-to-Loans Ratio (%) | 36 | 35.6 | | | 37.7 | 37.3 | | | | C. Recovery-to-Demand Ratio (%) (as on 30 June of previous year) | 32.3 | 33.3 | | | 41.7 | 44.0 | | | P : Provisional.
Notes : 1. Figures in parentheses are percentages to total NPAs.
2. Due to conversion of figures in ₹ billion the total figures may not add up to exact total.
Source : NABARD. |
|