Today, the Reserve Bank released the results of the November 2017 round of the Inflation Expectations Survey of Households (IESH)1. The survey was conducted in 18 cities and the results are based on responses from 5,100 urban households covering various occupational categories (Table 1). Highlights: -
Over 80 per cent of the respondents expected general prices to increase over the next quarter and over half of them also anticipated higher inflation. (Table 2) -
There was a marginal increase in inflation expectation for all product groups over both three months ahead and one year ahead horizons, when compared with the last survey round. -
Expectations of the one year ahead price levels of various product groups as well as the general price level remained elevated as observed in the previous round of the survey. -
The share of respondents with higher inflation expectations exceeded the proportions observed in the surveys conducted during the last one year for all product groups. -
Among product groups, expectations on food prices had the highest coherence with general prices movements, for both the one quarter ahead and one year ahead horizons. (Table 3) -
Three month ahead and one year ahead median inflation expectations increased by 30 basis points (bps) and 60 bps, respectively, over the previous survey round; compared to the November 2016 round of the survey, however, inflation expectations softened by 70 bps and 150 bps, respectively. (Table 4) 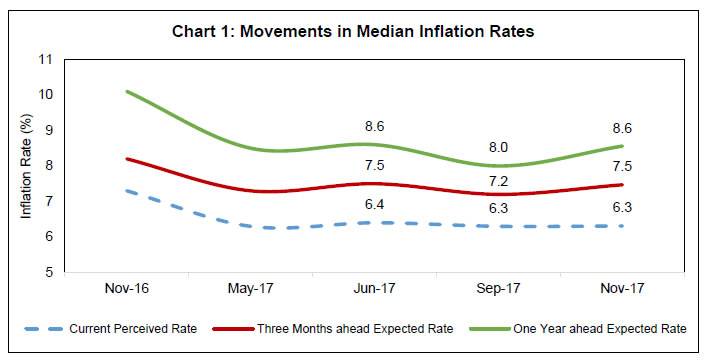 | Table 1: Respondents’ Profile (Category): Share in Total Sample - November 2017 | | Category of Respondents | Share in Total (%) | Target Share (%) | | Financial Sector Employees | 9.9 | 10.0 | | Other Employees | 15.1 | 15.0 | | Self-employed | 19.8 | 20.0 | | Homemakers | 29.8 | 30.0 | | Retired Persons | 9.2 | 10.0 | | Daily Workers | 10.7 | 10.0 | | Others | 5.7 | 5.0 |
| Table 2: Product-wise Expectations of Prices for Three Months ahead and One Year ahead | | (Percentage of Respondents) | | Round | Nov-16 | May-17 | Jun-17 | Sep-17 | Nov-17 | Nov-16 | May-17 | Jun-17 | Sep-17 | Nov-17 | | Options: General | Three Months Ahead | One Year Ahead | | Prices will increase | 76.0 | 70.2 | 77.2 | 81.3 | 81.4 | 86.3 | 80.9 | 82.4 | 93.5 | 92.8 | | Price increase more than current rate | 40.1 | 35.9 | 39.9 | 50.5 | 53.2 | 49.8 | 46.3 | 44.1 | 61.2 | 64.1 | | Price increase similar to current rate | 23.9 | 25.0 | 26.6 | 25.4 | 23.1 | 25.1 | 26.4 | 28.3 | 27.3 | 23.8 | | Price increase less than current rate | 12.0 | 9.3 | 10.7 | 5.4 | 5.1 | 11.4 | 8.2 | 10.1 | 5.0 | 4.8 | | No change in prices | 18.8 | 25.2 | 16.8 | 15.8 | 16.3 | 10.0 | 14.3 | 11.2 | 4.1 | 5.5 | | Decline in prices | 5.2 | 4.6 | 6.0 | 2.9 | 2.3 | 3.7 | 4.8 | 6.4 | 2.5 | 1.8 | | Options: Food Product | Three Months Ahead | One Year Ahead | | Prices will increase | 71.2 | 73.7 | 71.6 | 79.5 | 80.3 | 82.0 | 79.8 | 75.8 | 84.8 | 85.7 | | Price increase more than current rate | 35.2 | 38.6 | 39.1 | 47.5 | 50.4 | 43.0 | 42.1 | 38.0 | 51.4 | 54.0 | | Price increase similar to current rate | 23.2 | 23.6 | 21.8 | 24.8 | 23.2 | 26.5 | 27.2 | 26.8 | 27.5 | 25.2 | | Price increase less than current rate | 12.9 | 11.5 | 10.7 | 7.3 | 6.7 | 12.5 | 10.6 | 11.0 | 6.0 | 6.5 | | No change in prices | 21.2 | 18.2 | 14.2 | 13.3 | 12.9 | 13.3 | 11.9 | 12.4 | 9.3 | 9.0 | | Decline in prices | 7.6 | 8.1 | 14.3 | 7.1 | 6.8 | 4.6 | 8.2 | 11.8 | 5.9 | 5.3 | | Options: Non-Food Product | Three Months Ahead | One Year Ahead | | Prices will increase | 57.9 | 66.3 | 72.1 | 74.7 | 75.7 | 70.9 | 73.9 | 74.8 | 81.4 | 81.4 | | Price increase more than current rate | 28.4 | 32.4 | 36.9 | 43.4 | 47.1 | 34.5 | 37.1 | 36.3 | 48.2 | 51.2 | | Price increase similar to current rate | 19.2 | 23.4 | 23.6 | 24.8 | 21.9 | 24.0 | 25.7 | 27.3 | 26.7 | 23.5 | | Price increase less than current rate | 10.3 | 10.6 | 11.6 | 6.6 | 6.7 | 12.3 | 11.1 | 11.2 | 6.5 | 6.8 | | No change in prices | 36.3 | 26.9 | 18.1 | 19.3 | 19.5 | 24.0 | 19.1 | 16.3 | 13.8 | 14.4 | | Decline in prices | 5.8 | 6.8 | 9.8 | 5.9 | 4.8 | 5.2 | 7.0 | 9.0 | 4.8 | 4.2 | | Options: Household Durables | Three Months Ahead | One Year Ahead | | Prices will increase | 51.5 | 51.1 | 65.4 | 61.5 | 61.9 | 67.6 | 62.1 | 70.3 | 70.7 | 71.0 | | Price increase more than current rate | 24.9 | 25.1 | 34.7 | 37.3 | 38.6 | 33.9 | 31.9 | 35.7 | 42.7 | 44.5 | | Price increase similar to current rate | 16.8 | 17.1 | 20.6 | 19.1 | 17.4 | 22.3 | 21.5 | 24.3 | 22.6 | 20.7 | | Price increase less than current rate | 9.9 | 8.9 | 10.1 | 5.1 | 5.8 | 11.4 | 8.8 | 10.3 | 5.4 | 5.8 | | No change in prices | 36.9 | 33.6 | 20.6 | 25.3 | 26.8 | 22.9 | 24.9 | 17.5 | 19.1 | 20.3 | | Decline in prices | 11.6 | 15.3 | 14.0 | 13.2 | 11.3 | 9.4 | 13.0 | 12.2 | 10.2 | 8.7 | | Options: Housing Prices | Three Months Ahead | One Year Ahead | | Prices will increase | 65.4 | 57.3 | 64.3 | 68.9 | 70.5 | 79.6 | 69.7 | 73.4 | 78.9 | 78.8 | | Price increase more than current rate | 38.4 | 33.2 | 37.1 | 44.9 | 48.4 | 49.6 | 39.7 | 42.2 | 53.0 | 54.5 | | Price increase similar to current rate | 17.9 | 17.0 | 18.6 | 19.2 | 17.0 | 20.5 | 22.7 | 22.4 | 20.8 | 19.4 | | Price increase less than current rate | 9.0 | 7.1 | 8.7 | 4.9 | 5.0 | 9.6 | 7.3 | 8.8 | 5.1 | 4.9 | | No change in prices | 26.4 | 26.4 | 22.0 | 20.0 | 20.1 | 13.9 | 17.4 | 15.1 | 12.4 | 13.6 | | Decline in prices | 8.2 | 16.2 | 13.6 | 11.1 | 9.5 | 6.5 | 12.9 | 11.5 | 8.8 | 7.7 | | Options: Cost of Services | Three Months Ahead | One Year Ahead | | Prices will increase | 61.3 | 61.3 | 68.9 | 68.7 | 71.1 | 80.7 | 75.5 | 78.6 | 82.9 | 83.4 | | Price increase more than current rate | 30.6 | 29.4 | 35.1 | 40.7 | 44.3 | 41.5 | 37.3 | 38.8 | 48.6 | 51.5 | | Price increase similar to current rate | 19.8 | 21.7 | 23.7 | 22.5 | 20.7 | 26.9 | 26.8 | 27.8 | 27.9 | 25.2 | | Price increase less than current rate | 10.8 | 10.2 | 10.2 | 5.5 | 6.2 | 12.3 | 11.4 | 12.0 | 6.4 | 6.7 | | No change in prices | 36.0 | 33.0 | 25.3 | 27.3 | 25.8 | 16.7 | 19.1 | 15.6 | 13.5 | 14.0 | | Decline in prices | 2.8 | 5.7 | 5.8 | 4.0 | 3.1 | 2.6 | 5.5 | 5.9 | 3.7 | 2.6 | | Note: Constituent items may not add up to totals, due to rounding off. |
| Table 3: Households Expecting General Price Movements in Coherence with Movements in Price Expectations of Various Product Groups: Three Months Ahead and One Year Ahead | | (Percentage of Respondents) | | Round No. | Survey period ended | Food | Non-Food | Households durables | Housing | Cost of services | | Three Months Ahead | | 45B | Nov-16 | 62.1 | 50.2 | 43.2 | 45.7 | 46.8 | | 47B | May-17 | 59.8 | 59.7 | 51.0 | 52.5 | 60.3 | | 48 | Jun-17 | 62.0 | 64.3 | 57.2 | 57.6 | 63.4 | | 49 | Sep-17 | 66.8 | 65.8 | 56.8 | 60.1 | 64.9 | | 49B | Nov-17 | 66.6 | 67.4 | 57.1 | 60.3 | 65.7 | | One Year Ahead | | 45B | Nov-16 | 65.0 | 55.0 | 50.4 | 53.7 | 56.9 | | 47B | May-17 | 66.8 | 64.4 | 56.4 | 58.7 | 67.3 | | 48 | Jun-17 | 68.2 | 67.7 | 62.0 | 63.2 | 70.0 | | 49 | Sep-17 | 72.7 | 69.9 | 60.5 | 67.4 | 69.8 | | 49B | Nov-17 | 72.7 | 70.5 | 60.9 | 66.2 | 71.3 |
| Table 4: Household Inflation Expectations – Current, Three Months and One Year Ahead | | Survey Round | Survey Period Ended | Inflation rate in Per cent | | Current | Three Months Ahead | One Year Ahead | | Mean | Median | Std. Dev. | Mean | Median | Std. Dev. | Mean | Median | Std. Dev. | | 45B | Nov-16 | 8.3 | 7.3 | 4.3 | 9.1 | 8.2 | 4.5 | 10.5 | 10.1 | 4.3 | | 47B | May-17 | 7.5 | 6.3 | 4.0 | 8.1 | 7.3 | 4.2 | 9.2 | 8.5 | 4.3 | | 48 | Jun-17 | 7.3 | 6.4 | 3.8 | 8.1 | 7.5 | 3.9 | 9.1 | 8.6 | 4.1 | | 49 | Sep-17 | 7.6 | 6.3 | 3.9 | 8.2 | 7.2 | 4.0 | 8.7 | 8.0 | 4.5 | | 49B | Nov-17 | 7.7 | 6.3 | 4.1 | 8.4 | 7.5 | 4.2 | 8.9 | 8.6 | 4.6 |
| Table 5: Factors that Explain the Total Variability | | Round No. | Survey Period Ended | Current | Three Months Ahead | One Year Ahead | | 45B | Nov-16 | City, Category, Age-Group | City, Category | City, Category | | 47B | May-17 | City, Gender, Category | City, Category | City, Category | | 48 | Jun-17 | City, Age-Group, Category | City, Age-Group, Category | City, Age-Group, Category | | 49 | Sep-17 | City, Gender, Category | City, Age-Group, Category | City, Gender, Category | | 49B | Nov-17 | City, Category, Age-Group | City, Category | City, Category |
| Table 6 : Various Group-wise Inflation Expectations: November 2017 | | | Current | Three Months Ahead | One Year Ahead | | Mean | Median | Std. Dev. | Mean | Median | Std. Dev. | Mean | Median | Std. Dev. | | Overall | 7.7 | 6.3 | 4.1 | 8.4 | 7.5 | 4.2 | 8.9 | 8.6 | 4.6 | | Gender-wise | | Male | 7.7 | 6.5 | 4.1 | 8.4 | 7.5 | 4.2 | 8.8 | 8.4 | 4.7 | | Female | 7.7 | 6.1 | 4.0 | 8.5 | 7.5 | 4.1 | 9.2 | 8.7 | 4.6 | | Category-wise | | Financial Sector Employees | 7.3 | 6.3 | 3.8 | 7.9 | 7.2 | 4.0 | 8.4 | 8.3 | 4.6 | | Other Employees | 7.6 | 6.0 | 4.1 | 8.4 | 7.4 | 4.1 | 8.6 | 8.1 | 4.6 | | Self Employed | 7.9 | 6.7 | 4.1 | 8.4 | 7.6 | 4.1 | 9.0 | 8.8 | 4.7 | | Homemakers | 7.7 | 6.1 | 4.0 | 8.5 | 7.4 | 4.1 | 9.2 | 8.8 | 4.6 | | Retired Persons | 8.4 | 6.7 | 4.6 | 9.1 | 7.9 | 4.6 | 9.4 | 8.9 | 5.0 | | Daily Workers | 7.6 | 6.2 | 4.0 | 8.4 | 7.5 | 4.1 | 8.8 | 8.7 | 4.7 | | Other category | 7.3 | 6.4 | 3.9 | 8.0 | 7.3 | 4.0 | 8.5 | 8.3 | 4.6 | | Age Group-wise | | Up to 25 years | 6.9 | 6.1 | 3.5 | 7.7 | 7.1 | 3.5 | 8.4 | 8.3 | 4.2 | | 25 to 30 years | 7.3 | 6.0 | 3.7 | 8.1 | 7.2 | 3.8 | 8.6 | 8.1 | 4.4 | | 30 to 35 years | 7.5 | 6.1 | 4.0 | 8.3 | 7.3 | 4.2 | 8.8 | 8.2 | 4.5 | | 35 to 40 years | 8.0 | 6.4 | 4.2 | 8.6 | 7.5 | 4.4 | 9.0 | 8.6 | 4.8 | | 40 to 45 years | 7.7 | 6.1 | 3.9 | 8.4 | 7.6 | 4.0 | 9.0 | 8.9 | 4.5 | | 45 to 50 years | 8.4 | 7.1 | 4.4 | 9.0 | 8.1 | 4.5 | 9.4 | 9.5 | 5.1 | | 50 to 55 years | 8.3 | 7.0 | 4.5 | 8.8 | 8.1 | 4.5 | 9.0 | 8.9 | 4.9 | | 55 to 60 years | 8.3 | 6.8 | 4.4 | 9.0 | 8.1 | 4.4 | 9.4 | 9.0 | 4.8 | | 60 years and above | 8.4 | 6.8 | 4.6 | 9.2 | 8.0 | 4.6 | 9.6 | 9.3 | 5.0 | | City-wise | | Ahmedabad | 8.8 | 8.5 | 3.7 | 9.3 | 9.0 | 3.8 | 9.7 | 10.0 | 3.9 | | Bengaluru | 4.2 | 4.1 | 1.5 | 5.0 | 4.8 | 1.9 | 5.2 | 5.2 | 2.5 | | Bhopal | 7.1 | 5.7 | 4.0 | 7.5 | 6.4 | 4.7 | 7.4 | 6.5 | 5.0 | | Bhubaneswar | 9.4 | 10.1 | 4.2 | 10.7 | 10.7 | 4.4 | 11.6 | 12.3 | 4.7 | | Chennai | 8.3 | 6.6 | 4.0 | 9.6 | 8.3 | 3.9 | 11.1 | 10.5 | 4.0 | | Delhi | 7.2 | 6.0 | 4.1 | 7.5 | 6.4 | 4.1 | 7.5 | 6.5 | 4.3 | | Guwahati | 13.7 | 16.1 | 4.1 | 12.5 | 15.4 | 4.9 | 13.2 | 16.1 | 5.1 | | Hyderabad | 7.0 | 6.5 | 2.1 | 7.7 | 7.1 | 2.2 | 9.0 | 8.4 | 2.3 | | Jaipur | 7.4 | 5.9 | 3.0 | 8.1 | 6.8 | 3.6 | 7.8 | 7.1 | 4.5 | | Kolkata | 9.8 | 9.0 | 4.4 | 10.5 | 9.8 | 4.4 | 11.2 | 10.6 | 4.4 | | Lucknow | 7.3 | 6.4 | 3.3 | 8.1 | 7.7 | 3.5 | 8.9 | 9.5 | 4.3 | | Mumbai | 6.9 | 6.7 | 3.3 | 7.9 | 7.8 | 3.4 | 8.3 | 8.4 | 4.5 | | Nagpur | 6.5 | 5.5 | 3.8 | 7.4 | 6.5 | 3.6 | 7.1 | 6.8 | 4.0 | | Patna | 6.2 | 5.9 | 2.3 | 6.9 | 6.6 | 2.3 | 7.5 | 7.6 | 3.0 | | Thiruvananthapuram | 8.9 | 8.1 | 4.2 | 9.9 | 9.6 | 4.8 | 10.2 | 10.6 | 5.9 | | Chandigarh | 8.3 | 6.2 | 5.1 | 8.6 | 7.0 | 5.3 | 7.7 | 6.3 | 5.9 | | Ranchi | 5.7 | 5.6 | 1.9 | 6.3 | 6.2 | 2.0 | 7.2 | 7.3 | 2.7 | | Raipur | 5.0 | 5.1 | 1.9 | 6.6 | 6.2 | 2.7 | 8.1 | 8.0 | 3.2 |
| Table 7: Cross-tabulation of Current and Three Months Ahead Inflation Expectations: November 2017 | | (Number of Respondents) | | Three Months Ahead Inflation Rate (per cent) | Current Inflation Rate
(per cent) | | <1 | 1-<2 | 2-<3 | 3-<4 | 4-<5 | 5-<6 | 6-<7 | 7-<8 | 8-<9 | 9-<10 | 10-<11 | 11-<12 | 12-<13 | 13-<14 | 14-<15 | 15-<16 | >=16 | No idea | Total | | <1 | 24 | 3 | 4 | 0 | 0 | 1 | 1 | 0 | 1 | 0 | 0 | 0 | 0 | 0 | 0 | 0 | 0 | 0 | 34 | | 1-<2 | 1 | 26 | 10 | 5 | 0 | 0 | 1 | 0 | 0 | 0 | 0 | 0 | 0 | 0 | 0 | 0 | 0 | 0 | 43 | | 2-<3 | 2 | 12 | 132 | 53 | 41 | 15 | 3 | 0 | 0 | 0 | 0 | 0 | 0 | 0 | 0 | 0 | 1 | 0 | 259 | | 3-<4 | 5 | 2 | 8 | 169 | 88 | 53 | 15 | 8 | 1 | 1 | 1 | 0 | 0 | 0 | 0 | 0 | 0 | 2 | 353 | | 4-<5 | 7 | 0 | 5 | 6 | 199 | 106 | 64 | 16 | 6 | 3 | 6 | 0 | 0 | 0 | 0 | 0 | 1 | 1 | 420 | | 5-<6 | 14 | 3 | 6 | 17 | 21 | 530 | 278 | 278 | 70 | 10 | 50 | 0 | 2 | 0 | 0 | 5 | 1 | 1 | 1286 | | 6-<7 | 6 | 2 | 2 | 2 | 3 | 8 | 213 | 148 | 76 | 22 | 9 | 1 | 3 | 0 | 0 | 0 | 0 | 0 | 495 | | 7-<8 | 6 | 1 | 0 | 1 | 2 | 5 | 10 | 171 | 129 | 74 | 46 | 2 | 6 | 0 | 0 | 0 | 0 | 0 | 453 | | 8-<9 | 3 | 0 | 0 | 0 | 1 | 4 | 8 | 1 | 105 | 74 | 73 | 4 | 9 | 1 | 0 | 0 | 3 | 0 | 286 | | 9-<10 | 0 | 0 | 0 | 0 | 0 | 1 | 0 | 4 | 5 | 74 | 41 | 24 | 12 | 2 | 1 | 1 | 2 | 1 | 168 | | 10-<11 | 0 | 0 | 0 | 1 | 1 | 7 | 0 | 5 | 5 | 6 | 233 | 22 | 92 | 23 | 5 | 89 | 23 | 0 | 512 | | 11-<12 | 0 | 0 | 0 | 0 | 0 | 1 | 0 | 0 | 1 | 0 | 1 | 21 | 9 | 12 | 3 | 4 | 3 | 2 | 57 | | 12-<13 | 0 | 0 | 0 | 0 | 0 | 0 | 0 | 0 | 0 | 1 | 4 | 0 | 14 | 6 | 4 | 5 | 3 | 0 | 37 | | 13-<14 | 0 | 0 | 0 | 0 | 0 | 0 | 1 | 1 | 1 | 0 | 0 | 0 | 0 | 2 | 2 | 7 | 3 | 1 | 18 | | 14-<15 | 0 | 0 | 0 | 0 | 1 | 1 | 0 | 2 | 0 | 0 | 2 | 1 | 2 | 1 | 12 | 4 | 9 | 1 | 36 | | 15-<16 | 0 | 0 | 0 | 0 | 0 | 1 | 0 | 2 | 0 | 0 | 3 | 0 | 1 | 0 | 0 | 37 | 39 | 1 | 84 | | >=16 | 0 | 0 | 0 | 4 | 1 | 7 | 4 | 2 | 0 | 0 | 12 | 0 | 0 | 0 | 0 | 14 | 503 | 12 | 559 | | Total | 68 | 49 | 167 | 258 | 358 | 740 | 598 | 638 | 400 | 265 | 481 | 75 | 150 | 47 | 27 | 166 | 591 | 22 | 5100 |
| Table 8: Cross-tabulation of Current and One Year Ahead Inflation Expectations: November 2017 | | (Number of Respondents) | | One Year Ahead Inflation Rate (per cent) | Current Inflation Rate
(per cent) | | <1 | 1-<2 | 2-<3 | 3-<4 | 4-<5 | 5-<6 | 6-<7 | 7-<8 | 8-<9 | 9-<10 | 10-<11 | 11-<12 | 12-<13 | 13-<14 | 14-<15 | 15-<16 | >=16 | No idea | Total | | <1 | 23 | 1 | 5 | 0 | 0 | 2 | 0 | 2 | 0 | 1 | 0 | 0 | 0 | 0 | 0 | 0 | 0 | 0 | 34 | | 1-<2 | 6 | 20 | 3 | 8 | 3 | 2 | 0 | 0 | 0 | 0 | 0 | 0 | 0 | 0 | 0 | 0 | 0 | 1 | 43 | | 2-<3 | 40 | 4 | 76 | 45 | 47 | 16 | 15 | 6 | 4 | 1 | 3 | 0 | 0 | 0 | 1 | 0 | 1 | 0 | 259 | | 3-<4 | 36 | 1 | 2 | 115 | 59 | 66 | 20 | 20 | 13 | 9 | 7 | 0 | 3 | 0 | 0 | 0 | 1 | 1 | 353 | | 4-<5 | 31 | 0 | 0 | 1 | 131 | 66 | 76 | 28 | 43 | 15 | 19 | 1 | 6 | 0 | 1 | 1 | 0 | 1 | 420 | | 5-<6 | 90 | 1 | 2 | 6 | 9 | 340 | 134 | 218 | 141 | 134 | 146 | 15 | 23 | 1 | 1 | 14 | 8 | 3 | 1286 | | 6-<7 | 31 | 0 | 2 | 0 | 2 | 4 | 129 | 65 | 111 | 45 | 50 | 11 | 23 | 5 | 5 | 10 | 1 | 1 | 495 | | 7-<8 | 22 | 0 | 0 | 0 | 1 | 1 | 1 | 113 | 76 | 79 | 74 | 12 | 26 | 5 | 9 | 26 | 4 | 4 | 453 | | 8-<9 | 16 | 0 | 1 | 0 | 2 | 2 | 3 | 2 | 71 | 26 | 77 | 26 | 30 | 5 | 9 | 11 | 4 | 1 | 286 | | 9-<10 | 6 | 0 | 0 | 1 | 0 | 0 | 0 | 3 | 1 | 52 | 29 | 28 | 20 | 6 | 7 | 9 | 4 | 2 | 168 | | 10-<11 | 26 | 0 | 0 | 0 | 0 | 4 | 1 | 6 | 2 | 1 | 169 | 18 | 52 | 19 | 15 | 87 | 108 | 4 | 512 | | 11-<12 | 2 | 0 | 0 | 0 | 0 | 1 | 0 | 1 | 0 | 1 | 0 | 14 | 0 | 10 | 2 | 13 | 12 | 1 | 57 | | 12-<13 | 2 | 0 | 0 | 0 | 0 | 0 | 0 | 0 | 0 | 0 | 1 | 0 | 11 | 3 | 5 | 8 | 7 | 0 | 37 | | 13-<14 | 0 | 0 | 0 | 0 | 0 | 0 | 0 | 0 | 1 | 0 | 1 | 0 | 0 | 5 | 1 | 1 | 8 | 1 | 18 | | 14-<15 | 2 | 0 | 0 | 0 | 0 | 1 | 0 | 0 | 0 | 0 | 1 | 1 | 3 | 1 | 8 | 3 | 14 | 2 | 36 | | 15-<16 | 3 | 0 | 0 | 0 | 0 | 0 | 0 | 0 | 0 | 0 | 3 | 0 | 1 | 0 | 1 | 30 | 45 | 1 | 84 | | >=16 | 35 | 0 | 0 | 1 | 1 | 2 | 0 | 0 | 0 | 0 | 6 | 1 | 0 | 0 | 0 | 16 | 478 | 19 | 559 | | Total | 371 | 27 | 91 | 177 | 255 | 507 | 379 | 464 | 463 | 364 | 586 | 127 | 198 | 60 | 65 | 229 | 695 | 42 | 5100 |
|