Today, the Reserve Bank released the results of the 82nd round of the Industrial Outlook Survey (IOS) conducted in April-June 2018. The Survey captures qualitative assessments of the business environment by companies in India’s manufacturing sector for Q1:2018-19 and their expectations for Q2:2018-191. Responses were received from 1207 companies in this round of the survey. Highlights: -
Respondents were less optimistic on demand conditions in Q1:2018-19 than in Q4:2017-18, as revealed in their assessment of production, order books, capacity utilisation and exports. -
In their view, the overall financial situation deteriorated slightly on account of overseas finance. However, sentiment on the availability of finance from banks and other sources remained stable. -
The outlook on selling price remained positive. Respondents continued to perceive a drop in profit margins due to higher input (raw material) prices and rising cost of finance. -
Overall, business sentiment in the Indian manufacturing sector deteriorated marginally, as reflected in drop in the Business Expectations Index (BEI)2 from 112.4 in Q4:2017-18 to 108.4 in Q1:2018-19. 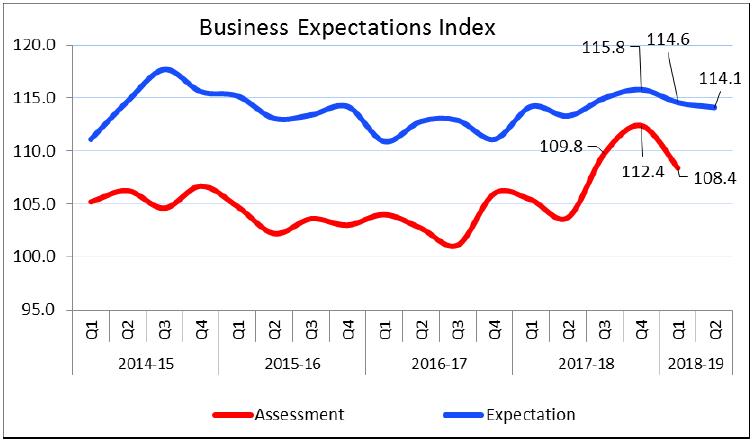 -
As regards their expectations for Q2: 2018-19, respondents were optimistic in the outlook on demand conditions. -
Their sentiments on availability of finance remained stable. -
There was a slight deterioration in the outlook on selling prices, however, profit margins are expected to remain unchanged. -
The BEI declined from 114.6 in Q1:2018-19 to 114.1 in Q2:2018-19. Summary Table
Net response3 (in %) comparison over previous quarter | | Parameters | Assessment period | Expectation period | | Q4:2017-18 | Q1:2018-19 | Q1:2018-19 | Q2:2018-19 | | Production | 27.3 | 25.4 | 29.5 | 33.2 | | Order Books | 24.5 | 22.7 | 28.4 | 27.7 | | Pending Orders | 10.3 | 7.3 | 7.6 | 4.4 | | Capacity Utilisation | 14.8 | 12.0 | 17.9 | 21.6 | | Exports | 12.5 | 9.1 | 18.6 | 18.5 | | Imports | 11.0 | 11.2 | 13.8 | 13.3 | | Employment | 9.4 | 10.9 | 11.1 | 12.9 | | Financial Situation (Overall) | 22.4 | 20.7 | 28.0 | 27.9 | | Availability of Finance (from internal accruals) | 14.7 | 16.0 | 18.2 | 18.6 | | Availability of Finance (from banks & other sources) | 11.9 | 11.7 | 14.6 | 14.3 | | Availability of Finance (from overseas, if applicable) | 3.4 | 1.4 | 4.3 | 4.4 | | Cost of Finance | -10.3 | -19.9 | -12.2 | -19.3 | | Cost of Raw Material | -49.5 | -53.0 | -39.0 | -43.4 | | Selling Price | 6.7 | 11.5 | 10.4 | 8.8 | | Profit Margin | -9.9 | -10.3 | -0.7 | 0.0 | | Overall Business Situation | 30.2 | 29.6 | 36.9 | 34.6 | | Salary | 26.6 | 40.0 | 35.0 | 31.6 | | Note: Please see the excel file for time series data |
| Table 1: Assessment & Expectation for Production | | (Percentage responses)@ | | Quarter | Total response | Assessment | Expectation | | Increase | Decrease | No change | Net response# | Increase | Decrease | No change | Net response# | | Q1:2017-18 | 1250 | 34.5 | 18.5 | 46.9 | 16.0 | 41.5 | 11.7 | 46.8 | 29.9 | | Q2:2017-18 | 1141 | 34.9 | 18.5 | 46.6 | 16.4 | 42.2 | 12.0 | 45.8 | 30.2 | | Q3:2017-18 | 1299 | 36.8 | 14.7 | 48.5 | 22.0 | 43.4 | 9.1 | 47.5 | 34.3 | | Q4:2017-18 | 1250 | 40.7 | 13.4 | 45.9 | 27.3 | 42.5 | 8.4 | 49.2 | 34.1 | | Q1:2018-19 | 1207 | 39.4 | 14.0 | 46.6 | 25.4 | 40.4 | 11.0 | 48.6 | 29.5 | | Q2:2018-19 | | | | | | 43.0 | 9.8 | 47.2 | 33.2 | ‘Increase’ in production is optimistic.
@:Due to rounding off percentage may not add up to 100.
#: Net Response (NR) is the difference of percentage of the respondents reporting optimism and that reporting pessimism. The range is -100 to 100. Any value greater than zero indicates expansion and any value less than zero indicates contraction. |
| Table 2: Assessment & Expectation for Order Books | | (Percentage responses) | | Quarter | Total response | Assessment | Expectation | | Increase | Decrease | No change | Net response | Increase | Decrease | No change | Net response | | Q1:2017-18 | 1250 | 32.7 | 19.0 | 48.3 | 13.7 | 39.6 | 11.5 | 48.9 | 28.0 | | Q2:2017-18 | 1141 | 31.8 | 19.7 | 48.5 | 12.1 | 39.7 | 11.7 | 48.6 | 28.0 | | Q3:2017-18 | 1299 | 35.4 | 16.2 | 48.4 | 19.2 | 39.6 | 9.6 | 50.8 | 29.9 | | Q4:2017-18 | 1250 | 38.9 | 14.4 | 46.6 | 24.5 | 40.5 | 10.2 | 49.2 | 30.3 | | Q1:2018-19 | 1207 | 36.2 | 13.5 | 50.3 | 22.7 | 38.8 | 10.4 | 50.8 | 28.4 | | Q2:2018-19 | | | | | | 38.4 | 10.8 | 50.8 | 27.7 | | ‘Increase’ in order books is optimistic. Footnotes ‘@’ and ‘#’ given in Table 1 are applicable here. |
| Table 3: Assessment & Expectation for Pending Orders | | (Percentage responses) | | Quarter | Total response | Assessment | Expectation | | Above Normal | Below Normal | Normal | Net response | Above Normal | Below Normal | Normal | Net response | | Q1:2017-18 | 1250 | 5.7 | 17.0 | 77.3 | 11.3 | 4.9 | 13.4 | 81.8 | 8.5 | | Q2:2017-18 | 1141 | 4.2 | 17.9 | 77.9 | 13.7 | 6.5 | 12.5 | 81.0 | 6.0 | | Q3:2017-18 | 1299 | 6.7 | 16.2 | 77.1 | 9.5 | 4.7 | 11.4 | 83.9 | 6.7 | | Q4:2017-18 | 1250 | 4.5 | 14.8 | 80.7 | 10.3 | 6.8 | 12.5 | 80.7 | 5.7 | | Q1:2018-19 | 1207 | 5.1 | 12.4 | 82.4 | 7.3 | 4.9 | 12.6 | 82.5 | 7.6 | | Q2:2018-19 | | | | | | 6.3 | 10.7 | 83.0 | 4.4 | | Pending orders ‘Below Normal’ is optimistic. Footnotes ‘@’ and ‘#’ given in Table 1 are applicable here. |
| Table 4: Assessment & Expectation for Capacity Utilisation (Main Product) | | (Percentage responses) | | Quarter | Total response | Assessment | Expectation | | Increase | Decrease | No change | Net response | Increase | Decrease | No change | Net response | | Q1:2017-18 | 1250 | 22.5 | 15.4 | 62.0 | 7.1 | 28.1 | 10.9 | 61.0 | 17.2 | | Q2:2017-18 | 1141 | 22.9 | 15.8 | 61.3 | 7.1 | 27.6 | 11.3 | 61.1 | 16.3 | | Q3:2017-18 | 1299 | 23.9 | 12.7 | 63.4 | 11.3 | 28.8 | 8.0 | 63.2 | 20.8 | | Q4:2017-18 | 1250 | 27.4 | 12.6 | 60.0 | 14.8 | 28.4 | 8.9 | 62.7 | 19.5 | | Q1:2018-19 | 1207 | 24.5 | 12.5 | 63.0 | 12.0 | 27.8 | 9.8 | 62.4 | 17.9 | | Q2:2018-19 | | | | | | 29.3 | 7.7 | 63.0 | 21.6 | | ‘Increase’ in capacity utilisation is optimistic. Footnotes ‘@’ and ‘#’ given in Table 1 are applicable here. |
| Table 5: Assessment & Expectation for Level of CU (compared to the average in last 4 quarters) | | (Percentage responses) | | Quarter | Total response | Assessment | Expectation | | Above Normal | Below Normal | Normal | Net response | Above Normal | Below Normal | Normal | Net response | | Q1:2017-18 | 1250 | 8.4 | 15.1 | 76.5 | -6.7 | 9.9 | 12.2 | 77.9 | -2.3 | | Q2:2017-18 | 1141 | 9.7 | 15.6 | 74.7 | -6.0 | 9.7 | 10.8 | 79.5 | -1.1 | | Q3:2017-18 | 1299 | 10.3 | 14.1 | 75.6 | -3.8 | 11.4 | 9.6 | 79.0 | 1.8 | | Q4:2017-18 | 1250 | 12.6 | 13.5 | 73.9 | -0.9 | 13.0 | 10.7 | 76.2 | 2.3 | | Q1:2018-19 | 1207 | 11.0 | 12.9 | 76.1 | -2.0 | 13.0 | 10.6 | 76.5 | 2.4 | | Q2:2018-19 | | | | | | 11.8 | 9.3 | 78.9 | 2.5 | | ‘Above Normal’ in Level of capacity utilisation is optimistic. Footnotes ‘@’ and ‘#’ given in Table 1 are applicable here. |
| Table 6: Assessment & Expectation for Assessment of Production Capacity (with regard to expected demand in next 6 months) | | (Percentage responses) | | Quarter | Total response | Assessment | Expectation | | More than adequate | Less than adequate | Adequate | Net response | More than adequate | Less than adequate | Adequate | Net response | | Q1:2017-18 | 1250 | 12.3 | 7.4 | 80.3 | 4.9 | 13.2 | 6.7 | 80.0 | 6.5 | | Q2:2017-18 | 1141 | 10.4 | 7.4 | 82.2 | 3.0 | 12.2 | 6.6 | 81.2 | 5.6 | | Q3:2017-18 | 1299 | 11.8 | 7.1 | 81.2 | 4.7 | 11.1 | 6.5 | 82.4 | 4.6 | | Q4:2017-18 | 1250 | 12.2 | 6.3 | 81.4 | 5.9 | 12.9 | 6.9 | 80.2 | 6.0 | | Q1:2018-19 | 1207 | 10.5 | 6.6 | 82.9 | 3.9 | 13.0 | 6.0 | 81.0 | 7.0 | | Q2:2018-19 | | | | | | 11.3 | 6.0 | 82.7 | 5.2 | | ‘More than adequate’ in Assessment of Production Capacity is optimistic. Footnotes ‘@’ and ‘#’ given in Table 1 are applicable here. |
| Table 7: Assessment & Expectation for Exports | | (Percentage responses) | | Quarter | Total response | Assessment | Expectation | | Increase | Decrease | No change | Net response | Increase | Decrease | No change | Net response | | Q1:2017-18 | 1250 | 22.2 | 18.8 | 59.0 | 3.4 | 26.4 | 11.3 | 62.3 | 15.1 | | Q2:2017-18 | 1141 | 24.2 | 15.4 | 60.4 | 8.8 | 27.9 | 11.6 | 60.5 | 16.3 | | Q3:2017-18 | 1299 | 22.5 | 14.7 | 62.8 | 7.8 | 27.6 | 8.6 | 63.8 | 19.0 | | Q4:2017-18 | 1250 | 26.3 | 13.8 | 59.9 | 12.5 | 25.4 | 8.8 | 65.8 | 16.6 | | Q1:2018-19 | 1207 | 23.6 | 14.5 | 61.8 | 9.1 | 28.4 | 9.8 | 61.8 | 18.6 | | Q2:2018-19 | | | | | | 27.8 | 9.2 | 63.0 | 18.5 | | ‘Increase’ in exports is optimistic. Footnotes ‘@’ and ‘#’ given in Table 1 are applicable here. |
| Table 8: Assessment & Expectation for Imports | | (Percentage responses) | | Quarter | Total response | Assessment | Expectation | | Increase | Decrease | No change | Net response | Increase | Decrease | No change | Net response | | Q1:2017-18 | 1250 | 17.4 | 10.3 | 72.2 | 7.1 | 17.4 | 7.2 | 75.4 | 10.2 | | Q2:2017-18 | 1141 | 17.1 | 8.2 | 74.7 | 8.9 | 18.6 | 7.9 | 73.5 | 10.7 | | Q3:2017-18 | 1299 | 18.2 | 9.1 | 72.7 | 9.1 | 17.8 | 5.0 | 77.2 | 12.8 | | Q4:2017-18 | 1250 | 19.8 | 8.7 | 71.5 | 11.0 | 19.7 | 6.2 | 74.1 | 13.5 | | Q1:2018-19 | 1207 | 19.6 | 8.4 | 72.0 | 11.2 | 19.6 | 5.8 | 74.7 | 13.8 | | Q2:2018-19 | | | | | | 19.1 | 5.8 | 75.1 | 13.3 | | ‘Increase’ in imports is optimistic. Footnotes ‘@’ and ‘#’ given in Table 1 are applicable here. |
| Table 9: Assessment & Expectation for level of Raw Materials Inventory | | (Percentage responses) | | Quarter | Total response | Assessment | Expectation | | Above average | Below average | Average | Net response | Above average | Below average | Average | Net response | | Q1:2017-18 | 1250 | 12.2 | 6.7 | 81.2 | -5.5 | 8.7 | 6.1 | 85.2 | -2.6 | | Q2:2017-18 | 1141 | 13.1 | 6.2 | 80.8 | -6.9 | 10.7 | 6.1 | 83.2 | -4.6 | | Q3:2017-18 | 1299 | 14.6 | 6.0 | 79.4 | -8.6 | 10.4 | 4.3 | 85.4 | -6.1 | | Q4:2017-18 | 1250 | 14.0 | 5.9 | 80.2 | -8.1 | 11.5 | 6.0 | 82.5 | -5.5 | | Q1:2018-19 | 1207 | 14.6 | 4.9 | 80.5 | -9.6 | 10.8 | 5.7 | 83.5 | -5.2 | | Q2:2018-19 | | | | | | 11.0 | 5.2 | 83.7 | -5.8 | | ‘Below average’ Inventory of raw materials is optimistic. Footnotes ‘@’ and ‘#’ given in Table 1 are applicable here. |
| Table 10: Assessment & Expectation for level of Finished Goods Inventory | | (Percentage responses) | | Quarter | Total response | Assessment | Expectation | | Above average | Below average | Average | Net response | Above average | Below average | Average | Net response | | Q1:2017-18 | 1250 | 14.2 | 6.8 | 79.0 | -7.5 | 10.7 | 6.4 | 82.9 | -4.3 | | Q2:2017-18 | 1141 | 15.9 | 7.1 | 77.0 | -8.8 | 11.6 | 6.0 | 82.4 | -5.6 | | Q3:2017-18 | 1299 | 14.5 | 6.9 | 78.6 | -7.6 | 10.0 | 6.2 | 83.8 | -3.8 | | Q4:2017-18 | 1250 | 13.3 | 6.5 | 80.3 | -6.8 | 10.9 | 6.5 | 82.6 | -4.5 | | Q1:2018-19 | 1207 | 12.0 | 6.3 | 81.7 | -5.7 | 10.4 | 5.8 | 83.9 | -4.6 | | Q2:2018-19 | | | | | | 9.9 | 5.0 | 85.1 | -4.8 | | ‘Below average’ Inventory of finished goods is optimistic. Footnotes ‘@’ and ‘#’ given in Table 1 are applicable here. |
| Table 11: Assessment & Expectations for Employment Outlook | | (Percentage responses) | | Quarter | Total response | Assessment | Expectation | | Increase | Decrease | No change | Net response | Increase | Decrease | No change | Net response | | Q1:2017-18 | 1250 | 14.6 | 9.2 | 76.2 | 5.5 | 15.9 | 6.6 | 77.6 | 9.3 | | Q2:2017-18 | 1141 | 15.5 | 8.2 | 76.3 | 7.3 | 15.2 | 6.5 | 78.3 | 8.7 | | Q3:2017-18 | 1299 | 15.8 | 7.4 | 76.8 | 8.4 | 15.8 | 5.3 | 78.9 | 10.4 | | Q4:2017-18 | 1250 | 17.5 | 8.1 | 74.4 | 9.4 | 17.0 | 5.3 | 77.7 | 11.7 | | Q1:2018-19 | 1207 | 18.1 | 7.2 | 74.6 | 10.9 | 17.7 | 6.6 | 75.7 | 11.1 | | Q2:2018-19 | | | | | | 17.6 | 4.7 | 77.7 | 12.9 | | ‘Increase’ in employment is optimistic. Footnotes ‘@’ and ‘#’ given in Table 1 are applicable here. |
| Table 12: Assessment & Expectation for Overall Financial Situation | | (Percentage responses) | | Quarter | Total response | Assessment | Expectation | | Better | Worsen | No change | Net response | Better | Worsen | No change | Net response | | Q1:2017-18 | 1250 | 30.9 | 11.8 | 57.2 | 19.1 | 37.8 | 7.0 | 55.1 | 30.8 | | Q2:2017-18 | 1141 | 29.0 | 13.2 | 57.7 | 15.8 | 35.6 | 7.7 | 56.6 | 27.9 | | Q3:2017-18 | 1299 | 28.6 | 11.4 | 60.0 | 17.1 | 35.3 | 6.6 | 58.1 | 28.7 | | Q4:2017-18 | 1250 | 31.9 | 9.5 | 58.6 | 22.4 | 35.2 | 6.6 | 58.2 | 28.6 | | Q1:2018-19 | 1207 | 31.0 | 10.3 | 58.7 | 20.7 | 34.5 | 6.5 | 59.0 | 28.0 | | Q2:2018-19 | | | | | | 35.1 | 7.2 | 57.6 | 27.9 | | ‘Better’ overall financial situation is optimistic. Footnotes ‘@’ and ‘#’ given in Table 1 are applicable here. |
| Table 13: Assessment & Expectation for Working Capital Finance Requirement | | (Percentage responses) | | Quarter | Total response | Assessment | Expectation | | Increase | Decrease | No change | Net response | Increase | Decrease | No change | Net response | | Q1:2017-18 | 1250 | 29.3 | 5.7 | 65.0 | 23.6 | 29.4 | 5.1 | 65.5 | 24.4 | | Q2:2017-18 | 1141 | 29.7 | 6.3 | 64.1 | 23.4 | 29.4 | 5.7 | 65.0 | 23.7 | | Q3:2017-18 | 1299 | 34.4 | 5.0 | 60.6 | 29.4 | 30.5 | 4.1 | 65.4 | 26.4 | | Q4:2017-18 | 1250 | 35.5 | 5.3 | 59.2 | 30.1 | 32.4 | 3.6 | 64.0 | 28.8 | | Q1:2018-19 | 1207 | 32.4 | 4.8 | 62.8 | 27.7 | 30.8 | 5.3 | 63.9 | 25.4 | | Q2:2018-19 | | | | | | 30.8 | 4.5 | 64.7 | 26.3 | | ‘Increase’ in working capital finance is optimistic. Footnotes ‘@’ and ‘#’ given in Table 1 are applicable here. |
| Table 14: Assessment & Expectation for Availability of Finance (from Internal Accruals) | | (Percentage responses) | | Quarter | Total response | Assessment | Expectation | | Improve | Worsen | No change | Net response | Improve | Worsen | No change | Net response | | Q1:2017-18 | 1250 | 23.5 | 9.5 | 67.0 | 14.1 | 27.5 | 6.2 | 66.3 | 21.3 | | Q2:2017-18 | 1141 | 23.2 | 9.5 | 67.3 | 13.7 | 26.8 | 6.4 | 66.9 | 20.4 | | Q3:2017-18 | 1299 | 22.2 | 8.4 | 69.3 | 13.8 | 25.8 | 5.6 | 68.6 | 20.2 | | Q4:2017-18 | 1250 | 23.7 | 8.9 | 67.4 | 14.7 | 26.6 | 5.2 | 68.2 | 21.4 | | Q1:2018-19 | 1207 | 24.2 | 8.2 | 67.5 | 16.0 | 25.1 | 6.9 | 67.9 | 18.2 | | Q2:2018-19 | | | | | | 25.1 | 6.5 | 68.3 | 18.6 | | ‘Improvement’ in availability of finance is optimistic. Footnotes ‘@’ and ‘#’ given in Table 1 are applicable here. |
| Table 15: Assessment & Expectation for Availability of Finance (from banks & other sources) | | (Percentage responses) | | Quarter | Total response | Assessment | Expectation | | Improve | Worsen | No change | Net response | Improve | Worsen | No change | Net response | | Q1:2017-18 | 1250 | 21.0 | 6.1 | 72.9 | 14.9 | 24.8 | 4.9 | 70.3 | 19.8 | | Q2:2017-18 | 1141 | 19.8 | 6.1 | 74.1 | 13.8 | 21.5 | 4.6 | 73.9 | 17.0 | | Q3:2017-18 | 1299 | 19.8 | 5.8 | 74.4 | 14.0 | 18.6 | 4.5 | 77.0 | 14.1 | | Q4:2017-18 | 1250 | 18.8 | 7.0 | 74.2 | 11.9 | 20.9 | 4.4 | 74.7 | 16.5 | | Q1:2018-19 | 1207 | 19.0 | 7.3 | 73.7 | 11.7 | 20.9 | 6.4 | 72.7 | 14.6 | | Q2:2018-19 | | | | | | 19.9 | 5.6 | 74.4 | 14.3 | | ‘Improvement’ in availability of finance is optimistic. Footnotes ‘@’ and ‘#’ given in Table 1 are applicable here. |
| Table 16: Assessment & Expectation for Availability of Finance (from overseas, if applicable) | | (Percentage responses) | | Quarter | Total response | Assessment | Expectation | | Improve | Worsen | No change | Net response | Improve | Worsen | No change | Net response | | Q1:2017-18 | 1250 | 9.5 | 3.7 | 86.8 | 5.8 | 9.8 | 2.8 | 87.4 | 7.0 | | Q2:2017-18 | 1141 | 8.0 | 3.0 | 89.0 | 5.0 | 10.9 | 3.9 | 85.2 | 7.0 | | Q3:2017-18 | 1299 | 7.9 | 3.9 | 88.1 | 4.0 | 7.2 | 3.0 | 89.8 | 4.1 | | Q4:2017-18 | 1250 | 8.0 | 4.6 | 87.4 | 3.4 | 9.2 | 2.6 | 88.2 | 6.6 | | Q1:2018-19 | 1207 | 7.1 | 5.7 | 87.1 | 1.4 | 8.6 | 4.3 | 87.1 | 4.3 | | Q2:2018-19 | | | | | | 9.0 | 4.6 | 86.4 | 4.4 | | ‘Improvement’ in availability of finance is optimistic. Footnotes ‘@’ and ‘#’ given in Table 1 are applicable here. |
| Table 17: Assessment & Expectation for Cost of Finance | | (Percentage responses) | | Quarter | Total response | Assessment | Expectation | | Increase | Decrease | No change | Net response | Increase | Decrease | No change | Net response | | Q1:2017-18 | 1250 | 14.8 | 13.6 | 71.6 | -1.2 | 15.5 | 12.9 | 71.6 | -2.5 | | Q2:2017-18 | 1141 | 14.5 | 14.0 | 71.6 | -0.5 | 14.7 | 10.9 | 74.5 | -3.8 | | Q3:2017-18 | 1299 | 14.5 | 11.6 | 73.9 | -3.0 | 14.1 | 11.9 | 74.0 | -2.2 | | Q4:2017-18 | 1250 | 18.1 | 7.9 | 74.0 | -10.3 | 13.9 | 9.8 | 76.3 | -4.1 | | Q1:2018-19 | 1207 | 25.3 | 5.4 | 69.2 | -19.9 | 18.7 | 6.4 | 74.9 | -12.2 | | Q2:2018-19 | | | | | | 24.1 | 4.8 | 71.1 | -19.3 | | ‘Decrease’ in cost of finance is optimistic. Footnotes ‘@’ and ‘#’ given in Table 1 are applicable here. |
| Table 18: Assessment & Expectation for Cost of Raw Materials | | (Percentage responses) | | Quarter | Total response | Assessment | Expectation | | Increase | Decrease | No change | Net response | Increase | Decrease | No change | Net response | | Q1:2017-18 | 1250 | 47.2 | 5.1 | 47.8 | -42.1 | 41.9 | 4.1 | 54.0 | -37.8 | | Q2:2017-18 | 1141 | 46.8 | 5.0 | 48.2 | -41.8 | 40.4 | 4.0 | 55.6 | -36.5 | | Q3:2017-18 | 1299 | 47.9 | 5.2 | 46.8 | -42.7 | 37.6 | 5.7 | 56.7 | -31.9 | | Q4:2017-18 | 1250 | 52.8 | 3.3 | 43.9 | -49.5 | 38.3 | 4.3 | 57.4 | -34.0 | | Q1:2018-19 | 1207 | 55.9 | 2.8 | 41.3 | -53.0 | 42.7 | 3.7 | 53.6 | -39.0 | | Q2:2018-19 | | | | | | 46.2 | 2.8 | 50.9 | -43.4 | | ‘Decrease’ in cost of raw materials is optimistic. Footnotes ‘@’ and ‘#’ given in Table 1 are applicable here. |
| Table 19: Assessment & Expectation for Selling Price | | (Percentage responses) | | Quarter | Total response | Assessment | Expectation | | Increase | Decrease | No change | Net response | Increase | Decrease | No change | Net response | | Q1:2017-18 | 1250 | 20.1 | 15.1 | 64.8 | 5.0 | 21.5 | 9.1 | 69.4 | 12.4 | | Q2:2017-18 | 1141 | 16.1 | 16.2 | 67.6 | -0.1 | 18.9 | 11.0 | 70.2 | 7.9 | | Q3:2017-18 | 1299 | 17.7 | 13.2 | 69.0 | 4.5 | 17.5 | 10.6 | 71.9 | 7.0 | | Q4:2017-18 | 1250 | 19.3 | 12.6 | 68.1 | 6.7 | 17.4 | 9.5 | 73.2 | 7.9 | | Q1:2018-19 | 1207 | 23.0 | 11.4 | 65.6 | 11.5 | 19.2 | 8.9 | 71.9 | 10.4 | | Q2:2018-19 | | | | | | 18.5 | 9.6 | 71.9 | 8.8 | | ‘Increase’ in selling price is optimistic. Footnotes ‘@’ and ‘#’ given in Table 1 are applicable here. |
| Table 20: Assessment & Expectation for Profit Margin | | (Percentage responses) | | Quarter | Total response | Assessment | Expectation | | Increase | Decrease | No change | Net response | Increase | Decrease | No change | Net response | | Q1:2017-18 | 1250 | 15.7 | 28.2 | 56.0 | -12.5 | 20.2 | 19.2 | 60.6 | 1.0 | | Q2:2017-18 | 1141 | 14.5 | 28.5 | 57.1 | -14.0 | 20.3 | 20.0 | 59.7 | 0.3 | | Q3:2017-18 | 1299 | 15.4 | 25.4 | 59.1 | -10.0 | 19.6 | 17.8 | 62.5 | 1.8 | | Q4:2017-18 | 1250 | 16.2 | 26.1 | 57.7 | -9.9 | 18.8 | 18.7 | 62.5 | 0.1 | | Q1:2018-19 | 1207 | 15.5 | 25.8 | 58.7 | -10.3 | 18.0 | 18.7 | 63.3 | -0.7 | | Q2:2018-19 | | | | | | 18.0 | 18.0 | 64.0 | 0.0 | | ‘Increase’ in profit margin is optimistic. Footnotes ‘@’ and ‘#’ given in Table 1 are applicable here. |
| Table 21: Assessment & Expectation for Overall Business Situation | | (Percentage responses) | | Quarter | Total response | Assessment | Expectation | | Better | Worsen | No change | Net response | Better | Worsen | No change | Net response | | Q1:2017-18 | 1250 | 34.4 | 13.0 | 52.6 | 21.3 | 43.6 | 7.6 | 48.7 | 36.0 | | Q2:2017-18 | 1141 | 31.7 | 14.4 | 53.9 | 17.3 | 42.7 | 9.0 | 48.4 | 33.7 | | Q3:2017-18 | 1299 | 35.1 | 11.2 | 53.7 | 23.9 | 42.9 | 6.0 | 51.1 | 36.9 | | Q4:2017-18 | 1250 | 39.2 | 9.0 | 51.8 | 30.2 | 42.5 | 6.4 | 51.2 | 36.1 | | Q1:2018-19 | 1207 | 38.7 | 9.0 | 52.3 | 29.6 | 42.7 | 5.8 | 51.5 | 36.9 | | Q2:2018-19 | | | | | | 40.5 | 5.9 | 53.6 | 34.6 | | ‘Better’ Overall Business Situation is optimistic. Footnotes ‘@’ and ‘#’ given in Table 1 are applicable here. |
| Table 22: Assessment & Expectation for Salary/Other Remuneration | | (Percentage responses) | | Quarter | Total response | Assessment | Expectation | | Increase | Decrease | No change | Net response | Increase | Decrease | No change | Net response | | Q1:2017-18 | 1250 | 42.1 | 2.7 | 55.2 | 39.4 | 38.8 | 2.2 | 59.0 | 36.6 | | Q2:2017-18 | 1141 | 36.7 | 2.2 | 61.2 | 34.5 | 34.5 | 2.5 | 63.0 | 32.0 | | Q3:2017-18 | 1299 | 29.4 | 2.2 | 68.4 | 27.2 | 25.9 | 2.0 | 72.1 | 23.9 | | Q4:2017-18 | 1250 | 28.8 | 2.2 | 69.0 | 26.6 | 25.2 | 2.3 | 72.5 | 22.9 | | Q1:2018-19 | 1207 | 42.0 | 2.1 | 55.9 | 40.0 | 36.8 | 1.8 | 61.3 | 35.0 | | Q2:2018-19 | | | | | | 32.8 | 1.2 | 65.9 | 31.6 | | ‘Increase in Salary / other remuneration’ is optimistic. Footnotes ‘@’ and ‘#’ given in Table 1 are applicable here. |
| Table 23: Business Expectations Index (BEI) | | Quarter | BEI-Assessment Quarter | BEI-Expectation Quarter | | Q1:2017-18 | 105.4 | 114.2 | | Q2:2017-18 | 103.7 | 113.3 | | Q3:2017-18 | 109.8 | 115.0 | | Q4:2017-18 | 112.4 | 115.8 | | Q1:2018-19 | 108.4 | 114.6 | | Q2:2018-19 | | 114.1 |
|