Press Release RBI Working Paper Series No. 06
Measuring Financial Capability of the Street Vendors @D.V. Ramana and Silu Muduli Abstract 1Financial capability of an individual is the ability to use and manage financial products for current and future financial needs with adequate financial knowledge. This paper examines financial capability on four dimensions- financial management to meet current needs, future financial planning, financial products management, and financial knowledge using a sample of street vendors in Bhubaneswar, India. A financial capability index for each individual in the sample has been calculated in a manner that satisfies monotonicity, anonymity, normalisation, uniformity, shortfall sensitivity and hiatus sensitivity to level axioms. We find that education, age, business experience, and daily turnover significantly affect the financial capability of an individual. Moreover, street vendors in regions with higher number of bank branches are found to have significantly higher financial capability. JEL Classification: O18, R58, O20. Keywords: Financial capability, financial literacy, financial inclusion. Introduction Financial inclusion is broadly understood as affordable access to formal financial services by the marginalised sections of the society. In recent years, it has increasingly come to the forefront of public discourse in developing countries. Policymakers all over the world are exploring ways and means to ensure greater inclusion of financially-excluded segments of the society. The low penetration of formal banking in India led the Reserve Bank of India (RBI) to look at financial inclusion as a major policy drive. The report of the “Committee on Medium-term Path on Financial Inclusion”, published in December 2015, suggested taking more efforts to increase formal financial activities in India (RBI, 2015). According to the report, the big push towards financial inclusion in India has emanated from the Jan Dhan Aadhaar Mobile (JAM) driven initiatives undertaken by the Government of India. JAM has become an important initiative in the direction of universal financial inclusion and literacy. Slew of measures, that followed, were the introduction of Business Facilitators (BFs), Business Correspondents (BCs) and deregulation of the opening of ATMs and branches, while ensuring sufficient coverage to hitherto unbanked areas. Concurrently, relaxations in the BC model were given to ensure the ‘last mile’ problem. This accelerated the pace of branch opening, with more branches being opened in rural and semi-urban areas. Our study has been conducted in Bhubaneswar, the capital city of the state of Odisha in India. Bhubaneswar lies in Khurda district of Odisha. Chart 1 shows the number of new urban branches opened in Khurda district of Odisha since 2005-06. According to State Level Bankers’ Committee (SLBC, 2018) of Odisha, there were 412 bank branches in Bhubaneswar, as against a city population of 838,000 (Census, 2011). Thus, on an average, one branch serves around 2014 individuals. Besides branch expansion, initiatives on financial inclusion were complemented with several steps in the direction of improving financial literacy. From the supply side, financial inclusion measures aimed at improving the financial health of individuals by providing them low cost, formal financial services. Looking from the other side, the sections of the society who are targeted for these inclusion policies, should be financially literate to ensure effectiveness of these policies (Lusardi and Mitchell, 2014; Fernandes et al., 2014). Although people have access to formal finance, they also need to develop a greater understanding of the complexities of the financial world. This also helps the policymakers to evaluate the success of policy intervention. Financial literacy is expected to make people capable of managing their finances in a better way. Likewise, financial inclusion provides individuals with several opportunities to understand financial decisions. In this paper, we examine both financial literacy and financial inclusion through the lens of financial capability. Financial capability is a broader concept which evaluates the improvement of overall well-being of individuals due to financial inclusion. The rest of the paper is organized as follows. The concept of financial capability has been discussed in section II. Section III describes the data and the methodology for calculation of financial capability index. Section IV provides the results for estimated financial capability and its relevance with respect to different individual and business characteristics. Section V concludes the paper. II. Financial Capability Amartya Sen and Matha Nussbaum in their seminal work on human capability define ‘capability’ as the freedom of an individual to lead a life as she/he wishes to (Sen, 1993). In other words, individuals should have opportunities to act and lead a life that maximizes their well-being. Similarly, financial capability is defined as the combination of the ability to act and the opportunity to act financially. For an individual, financial literacy provides the ability, while financial inclusion provides the opportunity to act. Financial literacy is an important factor in making day-to-day financial analysis and decisions (Lusardi and Mitchell, 2014; Hastings et al., 2013). Adequate financial management, knowledge and skills allow an individual to take rational and dynamically optimized decisions for the entire life period. In countries like India, where 63.4 per cent of the total population are in the working age (14-60 years) group (Census, 2011), financial literacy among the citizens becomes vital for improving their well-being. Similarly, financial inclusion provides an individual with a platform to choose and manage different financial products through minimization and diversification of risk. Financial inclusion also helps those at the bottom of the pyramid, by providing them information on welfare policy instruments by the government (Bhanot et al., 2012). Financial decision making is a complex process. Since people have their own preferences which are not directly observable, their decisions are purely individualistic. The social planner in turn frames policies assuming that the financial knowledge of the target group is homogeneous. However, this may not be true. Individuals with little financial knowledge could make decisions that may not align with the planner’s objectives. This leads to an undesirable economic outcome. While implementing any financial policy like financial inclusion through financial product penetration, the planner should design policy instruments taking into account prior knowledge of financial ability of the target group. In order to have the ability to act and be financially capable, people require knowledge and skills to manage their personal and household finances. All other things being equal, people who have greater knowledge and understanding about finances and possess financial management skills are more likely to make better financial decisions. There are empirical evidences of association between financial knowledge and positive financial practices (Hilgert et al., 2003). This can be more formally captured if we can measure financial capability by taking into account all related dimensions. Different researchers have defined financial capability using different frameworks. Financial capability describes people’s financial knowledge and their confidence and motivation to manage personal finances (Atkinson et al., 2007; Dixon, 2006). Financial capability is the application of financial knowledge (Huston, 2010). It has also been defined as the ability to use different financial products with financial knowledge or skills (Johnson and Sherraden, 2007). Financial capability is a very broad concept which plays a very vital role in the future planning of individuals in a society. Saving money and accumulating assets increase education level and entrepreneurial opportunities for youth (Chowa and Ansong, 2010; Elliot et al., 2010) and leads to inter-generational equity over time. This paper uses the definition proposed by Atkinson et al., (2007), which captures different aspects of financial capability: “Financially capable people are able to make informed financial decisions. They are numerate and can budget and manage money effectively. They understand how to manage credit and debt. They are able to assess needs for insurance and protection. They can assess the different risks and returns involved in different saving and investment options. They have an understanding of the wider ethical, social, political and environmental dimensions of finances”. Chart 2 depicts the above definition by showing the relationship between financial literacy, financial inclusion, and financial capability. 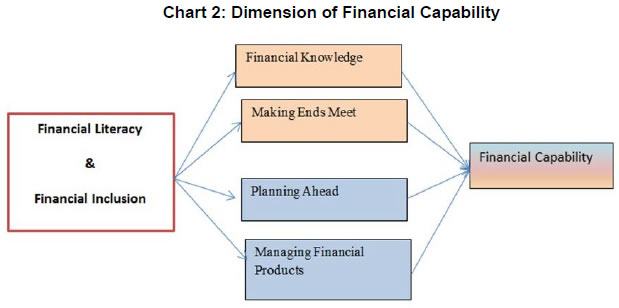 III. Data and Methodology The geographical area considered for research is located in Bhubaneswar, the capital city of Odisha. The city of Bhubaneswar is divided into 67 municipal wards and currently has 46 vending zones accommodating around 1699 vendors (Bhubaneswar Municipality Corporation, 2018). However, the city has many street vendors conducting business on street besides these vending zones. Our preliminary interactions with these vendors and close observation of their day-to-day business operations revealed the following insights about their money management: -
Most of them have a cash balance of more than ₹ 2000 (at least) at the end of the day. -
Some of them don’t use the usual banking route to rotate their cash surplus. -
Some of them deposit their cash in spurious investment or finance companies which promise higher rate of return. -
Many of them still depend on the money lenders for their working capital requirements and end up paying very high rate of interest. -
Most of them are not aware about insurance (life and general) products. -
Most of them have no idea about the concept of retirement schemes. These demographic findings of our pilot study motivated us to undertake a comprehensive study on the financial capability of people doing business on street (both within and outside the vending zones). This research is expected to provide insights which can help the mini and micro enterprises operating at the bottom of the pyramid. These enterprises are mostly specific skill-based business activities such as carpentry, tailoring, plumbing services, fast-food making, mobile services, and vehicle repairing services. The conceptual model shown in Chart 2 has been used to measure the financial capability of people doing business on street (street vendors). Random sampling has been undertaken to collect data on street vendors of the city. A questionnaire was developed after several rounds of discussion with the street vendors. Close observation of a group of street vendors over a period of eight years (2007 - 2015) enabled us to develop a relevant questionnaire for our survey. The questionnaire had forty eight questions divided into seven sections: basic information of vendor; about business and assets; facility and environment of business; financial status of business; capabilities of vendor; legality of business; and, miscellaneous. After checking for internal consistency and other availability of data for the stated objective, we ended up with 1,595 data points. Individuals were enquired about the dimensions of financial capability. On each dimension, five questions were asked, with each question carrying a score of 0 and 1. Therefore, on a dimension, an individual can attain a maximum of 5 and minimum of 0. Dimensional indices have been calculated by absolute distance method, i.e., 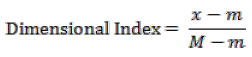 Here m is the minimum and M the maximum value that a variable takes in the whole sample, and x is the realized value that the individual has. Therefore, the numerator is the distance of the observed value from the minimum value, and, the denominator is the distance between the maximum and minimum value or range. So this index will clearly take values in the range [0, 1]. An index value of 0 indicates zero level of attainment on that dimension, whereas, 1 indicates highest level of attainment along that dimension. This measure is scale-proof and absolute. A change of origin, i.e., addition of any scalar to an observation, does not alter the index value. Higher the value of the index, higher will be the attainment on that index. In our model, as discussed earlier, financial capability index (FCI) is an aggregate function of four dimensions: financial knowledge; making ends meet; planning ahead; and, managing financial products. The four dimensions have been treated by Atkinson et al. (2007) as important factors that affect financial capability of individuals. We have calculated the FCI proposed by Mishra and Nathan (2018) that satisfies monotonicity, anonymity, normalisation, uniformity, shortfall sensitivity and hiatus sensitivity to level axioms. These are discussed briefly in the sub-section that follows. Financial Capability Index (FCI) - Methodology In this section, we provide an aggregate measure of FCI developed using a generalized measure proposed by Mishra and Nathan (2018). This measure satisfies the MANUSH (HUMANS) axioms - monotonicity (M), anonymity (A), normalization (N), uniformity (U), shortfall sensitivity (S), and hiatus sensitivity to level (H). Note that widely used arithmetic mean and geometric mean satisfy only MAN and MANU axioms, respectively.  The measure proposed in (1) satisfies MANUSH axioms. According to the monotonicity (M) axiom, the index increases with an increase in any one of the dimensions, with others remaining fixed at initial level. Anonymity (A) axiom posits that any permutation of dimensions should result in the same index value. Since ρ is same for all dimensions, anonymity axiom is satisfied. The dimension also lies in between 0 and 1, thereby satisfying normalization (N) axiom. All the above properties are satisfied by arithmetic mean, geometric mean, and the financial capability index proposed above. However, the uniformity (U) axiom is not satisfied by arithmetic mean. According to this axiom, index should penalize agents with higher variance in their dimensional indices. Geometric mean, on the other hand, satisfies uniformity axiom. The additional two important axioms that our measure satisfies, are the shortfall sensitivity (S) and hiatus sensitivity to level (H). The former axiom states that, over time, when a country improves a dimension in which it has the highest shortfall, then the overall index should increase more, compared to a situation in which a similar improvement is observed along any other dimension with a relatively lower shortfall. The last axiom states that in the development process over time, the index should penalize simultaneous improvement of same magnitude applied across all dimensions. In other words, over time, economic planners should prefer a development path which results in a relatively higher shortfall, rather than improving all dimensions uniformly by the same magnitude. In this paper, FCI of an individual has been calculated by using the formula Here, EMI, FPI, PMI, and FLI stand for Ends Meet Index, Financial Planning Index, Financial Product Management Index, and, Financial Literacy Index, respectively. IV. Results and Analysis In Table 1, the summary statistics of the four dimensional indices have been given. Mean of the FPI is the lowest, while that of the EMI is highest. On the other hand, variance of FPI is highest and EMI is the lowest. This suggests large variation in financial planning across individuals, perhaps, because of lack of proper financial information and awareness. FCI has a mean and median of 0.54 and 0.53, respectively, with a standard deviation of 0.21. FCI density plot is given in Chart 3. | Table 1: Summary Statistics | | Variables | N | Mean | Median | Standard deviation | Maximum | Minimum | | Ends Meet Index | 1595 | 0.76 | 0.80 | 0.23 | 1 | 0 | | Financial Planning Index | 1595 | 0.43 | 0.40 | 0.34 | 1 | 0 | | Product Management Index | 1595 | 0.52 | 0.60 | 0.30 | 1 | 0 | | Financial Literacy Index | 1595 | 0.71 | 0.80 | 0.27 | 1 | 0 | | Financial Capability Index | 1595 | 0.54 | 0.53 | 0.21 | 1 | 0 | | Source: Authors’ calculations. |
Charts 4 and 5 show the magnitude of FCI at different places in the city of Bhubaneswar. It can be observed that the centre of the city is marked by a bigger bubble. As the distance from the city centre increases, the size of the bubble also diminishes, indicating lower FCI for these regions.
We have divided the index equally into four parts based on magnitude, which has been shown in Table 2. These are 0-0.25 (very low FCI), 0.25 - 0.5 (low FCI), 0.5 - 0.75 (moderately high), 0.75 - 1 (very high). In 0 - 0.25 range, 6.71 per cent, in low FCI category 26.46 percent of the sample lie. It is evident from the table that, less than half of the sample have FCI below 0.5, of which around 1.3 per cent are female and 98.7 per cent are male. Similarly, around 70 per cent of the sample are having FCI more than 0.5, of which 2.2 per cent are female and 97.8 per cent are male. | Table 2: Categorical Division of FCI | | FCI Level | Frequency | Percent | | 0.00 - 0.25 | 107 | 6.71 | | 0.25 - 0.50 | 422 | 26.46 | | 0.50 - 0.75 | 708 | 44.39 | | 0.75 – 1.00 | 358 | 22.45 | | Total | 1,595 | 100 | | Source: Authors’ calculations. | Individual and Business Characteristics After calculating the FCI for each individual, our study evaluates the impact of different individual characteristics on his/her FCI. Age is an important factor, both from the perspective of learning and future planning. In our case, age has been divided into five categories as shown in Table 3. The table shows that mean FCI increases with increase in age. This may be due to an increase in the financial experience in business, as well as, awareness gained over the years. In addition to age, we have also taken into account the gender; marital status; usage of smartphone; employment of others in their business; and ownership of land2 or house of their own, to analyse the differences in FCI across individuals. There was no significant difference observed in FCI across gender. However, in other factors, there was a significant difference in FCI. Individuals who have employed others had a higher FCI, compared to those who were doing business alone. Married individuals were found to be more financially capable than unmarried ones. In the same way, individuals using smartphones were found to be more financially capable than those who did not use smartphones. Individuals who had their own land or house were more financially capable than the ones who stayed on rented accommodation. | Table 3: Mean FCI for Different Age Groups | | Age Group | Mean | Standard deviation | Percentage share in the sample | | 0 - 18 years (minors) | 0.43 | 0.16 | 1.69 | | 18 - 25 years | 0.48 | 0.20 | 21.07 | | 25 - 35 years | 0.54 | 0.19 | 43.82 | | 35 - 60 years | 0.58 | 0.23 | 32.85 | | Senior citizens | 0.59 | 0.22 | 0.56 | | Total | 0.54 | 0.21 | 100.00 | | Source: Authors’ calculations. |
| Table 4: t - test for Different Groups | | Group Variable | Categorical FCI | Difference in FCI | t-statistics | | (a) | (b) | (a) - (b) | | Gender | 0.58 (female) | 0.54 (male) | 0.04 | 1.07 | | Provided employment to others | 0.62 (yes) | 0.48 (no) | 0.14 | 14.43 | | Marital status | 0.56 (married) | 0.49 (unmarried) | 0.07 | 6.56 | | Use smartphone | 0.61 (yes) | 0.46 (no) | 0.15 | 15.37 | | Have land of your own | 0.62 (yes) | 0.43 (no) | 0.19 | 20.46 | | Source: Authors’ calculations. | Education is expected to play an important role in financial capability by improving an individual’s understanding of financial products and their management. Table 5 shows that mean FCI increases with the education level, as expected. We have also considered individuals who are responsible for initiation of the business. That is, whether they have started the business on their own, or someone from the family started the business, or they have acquired the business from another person outside the family. Table 6 shows the financial capability across these categories. ANOVA test suggests that there was no statistical difference in financial capability across these categories. | Table 5: Mean FCI for Different Education Levels | | Education level | Mean | Standard deviation | Percentage share in the sample | | No education | 0.36 | 0.18 | 4.51 | | Primary education | 0.44 | 0.18 | 25.39 | | Secondary education | 0.52 | 0.20 | 33.98 | | Senior secondary education | 0.64 | 0.19 | 19.69 | | Graduation and above | 0.67 | 0.18 | 16.43 | | Total | 0.54 | 0.21 | 100.00 | | Source: Authors’ calculations. |
| Table 6: Mean FCI according to Initiation of the Business | | Initiation of the business by | Mean FCI | Standard deviation | Percentage share in the sample | | Family member | 0.51 | 0.20 | 21.00 | | Self | 0.55 | 0.21 | 77.55 | | Others | 0.52 | 0.20 | 1.44 | | Total | 0.54 | 0.21 | 1,595 | | ANOVA | chi2(2) = 1.71 | Prob>chi2 = 0.42 | | | Source: Authors’ calculations. | In Table 7, the businesses are divided into 11 categories and are arranged in decreasing order of their FCI. Proportion of fast-food, vegetables, and pan are relatively higher in the sample. Of these categories, individuals selling shoes had the highest FCI, while individuals who owned a garage had the lowest FCI. | Table 7: Mean FCI and Type of Business | | Category | Mean FCI | Standard deviation | Percentage share in the sample | | Shoes | 0.75 | 0.27 | 0.31 | | Clothing | 0.65 | 0.19 | 5.52 | | Stationary | 0.65 | 0.19 | 8.71 | | Electronics | 0.60 | 0.19 | 10.09 | | Hotel | 0.58 | 0.19 | 3.20 | | Grocery | 0.57 | 0.19 | 9.59 | | Others | 0.55 | 0.21 | 17.49 | | Fast food | 0.50 | 0.20 | 21.25 | | Fruits and vegetables | 0.45 | 0.18 | 11.41 | | Pan shop | 0.45 | 0.21 | 11.10 | | Garage | 0.39 | 0.19 | 1.32 | | Total | 0.54 | 0.21 | 100.00 | | Source: Authors’ calculations. | The city of Bhubaneswar is divided into smaller regions, each marked by a unique postal index number or PIN code. We have estimated the number of bank branches in each of these regions by utilizing the PIN code information from the State Level Bankers’ Committee (SLBC, 2018) data. Chart 6 provides the scatter plot of number of bank branches and mean FCI for each of these areas. The correlation between these two variables is 0.49 and statistically significant. Determinants of Financial Capability The importance of individual characteristics, business characteristics, and presence of bank branches in the area in determining financial capability of an individual is examined here. We have used ordinary least square (OLS) approach to examine the relationship. In the first model, which basically captures the impact of individual characteristics, we estimate the impact of bank branches, age, and education level on FCI. Further, we augment the model by bringing business characteristics, such as business experience and daily turnover to examine its impact on FCI. In order to have robust standard errors, we have taken the cluster effect of a group variable into account. This is generated by using PIN code and the type of business being carried out by the individual. The variables that are used here are ordered variables. Since the number of categories are at least four, we use order variables in our regressions. Results of the model are given in Table A1 in the annexure. As a further robustness check for the model, we also estimate our model by using dummy variables for each category and provide the results in Table A2. The results of both these models are consistent. We find that street vendors in areas with higher number of bank branches have higher financial capability. We also find that, on an average, addition of one bank branch in a region helps in increasing the FCI of the region by 0.003. Besides the number of bank branches, factors such as age, education level, business experience and daily turnover turn out to be significant factors that positively affect the financial capability of an individual. 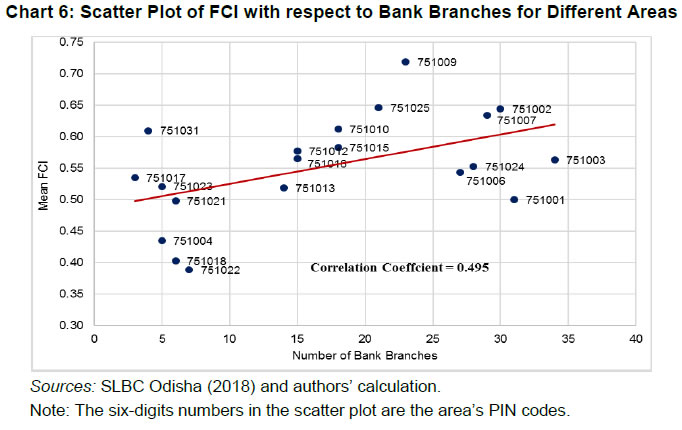 V. Conclusion This study finds that individuals in higher age group and with longer business experience are relatively more financially capable. The reason could be that with more experience individuals learn how to manage the working capital of the business during lean seasons. They also tend to develop a better understanding of their current and future financial needs. Education also plays an important role in determining one’s financial capability. Vendors who had attained higher levels of education have higher financial capability, as measured by our index. From financial technology point of view, we find that vendors who used smartphones were more financially capable than those who did not use smartphones. As individuals with smartphones have higher ability to understand financial products, and can easily access such services, banks should aim at providing multiple services through online platforms. This is likely to help in higher penetration of banking services, and at the same time, expand the choices for different financial products. One important finding of the paper is that areas with higher bank branches have vendors with higher financial capability. This makes the case for branch expansion with a focus on areas with low bank branches. This will help the financially deprived sections of the society, who are also largely excluded from online banking platform, to access different financial products. More choice in financial products may help vendors to choose appropriate financial products, helping them in mitigating the impact of adverse business shocks.
References Atkinson, A., McKay, S., Collard, S., and Kempson, E. (2007). Levels of financial capability in the UK. Public Money and Management, 27(1), 29-36. Bhanot, D., Bapat, V., and Bera, S. (2012). Studying financial inclusion in north-east India. International Journal of Bank Marketing, 30(6), 465-484. Bhubaneswar Municipality Corporation (2018, September 2), Retrieved from: http://bmc.gov.in/ Birkenmaier, J., Curley, J., and Sherraden, M. (Eds.). (2013). Financial education and capability: Research, education, policy, and practice. Oxford University Press. Census of India (2011). Retrieved from: http://censusindia.gov.in/ Chowa, G., and Ansong, D. (2010). Youth and savings in Assets Africa. Children and Youth Services Review, 32(11), 1591–1596. Collins, D., Morduch, J., Rutherford, S., and Ruthven, O. (2010). Portfolios of the poor: how the world’s poor live on $2 a day. Princeton University Press. Das, S. (2016). Financial literacy: measurement and determinants. Age, 18, 20. Dixon, M. (2006). Rethinking Financial Capability: Lessons from economic psychology and behavioural finance. Institute for Public Policy Research. Elliott, W., Jung, H., Kim, K., and Chowa, G. (2010). A multi-group structural equation model (SEM) examining asset holding effects on educational attainment by race and gender. Journal of Children and Poverty, 16(2), 91–121. Fernandes, D., Lynch Jr, J. G., and Netemeyer, R. G. (2014). Financial literacy, financial education, and downstream financial behaviors. Management Science, 60(8), 1861-1883. Hastings, J. S., Madrian, B. C., and Skimmyhorn, W. L. (2013). Financial literacy, financial education, and economic outcomes. Annual Review of Economics, 5(1), 347-373. Hilgert, M. A., Hogarth, J. M., and Beverly, S. G. (2003). Household financial management: The connection between knowledge and behavior. Federal Reserve Bulletin, 89, 309-322. Huston, S. J. (2010). Measuring financial literacy. Journal of Consumer Affairs, 44(2), 296-316. Johnson, E., and Sherraden, M. S. (2007). From Financial Literacy to Financial Capability among Youth. Journal of Sociology and Social Welfare, 34 (3), 119-145. Kempson, E., Collard, S., and Moore, N. (2006). Measuring financial capability: An exploratory study for the Financial Services Authority. Consumer Financial Capability: Empowering European Consumers, 39. Lusardi, A., and Mitchell, O. S. (2014). The economic importance of financial literacy: Theory and evidence. Journal of Economic Literature, 52(1), 5-44. Lusardi, A., and Tufano, P. (2015). Debt literacy, financial experiences, and over indebtedness. Journal of Pension Economics and Finance, 14(4), 332-368. McKay, S. (2011). Understanding Financial Capability in Canada: Analysis of the Canadian Financial Capability Survey. Task Force on Financial Literacy. Mishra, S., and Nathan, H. S. K. (2018). A MANUSH or HUMANS Characterisation of the Human Development Index. Journal of Human Development and Capabilities, 19(3), 398415. Prahalad, C. K. (2006). The Fortune at the Bottom of the Pyramid. Pearson Education India. Radu V. Craiu, Thierry Duchesne, Daniel Fortin (2008). Inference Methods for the Conditional Logistic Regression Model with Longitudinal Data. Biometrical Journal, Vol.50 No.1, 97-109. Reserve Bank of India (2015). Report of the Committee on Medium-term Path on Financial Inclusion Retrived from: https://rbi.org.in/scripts/PublicationReportDetails.aspx?ID=836 Sen, A. (1993). Capability and well-being. In M. Nussbaum and A. Sen (Eds.), The Quality of Life. Oxford: Clarendon Press. State Level Bankers’ Committee (2018, October 31) Bank Branch Network. Retrieved from https://www.slbcorissa.com/banking.html Zeleny, M., and Cochrane, J. L. (1973). Multiple criteria decision making. University of South Carolina Press.
Annexure A. Regression Results | Table A1: Regression Results. | | Variables | FCI | FCI | FCI | | Bank branches | 0.00374** | 0.00381** | 0.00309** | | | (0.00122) | (0.00123) | (0.00103) | | Age | 0.0525*** | 0.0359*** | 0.0399*** | | | (0.00777) | (0.00848) | (0.00819) | | Education | 0.0843*** | 0.0855*** | 0.0624*** | | | (0.00655) | (0.00629) | (0.00484) | | Business experience | | 0.0222*** | 0.00934* | | | | (0.00418) | (0.00400) | | Daily turnover | | | 0.0669*** | | | | | (0.00797) | | Constant | 0.133*** | 0.109** | 0.0361 | | | (0.0350) | (0.0334) | (0.0318) | | Observations | 1584 | 1584 | 1584 | | Adjusted R2 | 0.249 | 0.269 | 0.354 | | Note: Standard errors are in parentheses. * p < 0.05, ** p < 0.01, *** p < 0.001. The standard errors are robust standard errors by taking into account the cluster effect of both postal index number (PIN) and type of business. Age, education, business experience, and daily turnover are ordered variables as explained shown in Table A3. |
| Table A2: Regression Results | | Variables | Order Dummies | FCI | FCI | FCI | | Bank branches | | 0.00368** | 0.00331** | 0.00279** | | | | (0.00116) | (0.00115) | (0.000966) | | Age | 2 | -0.0136 | -0.0177 | 0.0319 | | | (0.0187) | (0.0200) | (0.0187) | | 3 | 0.0565*** | 0.0311* | 0.0797*** | | | (0.0149) | (0.0130) | (0.0146) | | 4 | 0.101*** | 0.0537** | 0.106*** | | | (0.0218) | (0.0204) | (0.0187) | | 5 | 0.132 | 0.0838 | 0.134* | | | | (0.0676) | (0.0618) | (0.0637) | | Education | 1 | 0.0810** | 0.0788* | 0.0546 | | | (0.0306) | (0.0309) | (0.0304) | | 2 | 0.170*** | 0.164*** | 0.125*** | | | (0.0302) | (0.0291) | (0.0297) | | 3 | 0.283*** | 0.279*** | 0.208*** | | | (0.0337) | (0.0326) | (0.0312) | | 4 | 0.322*** | 0.323*** | 0.232*** | | | | (0.0375) | (0.0357) | (0.0350) | | Business experience | 2 | | -0.00565 | -0.0166 | | | | (0.0183) | (0.0206) | | 3 | | 0.0481* | 0.0201 | | | | (0.0202) | (0.0216) | | 4 | | 0.103*** | 0.0577** | | | | (0.0191) | (0.0212) | | 5 | | 0.0814** | 0.0314 | | | | (0.0303) | (0.0284) | | 6 | | 0.0740** | 0.0225 | | | | | (0.0232) | (0.0217) | | Daily turnover | 2 | | | 0.0891*** | | | | | (0.0205) | | 3 | | | 0.136*** | | | | | (0.0225) | | 4 | | | 0.205*** | | | | | | (0.0258) | | | Constant | 0.238*** | 0.229*** | 0.158*** | | | | (0.0365) | (0.0384) | (0.0393) | | | Observations | 1584 | 1584 | 1584 | | | Adjusted R2 | 0.253 | 0.285 | 0.366 | | Note: Standard errors are in parentheses. * p < 0.05, ** p < 0.01, *** p < 0.001. The standard errors are robust standard errors by taking into account the cluster effect of both postal index number (PIN) and type of business. In this table, dummies for age, education, business experience, and daily turnover categories are used. Ordered variables are shown in Table A3. |
| Table A3: Description of Ordered Variables | | Age Order (years) | Less than 18 Years | 18 - 25 | 25 -35 | 35 - 60 | More than 60 | | | Order | 1 | 2 | 3 | 4 | 5 | | | Education | No Education | Primary | Secondary | Higher/ Senior Secondary | Graduation and above | | | Order | 0 | 1 | 2 | 3 | 4 | | | Business Experience | Less than 1 year | 1 - 3 years | 3 - 5 years | 5 - 10 years | 10 - 15 years | More than 15 years | | Order | 1 | 2 | 3 | 4 | 5 | 6 | | Daily Turnover | 500-1000 | 1000-
3000/- | 3000-
5000/- | More than 5000/- | | | | Order | 1 | 2 | 3 | 4 | | | |