Press Release RBI Working Paper Series No. 05 Core Inflation Measures in India – An Empirical Evaluation using CPI Data @Janak Raj, Sangita Misra, Asish Thomas George and Joice John Abstract *An appropriate measure of core inflation provides a useful guide for monetary policy. This study analysed eleven candidates of core inflation measure in India, based on Consumer Price Index for the period from January 2012 to September 2019 for assessing their suitability as measures of core inflation. These included six exclusion-based measures and five statistical measures. These candidates were tested for seven desirable properties of a core inflation measure. The analysis in this paper suggests that no measure satisfied all the desirable properties of core inflation. All exclusion-based measures satisfied six out of seven properties; the revertability condition was not satisfied by any of the exclusion-based measure for the full sample period. The persistently low food inflation during January 2017 to August 2019 appeared to have impacted the revertability property. Truncating this period, all the exclusion-based measures other than ‘CPI excluding food, fuel, petrol, diesel, gold, silver and housing’ also satisfied the revertability condition of core inflation. Keywords: Core inflation, Inflation JEL Classification: E31, E52 Introduction Movements in headline inflation are influenced by both transitory factors – which have a little bearing on the direction of inflation, and by factors, which are more persistent in nature and shape the direction of inflation over the medium-term. Transitory movements often emanate from changes in volatile price movements, particularly in food and fuel due to supply shocks, while more durable inflation movements are largely the result of changes in aggregate demand conditions and inflation expectations. Movements in inflation engendered by aggregate demand are amenable to monetary policy actions, while relative price changes induced by supply side shocks, as long as they do not impact generalised inflation through expectations, cannot be influenced by monetary policy. Responding to headline inflation movements unmindful of its nature – transitory or permanent – would only lead to “instrument instability” that results in destabilising both inflation and real economic activity (Schembri, 2007). As monetary policy operates with long and variable lags, a proper diagnosis of the nature of price changes, i.e., how far they are transitory or permanent is crucial for the effective conduct of monetary policy. If price changes due to supply shocks are transitory, monetary policy does not have to respond to such changes. Core inflation, by removing the volatile components from the headline measure, helps in identifying the underlying inflation (the persistent or the generalized component of inflation) and provides an important guide as to where the headline inflation is headed, going forward. That is, as the core inflation is a good approximation of the underlying rate of inflation, it allows policymakers to look through the transitory changes. Core inflation also helps anchor inflation expectations. This is because when the increase in headline inflation is transitory and there is no change in core inflation, the central bank can communicate as to why it is not reacting to such transitory changes in setting monetary policy. Such a focus on core inflation in external communication helps better anchor inflation expectations in periods of considerable volatility in headline inflation induced by transitory shocks to food and fuel prices (Mishkin, 2007). If price changes are persistent, they could pose a risk to generalised inflation through second round effects by influencing expectations. In such a situation, monetary policy may have to respond to these price changes even though they emanate from the supply side. This was also echoed by the Expert Committee to Revise and Strengthen the Monetary Policy Framework (Chairman: Urjit R. Patel), hereinafter referred to as the Expert Committee, which noted that “Since food and fuel account for more than 57 per cent of the CPI on which the direct influence of monetary policy is limited, the commitment to the nominal anchor would need to be demonstrated by timely monetary policy response to risks from second round effects and inflation expectations in response to shocks to food and fuel.” Following the recommendations of the Expert Committee, the Reserve Bank of India Act, 1934 was amended in May 2016 to pave the way for a flexible inflation targeting framework for monetary policy in India. Under the amended Act, the mandate of the RBI has been explicitly defined as “to maintain price stability while keeping in mind the objective of growth”. To operationalise this mandate, the Government notified the inflation target in August 2016 in terms of Consumer Price Index (CPI) inflation rate of 4 per cent (+/- 2 per cent). Thus, the mandate given to RBI for inflation management is in terms of headline inflation. The core inflation, which is guided more by durable demand pressures and is less susceptible to sudden reversal, can serve as an operational guide to monetary policy. There are various approaches by which volatile components are eliminated to assess the underlying or core inflation. It is, therefore, important to estimate different possible candidates of core inflation and evaluate them against the desirable properties of core inflation. Several studies in India in the past focused on extracting core measures of inflation based on the wholesale price index (WPI), which was the preferred measure of headline inflation considered by RBI till 2014. However, not many studies have attempted to estimate core inflation based on CPI, which is now treated as the headline measure of inflation in India. More than half of the CPI consumption basket in India consists of food and fuel, which is often vulnerable to large transitory supply shocks. It, therefore, becomes important to assess as to what is the most appropriate measure of core inflation in India. Keeping this objective in mind, this paper evaluates eleven possible candidates of core inflation based on CPI – six exclusion-based measures and five statistical measures – against the desirable properties of core inflation viz., ease of communication, equality of means, lower volatility, unbiasedness, revertability, co-integration and attraction conditions. The study finds that the various measures of core inflation moved in a relatively narrow range till March 2018. Beginning April 2018, a stark divergence was observed between the exclusion-based measures on the one hand and the variability-based measures on the other. During the full sample period of the study from January 2012 to September 2019, historical standard deviation-based measure satisfied all the desirable properties, barring ease of communication. All the exclusion-based measures also satisfied all the properties, other than the revertability property. It is significant that food inflation from January 2017 to August 2019 remained at a low level, which seemed to have distorted the long-term relationship between headline inflation and exclusion-based core inflation measures.2 Truncating the low food inflation period, all the exclusion-based measures, barring the one excluding food, fuel, petrol, diesel, gold, silver and housing, also satisfied the revertability property. The paper is organised into four sections. Section II explains the concept of core inflation, its importance, methods of measurement, practices followed by major central banks and the existing literature on assessing properties of core inflation. Section III tests the various candidates of core inflation in India against the desirable properties. Section IV sums up and sets out some final reflections. II. Core Inflation: Concept, Measurement and Literature Coined by Eckstein (1981), core inflation generally refers to that component of inflation that is generalised, sticky and likely to persist for a long period, driven largely by demand pressures and expectations of firms and households. While headline inflation, which measures the change in the cost of living and hence affects welfare, is the common choice for an inflation target, core inflation measures, which remove the volatile, transitory movements from the CPI, are often used by the monetary authorities as an operational guide to achieve the target rate. Thus, measures of core inflation constitute a critical component for medium-term inflation forecasting exercise (Blinder, 1997; and Byran and Ceechetti, 1993). Though most central banks target headline inflation, many publish and track core measures of inflation and some of them frequently refer to a core measure excluding some volatile components while communicating their monetary policy analysis (Table 1). | Table 1: Inflation Target and Core Inflation Measures across Central Banks | | Country | Year | Target | Official Core Inflation Measures | | Inflation Targeting Central Banks | | Australia | 1993 | CPI | “CPI excluding fruits, vegetables and petrol.” | | Albania | 2009 | CPI | No published measures of core inflation | | Armenia | 2006 | CPI | No published measures of core inflation | | Brazil | 1999 | CPI | “A traditional exclusion core in which food (at home), energy and regulated & administered prices are excluded.
A (symmetrical) trimmed mean core, where 20% of prices changes are excluded from both tails of the monthly price distribution.
A smoothed (symmetrical) trimmed mean core, where mainly regulated & administered prices changes are smoothed before the trim.” | | Canada | 1991 | CPI | “CPI trim, which excludes CPI components whose rates of change in a given month are the most extreme;
CPI-median, which corresponds to the price change located at the 50th percentile (in terms of basket weight) of the distribution of price changes;
CPI-common, which uses a statistical procedure to track common price changes across categories in the CPI basket.” | | Chile | 1991 | CPI | “CPI excluding 20 per cent with higher (-) variations and 8 per cent with higher (+) variations.” | | Columbia | 1999 | CPI | “CPI excluding agricultural food, public services and transport.” | | Czech Republic | 1998 | CPI | “The increase in prices of non-food items of the consumer basket excluding items with administered prices, indirect tax changes and fuels.” | | Georgia | 2009 | CPI | “CPI excluding food and non-alcoholic beverages, energy, regulated tariffs, transport (specific tariffs).” | | Ghana | 2007 | CPI | “CPI excluding energy and utility items.” | | Guatemala | 2005 | CPI | | | Hungary | 2001 | CPI | “CPI excluding prices of unprocessed food, energy and administered prices.” | | Iceland | 2001 | CPI | “Core Index 1 excludes prices of vegetables, fruit, other agricultural products and petrol from CPI Core Index 2 excludes the above items and public services prices from CPI.” | | Indonesia | 2000 | CPI | “CPI excluding volatile food and administered prices.” | | Israel | 1992 | CPI | | | Japan | 2012 | CPI | “CPI excluding fresh food.” | | Kazakhstan | 2015 | CPI | “CPI excluding prices of fruits and vegetables, gasoline and coal.” | | Korea | 1998 | CPI | “CPI excluding non-grain agricultural products and petroleum products.” | | Mexico | 1999 | CPI | “CPI excluding fruits and vegetables, meat and eggs and energy and regulated prices.” | | Moldova | 2010 | CPI | | | New Zealand | 1990 | CPI | “CPI excluding interest charges.” | | Norway | 2001 | CPI | “CPI excluding tax and energy.” | | Peru | 2002 | CPI | “CPI excluding 9 volatile items like food, fruits and vegetables, urban transport (about 21.2 per cent).” | | Philippines | 2002 | CPI | “CPI excluding rice, corn, fruits, vegetables, LPG, Kerosene, Oil, Gasoline, Diesel.” | | Poland | 1998 | CPI | “CPI excluding regulated prices namely those of alcoholic beverages and tobacco products, energy, fuel, transport services, postal and telecommunication services and various forms of insurance.” | | Romania | 2005 | CPI | “CORE1* which strips out administered prices from headline inflation.
CORE2* which, apart from excluding administered prices, strips out highly-volatile prices, i.e. those of fresh fruit and vegetables, eggs, fuels.” | | Russia | 2014 | CPI | “CPI excluding change in price for individual goods and services subject to the influence of administrative and seasonal factors.” | | Serbia | 2006 | CPI | “CPI excluding food, energy, alcohol and cigarettes.” | | South Africa | 2000 | CPI | “CPI excluding interest rates on mortgage bonds.” | | Sweden | 1993 | CPI | “CPI excluding the effect of changes to mortgage rates.” (with a fixed interest rate) | | Switzerland | 2000 | CPI | | | Thailand | 2000 | CPI | “Core CPI excludes fresh food and energy prices which include rice, flour, cereal products, vegetables, fruits, electricity charges, cooking gas, and gasoline.” | | Turkey | 2006 | CPI | “Measure H: CPI excluding unprocessed food products, energy, alcoholic beverages, tobacco products and gold
Measure I: CPI excluding food, energy, beverages (both alcoholic and non-alcoholic), tobacco products and gold.” | | United Kingdom | 1992 | CPI | “CPI excluding mortgage interest payments.” | | Other Central Banks | | Egypt | | | “CPI excluding most volatile items namely fruits, vegetables and regulated prices.” | | Japan | | | “CPI excluding fresh food.” | | Netherlands | | | “CPI (ULI) excluding fruits, vegetables and energy.” | | Portugal | | | “CPI (ULI) excluding energy and unprocessed food.” | | Spain | | | “CPI excluding energy and unprocessed food.” | | United States | | | “Private final consumption expenditure (PCE) excluding food and energy.” | | Source: Raj and Misra, 2012; various central bank websites. | Studies conducted at the national and cross-country levels broadly follow two approaches for computing core inflation (Rich and Steindel, 2005; Marques, et al., 2003; and Bryan and Cecchetti, 1994). The first approach is to obtain core inflation by excluding some volatile components like food and fuel from the headline inflation (Cecchetti and Moessner, 2009). These measures are simple and easy to communicate. For this reason, most central banks adopt exclusion-based measures of core inflation. These measures, however, suffer from the limitation that the choice of the excluded component is arbitrary. Also, they fail to address the relative price shocks within the included components as there may be periods when excluded components may be less volatile than those which are included. The second approach is to arrive at core inflation by statistical techniques such as trimmed mean, weighted median and historical standard deviations. Such measures, by smoothing the data, provide an understanding of the exact extent to which fluctuations in the series can be regarded as having arisen from “noise”. A popular method is weighted median inflation rate proposed by Bryan and Pike (1991) and Apel and Jansson (1999). The steps involve in this method are as follows: compute price change for all the commodities of the CPI basket and arrange them in ascending order. The inflation corresponding to the first commodity for which cumulative weight exceeds 50 per cent is taken as the measure of core inflation. The median has the benefit that it does not require the subjective inclusion or exclusion of commodities a priori. It is also more robust to large variations in inflation at the commodity level. However, the median excludes a large number of commodities and, therefore, might drop price changes in some commodities that could provide some vital information on underlying inflation (Clark, 2001). Trimmed mean measures proposed by Bryan and Cecchetti (1993) and Bryan et al. (1997) are very much like weighted median measures. These are the weighted average of price changes of individual commodities after excluding a certain per cent of commodities from the left and right tails. For example, the 10 per cent trimmed mean is the average constructed from the inflation rates of commodities, excluding the bottom 5 per cent and top 5 per cent of price changes. In a particular month, a histogram of the price changes may have fat tails, i.e., the distribution of the price changes will be flatter than a bell curve (normal distribution). Trimmed mean measure of core inflation is estimated by excluding those components that fall on the fat tails and hence removes different set of commodities in each month. Thus, the trimmed mean has the ability to remove the fluctuations of market and give an underlying inflation metric. Trimmed mean measures arguably suffer from similar problems as that of the median and is difficult to communicate to general public. Notwithstanding this, trimmed mean measures have been the preferred core inflation measure of few central banks viz., Canada and Brazil. Three different trimmed mean measures have been considered in the present study viz., excluding the 5 per cent, 10 per cent and 20 per cent. The last candidate considered for core inflation is based on historical standard deviations. Allotting zero-weight to some commodities is not always acceptable, because, it is unlikely that all price fluctuations are transitory or noisy. Sometimes these movements may be due to changes in the underlying inflationary process. So, it is desirable to measure core inflation by adjusting the weight based on historical standard deviation rather than excluding the a priori chosen volatile commodities, as it is done in the case of exclusion-based measures. Thus, this measure ensures that the components which were volatile in the past are provided with lower weight without a priori excluding any particular commodity. In this method, first the standard deviations of price changes for all individual commodities over the selected period are calculated. Further, the adjusted weight of a particular commodity is calculated as the product of the reciprocal of historical standard deviation and the initial weight, which at the aggregate level is normalised to hundred. The advantage of this method is that less weight is assigned to those commodities, whose price changes are more volatile in nature. This is important as we are considering variability of price changes over the whole span of time. In the Indian context also, attempts have been made to compute different measures of core inflation and test them for their desirable properties (Samanta, 1999; Mohanty et al., 2000; Durai and Ramachandran, 2007; Kar, 2009; Das et al. 2009; Raj and Misra, 2012). While Samanta (1999) and Raj and Misra (2012) focussed on estimating the best measure using the exclusion principle, Kar (2009) focused on statistical measures of core inflation. Mohanty et al. (2000) and Das et al. (2009) focused on both statistical and exclusion-based measures. These studies found different measures of core inflation suitable for India: core inflation excluding primary food and non-food articles and administered items (Samanta, 1999); core inflation estimated from a common trends model (Durai and Ramachandran, 2007); 20 per cent trimmed mean (Mohanty et al., 2000); geometric exponential smoothing and weighted percentile (Kar, 2009); non-food manufactured products (Raj and Misra, 2012). Das et al. (2009), on the other hand, did not find a unique measure of core inflation that could be considered better than others in the Indian context. All these studies were, however, based on the WPI series. With the inflation rate based on CPI is now treated as the nominal anchor for monetary policy under the flexible inflation targeting framework, it is appropriate to revisit the issue of a suitable measure of core inflation based on CPI. III. Core Inflation - Empirical Analysis for India In this section we first estimate different candidates of core inflation using the CPI data and evaluate them against certain desirable properties of core inflation. III.1 Candidates of Core Inflation This study computes a host of exclusion-based and statistical measures for core inflation as detailed below:
The remaining five core inflation measures (as at 7 to 11) have been computed by employing statistical methodologies that generates core inflation measures with volatility lower than that of headline series. Monthly CPI data (base 2012=100) for the period January 2012 to September 2019 were used for the study. In the absence of a common series of item-wise CPI data across the study period, data for the base years 2012 and 2010 were spliced to construct the various exclusion and statistical based measures. Various core inflation measures so obtained using the above approaches for the period are depicted in Charts 1 and 2. The annual average headline inflation (π) and different measures of core inflation are given in Table 3. Mostly, all the core inflation measures co-moved during the sample period. However, a stark divergence was observed in 2018-19 between the exclusion-based measures and the variability-based measures. The low food inflation pulled the exclusion-based measures much above the headline inflation. On the other hand, statistical measures, which do not a priori remove a sub-group, remained subdued in line with moderate headline inflation. The historical standard deviation-based measure also showed larger divergence from the other statistical measures in 2018-19. This was mainly because some commodities, which were historically volatile and exhibited high inflation have shown persistently low inflation since 2018-19. III.2. Properties and Performance of Various Candidates of Core Inflation An appropriate measure of core inflation has certain desirable properties. A core inflation measure by definition, is expected to be more stable than headline inflation. In other words, the variance of core inflation is supposed to be lower than that of headline inflation. Second, over a longer horizon, the average of core inflation and headline inflation should be similar and there should not be any systematic deviation between the two. Also, over the medium-term, headline inflation should revert to core inflation. For this reason, core inflation should have better predictive power for the future headline inflation. More specifically, based on the literature, the desirable properties of a good measure of core inflation are detailed below. III.2.1. Credibility and General Considerations Roger (1998) argues that a measure of core inflation should be timely, credible and easy to explain to public. Under these considerations the exclusion-based core inflation measures are considered to be superior to other methods because they involve less statistical computations and can be easily verified by the agents independent of the central bank. III.2.2. Difference in Mean and Ratio of Standard Deviation: A necessary condition of a good core inflation measure is that it should, on an average, be similar to headline inflation and at the same time should have lower variability (Clark, 2001). This can be tested by checking whether (a) the means of headline and core inflation are statistically similar; and (b) the variability of the core inflation is statistically lower than that of headline inflation. The standard t-tests for checking the equality of the means of the headline inflation series and different candidates of core inflation measures were conducted. Results clearly show that means of all candidates of core inflation measures are not statistically different from those of headline (Table 4).  Table 5 presents the ratio of variances of the headline inflation and the different core inflation measures, and p-values corresponding to the hypothesis of lower variance of the core inflation series, using the F-test. The results reveal that all the candidates of selected core inflation measures are found to have statistically significant lower variance than the headline inflation series, thus satisfying this criterion. III.2.3. Inflation-Prediction Test (Revertability of headline to core) Another evaluation criterion of a good core inflation measure is that the current core inflation should be statistically similar to future headline inflation (Cogley, 2002). In other words, headline inflation reverts to core inflation (Cecchetti and Moessner, 2008). If πct is the core inflation, πt is headline inflation and ut is the error term at time period t, then for any reasonable time horizon H, the regression: should satisfy the joint hypothesis of α =0 and β = −1. This reflects that a good core inflation measure should be able to predict the future changes in inflation by exact magnitude. For example, if the absolute value of β is less (greater) than one, it suggests that the core inflation is over predicting (under predicting) the magnitude of future changes in inflation. Here, the predictability is tested for the forecasting horizon of six months, i.e., H = 6. 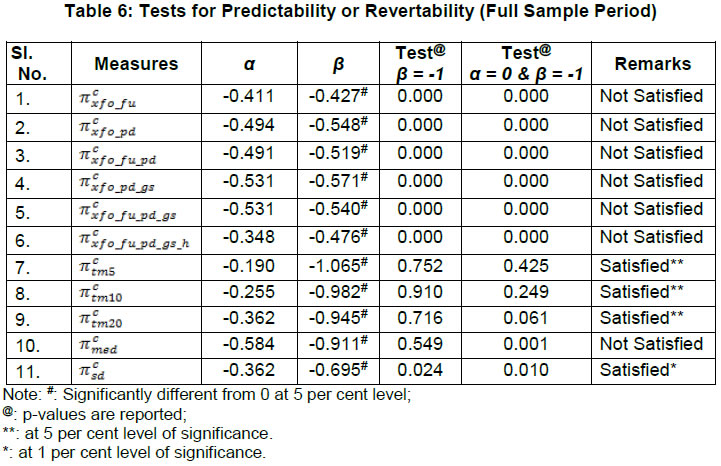 The joint hypothesis of α =0 and β = −1; in equation (1) holds good for all trimmed mean measures and the measure based on historical standard deviation. However, this property is not satisfied for any of the exclusion-based measures. Though β coefficients were negative and statistically different from zero for all the exclusion-based measures, they were statistically different from -1 and hence the condition of a joint hypothesis (i.e. α = 0 and β = −1) was not satisfied in a stricter sense. A similar result of revertability test was also observed in a study conducted by Goyal and Parab (2019) based on a sample period of January 2012 to March 2019. This indicates that exclusion-based measures could predict the directional movements in the headline inflation, and may have over predicted the headline inflation, thus creating a negative bias (Table 6). In this context, it is significant to note that food inflation remained persistently low and well below headline inflation between January 2017 and August 2019. It is only in September 2019, i.e., after 32 months that food inflation turned out to be higher than headline inflation (Chart 3). 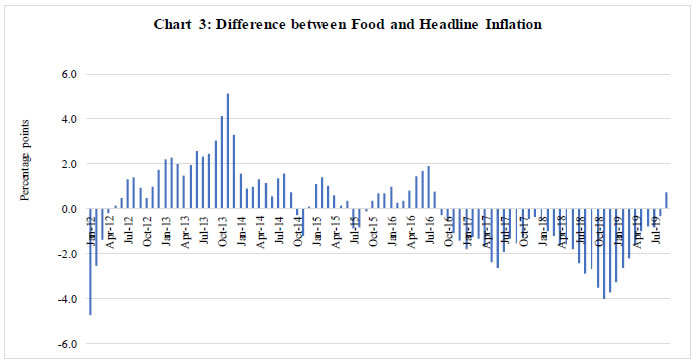 Beginning early 2017, food prices collapsed and eventually moved into deflation by October 2018, resulting in a sharp moderation in headline inflation. This was uncharacteristic of food inflation in India, which historically remained volatile and often elevated, especially during the one and a half decades before 2017. A combination of benign cereal and pulses prices – brought about by bumper harvests and accumulated large stocks due to record three consecutive seasons of normal monsoon – benign global food prices and unusual softening in vegetable prices contributed to the sustained collapse in food inflation between January 2017 and August 2019. Cereals inflation, which was in double digits in 2013, declined sharply to an average of 2.8 per cent between January 2017 and August 2019. Pulses prices were in sustained deflation during December 2016 to April 2019. With international prices remaining benign, oilseeds inflation, which was also in double digits in 2013, moderated to an average rate of 1.8 per cent between January 2017 and August 2019. Reflecting the unusually soft summer pick-up, vegetables inflation on an average was at 0.7 per cent between January 2017 and August 2019 compared to an average inflation of 9.9 per cent during 2012-2016. With close to 30 per cent of the food group in deflation, overall food inflation slipped into an unprecedented deflation during October 2018 to February 2019. The unprecedented low food inflation appeared to have altered the long-term relationship between the headline and exclusion-based core inflation measures. Therefore, it was also attempted to test the criterion of revertability (i.e. α =0 and β = −1) for a smaller sample by removing the data period of low inflation from January 2017 to August 2019. Therefore, recursive regressions over the period from 2012 to 2015, and by adding one-year data, constructing different sub-sample periods, were used to test the criterion of revertability. The results suggest that all the measures, except CPI excluding food, fuel, petrol & diesel and gold & silver and housing, satisfied the stringent condition of revertability for each of the sub-sample periods (Table 7). These results are consistent with Dholakia and Kadiyala (2018) who observed revertability of the exclusion-based core inflation measures for the period till 2017. Thus, the abrupt change in revertability properties could possibly be explained by a change in the behaviour of food inflation between January 2017 and August 2019. The lack of revertability of headline to core inflation, or the lack of predictive properties of exclusion-based measures, post 2017, reflects the unusual collapse of food inflation, its direct impact on headline and possibly also its second-round effects on the underlying inflation movements. 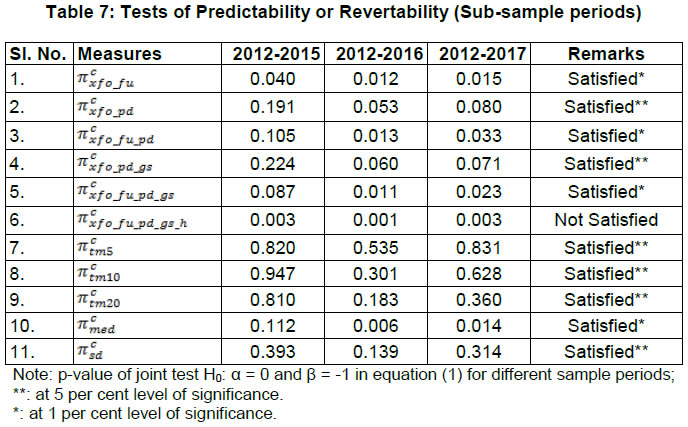 III.2.4. Test for Convergence A stringent condition on convergence and direction of causality was proposed by Marques (2000). A measure of core is said to be desirable, if core inflation causes headline, but the reverse is not true. This can be tested in a cointegration framework (when both core and headline are non-stationary) and should follow the conditions listed below: -
Core inflation and headline inflation are cointegrated. -
With the coefficient as one (termed as unbiasedness). -
In short-run, the adjustment should take place through headline. In other words, core is strongly exogenous (with respect to headline) but is not true otherwise. The tests of these properties are reported in Tables 8 to 10. All the core inflation series are found to be non-stationary with null hypothesis of unit root not getting rejected (Table 8). Johannsen tests of co-integration confirms the existence of stable long-run relationship between all core measures and headline inflation (Table 8). Thus, all core inflation candidates satisfy the co-integration criterion. Further, in the long run cointegration equation, the core inflation should be unbiased with respect to πt, i.e., when there are no shocks, i.e., πt =πct. For gauging the unbiasedness property, we test for β = 1 in the cointegrating equation (2) when α is equal to 0. The unbiasedness property is satisfied by all the candidates, except the trimmed mean (5 per cent and 10 per cent) measures (Table 9). The related condition is that the core measure should attract the headline inflation, i.e., core inflation should cause headline inflation (Figueiredo et al., 2002). This is tested in an error correction framework in (3). However, this condition should not apply in the opposite direction, i.e., the core measure should not be attracted by inflation (4). Thus πct needs to be strongly exogenous. Nine out of 11 measures satisfy the attraction conditions (Table 10). IV. Conclusion and Some Final Reflections This paper analysed eleven possible candidates of core inflation based on CPI, to assess their suitability as measures of core inflation in India. These included six exclusion-based measures – (i) CPI excluding food and fuel; (ii) CPI excluding food, petrol and diesel; (iii) CPI excluding food, fuel, petrol and diesel; (iv) CPI excluding food, petrol, diesel, gold and silver; (v) CPI excluding food, fuel, petrol, diesel, gold and silver; and (vi) CPI excluding food, fuel, petrol, diesel, gold, silver and housing – and five statistical measures, viz., (i) median; (ii) 5 per cent trimmed mean; (iii) 10 per cent trimmed mean; (iv) 20 per cent trimmed mean; and (v) historical standard deviation. All the selected candidates were tested for the desirable properties of a core inflation measure, viz., ease of communication; equality of means; lower volatility; unbiasedness; predictability; co-integration; and attraction conditions. Historical standard deviation-based measure satisfied all the properties of core inflation, except ease of communication (Annex Table A1). In general, statistical measures are difficult to communicate to public; more so with the measure based on historical standard deviation, as it is susceptible to changes with each incoming inflation data. Therefore, monetary policy communication using this measure poses formidable challenges (Wynne, 1999; Clark, 2000). In contrast, exclusion-based measures are simple and easy to communicate. The six exclusion-based measures satisfied six out of seven desirable properties of core inflation based on the full sample period. The criterion of revertability of headline inflation to core, however, was not satisfied. This was mainly because of sustained low food inflation from January 2017 to August 2019. Controlling for this time period, all the exclusion-based measures, barring CPI excluding food, fuel, petrol, diesel, gold, silver and housing, satisfied the revertability property. Thus, any of five exclusion-based measures (other than excluding food, fuel, petrol, diesel, gold, silver and housing) is suitable to be used as a measure of core inflation in India. Inflation excluding food and fuel is already a commonly used measure of core inflation in monetary policy communication in India. Measures of core inflation play a useful role in the conduct of monetary policy by enabling the central bank to focus on the underlying inflation rather than reacting to transitory changes in inflation. However, volatile components are very much a part of a consumption basket of a typical household. Therefore, the use of core inflation even as an operational guide needs to be clearly communicated by the central bank and should not in any manner suggest that it is diluting its commitment to headline inflation.
References: Apel, M., & Jansson, P. (1999). A parametric approach for estimating core inflation and interpreting the inflation process. Stockholm, Sweden: Sveriges Riksbank. Blinder, A. S. (1997), Commentary, Federal Reserve Bank of St. Louis Review, Vol. May-June 1997, 157-160. Bryan, M. F., & Cecchetti, S. G. (1993). The consumer price index as a measure of inflation (No. w4505). National Bureau of Economic Research. Bryan, M. F., & Pike, C. J. (1991). Median price changes: an alternative approach to measuring current monetary inflation. Federal Reserve Bank of Cleveland Economic Commentary, 1. Bryan, M. F., Cecchetti, S. G., & II, R. L. W. (1997). Efficient inflation estimation (No. w6183). National Bureau of Economic Research. Cecchetti, S. G., & Moessner, R. (2008). Commodity prices and inflation dynamics. BIS Quarterly Review, 55-66. Clark, T. E. (2001). Comparing measures of core inflation. Economic Review-Federal Reserve Bank of Kansas City, 86(2), 5-32. Cogley, T. (2002). A simple adaptive measure of core inflation. Journal of money, credit and banking, 94-113. Das, A., John, J., & Singh, S. (2009). Measuring core inflation in India. Indian Economic Review, 247-273. Dholakia, R. H., & Kadiyala, V. S. (2018). Changing Dynamics of Inflation in India. Economic & Political Weekly, 65-73. Durai, S. R. S., & Ramachandran, M. (2007). Core inflation for India. Journal of Asian Economics, 18(2), 365-383. Eckstein, O. (1981). Core inflation (Vol. 121). Englewood Cliffs, NJ: Prentice-Hall. Figueiredo, F. M. R., & Staub, R. B. (2002). Evaluation and combination of core inflation measures for Brazil. Central Bank of Brazil, Research Department. Goyal, A., & Parab, P. (2019). Inflation convergence and anchoring of expectations in India (No. 2019-023). Indira Gandhi Institute of Development Research, Mumbai, India. Kar, S. (2009). Statistical tools as measures of core inflation for India. Indian Economic Review, 225-245. Marques, C. R., Neves, P. D., & Sarmento, L. M. (2003). Evaluating core inflation indicators. Economic modelling, 20(4), 765-775. Mishkin, F. S. (2007). Headline versus core inflation in the conduct of monetary policy. In Business Cycles, International Transmission and Macroeconomic Policies Conference, HEC Montreal, Montreal, Canada, October. Mohanty, D., Rath, D. P., & Ramaiah, M. (2000). Measures of core inflation for India. Economic and Political Weekly, 273-282. Raj, J., & Misra, S. (2011). Measures of core inflation in India–an empirical evaluation. Reserve Bank of India Occasional Paper, 32(3), 37-66. Rich, R. W., & Steindel, C. (2007). A comparison of measures of core inflation. Economic Policy Review, 13(3). Roger, S. (1998). Core inflation: concepts, uses and measurement. Reserve Bank of New Zealand Discussion Paper, (G98/9). Samanta, G. P. (1999). Core inflation in India: measurement and policy perspectives. Reserve Bank of India Occasional Papers, 20(1), 23-53. Schembri L. L. (2017). Getting to the Core of Inflation, Remarks at Department of Economics, Western University London, Ontario, February. Wynne, M. (2008). Core inflation: a review of some conceptual issues. Federal Reserve Bank of St. Louis Review, (May), 205-228.
Annex |