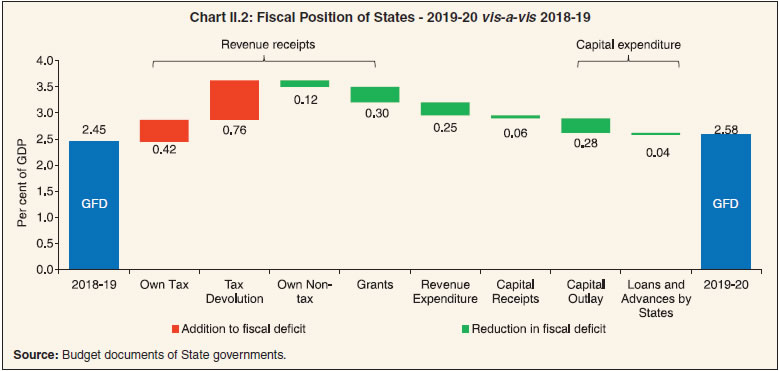
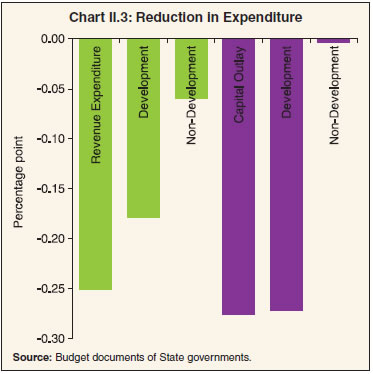
1. Introduction 2.1 This chapter reviews the fiscal performance of States in 2019-20 and 2020-21 as a backdrop to an evaluation of their budget estimates for 2021-22. As most of the States had released their budgets for 2020-21 before the outbreak of the first wave of COVID-19, there were large deviations between budget estimates (BE) for the year and the revised estimates (RE) as well as provisional accounts (PA). In 2021-22 too, most States have presented their budgets before the spread of the second wave; however, deviations from BE are expected to be smaller than in 2020-21 because of less stringent and State-specific restrictions than the nationwide lockdown imposed a year ago. 2.2 The rest of this chapter is divided into nine sections. Section 2 highlights some of the key fiscal indicators of the State governments. Sections 3, 4 and 5 analyse actual budgetary outcomes for 2019-20, RE for 2020-21 and BE for 2021-22, respectively. The expenditure plans of the States, as envisaged in their budget documents, are analysed in Section 6. The evolving role of central transfers in shaping State government finances is discussed in Section 7 against the backdrop of the 15th Finance Commission’s recommendations. While Section 8 describes financing patterns, Section 9 provides an estimate of outstanding liabilities, including contingent liabilities of the States. Section 10 sets out some concluding observations. 2. Key Fiscal Indicators 2.3 States had maintained their combined gross fiscal deficit (GFD) below the FRL1 threshold of 3 per cent of gross domestic product (GDP) since 2005-06, except for the years 2009-10, 2015-16 and 2016-17. The overshooting of GFD-GDP ratio in 2009-10 was due to the response to the global financial crisis, whereas the implementation of Ujwal DISCOM Assurance Yojana (UDAY) was responsible for higher GFD-GDP ratios in 2015-16 and 2016-17 (Chart II.1). In 2020-21, the GFD breached 3 per cent of GDP again under the impact of the pandemic, with spillovers expected in 2021-22 as well. Notably, the revenue deficit (RD) of the States, which was contained at 0.1 per cent of GDP in 2018-19, reached 2.0 per cent of GDP in 2020-21. Commensurately, the primary deficit (PD) of States also deteriorated during the last two years. While both RD and PD are budgeted to decline in 2021-22, the actual outcome will depend on the future course of the pandemic. 3. Fiscal Performance in 2019-20 (Accounts) 2.4 The consolidated GFD of the State governments deteriorated marginally in 2019-20 from its level a year ago (Table II.1). This was caused by a decline in revenue receipts due to a slowdown in economic activity, though its effects were partially offset by rationalisation of expenditure. 2.5 The consolidated RD of the States widened sizably in 2019-20, mainly because of a decline in revenue receipts from 13.9 per cent of GDP in 2018-19 to 13.1 per cent in 2019-20. Underlying the decline in revenue receipts was a sharp fall in the States’ own tax revenue due to lower mobilisation under sales tax and State goods and services tax (SGST) as well as a decline in tax devolution from the Centre (Chart II.2). 2.6 States’ non-tax revenue continued to increase for the second consecutive year in 2019-20, led by general services, which primarily include unclaimed deposits, sale of land and property, guarantee fees and the like. Grants from the Centre also increased during the year due to higher statutory grants (Finance Commission grants) and the GST compensation cess. Under capital receipts, recovery of loans and advances posted a rise (Table II.2). 2.7 In the face of dwindling revenue receipts, States took recourse to expenditure compression to adhere to the FRL target (Chart II.3). As a consequence, developmental expenditure on crop husbandry, water supply and sanitation, social security and welfare, housing and rural development was squeezed while capex was cut in key social and economic services like water supply and sanitation, medical and public health, irrigation and flood control, transport and rural development. This experience underscores the importance of raising additional resources at the sub-national levels. | Table II.1: Major Deficit Indicators- All States and Union Territories with Legislature | | (₹ lakh crore) | | Item | 2007-12
(Average) | 2012-17
(Average) | 2017-18 | 2018-19 | 2019-20 | 2020-21
(BE) | 2020-21
(RE) | 2021-22
(BE) | | 1 | 2 | 3 | 4 | 5 | 6 | 7 | 8 | 9 | | Gross Fiscal Deficit | 1.48 | 3.47 | 4.10 | 4.63 | 5.25 | 6.22 | 9.32 | 8.19 | | (Per cent of GDP) | (2.2) | (2.7) | (2.4) | (2.5) | (2.6) | (3.2) | (4.7) | (3.7) | | Revenue Deficit | -0.16 | 0.10 | 0.19 | 0.18 | 1.21 | -0.04 | 3.95 | 1.18 | | (Per cent of GDP) | (-0.3) | (0.1) | (0.1) | (0.1) | (0.6) | (0.0) | (2.0) | (0.5) | | Primary Deficit | 0.30 | 1.48 | 1.17 | 1.44 | 1.73 | 2.34 | 5.38 | 3.80 | | (Per cent of GDP) | (0.4) | (1.1) | (0.7) | (0.8) | (0.9) | (1.2) | (2.7) | (1.7) | BE: Budget Estimates. RE: Revised Estimates.
Notes: 1. Negative (-) sign indicates surplus.
2. GDP at current prices, is based on the National Statistical Office (NSO)’s National Accounts 2011-12 series.
Source: Budget documents of State governments. |
| Table II.2: Aggregate Receipts of State Governments and UTs | | (₹ lakh crore) | | Item | 2017-18 | 2018-19 | 2019-20 | 2020-21 (RE) | 2021-22 (BE) | | 1 | 2 | 3 | 4 | 5 | 6 | | 1. Revenue Receipts (a+b) | 23.21 | 26.20 | 26.70 | 27.91 | 34.55 | | | (13.6) | (13.9) | (13.1) | (14.1) | (15.5) | | a. States’ Own Revenue (i+ii) | 13.10 | 14.34 | 14.85 | 14.53 | 18.81 | | | (7.7) | (7.6) | (7.3) | (7.4) | (8.4) | | i. States’ Own Tax | 11.30 | 12.15 | 12.24 | 12.41 | 15.95 | | | (6.6) | (6.4) | (6.0) | (6.3) | (7.2) | | ii. States’ Own Non-Tax | 1.80 | 2.19 | 2.61 | 2.11 | 2.87 | | | (1.1) | (1.2) | (1.3) | (1.1) | (1.3) | | b. Central Transfers (i+ii) | 10.11 | 11.87 | 11.85 | 13.38 | 15.73 | | | (5.9) | (6.3) | (5.8) | (6.8) | (7.1) | | i. Shareable Taxes | 6.05 | 7.47 | 6.51 | 5.90 | 6.90 | | | (3.5) | (4.0) | (3.2) | (3.0) | (3.1) | | ii. Grants-in Aid | 4.06 | 4.40 | 5.35 | 7.48 | 8.83 | | | (2.4) | (2.3) | (2.6) | (3.8) | (4.0) | | 2. Non-Debt Capital Receipts (i+ii) | 0.40 | 0.42 | 0.57 | 0.17 | 0.22 | | | (0.2) | (0.2) | (0.3) | (0.1) | (0.1) | | i. Recovery of Loans and Advances | 0.40 | 0.41 | 0.57 | 0.16 | 0.15 | | | (0.2) | (0.2) | (0.3) | (0.1) | (0.1) | | ii. Miscellaneous Capital Receipts | 0.00 | 0.01 | 0.00 | 0.02 | 0.07 | | | (0.0) | (0.0) | (0.0) | (0.0) | (0.0) | RE: Revised Estimates. BE: Budget Estimates.
Note: Figures in parentheses are per cent of GDP.
Source: Budget documents of State governments. |
 4. Developments in 2020-21 (Revised Estimates and Provisional Accounts) 2.8 State governments budgeted a higher GFD2 for 2020-21 in view of the onset of COVID-19 in India at the time of presentation of their budgets (Table II.3). The impact of the pandemic on the State finances, however, turned out to be more severe than anticipated. Revenue collections were hit hard by the nationwide lockdown introduced in March 2020. 2.9 With the easing of lockdown restrictions towards the second half of the year, the focus shifted to fiscal consolidation with a recovery in revenue collection, certainty on GST compensation cess and rationalisation of expenditure. For the year as a whole, the consolidated GFD of the States surged to a historical high3, with revenue receipts falling short of the budgeted amounts by more than 2.7 per cent of GDP. The provisional data on 26 States from the Comptroller and Auditor General of India (CAG) and budget estimates of the remaining five States and UTs indicate that the GFD-GDP ratio was closer to the RE than to the BE (Table II.3). | Table II.3: Fiscal Position of States | | (₹ lakh crore) | | Item | 2020-21 (BE) | 2020-21 (PA) | | 1 | 2 | 3 | | I. Revenue Receipts | 33.31 | 26.25 | | | (16.9) | (13.3) | | a) Tax Revenue | 23.16 | 18.12 | | | (11.7) | (9.2) | | b) Non-Tax Revenue | 2.72 | 1.73 | | | (1.4) | (0.9) | | c) Grants-in-Aid | 7.43 | 6.39 | | | (3.8) | (3.2) | | II. Capital Receipts | 0.20 | 0.14 | | | (0.1) | (0.1) | | a) Recovery of Loans and Advances | 0.16 | 0.14 | | | (0.1) | (0.1) | | b) Other Receipts | 0.04 | 0.00 | | | (0.0) | (0.0) | | III. Revenue Expenditure | 33.27 | 29.70 | | | (16.9) | (15.0) | | Of which: Interest payments | 3.89 | 3.62 | | | (2.0) | (1.8) | | IV. Capital Expenditure | 6.46 | 5.02 | | | (3.3) | (2.5) | | (a) Capital Outlay | 5.98 | 4.59 | | | (3.0) | (2.3) | | (b) Loans and Advances Disbursed | 0.47 | 0.43 | | | (0.2) | (0.2) | | V. Gross Fiscal Deficit | 6.22 | 8.32 | | | (3.2) | (4.2) | | VI. Revenue Deficit | -0.04 | 3.45 | | | (0.0) | (1.7) | | VII. Primary Deficit | 2.34 | 4.70 | | | (1.2) | (2.4) | Note: (1) Figures in parentheses are per cent of GDP.
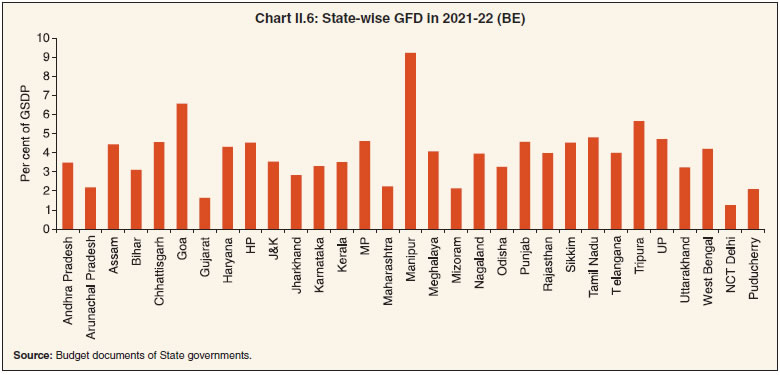
(2) Data for 2020-21 Provisional Accounts (PA) are accounts figures of 26 States available with CAG, and for the remaining 5 States/UTs 2020-21 Budget Estimates (BE) figures are used to arrive at all States and UTs.
Sources: Budget documents of State governments; and CAG. |
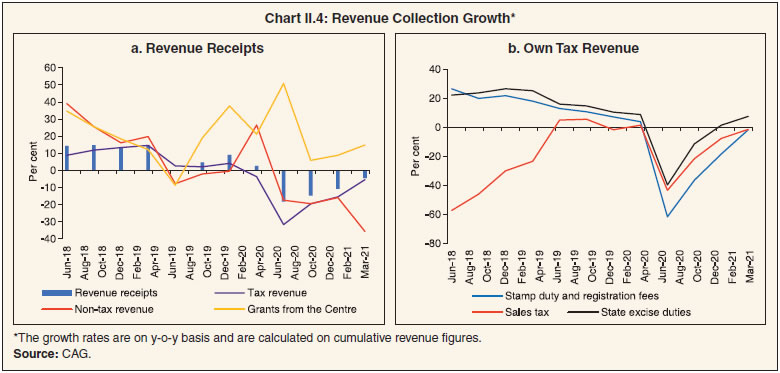 2.10 All categories of taxes started recovering from the second half of the year as economic activity resumed. Consequently, contractions in own tax revenue and other revenue receipts started becoming smaller, with the former returning to positive terrain in Q4:2020-21. Own non-tax revenues, with a small share in total revenue receipts relative to own tax revenue, continued to lag behind (Chart II.4). Additionally, 22 States/ UTs hiked their duties on petrol and diesel and 25 States/UTs hiked duties on alcohol to offset some of the revenue loss. Thus, the total compensation funds which flowed to States amounted to ₹2.01 lakh crore (₹1.10 lakh crore back-to-back loans and ₹0.91 lakh crore compensation cess) (Box II.1). Box II.1:
GST Compensation Cess in 2020-21 – Accounting Practices among States At the time of its introduction, States’ revenue subsumed under GST was legislatively4 protected for the transition period of five years (2017-18 to 2021-22) with the assumption of a constant growth of 14 per cent per annum over the 2015-16 revenue base. Any shortfall was to be funded through additional taxation (compensation cess) on sin/luxury goods. The compensation cess collections were sufficient for the Centre to cover the shortfall in GST collections of State governments in 2017-18 and 2018-19. However, there was a shortfall in cess collection due to the slowdown in economic activity in 2019-20, which increased further in 2020-21 due to the crippling effect of the pandemic on government finances (Chart 1). GST compensation for the financial years 2017-18, 2018-19 and 2019-20 has already been paid to the States which recorded these amounts under revenue receipts as grants from the Centre. During 2020-21, the impact of the pandemic warranted higher compensation due to lower GST collections. Further, GST compensation cess collections were lower, widening the gap with the requirement for compensation. In October 2020, the Union Government decided to borrow ₹1.10 lakh crore from the market in tranches during the second half of 2020-21 and provide them as back-to-back loans to States in lieu of compensation cess for shortfall in their revenue in 2020-21. Apart from ₹1.10 lakh crore compensation, the Centre had also provided ₹0.91 lakh crore to States out of the GST compensation fund in 2020-21 (Table 1). 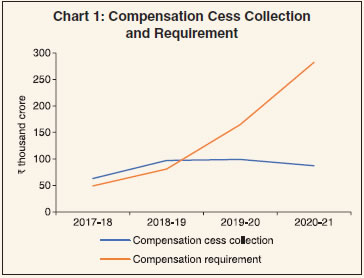 Subsequent to deliberations in the 43rd GST Council meeting, it has been decided that the Centre will borrow ₹1.59 lakh crore from the market through a special window in the current financial year and pass it on to the States/ UTs as a back-to-back loan in appropriate tranches as was done last year. As per this decision ₹1.59 lakh crore has been released to States/ UTs by October 28, 2021. Besides, the Centre has already released compensation cess of ₹60,000 crore for 2021-22. Also, the GST council voted to extend the levy of compensation cess till March 2026 to enable the Centre to repay loans taken to compensate States for the GST collection shortfall. So, the Centre has given GST compensation cess to States in 2020-21 in two forms: (1) as grants under revenue receipts, as in previous years; and (2) as back to back loans to State governments. The accounting treatment of the loans raised can have an impact on the GFD and liabilities of States. If the entire amount of cess would have been given in the form of grants, it would have improved the revenue receipts position of States to that order. Given that part of it is provided as loans, a corresponding reduction in receipts has increased the States’ GFD in 2020-21 (RE) to that extent. Given that neither principal nor interest will be paid by States on these loans, they do not have to bear any associated costs. Concomitantly, while the increment in GFD will be added to outstanding liabilities (debt) of States, there is no servicing involved. So, strictly speaking, it should not add to the liabilities of the States. | Table 1: GST Compensation Cess Released | | (₹ crore) | | | 2020-21 | 2021-22 | | Compensation through back to back loan through special window | 1,10,208 | 1,59,000 | | Compensation cess released from Fund | 91,000 | 60,000 | | Total | 2,01,208 | 2,19,000 | | Source: Press Information Bureau. | An analysis of State budgets for 2021-22 reveals that the 26 States/UTs which have availed this facility have followed differential accounting practices (Table 2). The majority have accounted this amount under loans from the Centre. The balance have either accounted this amount under grants from the Centre, which reduces the fiscal deficit, or have not accounted for it at all. It would be useful for the Comptroller and Auditor General of India (CAG) to provide guideline on appropriate and homogeneous treatment in this regard. In this Report, States’ fiscal accounts have been compiled on the basis of the varying accounting practices that they have adopted as described above. | Table 2: Back to Back Loans to States/UTs in 2020-21 (RE) | | State/UT | (₹ crore) | Share (per cent) | | 1. Andhra Pradesh | 2,311 | 2.1 | | 2. Assam | 994 | 0.9 | | 3. Bihar | 3,905 | 3.5 | | 4. Chhattisgarh | 3,109 | 2.8 | | 5. Delhi | 5,865 | 5.3 | | 6. Goa | 840 | 0.8 | | 7. Gujarat | 9,222 | 8.4 | | 8. Haryana | 4,352 | 3.9 | | 9. Himachal Pradesh | 1,717 | 1.6 | | 10. Jammu and Kashmir | 2,272 | 2.1 | | 11. Jharkhand | 1,689 | 1.5 | | 12. Karnataka | 12,407 | 11.3 | | 13. Kerala | 5,766 | 5.2 | | 14. Madhya Pradesh | 4,542 | 4.1 | | 15. Maharashtra | 11,977 | 10.9 | | 16. Meghalaya | 112 | 0.1 | | 17. Odisha | 3,822 | 3.5 | | 18. Punjab | 8,359 | 7.6 | | 19. Puducherry | 742 | 0.7 | | 20. Rajasthan | 4,604 | 4.2 | | 21. Tamil Nadu | 6,241 | 5.7 | | 22. Telangana | 2,380 | 2.2 | | 23. Tripura | 226 | 0.2 | | 24. Uttar Pradesh | 6,007 | 5.5 | | 25. Uttarakhand | 2,316 | 2.1 | | 26. West Bengal | 4,431 | 4.0 | | Total | 1,10,208 | 100.0 | Note: Arunachal Pradesh, Manipur, Mizoram, Nagaland and Sikkim have not availed of this loan.
Source: Union Budget, 2021-22. | | 2.11 States’ revenue expenditure increased sharply during April 2020, reflecting the measures taken by them to support life and livelihood, viz., insurance cover for doctors and nurses; purchase of medical equipment and tools; hospital arrangements with sufficient number of beds for COVID-19 patients; providing food free of cost; cash transfer to those who did not avail of any government schemes; cash transfer to registered construction workers; remitting a fixed sum for those residents trapped in other States; and advance salary and pension payments (Chart II.5 and Table II.4). Some States also adopted revenue expenditure rationalisation measures like dearness allowance freeze, deferment of part or full salaries and wages, and deduction from salaries to create fiscal space for accommodating higher expenditure on medical and social services. 2.12 After a dip in April 2020, capex growth recovered swiftly in the second half of the year, which augers well for the economy in the medium-term. To boost capital expenditure by the States, the Centre announced the scheme of “Special Assistance to States for Capital Expenditure” on October 12, 2020 as part of the Aatma Nirbhar Bharat package. Capital expenditure proposals of ₹11,912 crore for 27 States were approved under this scheme by the Centre to fund projects in sectors like health, rural development, water supply, irrigation, power, transport, education and urban development. 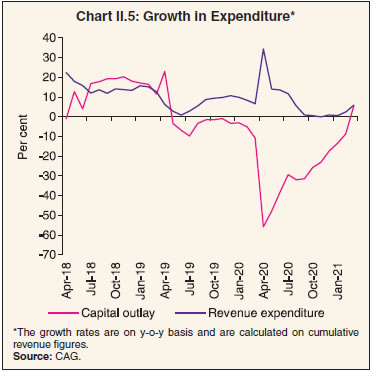
| Table II.4: Expenditure Pattern of State Governments | | (₹ lakh crore) | | Item | 2017-18 | 2018-19 | 2019-20 | 2020-21 (RE) | 2021-22 (BE) | | 1 | 2 | 3 | 4 | 5 | 6 | | Aggregate Expenditure (1+2 = 3+4+5) | 27.72 | 31.25 | 32.52 | 37.40 | 42.95 | | | (16.2) | (16.5) | (16.0) | (18.9) | (19.3) | | 1. Revenue Expenditure | 23.40 | 26.38 | 27.92 | 31.86 | 35.72 | | of which: | (13.7) | (14.0) | (13.7) | (16.1) | (16.0) | | Interest Payments | 2.93 | 3.19 | 3.51 | 3.93 | 4.39 | | | (1.7) | (1.7) | (1.7) | (2.0) | (2.0) | | 2. Capital Expenditure | 4.31 | 4.87 | 4.60 | 5.54 | 7.23 | | of which: | (2.5) | (2.6) | (2.3) | (2.8) | (3.2) | | Capital Outlay | 3.94 | 4.40 | 4.18 | 5.04 | 6.67 | | | (2.3) | (2.3) | (2.1) | (2.6) | (3.0) | | 3. Development Expenditure | 18.77 | 21.01 | 21.63 | 25.27 | 29.11 | | | (11.0) | (11.1) | (10.6) | (12.8) | (13.1) | | 4. Non-Development Expenditure | 8.26 | 9.44 | 10.05 | 11.22 | 12.88 | | | (4.8) | (5.0) | (4.9) | (5.7) | (5.8) | | 5. Others* | 0.68 | 0.80 | 0.83 | 0.91 | 0.96 | | | (0.4) | (0.4) | (0.4) | (0.5) | (0.4) | RE: Revised Estimates. BE: Budget Estimates.
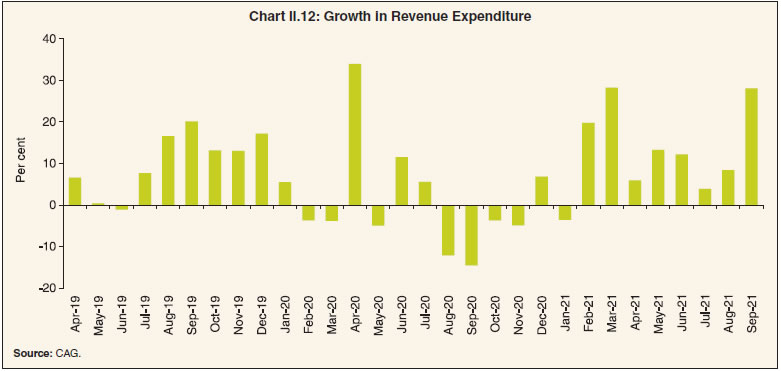
*: Includes grants-in-aid and contributions (compensation and assignments to local bodies).
Notes: 1. Figures in parentheses are per cent of GDP.
2. Capital Expenditure includes Capital Outlay and Loans and Advances by the State Governments.
Source: Budget documents of State governments. | 5. Budget Estimates for 2021-22 2.13 For 2021-22, States have budgeted the GFD-GDP ratio at 3.7 per cent, with most of them breaching the 3.0 per cent threshold (Table II.5 and Chart II.6). The improvement over 2020-21 is expected to be achieved through higher revenue receipts. States have also budgeted a revenue deficit, departing from the recent practice of budgeting a revenue surplus. Most of the States have presented their budget before the onset of the second wave of COVID-19. | Table II.5: Deficit Indicators of State Governments: State-wise | | (Per cent) | | State/UT | 2019-20 | 2020-21 (RE) | 2021-22 (BE) | | RD/GSDP | GFD/GSDP | PD/GSDP | RD/GSDP | GFD/GSDP | PD/GSDP | RD/GSDP | GFD/GSDP | PD/GSDP | | 1 | 2 | 3 | 4 | 5 | 6 | 7 | 8 | 9 | 10 | | 1 Andhra Pradesh | 2.7 | 4.1 | 2.3 | 3.5 | 5.5 | 3.3 | 0.5 | 3.5 | 1.3 | | 2 Arunachal Pradesh | -9.5 | 3.7 | 1.5 | -19.4 | 2.3 | -0.5 | -21.8 | 2.2 | -0.9 | | 3 Assam | 0.4 | 4.4 | 3.1 | 1.9 | 9.0 | 7.3 | -1.4 | 4.4 | 2.4 | | 4 Bihar | -0.1 | 2.1 | 0.2 | 0.8 | 7.1 | 5.0 | -1.3 | 3.1 | 1.1 | | 5 Chhattisgarh | 2.8 | 5.2 | 3.8 | 3.5 | 6.5 | 4.7 | 1.0 | 4.6 | 2.9 | | 6 Goa | 0.3 | 2.5 | 0.6 | 0.1 | 4.6 | 2.7 | -0.1 | 6.6 | 4.5 | | 7 Gujarat | -0.1 | 1.5 | 0.1 | 1.3 | 3.1 | 1.6 | -0.1 | 1.6 | 0.3 | | 8 Haryana | 2.2 | 3.9 | 1.9 | 2.7 | 3.3 | 1.0 | 3.7 | 4.3 | 1.8 | | 9 Himachal Pradesh | 0.0 | 3.4 | 0.8 | 0.3 | 4.5 | 1.5 | 0.8 | 4.5 | 1.6 | | 10 Jharkhand | -0.6 | 2.5 | 0.8 | 0.3 | 3.2 | 1.5 | -0.3 | 2.8 | 1.1 | | 11 Karnataka | -0.1 | 2.3 | 1.2 | 1.2 | 3.5 | 2.1 | 0.8 | 3.3 | 1.8 | | 12 Kerala | 1.7 | 2.8 | 0.5 | 2.9 | 4.3 | 1.8 | 1.9 | 3.5 | 1.0 | | 13 Madhya Pradesh | 0.3 | 3.5 | 2.0 | 2.3 | 5.7 | 3.9 | 0.8 | 4.6 | 2.7 | | 14 Maharashtra | 0.6 | 1.9 | 0.7 | 1.7 | 3.3 | 1.9 | 0.3 | 2.2 | 0.8 | | 15 Manipur | -1.4 | 2.2 | 0.1 | -2.1 | 9.9 | 8.3 | -3.6 | 9.2 | 7.8 | | 16 Meghalaya | 0.4 | 3.2 | 1.0 | -2.8 | 4.6 | 2.1 | -3.3 | 4.1 | 1.4 | | 17 Mizoram | -0.8 | 4.9 | 3.5 | 2.5 | 6.9 | 5.7 | -1.5 | 2.1 | 1.1 | | 18 Nagaland | 0.7 | 4.8 | 2.1 | 2.6 | 9.6 | 6.7 | -2.7 | 4.0 | 1.0 | | 19 Odisha | -0.4 | 3.4 | 2.3 | -0.4 | 3.3 | 1.9 | -1.0 | 3.3 | 2.0 | | 20 Punjab | 2.6 | 3.1 | -0.1 | 3.9 | 5.4 | 1.9 | 1.6 | 4.6 | 0.7 | | 21 Rajasthan | 3.6 | 3.8 | 1.4 | 4.4 | 6.1 | 3.5 | 2.0 | 4.0 | 1.6 | | 22 Sikkim | 4.4 | 6.8 | 5.1 | 0.9 | 6.1 | 4.4 | -0.9 | 4.5 | 2.7 | | 23 Tamil Nadu | 2.0 | 3.3 | 1.6 | 3.5 | 5.5 | 3.6 | 2.8 | 4.8 | 2.8 | | 24 Telangana | 0.7 | 3.3 | 1.8 | 1.7 | 4.3 | 2.8 | -0.6 | 4.0 | 2.5 | | 25 Tripura | 4.3 | 5.8 | 3.8 | 3.9 | 6.9 | 4.7 | 2.6 | 5.7 | 3.5 | | 26 Uttar Pradesh | -4.0 | -0.7 | -2.7 | 0.8 | 4.7 | 2.5 | -1.2 | 4.7 | 2.4 | | 27 Uttarakhand | 0.8 | 3.0 | 1.2 | 1.3 | 4.4 | 2.2 | 0.0 | 3.2 | 1.1 | | 28 West Bengal | 1.6 | 3.0 | 0.4 | 2.6 | 4.0 | 1.4 | 1.8 | 4.2 | 1.9 | | 29 Jammu and Kashmir | 0.2 | 5.6 | 2.4 | -7.1 | 12.2 | 8.7 | -13.9 | 3.5 | -0.2 | | 30 NCT Delhi | -0.9 | 0.1 | -0.3 | 0.5 | 1.6 | 1.2 | -0.2 | 1.3 | 0.9 | | 31 Puducherry | 0.1 | 1.0 | -0.8 | 1.8 | 2.8 | 0.7 | 1.3 | 2.1 | 0.0 | | All States/UTs | 0.6 | 2.6 | 0.9 | 2.0 | 4.7 | 2.7 | 0.5 | 3.7 | 1.7 | RE: Revised Estimates. BE: Budget Estimates. GFD: Gross Fiscal Deficit RD: Revenue Deficit PD: Primary Deficit
GSDP: Gross State Domestic Product
Note: Negative (-) sign in deficit indicators indicates surplus.
Source: Budget documents of State governments. |
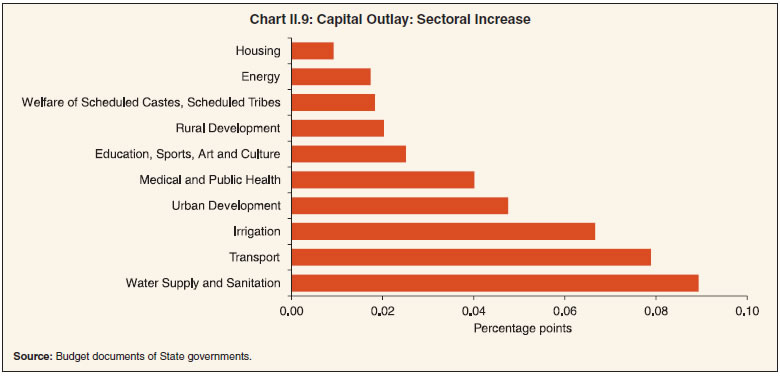
 Receipts 2.14 States expect higher revenue receipts in 2021-22, primarily driven by their own tax revenue from SGST, States’ excise duty and sales tax collections (Table II.2). Tax devolution from the Centre is also budgeted to increase on the expectation of higher revenue collection by the Centre from different heads. In addition, ₹1.59 lakh crore has already been given to the States by the Centre for GST compensation in the form of back-to-back loans and ₹0.60 lakh crore from GST compensation fund, as explained in Box II.1. Expenditure 2.15 States’ total expenditure is budgeted to increase moderately in 2021-22. This expenditure growth is expected to be driven by capex, while revenue spending (as a per cent of GDP) will be compressed (Table II.4). Expenditure on social services, which recorded a sharp increase during 2020-21(RE) due to higher spending on medical and health services, is budgeted to increase further in 2021-22 (Chart II.7). Within social services, the share of water supply and sanitation, housing, urban development, and social security is expected to get a boost (Table II.6). States have budgeted a marginal increase in committed expenditure in 2021-22, led primarily by administrative expenditure (Chart II.8). 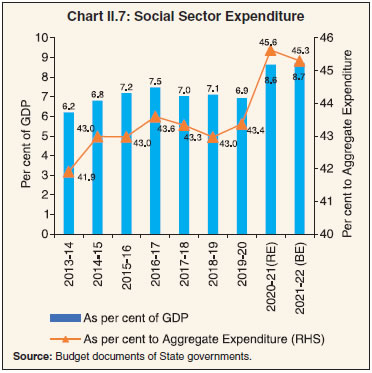
Table II.6: Composition of Expenditure on Social Services
(Revenue and Capital Accounts) | | (Per cent of expenditure on social services) | | Item | 2016-17 | 2017-18 | 2018-19 | 2019-20 | 2020-21 (RE) | 2021-22 (BE) | | 1 | 2 | 3 | 4 | 5 | 6 | 7 | | Expenditure on Social Services (a to l) | 100.0 | 100.0 | 100.0 | 100.0 | 100.0 | 100.0 | | (a) Education, Sports, Art and Culture | 43.0 | 42.9 | 41.8 | 43.8 | 39.5 | 38.3 | | (b) Medical and Public Health | 11.8 | 12.3 | 12.3 | 12.5 | 13.1 | 13.0 | | (c) Family Welfare | 1.9 | 2.0 | 2.1 | 2.2 | 2.1 | 2.1 | | (d) Water Supply and Sanitation | 6.5 | 7.0 | 6.6 | 5.3 | 6.2 | 7.6 | | (e) Housing | 3.2 | 3.8 | 3.5 | 2.6 | 3.7 | 4.0 | | (f) Urban Development | 8.0 | 7.6 | 7.6 | 7.4 | 8.3 | 9.1 | | (g) Welfare of SCs, ST and OBCs | 6.9 | 7.4 | 6.9 | 7.7 | 7.1 | 7.4 | | (h) Labour and Labour Welfare | 0.8 | 0.9 | 1.0 | 0.9 | 1.0 | 1.1 | | (i) Social Security and Welfare | 10.9 | 10.4 | 11.9 | 10.9 | 10.9 | 11.0 | | (j) Nutrition | 2.4 | 2.3 | 2.1 | 2.2 | 2.3 | 2.1 | | (k) Expenditure on Natural Calamities | 2.9 | 1.6 | 2.6 | 3.2 | 4.3 | 2.7 | | (l) Others | 1.6 | 1.8 | 1.6 | 1.3 | 1.6 | 1.7 | RE: Revised Estimates. BE: Budget Estimates.
Source : Budget documents of State governments. | 2.16 They have also budgeted a higher capital outlay in 2021-22 (BE) vis-à-vis 2020-21(RE), mainly in social services. As a result of the need to upscale heath infrastructure in the face of the multi-year nature of pandemic, higher spending is budgeted in medical and public health. Capex outlays have also been increased for urban development, water supply and sanitation, irrigation and transport (Chart II.9). Actual Outcome in 2021-22 So Far 2.17 Monthly data from the CAG indicate that States’ revenue receipts increased sharply on a y-o-y basis in H1:2021-22. States’ revenue receipts are running higher than in H1:2019-20 (pre-COVID year) as well, despite the adverse impact of localised restrictions imposed in the wake of the second wave (Chart II.10). 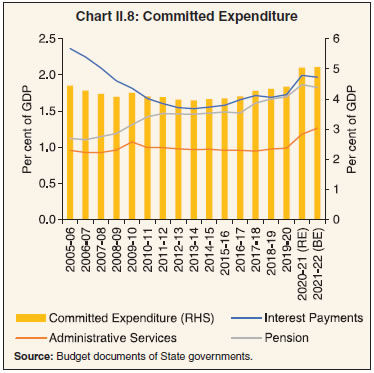
 2.18 At a disaggregated level, revenue receipts were largely driven by own tax revenue and non-tax revenue in H1:2021-22 (Chart II.11a). Among own tax revenue sources, States’ GST and sales tax collections performed relatively better during this period (Chart II.11b). Following the Centre’s move to reduce excise duty on petrol and diesel by ₹5 and ₹10 per litre, respectively, on November 3, 2021, 21 States and UTs (with legislature) have also reduced their value added tax (VAT) in the range of ₹1.8 to ₹10.0 per litre for petrol and ₹2.0 to ₹7.0 per litre for diesel. The revenue loss to States due to reduction in VAT is estimated at 0.08 per cent of GDP. This, however, is expected to generate counter-cyclical policy response and translate into a positive impact on GDP, especially, if States abstain from spending cuts to compensate their revenue loss. 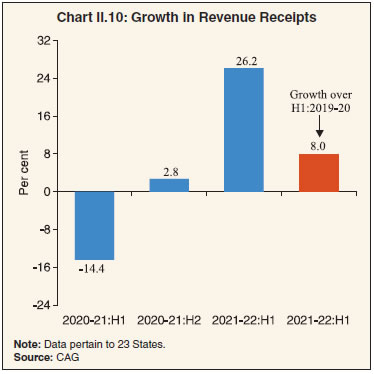 2.19 The second wave forced States to provide financial support to different sections of society during the first few months of the year. For instance, three States, viz., Odisha, Kerala and Karnataka, have explicitly announced relief packages amounting to around ₹22,000 crore (0.1 per cent of GDP). Other States have also made additional COVID related spending. The government of Tamil Nadu incurred additional expenditure of ₹17,618.8 crore on COVID related relief, including cash support and additional food subsidies. Consequently, the revenue expenditure of the State governments increased sharply in May 2021 before subsiding by July (Chart II.12). In September, revenue spending increased sharply in line with robust revenue receipt growth. Chhattisgarh, Kerala, Madhya Pradesh, Meghalaya, Punjab, Rajasthan and Telangana received permission to borrow an additional amount of ₹16,691 crore as an incentive on achieving the capital expenditure target set by the Ministry of Finance for H1:2021-22. 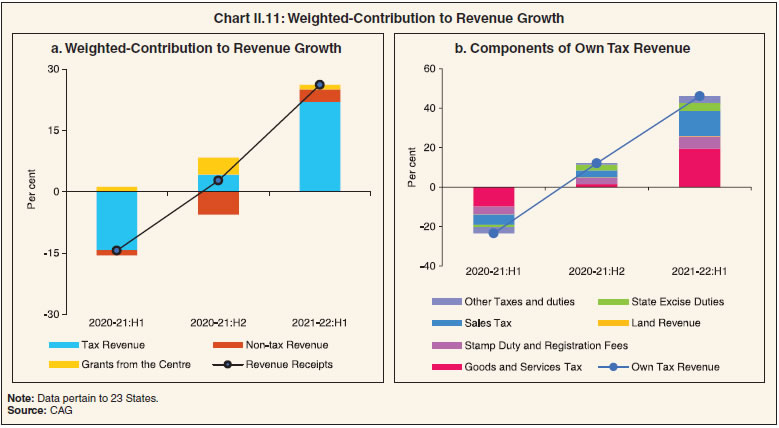
 6. Expenditure Plans by States in 2021-22 2.20 The twin impact of a contraction in economic activity and increase in the fiscal deficit to accommodate the fiscal stimulus has resulted in a worsening of debt to GDP ratios of States. Even as the sharp expenditure cutback by the Centre is expected to bring about a deceleration in the growth of primary expenditure of the general government in 2021-22 (BE), the budget estimates of the States reveal a continuation of robust expenditure growth (Chart II.13a and b). 2.21 In terms of the composition of States’ spending, enhancing social protection, improving human capital (healthcare and education) and building physical infrastructure have assumed critical importance during the pandemic. It is also necessary to improve expenditure on research and development to optimise benefits from the above three expenditure categories (Box II.2). 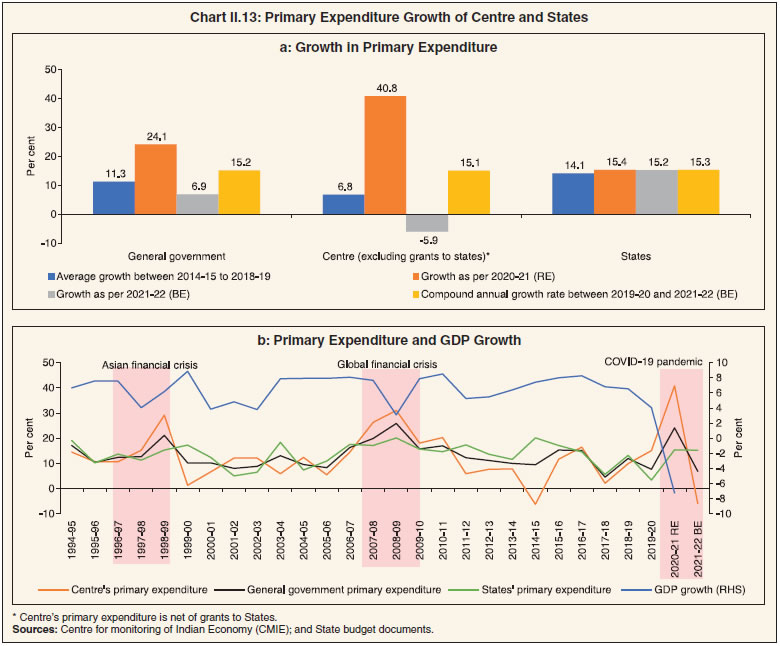
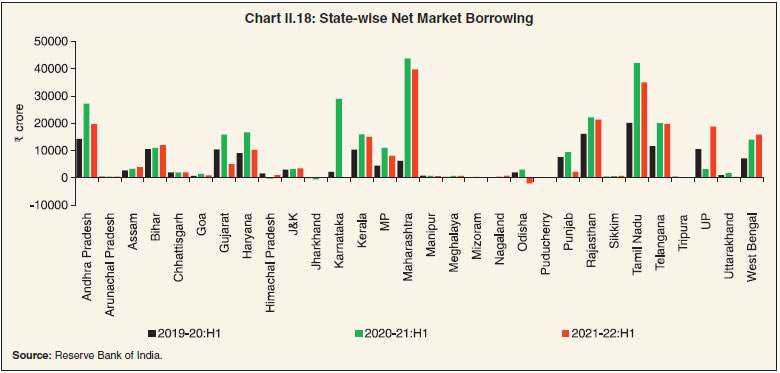
Box II.2:
Research and Development Related Expenditure by States One of the six themes around which the Union Budget of India 2021-22 is organized is ‘Innovation and R&D.’ This theme underpins the modalities of the National Research Foundation, which was announced in 2019. The Union Budget aims to spend ₹5,000 crores on this head over the next five years. According to the Report on R&D Statistics and Indicators 2019-20 of the Ministry of Science and Technology (India)5, the gross expenditure on research and development (GERD) in India was 0.7 per cent of GDP in 2017-18, which is lower than other BRICS countries – GERD was 1.3 per cent of GDP in Brazil; 1.1 per cent in Russian Federation; 2.1 per cent in China; and 0.8 per cent in South Africa. Most of the OECD countries spend more than 2 per cent of their GDP on R&D. In this box: -
in the first step, expenditure under two major heads i.e., (i) Agricultural Research and Education; and (ii) Science, Technology and Environment are collected from the annual financial statements (AFS) of each State. -
Given the possibilities that there may be some additional expenditures on R&D made by the State governments which are not covered under the two major heads of the AFS, the book-wise6 budget documents of each State are examined for the keyword ‘Research’ (or ‘अनुसंधान if the budget is published in Hindi) and aggregated. -
In the third step, the detailed demand book data (department-wise) for research instead of the data given in the AFS are taken in case of discrepancies vis-à-vis the latter. -
In the fourth step, the R&D expenditures are classified into few broad categories viz., Medical; Health; Family Welfare and Sanitation; Education; Labour Research; and Infrastructure Research. Based on this compilation method, the consolidated R&D related expenditure of the State governments works out to a meagre 0.2 per cent GDP for both 2018-19 and 2019-20. There is, however, a considerable variation in the R&D related expenditure across States (Chart 1). The detailed classification reveals that a significant portion of the R&D related expenditure was incurred on medical, health, family welfare, and sanitation (63.4 per cent in 2018-19 and 66.2 per cent in 2019-20 RE) (Chart 2). The share of agriculture research in total R&D expenditure stood at 27.4 per cent in 2018-19 and 23.5 per cent in 2019-20. The share of R&D expenditure on environment research has increased from 0.5 per cent in 2018-19 to 2.1 per cent in 2019-20, whereas the share of R&D related expenditure on education has remained unchanged at 1.3 per cent. In a pilot study for a few States, it was found that the bulk of R&D expenditures was administrative in nature, whereas the programme expenditure component was low.
References Research & Development Statistics at a Glance 2019-20, Department of Science & Technology, Ministry of Science & Technology, Government of India. https://dst.gov.in/sites/default/files/R%26D%20Statistics%20at%20a%20Glance%202019-20.pdf OECD (2011), Special Feature: Governments’ role in promoting R&D, Public Finance and Economics, Government at a Glance 2011, OECD Publishing, Paris. | 2.22 The expenditure of States on social safety nets7 saw a sharp upturn in 2020-21(RE) across all sub-categories. In 2021-22 (BE), deceleration in expenditure on nutrition programme and contraction in expenditure on natural calamities is budgeted (Chart II.14a). Despite a sharp increase compared to pre-COVID years, expenditure on healthcare at 6.6 per cent of primary expenditure in 2021-22 is significantly lower than the 8 per cent target set by the National Health Policy 2017 (Chart II.14b). Expenditure on education moderated in 2020-21 (RE) but is budgeted to recover in 2021-22 (Chart II.14c). States have budgeted significantly higher capital expenditure in 2021-22 than in preceding years (Chart II.14d). 2.23 The fifteenth Finance Commission (FC-XV) has recommended sector-specific grants from the Union Government to protect vulnerable communities. It has also recommended relaxed borrowing limit for State governments to create fiscal space for accommodating priority expenditure. 7. Role of Finance Commission Transfers 2.24 The Finance Commission (FC), appointed by the President of India under Article 280 of the constitution is the most important institution governing the transfer of resources from the Union Government to States. It recommends the share of taxes collected by the Centre to be devolved to States and its inter-se distribution among different States (Article 270). In addition, FCs recommend revenue grants to States for various purposes (Article 275). Although the composition of these grants has varied over time, grants for bridging the post-devolution revenue deficit of States have been the mainstay, and grants to local bodies have accounted for an increasing share (RBI, 2021b). 2.25 In the period between 2015-16 to 2019-20, corresponding to the tenure of the Fourteenth Finance Commission (FC-XIV), FC transfers averaged 30.9 per cent of States’ revenues. The overall reliance of States on central transfers increased in this period compared to the five years prior (corresponding to the tenure of the Thirteenth Finance Commission) (Chart II.15a). The increase in transfers has helped offset the increase in asymmetry (vertical imbalance) between the decentralisation of receipts and expenditure (Chart II.15b). 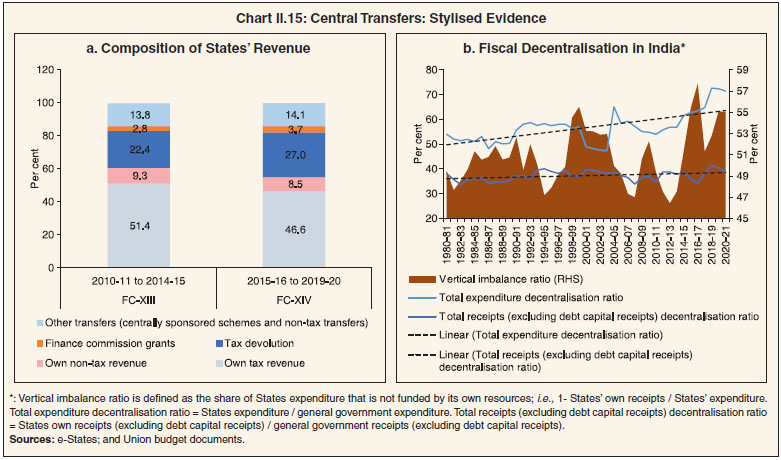 2.26 Regarding the share of individual States in tax devolution and grants, FCs have traditionally been guided by considerations of need, equity and efficiency. The distribution of Finance Commission transfers (tax devolution and grants) has a progressive element, aimed at mitigating the inherent fiscal disabilities of poorer States and enabling them to provide basic services and incur development expenditure. On a standardised measure of variability – the coefficient of variation (CoV) – Finance Commission transfers are found to reduce this inherent variability in States’ own tax revenue, thus ensuring fiscal convergence (Chart II.16). 2.27 Under the FC-XV’s recommendation presented to the Parliament on February 1, 2021 relating to resource transfers to States during 2020-21 to 2025-26, status quo (after adjusting for the share of Jammu and Kashmir) is proposed on the tax devolution ratio at 41 per cent but changes are envisaged in the ratio of allocation to individual States. 2.28 On revenue grants, the FC-XV has made a departure vis-à-vis earlier commissions. In addition to grants for bridging the revenue deficit, funding local governments and augmenting disaster relief funds, FC-XV has given a thrust to social sector grants with a particular focus on health and education. In addition, the commission has recommended sectoral grants for agriculture, rural roads, aspirational districts, judiciary and statistics. The Union Government has, however, not accepted the commission’s recommendations except for health sector grants. As regards grants for local government, the commission has attached entry-level conditions for access. 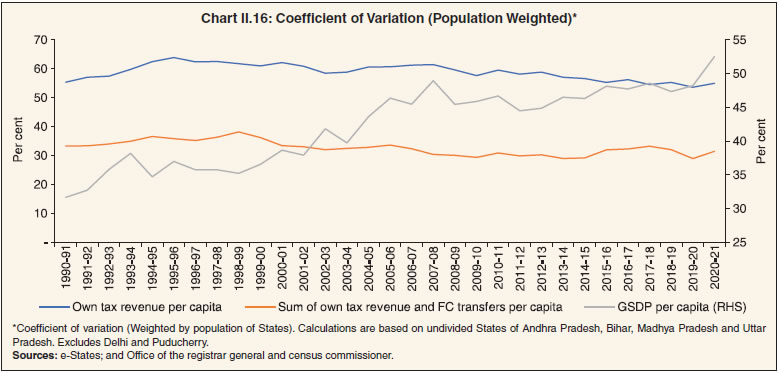 2.29 Considering the extraordinary fiscal stress from the pandemic on State finances and the potential need for stimulus for recovery in the years ahead, FC-XV has proposed relaxations in the borrowing limits for States. The normal limit of net borrowing has been fixed at 4 per cent of GSDP for 2021-22, 3.5 per cent for 2022-23 and 3 per cent for 2023-24 to 2025-26. An additional conditional borrowing of 0.5 per cent of GSDP has been proposed for the years 2021-22 to 2024-25, predicated on reforms in the power distribution sector. 8. Financing of GFD and Market Borrowings by State Governments Financing of GFD 2.30 The dependence of States on market borrowings for the financing of GFD has been secularly increasing from less than 15 per cent in 1994-95 to 94.8 per cent in 2019-20. Following the recommendation of the FC-XIV to exclude States (barring Delhi, Madhya Pradesh, Kerala and Arunachal Pradesh) from the National Small Savings Fund (NSSF) financing facility, the share of market borrowing in financing the GFD of States jumped to an all-time high in 2019-20. While the share of market borrowing declined in 2020-21 (RE), it is budgeted to increase in 2021-22 (BE) (Table II.7). Market Borrowing 2.31 The gross market borrowing of States/ UTs picked up to ₹7.99 lakh crore in 2020-21 – a growth of 25.9 per cent – from ₹6.35 lakh crore a year ago. The higher borrowings reflect pandemic-related uncertainty around revenue collections and higher government expenditure (Chart II.17). During H1:2021-22, the gross market borrowing was 12.6 per cent lower than the corresponding period of last year. 2.32 Net market borrowing grew by 33.7 per cent to ₹6.52 lakh crore in 2020-21 and contracted by 21.2 per cent during H1:2021-22 relative to the corresponding period a year ago. The increase in net market borrowing was concentrated in a few States like Assam, Bihar, Himachal Pradesh, Jammu and Kashmir, Jharkhand, Nagaland, Sikkim, Uttar Pradesh and West Bengal (Chart II.18). As per the recently released indicative calendar, States are expected to avail ₹2.02 lakh crore of market borrowing during October-December 2021. | Table II.7: Decomposition and Financing Pattern of Gross Fiscal Deficit | | (Per cent of GFD) | | Item | 2017-18 | 2018-19 | 2019-20 | 2020-21 (RE) | 2021-22 (BE) | | 1 | 2 | 3 | 4 | 5 | 6 | | Decomposition (1+2+3-4) | 100.0 | 100.0 | 100.0 | 100.0 | 100.0 | | 1. Revenue Deficit | 4.6 | 3.8 | 23.2 | 42.4 | 14.4 | | 2. Capital Outlay | 95.9 | 95.1 | 79.7 | 54.1 | 81.5 | | 3. Net Lending | -0.4 | 1.2 | -2.8 | 3.6 | 4.9 | | 4. Non-debt Capital Receipts | 0.0 | 0.2 | 0.1 | 0.2 | 0.8 | | Financing (1 to 8) | 100.0 | 100.0 | 100.0 | 100.0 | 100.0 | | 1. Market Borrowings | 84.0 | 80.6 | 94.8 | 77.8 | 85.1 | | 2. Loans from Centre | 1.1 | 1.9 | 2.1 | 10.0 | 5.3 | | 3. Special Securities issued to NSSF/Small Savings | -7.9 | -7.3 | -6.1 | -3.3 | -3.9 | | 4. Loans from LIC, NABARD, NCDC, SBI and Other Banks | 3.1 | 3.9 | 4.0 | 1.2 | 3.0 | | 5. Provident Fund | 8.2 | 10.3 | 7.6 | 4.5 | 4.5 | | 6. Reserve Funds | 0.9 | 3.8 | -5.2 | -2.9 | 0.7 | | 7. Deposits and Advances | 15.6 | 11.1 | 8.2 | 3.6 | 0.3 | | 8. Others | -5.1 | -4.3 | -5.4 | 9.1 | 5.2 | RE: Revised Estimates. BE: Budget Estimates.
Notes: 1. See Notes to Appendix Table 9.
2. 'Others' include Compensation and Other Bonds, Loans from Other Institutions, Appropriation to Contingency Fund, Inter-State Settlement, Contingency Fund, Suspense and Miscellaneous, Remittance and Overall Surplus/Deficit.
Source: Budget documents of State governments. |

 2.33 During 2020-21, the States undertook 742 issuances (of which 56 were re-issuances) as against 636 issuances in 2019-20 (of which 114 were re-issuances). Following the policy of passive consolidation, States such as Madhya Pradesh, Maharashtra, Punjab and Tamil Nadu undertook re-issuances in 2020-21. Passive consolidation of States continued during H1:2021-22 as out of 262 issuances undertaken by States, 21 were re-issuances (Table II.8). 2.34 The standard plain vanilla issuances amounted to 36.3 per cent of the total amount of issuances in 2020-21. The rest (64.7 per cent) was spread across non-standard maturities. Twenty-six States and the UT of Puducherry issued securities of non-standard maturities, ranging between 1.5 and 35 years. Reflecting these debt consolidation efforts, 64.2 per cent of the outstanding State development loans (SDLs) was in the residual maturity bucket of five years and above as on March 2021 (Table II.9). SDL redemptions are likely to be more than double from 2021-22 to 2026-27 and beyond (Chart II.19a). | Table II.8: Market Borrowings of State Governments | | (₹ crore) | | Item | 2018-19 | 2019-20 | 2020-21 | 2021-22* | | 1 | 2 | 3 | 4 | 5 | | 1. Maturities during the year | 1,29,680 | 1,47,067 | 1,47,038 | 2,09,143# | | 2. Gross sanction under Article 293(3) | 5,50,071 | 7,12,744 | 9,69,525 | 5,89,981 | | 3. Gross amount raised during the year | 4,78,323 | 6,34,521 | 7,98,816 | 3,08,972 | | 4. Net amount raised during the year | 3,48,643 | 4,87,454 | 6,51,777 | 2,35,741 | | 5. Amount raised during the year to total Sanctions (per cent) | 87 | 89 | 82 | 52 | | 6. Weighted average yield of SDLs | 8.32 | 7.24 | 6.55 | 6.88 | | 7. Weighted average spread over corresponding G-Sec (bps) | 65 | 55 | 52 | 48 | | 8. Average inter- State spread (bps) | 6 | 6 | 10 | 4 | *: As on September 30, 2021.
#: Data for maturity pertain to full year.
Source: Reserve Bank of India. |
Table II.9: Maturity Profile of Outstanding State Government Securities
(As at end-March 2021) | | (Per cent) | | State/UT | Per cent of Total Amount Outstanding | | 0-1 year | 1-3 years | 3-5 years | 5-7 years | Above 7 years | | 1 | 2 | 3 | 4 | 5 | 6 | | 1. Andhra Pradesh | 4.0 | 16.3 | 17.0 | 12.3 | 50.5 | | 2. Arunachal Pradesh | 0.6 | 7.6 | 8.3 | 25.5 | 57.9 | | 3. Assam | 3.6 | 6.3 | 19.4 | 20.3 | 50.4 | | 4. Bihar | 3.1 | 20.1 | 25.6 | 22.4 | 28.8 | | 5. Chhattisgarh | 5.0 | 16.3 | 27.9 | 33.1 | 17.7 | | 6. Goa | 3.4 | 11.5 | 14.3 | 19.4 | 51.4 | | 7. Gujarat | 7.3 | 13.2 | 17.1 | 22.2 | 40.3 | | 8. Haryana | 5.2 | 19.1 | 19.8 | 18.8 | 37.1 | | 9. Himachal Pradesh | 6.1 | 12.3 | 16.5 | 20.9 | 44.2 | | 10. Jharkhand | 3.2 | 13.4 | 19.9 | 16.2 | 47.3 | | 11. Karnataka | 3.8 | 9.5 | 15.1 | 22.3 | 49.2 | | 12. Kerala | 5.3 | 18.4 | 19.6 | 20.4 | 36.4 | | 13. Madhya Pradesh | 4.9 | 15.4 | 17.8 | 19.6 | 42.4 | | 14. Maharashtra | 8.2 | 17.5 | 18.4 | 18.9 | 36.9 | | 15. Manipur | 2.1 | 8.9 | 15.1 | 16.4 | 57.4 | | 16. Meghalaya | 3.5 | 8.6 | 14.3 | 24.5 | 49.1 | | 17. Mizoram | 8.3 | 12.3 | 11.9 | 16.4 | 51.0 | | 18. Nagaland | 5.6 | 13.2 | 17.2 | 24.5 | 39.4 | | 19. Odisha | 18.5 | 34.7 | 14.3 | 7.1 | 25.4 | | 20. Punjab | 8.0 | 14.8 | 13.1 | 17.6 | 46.6 | | 21. Rajasthan | 4.9 | 15.2 | 21.5 | 17.2 | 41.2 | | 22. Sikkim | 0.6 | 5.0 | 14.7 | 28.1 | 51.5 | | 23. Tamil Nadu | 3.6 | 14.6 | 18.1 | 22.7 | 41.1 | | 24. Telangana | 3.4 | 0.9 | 14.5 | 20.2 | 61.0 | | 25. Tripura | 2.8 | 11.1 | 6.8 | 19.8 | 59.5 | | 26. Uttar Pradesh | 5.1 | 6.6 | 14.1 | 23.0 | 51.2 | | 27. Uttarakhand | 3.4 | 10.2 | 15.1 | 29.1 | 42.2 | | 28. West Bengal | 6.5 | 12.2 | 13.5 | 17.6 | 50.2 | | 29. Jammu and Kashmir | 6.7 | 10.4 | 9.2 | 20.6 | 53.1 | | 30. Puducherry | 7.8 | 16.6 | 20.9 | 16.2 | 38.4 | | All States and UTs | 5.3 | 13.4 | 17.1 | 20.0 | 44.2 | | Source: Reserve Bank records. | 2.35 At the beginning of Q1:2020-21, the SDL yields traded with a softening bias (Chart II.19b). From end-June 2020, various developments, viz., a downgrade of India’s sovereign credit rating outlook by Fitch Ratings coupled with higher supply kept SDL yields firm till September. Thereafter, yields softened as the Reserve Bank increased the limit of SLR securities kept under the held to maturity (HTM) category by 2.5 per cent of NDTL – from 19.5 per cent to 22 per cent. During February 2021, SDL yields were additionally impacted by international factors, viz., rise in US yields and crude oil prices. Overall, the weighted average (cut-off) yield (WAY) of SDLs issued during 2020-21 stood at 6.55 per cent, compared with 7.24 per cent a year ago. The weighted average spread of SDL issuances over corresponding tenor of Union Government G-Sec stood at 52.72 basis points (bps) in 2020-21 as compared with 55.02 bps in the previous year. The average inter-State spread during 2020-21 stood at 10 bps as against 6 bps a year ago; by mid-July 2021, it declined to around 5 bps. During 2021-22 so far (up to September 30, 2021), the WAY of SDLs stood at 6.88 per cent, while the weighted average spread of SDL issuances over corresponding tenor of Union Government G-Sec stood at 47.74 bps. The average inter-State spread on securities of 10-year tenor (fresh issuances) was 4 bps in H1:2021-22 as compared with 9 bps in H1:2020-21. Status of Additional Market Borrowing 2.36 Given the additional expenditure requirements in order to cope with the pandemic, the Centre allowed States additional borrowing of up to 2 per cent of GSDP for the year 2020-21 on May 17, 2020. Within this additional borrowing limit, 0.5 per cent was kept unconditional; 1 per cent was linked to four citizen-centric areas of reforms: (i) implementation of One Nation One Ration Card System, (ii) ease of doing business reform, (iii) urban local body/ utility reforms and (iv) power sector reforms; and the remaining 0.5 per cent was linked to the completion of at least 3 reforms mentioned above. 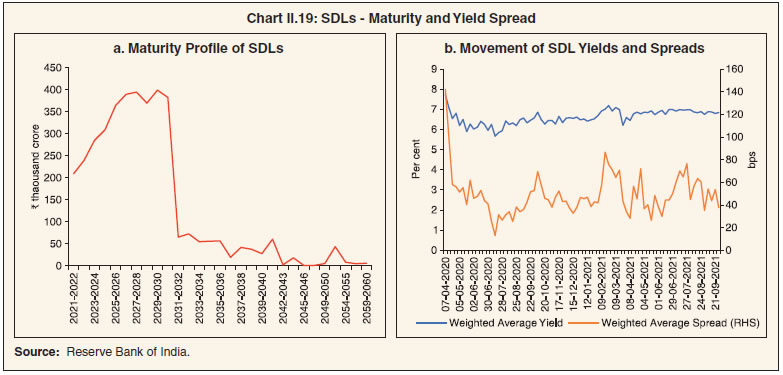 2.37 One Nation One Ration Card system ensures the availability of rations to beneficiaries under the National Food Security Act (NFSA) and other welfare schemes, especially migrant workers and their families at any electronic point of sale (e-PoS) enabled Fair Price Shop (FPSs) of their choice anywhere in the country. It also enables States to target beneficiaries better and eliminate bogus/duplicate/ineligible card-holders. An additional borrowing limit of 0.25 per cent of GSDP is allowed to States only on completion of both of the following actions: (i) Aadhar Seeding of all the ration cards and beneficiaries in the State; and (ii) Automation of all the FPSs in the State. During 2020-21, 17 States could comply with this reform and received permission to raise ₹37,600 crore from the Centre. 2.38 For ease of doing business, the recommended reforms include: (i) completion of the first assessment of ‘District Level Business Reform Action Plan’8; (ii) elimination of the requirements of renewal of registration certificates/approvals/ licences obtained by businesses under various Acts; and (iii) implementation of a computerised central random inspection system. During 2020-21, 20 States could complete the reform and accordingly, the Centre granted permission to raise additional financial resources of ₹39,521 crore through market borrowings. 2.39 Urban utility reforms aim to financially strengthen urban local bodies (ULBs) and enable them to provide better public health and sanitation services to citizens. The set of reforms stipulated by the Centre to achieve these objectives are: (i) the State will notify: (a) floor rates of property tax in ULBs which are in consonance with the prevailing circle rates (i.e. guideline rates for property transactions), and (b) floor rates of user charges in respect of the provision of water supply, drainage and sewerage which reflect current costs/past inflation; (ii) the State will put in place a system of periodic increase in floor rates of property tax/ user charges in line with price increases. Eleven States successfully undertook this reform and were granted additional open market borrowing permission of ₹15,957 crore in 2020-21. 2.40 Under power sector reform, States can get an additional borrowing of 0.25 per cent of GSDP if they can: (i) meet the target set for the reduction in aggregate technical and commercial (AT&C) losses (0.05 per cent of GSDP); (ii) achieve the targeted reduction in the gap between average cost of supply and average revenue realisation (ACS-ARR) (0.05 per cent of GSDP); and (iii) implement direct benefit transfer (DBT) of electricity subsidy to farmers (0.15 per cent of GSDP). As many as 13 States successfully met the target of either (i) or (ii), while six States undertook the third reform in the power sector. These States were granted additional borrowing permission of ₹13,201 crore. 2.41 The final instalment of 0.5 per cent was linked to carrying out at least three out of four reforms stipulated by the Government of India. However, the conditionality was waived later, and all the States were granted permission for this additional borrowing. The relaxation of borrowing limits and deviations from the FRL target during the pandemic calls for a revised fiscal roadmap aimed towards fiscal consolidation in the medium term (Box II.3). Financial Accommodation to States 2.42 The Report of the Advisory Committee on Ways and Means Advances to State Governments (Chairman: Shri Sumit Bose) that was constituted in 2015 reviewed the Ways and Means Advances (WMA) limits of the States and retained the limit at ₹32,225 crores for all States/UTs together. The WMA limit of States/ UTs was increased by 60 per cent on April 17, 2020 (to ₹51,560 crore) over the level of ₹32,225 crore prevailing on March 31, 2020. In order to provide greater flexibility to State governments to tide over their cash-flow mismatches, the overdraft (OD) scheme for State governments was relaxed on April 7, 2020, whereby the number of days a State can continue to be in OD was increased from 14 to 21 consecutive working days and from 36 to 50 working days in a quarter. These interim measures were initially valid until September 30, 2020 and were later extended till March 31, 2021. Subsequently, the Advisory Committee on Ways and Means Advances to State Governments (Chairman: Shri Sudhir Shrivastava) reviewed the WMA limits (Box II.4). Considering the uncertainties related to the ongoing pandemic, the Reserve Bank decided to continue with the enhanced WMA limits up to March 31, 2022. During 2020-21, 18 States/UTs have availed the special drawing facility (SDF), 15 States/UTs resorted to WMA, and 8 States/ UTs availed OD. During 2021-22:H1, 14 States/ UTs have availed SDF, 14 States/UTs resorted to WMA and 6 States/UTs availed OD. Box II.3:
Revised Fiscal Roadmap for States - An Analysis After restraining the consolidated GFD-GDP ratio within 2.6 per cent during 2017-18 to 2019-20, State finances deteriorated in 2020-21 due to the adverse impact of the COVID-19 pandemic. The GFD widened to 4.7 per cent of GDP in 2020-21 (RE), which is the highest since 2003-049. The RD, which was eliminated in 2018-19, widened to 2.0 per cent of GDP in 2020-21 (RE) caused by shortfall in revenue receipts and higher revenue expenditure on healthcare and other social services. The primary deficit, which was contained at 0.7 per cent of GDP during 2017-18 to 2019-20, also increased to 2.7 per cent of GDP in 2020-21 (RE). In view of States’ fiscal stress, the Centre allowed additional borrowing limit in 2020-21, as explained earlier, with clauses to ensure effective utilisation as well as to account for off-budget borrowings. While the States have been sanctioned borrowing limit of only 3.5 per cent of GSDP for 2021-22 upfront, the balance 0.5 per cent has been earmarked for incremental capital expenditure, which will be reviewed by the Centre thrice during the year. Also, the borrowing limit gets adjusted in accordance with States’ failure to take over the DISCOM losses as per UDAY guidelines - 50 per cent of the States’ unreimbursed losses of DISCOMS for the year 2020-21 will be deducted from the borrowing ceiling of 2021-22. After considering the relaxations extended to the States in terms of borrowing limits, the FC-XV has provided a revised fiscal roadmap which aims at phasing out the incentive-based additional borrowing limit by 2025-26 (Table 1). During the first two years, the relaxed fiscal limits are aimed at ensuring no sudden drop in resource availability for States, with a return to the pre-pandemic fiscal target of 3 per cent by 2023-24. | Table 1: Net Borrowing Limits recommended as Fiscal Consolidation Roadmap for States (FC-XV) | | (Per cent of GDP) | | Item | 2021-22 | 2022-23 | 2023-24 | 2024-25 | 2025-26 | | Revised limit proposed by FC-XV | 4.0 | 3.5 | 3.0 | 3.0 | 3.0 | | Incentive-based extra borrowing | 0.5 | 0.5 | 0.5 | 0.5 | | | Upper net borrowing limit | 4.5 | 4.0 | 3.5 | 3.5 | 3.0 | | Lower net borrowing limit | 3.0 | 3.0 | 3.0 | 3.0 | 3.0 | | Source: Report of FC-XV. | These estimates, however, are subject to the assumptions made by the FC-XV at the time of making projections and may deviate from the actual outcome with changes in economic conditions. For instance, the budget estimates of States for 2021-22 indicates a GFD-GDP ratio of 3.7 per cent, 30 basis points lower than the FC-XV projection (4 per cent). Second, the FC-XV did not anticipate the arrival of the second wave in the first half of 2021-22, and accordingly, its assumptions on States’ revenue, expenditure and GDP may vary from actual outcomes. So far, the States’ rolling targets indicate their consolidation intention, as evident from the heat map (Table 2). |
Box II.4:
Advisory Committee on Ways and Means Advances to State Governments - Key Recommendations Ways and means advances (WMA) to States are periodically reviewed. Following the decision taken in the 31st Conference of State Finance Secretaries held on March 18, 2019, the Reserve Bank set up the Advisory Committee on WMA in August 2019 (Chair: Shri Sudhir Shrivastava) which made the following recomendations: -
The Committee calculated WMA limits on the basis of the total expenditure of State governments so as to correspond to the fiscal size of States. The formula-based revised limit works out to ₹47,010 crore. As the formula-based WMA limit was lower than the interim limit, the Committee was of the view that the interim WMA limit of ₹51,560 crore may continue for 6 months i.e., up to September 30, 2021. Thereafter, depending on the course of the pandemic and its impact on the economy, the Reserve Bank may review the limit, either based on the methodology suggested by the Committee or as may be necessary, after assessing the requirement of States. The Committee also recommended that the prevailing interest rate on SDF/ WMA/ OD may be retained. -
The OD Regulations may continue and the interim relaxations on OD may cease to exist by March 31, 2021. The Committee recommended that the operating limit of SDF should continue to be calculated against the collateral of investments in G-sec/ ATBs and the annual incremental investments in the consolidated sinking fund (CSF) and guarantee redemption fund (GRF) without any upper limit, and the usual haircut margin of 5 per cent shall be applied. -
The limitation on availing SDF against investment in 91-day Treasury Bills (T-bills) may be removed and States may be allowed to invest in 91-day T-bills without the restriction of 90 days, provided the SDF/ WMA availed prior to such investment is fully repaid. Likewise, permitting States to invest their cash surplus in Auction Treasury Bills (ATBs) only when they have not availed WMA in the immediately preceding period of 90 consecutive days may also be removed. However, States may not avail SDF after investing their cash balances in 91-day T-bills. -
The CSF and GRF are reserve funds, constituted voluntarily by States for a specific purpose, and need to be built up. Hence, the Committee urged the remaining States to join CSF/ GRF schemes, which would facilitate withdrawals to repay liabilities in times of need, and to avail SDF for managing temporary cash flow mismatches. The Committee recommended that a minimum corpus of at least 5 per cent of the total liabilities/ guarantees outstanding at the end of the previous financial year may be built in CSF and GRF within the next 5 years, which may be maintained on a rolling basis thereafter. -
Withdrawals from the CSF may be allowed after a lock-in period of 2 years from constituting the Fund in place of the prevailing lock-in period of 5 years. The limit on the quantum of withdrawal from the CSF to the amount of redemption due for that year towards market borrowing may be removed. States may be allowed to use the total quantum of interest accrued and accumulated in the Fund (up to the end of previous financial year) for repayment of outstanding liabilities. On building the minimum corpus, States may be allowed to withdraw from CSF any sum in excess of the minimum corpus for repayment of outstanding liabilities. -
The provision in CSF/ GRF schemes which necessitate consultation with State governments for selection of securities in case of premature disinvestment from CSF/ GRF may be removed for operational convenience. The Reserve Bank may be allowed to decide on the securities to be liquidated, provided the securities chosen for disinvestment are in profit at the time of sale. States may, accordingly, amend their CSF and GRF schemes and notify the same in their Official Gazettes. | Cash Management of State Governments 2.43 In recent years, States/UTs have been accumulating sizeable cash surpluses in intermediate treasury bills (ITBs) and auction treasury bills (ATBs). Although positive cash balances indicate low intra-year fiscal pressure, they involve a negative carry on interest rates, warranting improvement in cash management practices. The outstanding investments of States in ITBs as at end-March 2021 stood at ₹2,05,230 crore as against ₹1,54,757 crore in the previous year, while outstanding investments of States in ATBs stood at ₹41,293 crore at end-March 2021 as against ₹33,504 crore at end-March 2020 (Table II.10). During 2021-22 so far (as on September 30, 2021) outstanding investments of States in ITBs stood at ₹1,20,777 crore, while outstanding investments of States/UTs in ATBs stood at ₹96,510 crore. Table II.10: Investment of Surplus Cash Balance of State Governments/UT
(Outstanding as on March 31) | | (₹ crore) | | Item | 2017-18 | 2018-19 | 2019-20 | 2020-21 | 2021-22* | | 1 | 2 | 3 | 4 | 5 | 6 | | 14-Day (ITBs) | 1,50,871 | 1,22,084 | 1,54,757 | 2,05,230 | 1,20,777 | | ATBs | 62,108 | 73,927 | 33,504 | 41,293 | 96,510 | | Total | 2,12,979 | 1,96,011 | 1,88,261 | 2,46,523 | 2,17,287 | #: As on September 30, 2021.
Source: Reserve Bank of India. | States’ Reserve Funds 2.44 Given the increasing borrowing requirements of States and mounting contingent liabilities, it is desirable to keep adequate buffers to minimise the fiscal stress arising from redemption pressures and unforeseen liabilities. State governments maintain the Consolidated Sinking Fund (CSF) and the Guarantee Redemption Fund (GRF) with the Reserve Bank as a buffer for repayment of their future liabilities. States can also avail a special drawing facility (SDF) at a discounted rate from the Reserve Bank against incremental funds invested in CSF and GRF. Currently, 24 States and one Union Territory are members of the CSF scheme, while 17 States are members of the GRF scheme (Table II.11). Outstanding investment by States in the CSF and GRF stood at ₹1,27,208 crores and ₹8,405 crore, respectively, as at end-March 2021, as against ₹1,30,431 crore and ₹7,486 crore, respectively, as at end-March 2020. Table II.11: Investment in CSF/GRF by States/UT
(As on March 31, 2021) | | (₹ crore) | | State | CSF | GRF | CSF as per cent of Outstanding Liabilities | | 1 | 2 | 3 | 4 | | 1. Andhra Pradesh | 8,667 | 854 | 2.4 | | 2. Arunachal Pradesh | 1,684 | 2 | 12.2 | | 3. Assam | 3,981 | 57 | 4.4 | | 4. Bihar | 5,832 | - | 2.6 | | 5. Chhattisgarh | 4,890 | - | 4.9 | | 6. Goa | 623 | 314 | 2.4 | | 7. Gujarat | 5,090 | 502 | 1.3 | | 8. Haryana | 807 | 1,261 | 0.3 | | 9. Jharkhand | 288 | - | 0.3 | | 10. Karnataka | 6,045 | - | 1.5 | | 11. Kerala | 2,248 | - | 0.7 | | 12. Madhya Pradesh | - | 960 | 0.0 | | 13. Maharashtra | 43,978 | 660 | 8.3 | | 14. Manipur | 162 | 105 | 1.3 | | 15. Meghalaya | 755 | 43 | 5.4 | | 16. Mizoram | 367 | 47 | 3.5 | | 17. Nagaland | 1,720 | 35 | 11.8 | | 18. Odisha | 11,694 | 1,523 | 7.4 | | 19. Punjab | 1,146 | - | 0.4 | | 20. Rajasthan | - | - | 0.0 | | 21. Tamil Nadu | 6,937 | - | 1.2 | | 22. Telangana | 5,920 | 1,292 | 2.2 | | 23. Tripura | 388 | 9 | 1.9 | | 24. Uttar Pradesh | 970 | - | 0.2 | | 25. Uttarakhand | 3,410 | 134 | 4.5 | | 26. West Bengal | 9,300 | 608 | 1.9 | | 27. Puducherry | 307 | - | 3.1 | | Total | 1,27,208 | 8,405 | 2.1 | ‘-’ : Indicates no fund is maintained.
Source: Reserve Bank of India. | 9. Outstanding Liabilities 2.45 In recent years, States’ outstanding debt has showed a gradual upward movement due to inter alia implementation of UDAY, farm loan waivers, and the growth slowdown in 2019-20. Pandemic-related revenue losses and additional expenditure increased the debt-GDP ratio in 2020-21 (RE) (Table II.12). The debt-GSDP ratio is expected to increase for 18 States and UTs during 2021-22 (Statement 20). | Table II.12: Outstanding Liabilities of State Governments and UTs | | Year | Amount | Annual Growth | Debt /GDP | | (End-March) | (₹ lakh crore) | (Per cent) | | 1 | 2 | 3 | 4 | | 2013 | 22.45 | 10.6 | 22.6 | | 2014 | 25.10 | 11.8 | 22.3 | | 2015 | 27.43 | 9.3 | 22.0 | | 2016 | 32.59 | 18.8 | 23.7 | | 2017 | 38.59 | 18.4 | 25.1 | | 2018 | 42.92 | 11.2 | 25.1 | | 2019 | 47.87 | 11.5 | 25.3 | | 2020 | 53.51 | 11.8 | 26.3 | | 2021 (RE) | 61.49 | 14.9 | 31.1 | | 2022 (BE) | 69.47 | 13.0 | 31.2 | RE: Revised Estimates. BE: Budget Estimates.
Sources: 1. Budget documents of State governments.
2. Combined Finance and Revenue Accounts of the Union and the State Governments in India, Comptroller and Auditor General of India.
3. Ministry of Finance, Government of India.
4. Reserve Bank records. | 2.46 The ratio of interest payment to revenue receipts has been increasing in recent years at a steady pace, indicating erosion of debt sustainability (Chart II.20). Composition of Debt 2.47 Market borrowing, the largest component of outstanding debt, is expected to reach 63 per cent at end-March 2022 (Table II.13). On the other hand, the shares of NSSF, loans from banks and financial institutions and public accounts in total outstanding liabilities of the States have declined over the years. The declining trend in borrowings from the Centre reversed in 2020-21 with GST compensation in the form of back-to-back loans from the Centre. Table II.13: Composition of Outstanding Liabilities of State Governments and UTs
(As at end-March) | | (Per cent) | | Item | 2016 | 2017 | 2018 | 2019 | 2020 | 2021 RE | 2022 BE | | 1 | 2 | 3 | 4 | 5 | 6 | 7 | 8 | | Total Liabilities (1 to 4) | 100.0 | 100.0 | 100.0 | 100.0 | 100.0 | 100.0 | 100.0 | | 1. Internal Debt | 72.0 | 73.3 | 72.7 | 72.2 | 73.5 | 74.7 | 76.3 | | of which: | | | | | | | | | (i) Market Loans | 47.1 | 48.8 | 51.4 | 53.5 | 57.2 | 60.5 | 63.6 | | (ii) Special Securities Issued to NSSF | 16.8 | 13.3 | 11.1 | 9.2 | 7.7 | 6.2 | 5.0 | | (iii) Loans from Banks and Financial Institutions | 4.4 | 5.2 | 4.9 | 4.8 | 4.8 | 4.7 | 4.5 | | 2. Loans and Advances from the Centre | 4.6 | 4.0 | 3.8 | 3.6 | 3.0 | 4.1 | 4.3 | | 3. Public Account (i to iii) | 23.3 | 22.6 | 23.5 | 24.1 | 23.4 | 21.1 | 19.3 | | (i) State PF, etc. | 10.9 | 10.7 | 10.3 | 10.2 | 9.8 | 9.2 | 8.7 | | (ii) Reserve Funds | 4.3 | 3.2 | 4.1 | 4.2 | 3.8 | 2.9 | 2.7 | | (iii) Deposits & Advances | 8.1 | 8.7 | 9.1 | 9.7 | 9.7 | 9.0 | 8.0 | | 4. Contingency Fund | 0.1 | 0.1 | 0.1 | 0.1 | 0.1 | 0.1 | 0.1 | RE: Revised Estimates. BE: Budget Estimates.
Source: Same as that for Table II.12. | Contingent Liabilities of States 2.48 After the implementation of UDAY, States could reduce their outstanding guarantees to 2 per cent of GDP in 2016-17 (Table II.14). In recent years, however, the guarantees have been rising again, reaching 2.9 per cent of GDP at end-March 2020, with implications for debt sustainability (Box II.5). | Table II.14: Guarantees issued by State Governments | Year
(End-March) | Guarantees Outstanding | | ₹ lakh crore | Per cent of GDP | | 1 | 2 | 3 | | 2014 | 3.79 | 3.4 | | 2015 | 4.28 | 3.4 | | 2016 | 3.64 | 2.6 | | 2017 | 3.12 | 2.0 | | 2018 | 4.30 | 2.5 | | 2019 | 5.38 | 2.8 | | 2020 | 5.94 | 2.9 | | Source: State governments. |
Box II.5:
Debt Decomposition and Stock-Flow Adjustments across States Standard debt decomposition quantifies the extent to which the change in the stock of debt is explained by changes in overall deficits and how much remains unexplained. This can be numerically explained by the following formula: Splitting the overall deficit into the primary deficit and interest expenditure, An analysis of annual debt accumulation for all Indian States over 2004-05 to 2009-10, 2010-11 to 2014-15, and 2015-16 to 2019-20 by using equation 110 reveals the following: (a) States’ debt declined over 2004-05 to 2009-10 and 2010-11 to 2014-15, but increased by 4.3 per cent in 2015-16 to 2019-20; (b) debt decomposition shows that r minus g has contributed towards lowering the stock of debt accumulation albeit with a lower contribution in the recent period; (c) the contribution of primary deficits in raising States’ debt has been persistent and has successively increased across time periods; (d) after eliminating the effect of these two factors, the stock-flow component (residual11 term which is not explained by these macroeconomic and fiscal variables) has been positive throughout, thus, indicating its importance as a source of debt accumulation (Chart 1). The main determinants of stock-flow adjustments are valuation effects, below the line items like capital injections into public companies, debt forgiveness/reduction, fiscal costs of banking crises (mostly for advanced economies), and/or other contingent liabilities, along with less transparent practices, mostly by EMEs (Bouabdullah, 2017; Weber, 2012). For Indian States, increasing recourse to guarantees in this period could be a possible factor contributing to stock-flow discrepancies (Weber, 2012; Misra et al, 2021). References Bouabdullah O., Westphal, C. C., Warmedinger, T., de Stefani, Roberta, Drudi, F., Setzer, R., & Westphal, A. 2017. Debt Sustainability Analysis for Euro Area Sovereigns: A methodological Framework. ECB Occasional Paper No. 185, April. Misra. S, Gupta, K and Trivedi, Pushpa. 2021. Sub-National Government Debt Sustainability in India: An Empirical Analysis. Macroeconomics and Finance in Emerging Market Economies, 14(3), 1-24. Weber, 2012. Stock-Flow Adjustments and Fiscal Transparency: A Cross-Country Comparison. Fiscal Affairs Department. IMF Working Paper. | 10. Conclusion 2.49 In 2020-21, the first wave of the pandemic posed States the critical challenge of declining revenue and the need for higher spending. To partially offset the revenue shortfall, the States hiked their duties on petrol, diesel and alcohol and focused on rationalising non-priority expenditures to make room for higher expenditure on healthcare and social services. While the GFD of the States overshot the 2020-21(BE) by a wide margin, this needs to be seen in the context of the concerted efforts taken by the Centre, States and the RBI to mitigate the impact of the pandemic on human life and the economy. These measures also helped in reducing fiscal stress on States. 2.50 The year 2021-22 started on a similar note, with the outbreak of the second wave. However, the impact of the second wave on State finances is likely to be less severe than the first wave due to less stringent and localised restrictions imposed this time as opposed to the nationwide lockdown during the first wave of COVID-19. States’ fiscal situation is buoyed by robust tax collection, expected higher tax devolution due to healthy tax collection by the Centre, ₹2.19 lakh crore GST compensation (both back to back loans and compensation cess), lower pressure from revenue spending and relatively lower yields on SDLs. Furthermore, the increased pace of vaccination, waning of the second wave and removal of restrictions are expected to put the economic recovery on a robust and sustainable path, setting the stage for States to map out a credible glide path for fiscal consolidation over the medium term.
|