| CONTENTS | | S.No. | Particulars | | 1. | Select abbreviations | | 2. | Foreword | | 3. | Executive Summary | | 4. | Chapter 1 - Complaints received by Ombudsmen during July 1, 2020 to March 31, 2021 | | 5. | Chapter 2 - The Banking Ombudsman Scheme (BOS), 2006: Activities during July 1, 2020 to March 31, 2021 | | | Receipt of complaints | | | Mode of receipt of complaints | | | Population group-wise distribution of complaints | | | Zone-wise distribution of complaints | | | Complainant group-wise classification of complaints | | | Bank group-wise classification of complaints | | | Nature of complaints handled | | | Disposal of complaints | | | Mode of disposal of maintainable complaints | | | Turn Around Time (TAT) of complaints | | | Grounds for rejection of maintainable complaints | | | Age-wise classification of pending complaints | | | Awards issued | | | Appeals against the decisions of Banking Ombudsmen (BOs) | | 6. | Chapter 3 - The Ombudsman Scheme for Non-Banking Financial Companies (OSNBFC), 2018: Activities during July 1, 2020 to March 31, 2021 | | | Receipt of complaints | | | Cost of handling a complaint | | | Mode of receipt of complaints | | | Complainant group-wise classification of complaints | | | NBFC category-wise complaints received | | | Nature of complaints received | | | Disposal of complaints | | | Mode of disposal of maintainable complaints | | | Appeals against the decisions of the NBFC Ombudsmen (NBFCOs) | | 7. | Chapter 4 - Ombudsman Scheme for Digital Transactions (OSDT), 2019: Activities during July 1, 2020 to March 31, 2021 | | | Receipt of complaints | | | Mode of receipt of complaints | | | Zone-wise distribution of complaints | | | Complainant group-wise classification | | | Entity type-wise classification | | | Nature of complaints handled | | | Disposal of complaints | | | Mode of disposal of maintainable complaints | | | Grounds for rejection of maintainable complaints | | | Age-wise classification of pending complaints | | | Appeals against the decisions of Ombudsmen for Digital Transactions (ODTs) | | 8. | Chapter 5 - Complaints received through Centralised Public Grievance Redress and Monitoring System (CPGRAMS) and applications under Right to Information (RTI) Act, 2005 | | | CPGRAMS | | | RTI Act, 2005 | | 9. | Chapter 6 - Other developments | | | Regulations: Important regulatory measures taken by the Reserve Bank | | | Circular on strengthening of grievance redress mechanism in banks | | | Root Cause Analysis (RCA) of major areas of complaints | | | Status of implementation of the action plan set out in ‘Utkarsh 2022’ for the year, July 1, 2020 to March 31, 2021 | | | Framework for financial education for greater customer awareness | | | Extension of BOS, 2006 to Financially Sound Well-Managed (FSWM) Urban Co-operative Banks (UCBs) | | | Review of Ombudsman Schemes for updation and effective implementation, including through convergence | | | Awareness generation activities of Consumer Education and Protection Department (CEPD) and Ombudsmen | | | Nationwide Bank Customers’ Satisfaction Survey | | | Winding down of Banking Codes and Standards Board of India (BCSBI) | | | Way forward | | 10. | Appendices |
| APPENDICES | | Appendix No. | Appendix Title | | Appendix 2.1 | OBO-wise receipt of complaints in the last two years | | Appendix 2.2 | OBO-wise position of customer complaints handled in the last two years | | Appendix 2.3 | OBO-wise cost for the year July 1, 2020 to March 31, 2021 | | Appendix 2.4 | Mode of receipt of complaints during July 1, 2020 to March 31, 2021 | | Appendix 2.5 | Population group-wise distribution of complaints received during July 1, 2020 to March 31, 2021 | | Appendix 2.6 | Nature of complaints across population groups received during July 1, 2020 to March 31, 2021 | | Appendix 2.7 | Zone-wise distribution of complaints received during July 1, 2020 to March 31, 2021 | | Appendix 2.8 | Complainant group-wise classification of complaints received during July 1, 2020 to March 31, 2021 | | Appendix 2.9 | Bank group-wise classification of complaints received during July 1, 2020 to March 31, 2021 | | Appendix 2.10 | OBO-wise position of complaints disposed during July 1, 2020 to March 31, 2021 | | Appendix 2.11 | OBO-wise break-up of maintainable complaints disposed during July 1, 2020 to March 31, 2021 | | Appendix 2.12 | TAT of complaints disposed during July 1, 2020 to March 31, 2021 - category-wise | | Appendix 2.13 | Age-wise classification of pending complaints as on March 31, 2021 | | Appendix 2.14 | Bank-wise maintainable complaints and their mode of disposal, including through passing of Awards during July 1, 2020 to March 31, 2021 | | Appendix 3.1 | Complaints received by ONBFCOs during July 1, 2020 to March 31, 2021 | | Appendix 3.2 | Cost of handling a complaint ONBFCO-wise during July 1, 2020 to March 31, 2021 | | Appendix 3.3 | Mode of receipt of complaints at ONBFCOs during July 1, 2020 to March 31, 2021 | | Appendix 3.4 | Complainant group-wise receipt of complaints at ONBFCOs during July 1, 2020 to March 31, 2021 | | Appendix 3.5 | ONBFCO-wise position of complaints during July 1, 2020 to March 31, 2021 | | Appendix 3.6 | ONBFCO-wise position of maintainable complaints disposed during July 1, 2020 to March 31, 2021 | | Appendix 3.7 | Entity-wise list of maintainable complaints disposed during July 1, 2020 to March 31, 2021 | | Appendix 4.1 | Office-wise receipt of complaints by OODTs during July 1, 2020 to March 31, 2021 | | Appendix 4.2 | Mode of receipt of complaints by OODTs during July 1, 2020 to March 31, 2021 | | Appendix 4.3 | Zone-wise receipt of OODT complaints during July 1, 2020 to March 31, 2021 | | Appendix 4.4 | Complainant group-wise receipt of complaints at OODTs during July 1, 2020 to March 31, 2021 | | Appendix 4.5 | Office-wise receipt and disposal of complaints received at OODTs during July 1, 2020 to March 31, 2021 | | Appendix 4.6 | OODT-wise distribution of maintainable complaints disposed during July 1, 2020 to March 31, 2021 | | Appendix 4.7 | System Participant-wise distribution of maintainable complaints disposed during July 1, 2020 to March 31, 2021 | | Appendix 4.8 | Position of complaints pending as on March 31, 2021 at OODTs | | Appendix 5.1 | Position of complaints received through CPGRAMS during July 1, 2020 to March 31, 2021 | | Appendix 5.2 | Applications received by OBOs under RTI Act, 2005 during July 1, 2020 to March 31, 2021 | | Appendix 6.1 | Important notifications relating to Customer Service issued by the RBI during July 1, 2020 to March 31, 2021 | | Appendix 6.2 | Number of awareness programmes conducted during July 1, 2020 to March 31, 2021 |
SELECT ABBREVIATIONS | AA | Appellate Authority | BO | Banking Ombudsman | | ADR | Alternate Dispute Resolution | BOS | Banking Ombudsman Scheme | | AFA | Additional Factor of Authentication | BSBDA | Basic Savings Bank Deposit Account | | AI | Artificial Intelligence | CDD | Customer Due Diligence | | APBS | Aadhaar Payment Bridge System | CEPC | Consumer Education and Protection Cell | | ARC | Asset Reconstruction Company | CEPD | Consumer Education and Protection Department | | ATM | Automated Teller Machine | CIBIL | Credit Information Bureau of India Limited | | BBPCU | Bharat Bill Payment Central Unit | CIC | Credit Information Company | | BBPOU | Bharat Bill Payment Operating Unit | CKYCR | Central KYC Records Registry | | BBPS | Bharat Bill Payment System | CMS | Complaint Management System | | BC | Business Correspondent | CNP | Card Not Present | | BCSBI | Banking Codes and Standards Board of India | CPGRAMS | Centralised Public Grievance Redress and Monitoring System | | CRPC | Centralised Receipt and Processing Center | GoI | Government of India | | CTS | Cheque Truncation System | HFC | Housing Finance Company | | DG | Deputy Governor | IMPS | Immediate Payment System | | DLA | Digital Lending Application | IO | Internal Ombudsman | | DO | Dealing Official | IRDAI | Insurance Regulatory and Development Authority of India | | DRBIO | Deputy RBI Ombudsman | IVRS | Interactive Voice Response System | | DSA | Direct Selling Agent | IWG | Internal Working Group | | ECS | Electronic Clearing Service | KYC | Know Your Customer | | EMI | Equated Monthly Instalment | MITC | Most Important Terms and Conditions | | FB | Foreign Bank | NACH | National Automated Clearing House | | FIDD | Financial Inclusion and Development Department | NBFC | Non-Banking Financial Company | | FPC | Fair Practices Code | NBFCO | NBFC Ombudsman | | FRC | First Resort Complaint | NEFT | National Electronic Funds Transfer | | FSWM | Financially Sound and Well Managed | NETC | National Electronic Toll Collection | | NHB | National Housing Bank | PML | Prevention of Money Laundering | | NPCI | National Payments Corporation of India | PPI | Prepaid Payment Instrument | | OBO | Office of Banking Ombudsman | PSO | Payment System Operator | | ODR | Online Dispute Resolution | QR | Quick Response | | ODT | Ombudsman for Digital Transactions | RBI | Reserve Bank of India | | ONBFCO | Office of the NBFC Ombudsman | RBIO | Reserve Bank of India Ombudsman | | OODT | Office of Ombudsman for Digital Transactions | RCA | Root Cause Analysis | | ORBIO | Office of Reserve Bank of India Ombudsman | RE | Regulated Entity | | OSDT | Ombudsman Scheme for Digital Transactions | RRB | Regional Rural Bank | | OSNBFC | Ombudsman Scheme for NBFCs | RTGS | Real Time Gross Settlement | | Pvt.SB | Private Sector Bank | RTI | Right to Information | | PB | Payment Bank | SBI | State Bank of India | | PD | Primary Dealer | SCB | Scheduled Commercial Bank | | PIN | Personal Identification Number | SEBI | Securities and Exchange Board of India | | PMAY | Pradhan Mantri Awas Yojana | SFB | Small Finance Bank | | SMS | Short Message Service | S-UCB | Scheduled Urban Cooperative Bank | | TAT | Turn Around Time | UPI | Unified Payments Interface | | TRAI | Telecom Regulatory Authority of India | Y-o-Y | Year-on-Year | | UCB | Urban Cooperative Bank | | |
Foreword  M K Jain M K Jain Deputy Governor and Appellate Authority During the period under reference, the Covid 19 pandemic intensified the unprecedented challenges posed to the real and financial sector since its outbreak. The banking sector remained resilient supported by the extraordinary measures taken by the Central Bank and Government. Customer protection and expeditious grievance redressal assumed far greater significance during this difficult time. On an annualised basis, a spurt of 22.27 percent was witnessed in the number of complaints received under the three Ombudsman Schemes in operation. However, during the same period, the pan India disposal rate improved to 96.59 percent from 92.52 percent in the previous year, despite the inconceivable constraints emerged from the pandemic and associated lockdown. A vision for a simple, efficient and inclusive ombudsman framework culminated in the Reserve Bank - Integrated Ombudsman Scheme 2021 (RB-IOS) which has since been launched by the Hon’ble Prime Minister of India on November 12, 2021. The Scheme has adopted a “One Nation – One Ombudsman” approach, for all customers of RBI regulated entities. It will ensure that all customers have one platform, one email and one address to lodge, track and monitor their complaints anytime and from anywhere. The Scheme has done away with the jurisdiction of each ombudsman office. A Centralised Receipt and Processing Centre has been set up at RBI, Chandigarh for receipt and initial processing of physical and email complaints. This Annual Report is, therefore, the last in the series under the three separate Ombudsman Schemes of RBI and thus, carries an element of legacy. I hope all stakeholders will find it useful. (M K Jain)
EXECUTIVE SUMMARY The Annual Report for the transition year 2020-21 has been prepared for the nine-month period, i.e., July 1, 2020 to March 31, 2021, in alignment with the change in the Financial Year of the Reserve Bank from ‘July – June’ to ‘April – March' with effect from July 1, 2020. Due to this transition, the number of complaints received during July 1, 2020 to March 31, 2021 under the Ombudsman Schemes of RBI stood at 3,03,107 complaints and fell short of the total number of complaints received during July 1, 2019 to June 30, 2020 (3,30,543) by 27,436 complaints (8.30%). On an annualized basis, the volume of complaints received under the Ombudsman Schemes has gone up by 22.27%. The overall disposal rate under the three Schemes has also improved to 96.59% as compared to 92.52% in the previous reporting period. Banking Ombudsman Scheme (BOS) 2. The BOS was notified by RBI in 1995 under Section 35A of the Banking Regulation Act, 1949. As on date, Scheduled Commercial Banks (SCBs), Scheduled Primary Urban Co-operative Banks (UCBs), Regional Rural Banks (RRBs), Small Finance Banks (SFBs) and Payment Banks (PBs) are covered under the Scheme. It is administered by RBI through 22 Offices of Banking Ombudsman (OBOs) covering all states and union territories. 3. A brief analysis of the complaints handled under BOS during July 1, 2020 to March 31, 2021 is as follows: i. During the transition year July 1, 2020 to March 31, 2021, the OBOs received 2,73,204 complaints, as compared to 3,08,630 complaints during the previous year (July 1, 2019 to June 30, 2020). Of these, 89.28% were received electronically i.e., through the online portal Complaint Management System (CMS) and through email, as against 85.64% in the previous year. ii. The disposal rate improved significantly from 92.36% during July 1, 2019 to June 30, 2020 to 96.67% during July 1, 2020 to March 31, 2021, a five-year high, despite the volume of complaints handled being higher than the previous year on an annualized basis, and the human resources remaining the same, which can be attributed to end-to-end digitization of complaint processing in CMS. iii. Complaints related to (a) ATM/debit cards and (b) mobile/electronic banking (c) credit cards (d) failure to meet commitments and (e) non-observance of Fair Practices Code (FPC) were the top five grounds of complaints received at the OBOs. The share of ATM/debit card complaints, mobile/electronic banking and credit card complaints to total complaints received during July 1, 2020 to March 31, 2021 stood at 17.40%, 12.98% and 12.36% respectively. The corresponding percentage of complaints against these grounds during July 1, 2019 to June 30, 2020 were 21.97%, 13.38% and 9.30%, respectively. iv. Complaints relating to credit cards, failure to meet commitments, and Direct Selling Agents (DSAs) and recovery agents increased during July 1, 2020 to March 31, 2021 vis-à-vis July 1, 2019 to June 30, 2020, with complaints related to DSAs and recovery agents registering a surge of over 60.66%. v. Of the total maintainable complaints, the share of complaints resolved by mutual agreement i.e. through intervention of OBOs, conciliation/mediation, increased marginally from 72.34% during July 1, 2019 to June 30, 2020 to 72.73% during July 1, 2020 to March 31, 2021. vi. The number of Appeals received against the decisions and Awards of the Banking Ombudsmen (BOs) decreased from 63 during July 1, 2019 to June 30, 2020 to 23 during July 1, 2020 to March 31, 2021. Of these, 10 Appeals were against Awards passed by the BOs and the remaining 13 were made by customers against rejection of their complaints by the BOs. vii. The average cost of handling a complaint under the BOS decreased by 33.46%, from ₹2,412/- during July 1, 2019 to June 30, 2020 to ₹1,605/- during July 1, 2020 to March 31, 2021. The reduction in cost was on account of the increased volume of complaints handled by the same human resources, supported by the end-to-end digitization of complaint processing in CMS. Ombudsman Scheme for Non-Banking Financial Companies (OSNBFC) 4. The OSNBFC was notified by RBI under Section 45L of the RBI Act, 1934 on February 23, 2018. The Scheme is applicable to (a) Non-Banking Financial Companies (NBFCs) which are authorised to accept deposits (NBFCs-D); and (b) Non-deposit taking NBFCs (NBFCs-ND) having customer interface, with an asset size of ₹100 crore and above, as on the date of the audited balance sheet of the previous financial year. The Scheme is administered through the Offices of the NBFC Ombudsman (ONBFCOs) in four metro centers viz. Chennai, Kolkata, Mumbai, and New Delhi for handling complaints received in the respective zones. 5. A brief analysis of the complaints handled by ONBFCOs during July 1, 2020 to March 31, 2021 is as follows: i. The receipt of complaints at ONBFCOs stood at 26,957 during July 1, 2020 to March 31, 2021 increasing from 19,432 complaints received during July 1, 2019 to June 30, 2020. Thus, an increase of 38.72% was witnessed, despite the current period being short by a quarter. Of the complaints received during July 1, 2020 to March 31, 2021, 93.66% were received electronically, i.e. through CMS or email. ii. Complaints related to non-adherence to FPC constituted 54.75% of the complaints received, followed by those related to non-observance of RBI directions (11.13%), and levy of charges without notice (9.44%). iii. The disposal rate stood at 95.51% during July 1, 2020 to March 31, 2021 as compared to 95.34% July 1, 2019 to June 30, 2020. iv. Of the total maintainable complaints, 73.69% were resolved through mutual settlement/ agreement i.e. through intervention of the ONBFCOs, conciliation/ mediation. v. One Appeal was received against the decision of the NBFC Ombudsman (NBFCO) during July 1, 2020 to March 31, 2021. Ombudsman Scheme for Digital Transactions (OSDT) 6. The OSDT was notified by RBI under Section 18 of the Payment and Settlement Systems Act, 2007 on January 31, 2019. The Scheme is applicable to Non-bank System Participants1 (issuers of Pre-paid Payment Instruments (PPIs)) regulated by the RBI. The Offices of Ombudsman for Digital Transactions (OODTs) function from all the existing 22 OBOs, and handle complaints of customers in their respective territorial jurisdictions. 7. A brief analysis of complaints handled by OODTs during July 1, 2020 to March 31, 2021 is as follows: i. The number of complaints received at OODTs rose from 2,481 during July 1, 2019 to June 30, 2020 to 2,946 during July 1, 2020 to March 31, 2021 of which 99.90% were received through electronic means. ii. Fund transfers/Unified Payments Interface (UPI)/BBPS/Bharat QR Code, mobile/electronic fund transfer and non-reversal of debit due to wrong beneficiary transfer by System Participant were the top three grounds of complaint under OSDT, 2019 with share in total complaints at 51.15%, 22.57%, and 8.18%, respectively. iii. The disposal rate of complaints stood at 99.13% during July 1, 2020 to March 31, 2021. Of the maintainable complaints, 57.54% were disposed through mutual settlement/ agreement through intervention of the OODTs. iv. No Appeal was received against the decisions and Awards of the Ombudsmen for Digital Transactions (ODTs) during July 1, 2020 to March 31, 2021. Developments during the year 8. During the year, Consumer Education and Protection Department (CEPD) undertook the following initiatives for strengthening grievance redress systems: i. A comprehensive framework for strengthening of grievance redress mechanism in banks was instituted in January 2021 comprising of: a. Enhanced disclosures on complaints; b. Recovery of cost of redress of complaints from banks; c. Intensive review of grievance redress mechanism of banks. ii. Root Cause Analysis (RCA) of the complaints received in RBI during July 1, 2020 to March 31, 2021 was undertaken to identify the major concerns and systemic issues, their root causes, and to formulate remedial measures to address the concerns. iii. A review of the Ombudsman Schemes for updation and effective implementation, including through convergence was conducted by an In-house Committee. The recommendations covering, inter alia, convergence of the three Schemes into the Reserve Bank Integrated Ombudsman Scheme (RB-IOS), 2021, bringing all Regulated Entities (REs) with retail customer interface under the ambit of the converged Scheme, setting up of the Centralised Receipt and Processing Center (CRPC) for the receipt and initial processing of complaints, setting up of a Contact Center, revamping CMS, measures for reduction in Turn Around Time (TAT) for disposal of complaints, and improving effectiveness in resolution of consumer complaints were taken up for implementation. iv. Education and awareness campaigns were undertaken through print and electronic media for the benefit of customers of REs/ members of public. v. The RBI Ombudsmen conducted 15 Townhall events and 139 awareness programmes during the year. These events were focused on avenues of grievance redress and consumer protection issues. Way forward 9. During the period under review, groundwork for the launch of RB-IOS, 2021, along with accompanying changes in the CMS have been carried out. RB-IOS, 2021 will replace the three existing Ombudsman Schemes: the BOS, the OSNBFC and, the OSDT. 10. During the year April 1, 2021 to March 31, 2022, efforts towards implementation of framework for financial education shall be made. Along with the launch of the RB-IOS, 2021 and the setting-up of CRPC, the capabilities of CMS shall be enhanced for more efficient redress and Interactive Voice Response System (IVRS) content has been enriched. A Contact Center will be set up at CRPC for better user engagement. The education and awareness efforts with a focus on consumer protection issues will be intensified. During the coming year, assessment shall be carried out as required under the circular on strengthening of grievance redress mechanism in banks dated January 27, 2021. Efforts shall be made towards consolidation of regulatory guidelines on Consumer Protection and Customer Service.
Chapter 1
Complaints received by Ombudsmen during July 1, 2020 to March 31, 2021 With the alignment of the Reserve Bank’s accounting year with the Government of India’s (GoI) financial year (April-March), the report for the transition year 2020-21 has been prepared for a period of nine months (July 1, 2020 to March 31, 2021). During this period, 3,03,107 complaints were received under the three Ombudsman Schemes of RBI. The overall disposal rate stood at 96.59%. | 1.1 The Alternate Dispute Resolution (ADR) mechanism in RBI comprises of the Ombudsman framework with 22 OBOs, 4 ONBFCOs and 22 OODTs and 30 Consumer Education and Protection Cells (CEPCs). The complaints that are not covered under the three Ombudsman Schemes are presently being handled by the CEPCs. 1.2 Some highlights on the complaints handled by the Offices of the RBI Ombudsman (ORBIOs) during July 1, 2020 to March 31, 2021 are as follows: 1.3 The total volume of complaints received under all the three Ombudsman Schemes stood at 3,03,107 during the nine-month period (July 1, 2020 to March 31, 2021) as compared to 3,30,543 complaints received during July 1, 2019 to June 30, 2020. The office-wise number of complaints during the transition period is given in Table 1.1. | Table 1.1 – Office-wise distribution of complaints received by ORBIOs during July 1, 2020 to March 31, 2021 | | Ombudsman Office | BOS | OSDT | OSNBFC | Total complaints 2020-21 (Jul-Mar) | Annualized 2020-21 (12 months) | | East Zone | | Bhubaneshwar | 5,678 | 114 | | 5,792 | 7,723 | | Guwahati | 2,678 | 43 | | 2,721 | 3,628 | | Kolkata | 11,817 | 176 | 2,047 | 14,040 | 18,720 | | Patna | 12,560 | 162 | | 12,722 | 16,963 | | Ranchi | 3,797 | 30 | | 3,827 | 5,103 | | Total | 36,530 | 525 | 2,047 | 39,102 | 52,136 | | % share to All India | 13.37% | 17.82% | 7.59% | 12.90% | | | North Zone | | Chandigarh | 28,019 | 93 | | 28,112 | 37,483 | | Dehradun | 6,324 | 33 | | 6,357 | 8,476 | | Jaipur | 17,636 | 207 | | 17,843 | 23,791 | | Jammu | 1,368 | 21 | | 1,389 | 1,852 | | Kanpur | 21,169 | 173 | | 21,342 | 28,456 | | New Delhi-I | 18,767 | 245 | | 19,012 | 25,349 | | New Delhi-II | 16,057 | 104 | 10,712 | 26,873 | 35,831 | | New Delhi-III | 8,416 | 62 | | 8,478 | 11,304 | | Total | 1,17,756 | 938 | 10,712 | 1,29,406 | 1,72,541 | | % share to All India | 43.10% | 31.84% | 39.74% | 42.69% | | | South Zone | | Bengaluru | 13,535 | 242 | | 13,777 | 18,369 | | Chennai | 16,098 | 124 | 5,845 | 22,067 | 29,423 | | Hyderabad | 17,088 | 225 | | 17,313 | 23,084 | | Thiruvananthapuram | 5,678 | 12 | | 5,690 | 7,587 | | Total | 52,399 | 603 | 5,845 | 58,847 | 78,463 | | % share to All India | 19.18% | 20.47% | 21.68% | 19.41% | | | West Zone | | Ahmedabad | 17,223 | 112 | | 17,335 | 23,113 | | Bhopal | 12,377 | 259 | | 12,636 | 16,848 | | Mumbai-I | 18,629 | 173 | | 18,802 | 25,069 | | Mumbai-II | 15,215 | 292 | 8,353 | 23,860 | 31,813 | | Raipur | 3,075 | 44 | | 3,119 | 4,159 | | Total | 66,519 | 880 | 8,353 | 75,752 | 1,01,003 | | % share to All India | 24.35% | 28.97% | 30.99% | 24.99% | | | All India Total | 2,73,204 | 2,946 | 26,957 | 3,03,107 | 4,04,143 | 1.4 The number of complaints received electronically i.e., through email/online mode stood at 89.77%. A total of 1,85,092 complaints were found to be maintainable under the three Ombudsman Schemes, of which, 72.67% were resolved through mutual settlement/ agreement. A total of 65 Awards were issued by the Ombudsmen and 24 Appeals were received across the three schemes. 1.5 On an annualized basis, the total number of complaints received during the year under the three Ombudsman Schemes stood at 4,04,143, showing an increase of 22.27% over the previous year. 1.6 The average cost of handling a complaint under the three Ombudsman Schemes during July 1, 2020 to March 31, 2021 stood at ₹1,599/- per complaint. 1.7 Detailed analysis of the complaint receipt and disposal is presented in Chapters 2, 3 and 4.
Chapter 2
The Banking Ombudsman Scheme (BOS), 2006 (as amended upto July 1, 2017):
Activities during July 1, 2020 to March 31, 2021 The number of complaints received at the 22 OBOs during 2020-21 i.e. July 1, 2020 to March 31, 2021 stood at 2,73,204 complaints, compared to 3,08,630 complaints received during July 1, 2019 to June 30, 2020. As the transition year 2020-21 comprised of nine months, for the purpose of Year-on-Year (Y-o-Y) comparisons in absolute terms, the report compares the data for the period April 1, 2020 to March 31, 2021 as against the numbers reported in the previous financial year, i.e., July 1, 2019 to June 30, 2020. Accordingly, on a Y-o-Y comparison, the number of complaints received by the OBOs during April 1, 2020 to March 31, 2021 was 3,41,747. This marks an increase of 10.73% over July 1, 2019 to June 30, 2020. The rate of disposal of complaints improved from 92.36% during July 1, 2019 to June 30, 2020 to 96.67% during July 1, 2020 to March 31, 2021. Complaints relating to digital modes of transactions were the highest, constituting 42.74% of the total complaints received. Majority (72.73%) of the maintainable complaints were resolved through mutual settlement/conciliation/ mediation. During July 1, 2020 to March 31, 2021, 59 Awards were issued against banks by the BOs. Twenty-three Appeals were received against the decisions of the BOs, of which 10 Appeals were against Awards passed by the BOs and the remaining 13 were made by customers against rejection of their complaints by the BOs. | Receipt of complaints 2.1 During July 1, 2020 to March 31, 2021, 2,73,204 complaints were received at the OBOs. As the transition year 2020-21 comprised of nine months, for the purpose of Year-on-Year (Y-o-Y) comparisons in absolute terms, the report compares the data for the period April 1, 2020 to March 31, 2021 as against the numbers reported in the previous financial year, i.e., July 1, 2019 to June 30, 2020. Accordingly, on a Y-o-Y basis, an increase of 10.73% was recorded in the receipt of complaints during April 1, 2020 to March 31, 2021 compared to the previous year July 1, 2019 to June 30, 2020. The year-wise number of complaints received at OBOs in last two years is given in Chart 2.1. 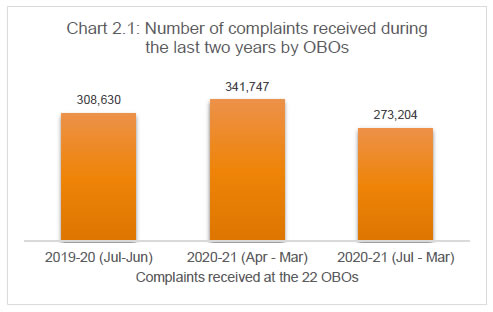 2.2 The OBO-wise receipt of complaints, given at Appendix 2.1, shows that OBO, Chandigarh received the maximum number of complaints (28,019) during July 1, 2020 to March 31, 2021, accounting for 10.26% of the total complaints; followed by OBO, Kanpur (21,168) and OBO-I, New Delhi (18,767) accounting respectively for 7.75% and 6.87% of total complaints received by the 22 OBOs. 2.3 A comparative position of complaints received by OBOs during July 1, 2020 to March 31, 2021 against July 1, 2019 to June 30, 2020 is given in Chart 2.2. 2.4 The number of complaints handled by the OBOs during July 1, 2020 to March 31, 2021 stood at 3,02,4912 against 3,20,699 handled during July 1, 2019 to June 30, 2020. The position of customer complaints handled by OBOs during the periods, July 1, 2019 to June 30, 2020 and July 1, 2020 to March 31, 2021 is given at Appendix 2.2. 2.5 During July 1, 2020 to March 31, 2021, in line with the trend observed over the last three years, the average cost of handling a complaint improved from ₹2,412/- to ₹1,605/- as depicted in Chart 2.3 and Table 2.1.
| Table 2.1 - Cost of handling a complaint | | Year → | 2018-19 (Jul – Jun) | 2019-20 (Jul - Jun) | 2020-21 (Jul- Mar) | | Total Cost (₹ Crore) | 63.55 | 77.36 | 48.55 | | No of complaints handled | 2,02,083 | 3,20,699 | 3,02,491 | | Average cost per complaint (₹) | 3,145 | 2,412 | 1,605 | 2.6 The OBO-wise cost of handling a complaint during July 1, 2020 to March 31, 2021 is given at Appendix 2.3. The average cost of redress has improved significantly on account of end-to-end digitization of complaint processing in CMS which has enabled deployment of staff across offices eliminating physical constraints. However, considering the other fixed costs involved, the offices having lesser inflow of complaints continue to incur higher cost of handling a complaint. The variance in costs across offices will be reduced to a large extent with the launch of RB-IOS, 2021 which is drawn on ‘One Nation One Ombudsman’ approach. Mode of receipt of complaints 2.7 Complaints were received in the OBOs predominantly through online modes i.e., the CMS, including receipt of complaints through the Centralized Public Grievance Redress and Monitoring System (CPGRAMS)3, the GoI portal for receipt and monitoring of complaints from the public. The other modes of receipt were e-mails, hand delivery, post, courier and fax. With the launch of CMS in June 2019, physical lodgment of complaints declined from 14.36% of the total complaints received during July 1, 2019 to June 30, 2020 to 10.72% of the total complaints received during July 1, 2020 to March 31, 2021. A comparative position of the various modes through which the complaints were received during the last two years is given at Appendix 2.4 and depicted in Chart 2.4 below: 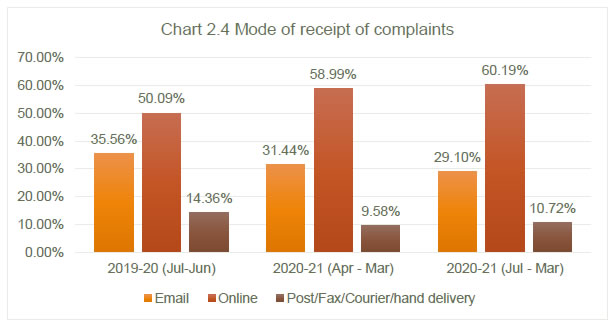 2.8 CMS has eased the complaint lodging process compared to the earlier portal, reflecting a steady increase in the volume of complaint being lodged through CMS. This is also attributed to intensive awareness campaigns undertaken by the RBI. During July 1, 2020 to March 31, 2021, 89.28% of the complaints were filed using the digital mode, of which 29.09% were through e-mails and 60.19% were using CMS. The trend of percentage of digital versus non-digital modes of lodgment of complaints for the last three years is given in Chart 2.5 below. Population group-wise distribution of complaints 2.9 On a Y-o-Y basis, the number of complaints received from metropolitan areas increased by 20.13% over the previous year. Complaints from rural areas saw a rise of 6.20% while complaints from semi-urban and urban areas were up marginally by 0.77% and 0.45%, respectively. The population group-wise distribution of complaints received during July 1, 2020 to March 31, 2021 is given in Chart 2.6 below and in Appendix 2.5. 2.10 Under each of the grounds of complaint listed under the BOS, the maximum number of complaints were received from metropolitan centres, followed by urban, semi-urban and rural centres, in general, as given in Appendix 2.6. Zone-wise distribution of complaints 2.11 Continuing the trend and owing to huge volume of complaints received at OBOs of Chandigarh and New Delhi, the North zone accounted for the maximum share of complaints (43.10%) in 2020-21, followed by the West zone (24.35%) and the South zone (19.18%). East zone (13.37%) continued with least share of complaints. In terms of growth of complaints, the West zone registered the highest Y-o-Y growth at 13.51%, followed by North zone (12.65%) and East zone (9.00%). South zone witnessed growth of 4.73%. The zone-wise distribution of complaints received during July 1, 2020 to March 31, 2021 is depicted in Chart 2.7 below and Appendix 2.7. Complainant group-wise classification of complaints 2.12 Individual customers (excluding senior citizens) accounted for 82.68% of complainants during July 1, 2020 to March 31, 2021, followed by individual business (3.63%), senior citizens (2.92%) and limited companies (2.20%). Appendix 2.8 provides the complainant group-wise classification of complaints. Bank group-wise classification of complaints 2.13 The bank group-wise classification of complaints received by OBOs during the last two years is indicated in Chart 2.8 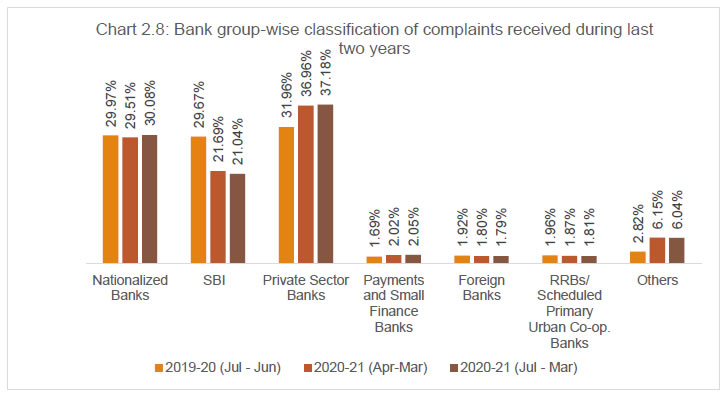 2.14 The share of total complaints received against SBI declined from 29.67% during July 1, 2019 to June 30, 2020 to 21.04% during July 1, 2020 to March 31, 2021 which is accompanied by rise in the share of Private Sector Banks (Pvt.SBs) from 31.96% during July 1, 2019 to June 30, 2020 to 37.18% during July 1, 2020 to March 31, 2021. The RRBs and Scheduled Primary UCBs together, in line with their smaller presence, accounted for 1.81% of the total complaints, while complaints against the PBs and SFBs stood at 2.05% this year. The share of complaints against FBs declined from 1.92% during July 1, 2019 to June 30, 2020 to 1.79% during July 1, 2020 to March 31, 2021 and complaints against entities that are not covered under the BOS, 2006 increased from 2.82% during July 1, 2019 to June 30, 2020 to 6.04% during July 1, 2020 to March 31, 2021. The bank group-wise classification of complaints received is detailed at Appendix 2.9. Nature of complaints handled 2.15 Clause 8 of the BOS, 2006 specifies the grounds under which a customer can file a complaint before a BO. Table 2.2 categorizes complaints received on the grounds of deficiency in banking services as specified under Clause 8 of the BOS. | Table 2.2 – Category-wise distribution and share of complaints received at OBOs during last two years | | Complaint Category | 2019-20
(Jul – Jun) | 2020-21*
(Apr - Mar) | 2020-21
(Jul – Mar) | | ATM / debit cards | 67,800 | 60,203 | 47,546 | | 21.97% | 17.62% | 17.40% | | Mobile / electronic banking | 41,310 | 44,385 | 35,458 | | 13.38% | 12.99% | 12.98% | | Credit cards | 28,713 | 40,721 | 33,762 | | 9.30% | 11.92% | 12.36% | | Failure to meet commitments | 25,036 | 35,999 | 29,090 | | 8.11% | 10.53% | 10.65% | | Non-observance of FPC | 36,215 | 33,898 | 27,849 | | 11.73% | 9.92% | 10.19% | | Levy of charges without prior notice | 18,558 | 20,949 | 16,514 | | 6.01% | 6.13% | 6.04% | | Loans and advances | 16,437 | 20,218 | 16,043 | | 5.33% | 5.92% | 5.87% | | Non-adherence to BCSBI Codes | 14,194 | 14,490 | 9,935 | | 4.60% | 4.24% | 3.64% | | Deposit accounts related | 8,778 | 8,580 | 6,881 | | 2.84% | 2.51% | 2.52% | | Pension payments | 6,307 | 4,966 | 3,990 | | 2.04% | 1.45% | 1.46% | | Remittances | 4,045 | 3,394 | 2,676 | | 1.31% | 0.99% | 0.98% | | DSAs and recovery agents | 1,406 | 2,440 | 2,259 | | 0.46% | 0.71% | 0.83% | | Para banking | 1,117 | 1,236 | 1,027 | | 0.36% | 0.36% | 0.38% | | Notes and coins | 514 | 332 | 253 | | 0.17% | 0.10% | 0.09% | | Others | 29,204 | 39,686 | 31,688 | | 9.46% | 11.61% | 11.60% | | Out of purview of BOS | 8,996 | 10,250 | 8,233 | | 2.91% | 3.00% | 3.01% | | Total | 3,08,630 | 3,41,747 | 2,73,204 | Note: Figures in % indicate the percentage to total complaints of the respective years
* Includes data pertaining to April 1, 2020 to June 30, 2020 which overlaps with the last quarter of the year, July 1, 2019 to June 30, 2020 | 2.16 During July 1, 2020 to March 31, 2021, complaints related to ATM/debit cards were the highest, followed by those related to mobile/ electronic banking, and credit cards. 2.17 The share of ATM/debit card related complaints to total complaints declined from 21.97% during July 1, 2019 to June 30, 2020 to 17.40% during July 1, 2020 to March 31, 2021. Of the ATM/debit card complaints, a major sub-category was ‘Account debited but cash not dispensed by ATMs’ with a share of 53.07% (Table 2.3). | Table 2.3 Breakup of ATM/ Debit Card complaints | | Sub-category | 2019-20
(Jul – Jun) | 2020-21*
(Apr-Mar) | 2020-21
(Jul – Mar) | | Non-payment of cash / account debited but cash not dispensed by ATMs | 31,832 | 31,904 | 25,235 | | 10.31% | 9.34% | 9.24% | | Debit in account without use of the card or details of the card | 15,752 | 10,966 | 8,504 | | 5.10% | 3.21% | 3.11% | | Use of stolen / cloned cards | 7,511 | 5,187 | 3,929 | | 2.43% | 1.52% | 1.44% | | Account debited more than once for one withdrawal in ATMs or for POS transaction | 2,687 | 2,286 | 1,829 | | 0.87% | 0.67% | 0.67% | | Short payment of cash / less or excess amount of cash dispensed by ATMs | 1,613 | 1,267 | 1,017 | | 0.52% | 0.37% | 0.37% | | Others | 8,405 | 8,593 | 7,032 | | 2.72% | 2.51% | 2.57% | | Sub-total | 67,800 | 60,203 | 47,546 | | 21.97% | 17.62% | 17.40% | | Total complaints received | 3,08,630 | 3,41,747 | 2,73,204 | Note: Figures in % indicate percentage to total number of complaints of respective years
* Includes data pertaining to April 1, 2020 to June 30, 2020 which overlaps with the last quarter of the year, July 1, 2019 to June 30, 2020 | 2.18 The share of complaints relating to digital transactions (mobile/electronic banking, ATM/debit cards and credit cards) declined slightly from 44.65% during July 1, 2019 to June 30, 2020 to 42.74% during July 1, 2020 to March 31, 2021. 2.19 Complaints relating to ‘loans and advances’ constituted 5.87% of the total complaints received and generally pertained to delay in sanction, disbursement, non-observance of prescribed time schedule for disposal of loan applications, non-acceptance of application without valid reason, etc. 2.20 During July 1, 2020 to March 31, 2021, 1.46% of the total complaints received were related to ‘pension payments’ as compared to 2.04% in the previous year. This decline is seen in absolute number as well. The BOs emphasize upon the banks to deal with grievances of the pensioners in a more sensitive manner. Continuous efforts are being made for improving the services for the senior citizens. 2.21 During July 1, 2020 to March 31, 2021, 3.01% of the complaints were ‘out of purview’ of the BOS, 2006 and the share of such complaints stood at 2.91% during July 1, 2019 to June 30, 2020. 2.22 Complaints under the category ‘others’ increased from 9.46% during July 1, 2019 to June 30, 2020 to 11.60% during July 1, 2020 to March 31, 2021 as detailed in Table 2.4. | Table 2.4 – Break-up of complaints in ‘others’ category | | Sub-category | 2019-20
(Jul - Jun) | 2020-21*
(Apr - Mar) | 2020-21
(Jul – Mar) | | i. Non-adherence to RBI directives on: | | | | | I. Banking or other services | 3,944 | 6,727 | 5,076 | | 1.28% | 1.97% | 1.86% | | II. Interest rates (loans and advances) | 1,946 | 2,435 | 1,943 | | 0.63% | 0.71% | 0.71% | | III. Any other direction or instruction as may be specified by the RBI on loans and advances and other matters | 15,002 | 17,396 | 13,800 | | 4.86% | 5.09% | 5.05% | | ii. Non-adherence to prescribed working hours | 945 | 1,131 | 898 | | 0.31% | 0.33% | 0.33% | | iii. Refusal to accept or delay in accepting payment towards taxes as required by RBI/ Govt. | 429 | 398 | 340 | | 0.14% | 0.12% | 0.12% | | iv. Refusal to issue or delay in issuing or failure to service or delay in servicing or redemption of Government securities | 355 | 501 | 405 | | 0.12% | 0.15% | 0.15% | | v. Other matters specified by RBI | 6,583 | 11,098 | 9,226 | | 2.13% | 3.25% | 3.38% | | Sub-total | 29,204 | 39,686 | 31,688 | | 9.46% | 11.61% | 11.60% | | Total number of complaints received | 3,08,630 | 3,41,747 | 2,73,204 | Note: Figures in % indicate percentage to total complaints of the respective years
* Includes data pertaining to April 1, 2020 to June 30, 2020 which overlaps with the last quarter of the year, July 1, 2019 to June 30, 2020 | 2.23 The growth in the volume of complaints over the years is shown in Chart 2.9. As may be observed, the rate of growth of complaints in OBOs has risen sharply over the last four years. Disposal of complaints 2.24 Table 2.5 indicates a comparative position of disposal of complaints by OBOs. | Table 2.5 - Comparative position of disposal of complaints by OBOs | | Number of Complaints | 2019-20
(Jul – Jun) | 2020-21
(Jul - Mar) | | Received during the year | 3,08,630 | 2,73,204 | | Brought forward from previous year | 12,069 | 24,498 | | Complaints received by email before June 30, 2020 but registered as complaints after July 1, 2020 and complaints transferred from CEPCs on or later than July 1, 2020 | - | 4,789 | | Handled during the year | 3,20,699 | 3,02,491 | | Disposed during the year | 2,96,201 | 2,92,409 | | Rate of Disposal (%) | 92.36% | 96.67% | | Carried forward to the next year | 24,498 | 10,082 | | Complaints pending for less than one month (30 days) | 6,086 | 6,543 | | Complaints pending for one to two months | 3,223 | 1,864 | | Complaints pending for two to three months | 1,833 | 848 | | Complaints pending for more than three months | 13,356 | 827 | 2.25 Table 2.5 indicates that the disposal of complaints rose by 4.31% during July 1, 2020 to March 31, 2021. This efficiency improvement can be attributed to end-to-end digitization of complaint processing in CMS and efforts put in by the OBOs. The OBO-wise position of complaints disposed during July 1, 2020 to March 31, 2021 is given at Appendix 2.10. 2.26 The pendency percentage improved from 7.64% during July 1, 2019 to June 30, 2020 to 3.33% during July 1, 2020 to March 31, 2021, with 10,082 complaints pending at the end of the year. It is worth noting that the volume of complaints handled and disposed have improved despite the pandemic and consequent periods of lockdowns in different parts of the country. The non-maintainable4 complaints fell to 39.90% of the total complaints handled during July 1, 2020 to March 31, 2021 as compared to 45.76% during July 1, 2019 to June 30, 2020. The reasons for complaints found non-maintainable during July 1, 2020 to March 31, 2021 are given in Chart 2.10. 2.27 It is observed that complaints were disposed of as non-maintainable largely due to i) the complaint being First Resort Complaints (FRCs); (ii) complaints not being represented properly; and iii) complaints having already been dealt with by the BO. 2.28 FRCs are those complaints which are received by the OBOs without the complainant having approached the concerned bank first. These complaints were sent to the respective banks for direct disposal at their end. Complainants were, however, advised through closure letters that they could approach the OBOs again in case they are not satisfied with the decision of the bank. Mode of disposal of maintainable complaints 2.29 ‘Maintainable’ complaints are those that are made to the BO, relating to the grounds of complaint specified in Clause 8 of the BOS, 2006, as amended upto July 1, 2017 and are in line with the requirements laid down in the Scheme. The Scheme envisages settlement of complaints by agreement through conciliation and/or mediation. If the parties fail to arrive at an agreement, the BO gives a decision, which includes passing an Award against the bank. The OBO-wise distribution of maintainable complaints is given at Appendix 2.11 2.30 Table 2.6 depicts the mode of disposal of maintainable complaints under the BOS, 2006. The share of maintainable complaints disposed by way of mutual settlement/agreement increased marginally from 72.34% during July 1, 2019 to June 30, 2020 to 72.73% during July 1, 2020 to March 31, 2021 | Table 2.6 - Mode of disposal of maintainable complaints | | Disposal of maintainable complaints | 2019-20
(Jul - Jun) | 2020-21
(Jul - Mar) | | By Mutual Settlement/ Agreement | 1,25,836 | 1,24,900 | | 72.34% | 72.73% | | Disposal by Award | 68 | 59 | | 0.04% | 0.03% | | Maintainable Complaints Rejected | 47,873 | 46,566 | | 27.52% | 27.12% | | Maintainable Complaints Withdrawn | 181 | 197 | | 0.10% | 0.11% | | Total | 1,73,958 | 1,71,722 | | Note: Figures in % indicate the percentage to maintainable complaints disposed during the respective periods. | Turn Around Time (TAT) of complaints 2.31 The time taken by BOs to dispose a complaint declined significantly from 95 days during July 1, 2019 to June 30, 2020 to 55 days during July 1, 2020 to March 31, 2021. The TAT pertaining to all the complaint categories showed a substantial decline, which is mainly due to resolving of the technical glitches faced during the initial period of CMS transition, i.e., during June to December 2019, and stabilization of CMS during January to March 2020. The CMS aided in uninterrupted operations throughout the year, despite the pandemic. The ground-wise TAT is given at Appendix 2.12. Grounds for rejection of maintainable complaints 2.32 The grounds for rejection of maintainable complaints and their proportion to total complaints received over the past two years are indicated in Table 2.7. | Table 2.7- Grounds for rejection of maintainable complaints | | Ground for rejection | No. of complaints rejected | 2019-20
(Jul - Jun) | 2020-21
(Jul - Mar) | | Not on grounds of complaint (Clause 8) - Clause 13(a) | 46,237 | 44,994 | | 96.58% | 96.62% | | Not in accordance with provisions of Clause 9 (3) - Clause 13(b) | 983 | 946 | | 2.05% | 2.03% | | Beyond pecuniary jurisdiction of BO - Clause 12 (5) & (6) - Clause 13(c) | 147 | 142 | | 0.31% | 0.30% | | Requiring elaborate documentary and oral evidence - Clause 13 (d) | 28 | 50 | | 0.06% | 0.11% | | Complaints without sufficient cause - Clause 13(e) | 195 | 23 | | 0.41% | 0.05% | | Not pursued by the complainants - Clause 13(f) | 27 | 81 | | 0.06% | 0.17% | | No loss/ damage/ inconvenience to the complainant - Clause 13 (g) | 44 | 11 | | 0.09% | 0.02% | | The complaint pertains to the same cause of action, for which any proceedings before any court, tribunal or arbitrator or any other forum is pending – Clause 13(2) | 212 | 319 | | 0.44% | 0.69% | | Total maintainable complaints rejected | 47,873 | 46,566 | | Note: Figures in % indicate percentage to total maintainable complaints rejected during the respective periods. | 2.33 As seen in Table 2.7 above, the maximum rejections were on the ground that the complaint was ‘not on the grounds of complaint (Clause 8)’ or ‘not filed in accordance with required provisions of Clause 9 (3)’, accounting for 98.65% of the rejected maintainable complaints during July 1, 2020 to March 31, 2021. Age-wise classification of pending complaints 2.34 Although the BOS, 2006 does not specify any time limit for resolution of complaints by OBOs, efforts are made to resolve the same within two months. However, due to reasons such as non-submission and/or delay in submission of complete information by complainants/banks, the time taken for resolution may get extended in some cases. The BOs and the Principal Nodal Officers (PNOs) of banks are advised/sensitized to ensure that complaints are resolved within 60 days. The age-wise classification of the number of pending complaints as on March 31, 2021 is detailed at Appendix 2.13. Awards issued 2.35 During the year, 59 Awards were issued by BOs of which 57 were implemented within the stipulated time. The bank-wise mode of disposal of complaints, including passing of Awards and their implementation is given in Appendix 2.14. Appeals against the decisions of the BOs 2.36 The Deputy Governor (DG) -in-Charge of CEPD, RBI is designated as the Appellate Authority (AA)5 as per the provisions of BOS, 2006. The CEPD provides the secretariat to the AA. During the year, 23 Appeals were received during July 1, 2020 to March 31, 2021 as compared to 63 Appeals during July 1, 2019 to June 30, 2020. Of these, 13 Appeals were received from complainants whereas 10 were filed by the banks. With 47 Appeals pending from the previous year, the AA handled 70 Appeals during July 1, 2020 to March 31, 2021. Twenty-six Appeals were disposed during July 1, 2020 to March 31, 2021 and 44 were pending at the close of the period under review. 2.37 The position of Appeals handled by the AA during the last two years and the OBO-wise position of Appeals received during July 1, 2020 to March 31, 2021 is given in Tables 2.8 and 2.9, respectively. | Table 2.8 - Position of Appeals as on March 31, 2021 | | Particulars | 2019-20
(Jul- Jun) | 2020-21
(Jul - Mar) | | Appeals pending at the beginning of the year | 72 | 47 | | Appeals received during the year from complainants | 34 | 13 | | Appeals received during the year from banks | 29 | 10 | | Total Appeals handled during the year | 135 | 70 | | Appeals disposed during the year | 88 | 26 | | Appeals pending at the end of the year | 47 | 44 | | Mode of Disposal | | Appeals remanded to the BO | 4 | 2 | | Appeals withdrawn / settled / infructuous | 14 | 5 | | Appeals rejected | 43 | 9 | | Appeals allowed | 27 | 10 | | Appeals Disposed | | i. In favour of complainant appellant | 29 | 10 | | ii. In favour of banks | 21 | 5 | | iii. Neither in favour of complainant appellant nor in favour of banks (Remanded back to BO / infructuous) | 38 | 11 |
| Table 2.9 – OBO-wise position of Appeals received during July 1, 2020 to March 31, 2021 | | OBO | No of Appeals received in 2020-21 (Jul – Mar) | | Ahmedabad | 1 | | Bangalore | 0 | | Bhopal | 2 | | Bhubaneswar | 0 | | Chandigarh | 3 | | Chennai | 6 | | Dehradun | 3 | | Guwahati | 1 | | Hyderabad | 0 | | Jaipur | 0 | | Jammu | 0 | | Kanpur | 2 | | Kolkata | 0 | | Mumbai-I | 1 | | Mumbai-II | 0 | | New Delhi-I | 3 | | New Delhi-II | 0 | | New Delhi-III | 0 | | Patna | 0 | | Raipur | 1 | | Ranchi | 0 | | Thiruvananthapuram | 0 | | Total | 23 |
Chapter 3
The Ombudsman Scheme for Non-Banking Financial Companies (OSNBFC), 2018:
Activities during July 1, 2020 to March 31, 2021 The number of complaints received by the four ONBFCOs during July 1, 2020 to March 31, 2021 stood at 26,957 complaints as compared to 19,432 received during July 1, 2019 to June 30, 2020. As the transition year 2020-21 comprised of nine months, for the purpose of Y-o-Y comparisons in absolute terms, the report compares the data for the period April 1, 2020 to March 31, 2021 as against the numbers reported in the previous financial year, i.e., July 1, 2019 to June 30, 2020. The number of complaints received during April 1, 2020 to March 31, 2021 was 36,951, registering an increase of 90.16% over July 1, 2019 to June 30, 2020. Complaints relating to non-adherence to FPC were the highest, constituting 54.75% of the total complaints received. Majority (73.69%) of the maintainable complaints were resolved through conciliation/ mediation. During the year, six Awards were issued by NBFCOs. One Appeal was received against the decision of the NBFCO. | Receipt of complaints 3.1 The OSNBFC is administered through four ONBFCOs located at Chennai, Kolkata, Mumbai, and New Delhi, which handle complaints of South, East, West and North zones, respectively covering the entire country. 3.2 During July 1, 2020 to March 31, 2021, 26,957 complaints were received at the ONBFCOs. As the transition year 2020-21 comprised of nine months, for the purpose of Y-o-Y comparisons in absolute terms, the report compares the data for the period April 1, 2020 to March 31, 2021 as against the numbers reported in the previous financial year, i.e., July 1, 2019 to June 30, 2020. The receipt of complaints during April 1, 2020 to March 31, 2021 showed a 90.16% increase over the previous year July 1, 2019 to June 30, 2020. The year-wise number of complaints received at ONBFCOs in last two years is given in Appendix 3.1. 3.3 Of the 26,957 complaints received by the ONBFCOs during July 1, 2020 to March 31, 2021, ONBFCO, New Delhi accounted for the maximum (39.74%), followed by ONBFCO, Mumbai (30.99%), ONBFCO, Chennai (21.68%) and ONBFCO, Kolkata (7.59%). A comparison of the number of complaints received by the respective ONBFCOs during the last two years is given in Chart 3.1. Cost of handling a complaint 3.4 During the year July 1, 2020 to March 31, 2021, under the OSNBFC, 2018, the average cost of handling a complaint stood at ₹1,692/-. Cost of handling a complaint ONBFCO-wise is detailed at Appendix 3.2. Mode of receipt of complaints 3.5 The ONBFCOs receive complaints through various modes, viz. through the CMS portal, e-mail, post/ registered post, hand delivery, courier, fax, etc. The number of complaints received through different modes during the previous two years is indicated in Appendix 3.3 and Chart 3.2. 3.6 During July 1, 2020 to March 31, 2021, 12,724 (47.20%) complaints were received through CMS and CPGRAMS. Complaints received through e-mail stood at 12,523 (46.46%) while physical sources like post/courier/fax/hand delivery accounted for 1,710 complaints (6.34%). Electronic mode accounted for the 93.66% of the total complaints received. Complainant group-wise classification of complaints 3.7 Individual customers constituted the largest segment (52.30%) of complainants during July 1, 2020 to March 31, 2021, while 0.34% of the total complaints were lodged by senior citizens. The complainant group-wise classification of complaints is given at Appendix 3.4. NBFC category-wise complaints received 3.8 Of the total complaints received during July 1, 2020 to March 31, 2021, 8,841 (32.80%) complaints were against NBFCs-D, while 13,890 (51.53%) complaints were against NBFCs-ND. Complaints against entities not covered under the OSNBFC, at 4,226, accounted for 15.68% of the complaints lodged at the ONBFCOs. Such complaints were forwarded to the regulators concerned like National Housing Bank (NHB), Securities and Exchange Board of India (SEBI), Insurance Regulatory and Development Authority of India (IRDAI), etc. The NBFC category-wise classification of complaints received by ONBFCOs during the last two years is indicated at Table 3.1 and Chart 3.3 below:
| Table 3.1 NBFC category-wise receipt of complaints during July 1, 2020 to March 31, 2021 | | NBFC Category | Complaints | % Share | | Deposit taking NBFCs | 8,841 | 32.80% | | Non-deposit taking NBFCs | 13,890 | 51.53% | | Others (entities not covered under the OSNBFC) | 4,226 | 15.68% | | Total | 26,957 | 100% | Nature of complaints received 3.9 Clause 8 of the OSNBFC, 2018, specifies 13 grounds regarding deficiency in NBFC services against which a customer can file a complaint before the NBFCO. The complaints received under various grounds of deficiency in services of NBFCs are furnished in Table 3.2 below: | Table 3.2: Category-wise distribution of complaints | | Complaint category | 2019-20
(Jul – Jun) | 2020-21*
(Apr - Mar) | 2020-21
(Jul - Mar) | | Non-adherence to FPC | 7,052 | 17,915 | 14,758 | | 36.29% | 48.48% | 54.75% | | Non-observance of RBI directions | 3,607 | 6,114 | 2,999 | | 18.56% | 16.55% | 11.13% | | Levy of charges without prior notice | 1,628 | 3,189 | 2,544 | | 8.38% | 8.63% | 9.44% | | Non-transparency in contract/ loan | 1,704 | 1,833 | 1,280 | | 8.77% | 4.96% | 4.75% | | Delay in repayment of deposits | 395 | 536 | 406 | | 2.03% | 1.45% | 1.51% | | Delay in release of securities/ documents | 268 | 417 | 354 | | 1.38% | 1.13% | 1.31% | | No communication about loan sanctioned | 399 | 375 | 314 | | 2.05% | 1.01% | 1.16% | | Delay in payment of interest | 232 | 386 | 259 | | 1.19% | 1.04% | 0.96% | | Non-understandable or no adequate notice on terms and conditions | 82 | 145 | 114 | | 0.42% | 0.39% | 0.42% | | Non-understandable or non-issuance of sanction letter/ terms | 49 | 85 | 67 | | 0.25% | 0.23% | 0.25% | | Not covered under Clause 8 of the Scheme | 474 | 1,169 | 962 | | 2.44% | 3.16% | 3.57% | | Others | 3,542 | 4,787 | 2,900 | | 18.23% | 12.95% | 10.76% | | Total | 19,432 | 36,951 | 26,957 | Note: Figures in % indicate percentage share to total complaints received
* Includes data pertaining to April 1, 2020 to June 30, 2020 which overlaps with the last quarter of the year, July 1, 2019 to June 30, 2020 | 3.10 During July 1, 2020 to March 31, 2021, complaints pertaining to non-adherence to FPC constituted the largest share i.e., 54.75% of the complaints received, followed by non-observance of RBI directions to NBFCs at 11.13% and levy of charges without prior notice (9.44%). 3.11 Complaints under the category ‘others’, at 10.76%, also took a significant share of the total complaints received. The break-up for the ‘others’ category is detailed in Table 3.3. | Table 3.3: Break-up of complaints in ‘others’ category | | Sub-Category | 2019-20
(Jul – Jun) | 2020-21*
(Apr - Mar) | 2020-21
(Jul - Mar) | | Failure on commitments | 855 | 899 | 489 | | 4.40% | 18.78% | 16.86% | | Loans & Advances | 286 | 381 | 231 | | 1.47% | 7.96% | 7.97% | | Delay in presentation of Post-dated Cheques | 76 | 122 | 81 | | 0.39% | 2.55% | 2.79% | | Recovery agent related | 65 | 38 | 28 | | 0.33% | 0.79% | 0.97% | | Non-adherence to BCSBI Code | 58 | 39 | 23 | | 0.30% | 0.81% | 0.79% | | Other matters specified by RBI | 2,202 | 3,308 | 2,048 | | 11.33% | 69.10% | 70.62% | | Sub-total | 3,542 | 4,787 | 2,900 | | 18.23% | 12.95% | 10.76% | | Total number of complaints received | 19,432 | 36,951 | 26,957 | Note: Figures in % indicate percentage share to 'others'
* Includes data pertaining to April 1, 2020 to June 30, 2020 which overlaps with the last quarter of the year, July 1, 2019 to June 30, 2020 | Disposal of Complaints 3.12 During July 1, 2020 to March 31, 2021, ONBFCOs handled 29,351 complaints, as against 19,468 complaints handled during July 1, 2019 to June 30, 2020. Out of 29,351 complaints 28,032 complaints were disposed by the end of the year, achieving a disposal rate of 95.51%. The position of complaints handled by ONBFCOs is tabulated in Table 3.4 below: | Table 3.4: Position of customer complaints handled by ONBFCOs | | Particulars | 2019-20
(Jul – Jun) | 2020-21
(Jul – Mar) | | Complaints brought forward from the previous year | 36 | 908 | | Complaints received during the year | 19,432 | 26,957 | | Complaints of 2019-20 transferred from CEPCs during 2020-21 and email complaints received before June 30, 2020 but converted into complaints later than June 30, 2020 | - | 1,486 | | Total number of complaints handled during the year | 19,468 | 29,351 | | Complaints disposed during the year | 18,560 | 28,032 | | Percentage of disposal | 95.34% | 95.51% | | Complaints pending at the end of the year | 908 | 1,319 | | Complaints pending for less than one month | 380 | 659 | | Complaints pending for one to two months | 187 | 365 | | Complaints pending for two to three months | 60 | 98 | | Complaints pending for more than three months | 281 | 197 | 3.13 The status of complaints received and disposed under the OSNBFC, 2018 office- wise during July 1, 2020 to March 31, 2021 is given at Appendix 3.5. 3.14 Complaints that are not on the grounds specified in Clause 8 of the OSNBFC, complaints where the procedure for filing the complaint as laid down in Clause 9 and 9A of the OSNBFC is not followed or complaints received against entities not registered with RBI, etc. are classified as ‘non-maintainable’ complaints. Of the complaints handled during July 1, 2020 to March 31, 2021, 11,832 (40.31%) of the complaints were disposed as maintainable. The NBFCO-wise position of maintainable complaints disposed is given in Appendix 3.6. Mode of disposal of maintainable complaints 3.15 The mode of disposal of maintainable complaints is indicated in Table 3.5 below: | Table 3.5- Mode of disposal of maintainable complaints by ONBFCOs | | Mode of disposal | 2019-20
(Jul - Jun) | 2020-21
(Jul - Mar) | | Mutual settlement/ agreement | 4,045 | 8,719 | | | 71.12% | 73.69% | | Complaints withdrawn | 1 | 0 | | | 0.02% | 0% | | Awards issued | 0 | 6 | | | 0% | 0.05% | | Rejected | 1,641 | 3,107 | | | 28.85% | 26.26% | | Total maintainable complaints | 5,687 | 11,832 | | Note: Figures in % indicate percentage to maintainable complaints | 3.16 During July 1, 2020 to March 31, 2021, a major portion of the maintainable complaints disposed (73.69%) was closed under Clause 11 of the OSNBFC, which states that the grievances raised by the complainant have been resolved by the NBFC through mutual settlement/agreement with the intervention of the Ombudsman. Further, 26.26% of the complaints were rejected; and 6 Awards were issued during the year, July 1, 2020 to March 31, 2021. 3.17 The non-maintainable complaints formed a sizeable portion (55.19%) of the complaints handled during July 1, 2020 to March 31, 2021. The grounds under which the complaints were determined as non-maintainable are given in Chart 3.4. It may be observed that complaints were determined as non-maintainable largely due to i) entity not being covered under the OSNBFC (ii) complaints not being represented properly or (iii) the complaints being FRCs. 3.18 The NBFC-wise list of maintainable complaints disposed during the year July 1, 2020 to March 31, 2021 is given in Appendix 3.7. Appeals against the decisions of NBFCOs 3.19 The OSNBFC provides an appellate mechanism under which, the complainant as well as the NBFC, can Appeal against the decision or Award of the Ombudsman, to the AA designated under the Scheme. Appeal can be made against the closure of a complaint provided it has been closed under the appealable clauses of the Scheme, for the reasons referred to in Sub Clauses (c) to (f) of Clause 13; and against an Award under Clause 12 of the Scheme. The DG-in-Charge of the CEPD is the designated AA. The secretarial assistance to the AA is provided by the CEPD. During July 1, 2020 to March 31, 2021, one Appeal was received, which was under process, at the end of the year, as detailed in Table 3.6. | Table 3.6: Position of Appeals – ONBFCOs | | Particulars | 2020-21
(Jul - Mar) | | Appeals pending at the beginning of the year | 1 | | Appeals received during the year from complainants | 1 | | Appeals received during the year from NBFCs | 0 | | Total Appeals handled during the year | 2 | | Appeal disposed during the year | 1 | | Pending at the end of the year | 1 | | Mode of Disposal: | | Appeals remanded | 0 | | Appeals withdrawn/ settled/ infructuous | 0 | | Appeals rejected | 1 | | Appeals allowed | 0 | | Appeals Disposed: | | In favour of complainants | 1 | | In favour of NBFCs | 0 | | Neither in favour of complainants nor in favour of NBFCs (remanded back /infructuous) | 0 |
Chapter 4
Ombudsman Scheme for Digital Transactions (OSDT), 2019:
Activities during July 1, 2020 to March 31, 2021 The number of complaints received by the 22 OODTs during July 1, 2020 to March 31, 2021 was 2,946, compared to 2,481 complaints received during July 1, 2019 to June 30, 2020. As the year 2020-21 was observed with just nine months, for the ease of Y-o-Y comparison in absolute terms, the report compares the data for the period April 1, 2020 to March 31, 2021 as against July 1, 2019 to June 30, 2020. Accordingly, on a Y-o-Y comparison, the number of complaints received during April 1, 2020 to March 31, 2021 was 3,594 registering an increase of 44.86% over July 1, 2019 to June 30, 2020. The rate of disposal of complaints stood at 99.13% during July 1, 2020 to March 31, 2021. Complaints pertaining to fund transfers/ UPI/ BBPS/ Bharat QR Code constituted the largest share of complaints i.e. 51.15%. The majority (57.54%) of maintainable complaints were resolved through mutual agreement/ conciliation /mediation. Complaints relating to digital modes of transactions were the highest, constituting 93.52% of the total complaints received. During the year, no Awards were issued under the OSDT. No Appeal was received against the decisions of the ODTs. | 4.1 The OSDT, 2019 is administered through the 22 offices where the OBOs are situated. Receipt of complaints 4.2 During July 1, 2020 to March 31, 2021, 2,946 complaints were received at the OODTs. The transition year 2020-21 comprised of nine months. Therefore, for the purpose of Y-o-Y comparisons in absolute terms, the report compares the data for the period April 1, 2020 to March 31, 2021 as against the numbers reported in the previous financial year, i.e., July 1, 2019 to June 30, 2020. The receipt of complaints during April 1, 2020 to March 31, 2021, showed a 44.86% increase over the previous year when compared to July 1, 2019 to June 30, 2020. The year-wise number of complaints received at OODTs in last three years is given in Chart 4.1 and Table 4.1.
| Table 4.1 - Number of complaints received by OODTs during last two years | | | 2019-20
(Jul-Jun) | 2020-21*
(Apr-Mar) | 2020-21
(Jul-Mar) | | No. of OODTs | 22 | 22 | 22 | | Complaints received | 2,481 | 3,594 | 2,946 | | * Includes data pertaining to April 1, 2020 to June 30, 2020 which overlaps with the last quarter of the year, July 1, 2019 to June 30, 2020 | 4.3 During July 1, 2020 to March 31, 2021, 3,203 complaints were handled by OODTs, of which, 99.13% complaints were disposed at the end of the year. The position of customer complaints handled by OODTs is tabulated in Table 4.2 below: | Table 4.2 - Position of customer complaints handled by OODTs | | Particulars | 2019-20
(Jul – Jun) | 2020-21
(Jul - Mar) | | Complaints brought forward from previous year | 53 | 230 | | Complaints received by email before June 30, 2020 but registered as complaints after July 1, 2020 and complaints transferred from CEPCs on or later than July 1, 2020 | - | 27 | | Complaints received | 2,481 | 2,946 | | Total number of complaints handled | 2,534 | 3,203 | | Complaints disposed | 2,304 | 3,175 | | Rate of disposal (%) | 90.92% | 99.13% | | Complaints pending at the end of the year | 230 | 28 | | Complaints pending for less than one month | 31 | 18 | | Complaints pending for one to two months | 20 | 3 | | Complaints pending for two to three months | 23 | 2 | | Complaints pending for more than three months | 156 | 5 | 4.4 Of the 2,946 complaints received by the OODTs, OODT-II, Mumbai received the maximum number of complaints (292), which accounted for 9.91% of the total complaints received by the OODTs, followed by OODT, Bhopal (259) and OODT-I, New Delhi (245). OODT, Thiruvananthapuram (12) received the least share of complaints with 0.41%. office-wise receipt of complaints at OODTs is given at Appendix 4.1. 4.5 A comparative position of complaints received by OODTs during the last two years is given in Chart 4.2. Mode of receipt of complaints 4.6 During July 1, 2020 to March 31, 2021, 99.90% (2,943) of the complaints were lodged through digital mode using the CMS portal/ email/ CPGRAMS. This reflects the tech-savvy nature of the users of digital financial products who are more comfortable in filing their complaints online as compared to other modes. Only three complaints were received through the physical mode during the year. A comparative position of the various modes through which the complaints were received during July 1, 2020 to March 31, 2021 is depicted in Chart 4.3, with details provided at Appendix 4.2. Zone-wise distribution of complaints 4.7 The North zone accounted for the maximum complaints (31.84%) during July 1, 2020 to March 31, 2021, followed by the West zone (29.87%) and the South zone (20.47%). The East zone accounted for the least share i.e. 17.82% of the total complaints received. The zone-wise distribution of complaints received is given at Appendix 4.3 and depicted in Chart 4.4 below. Complainant group-wise classification 4.8 Individual customers constituted the largest segment (76.75%) of complainants during July 1, 2020 to March 31, 2021. Senior citizens accounted for 0.81% of the total complaints. The complainant group-wise classification of complaints is given at Appendix 4.4. Entity type-wise classification 4.9 The entity type-wise classification of complaints received by OODTs during July 1, 2020 to March 31, 2021 is indicated in Chart 4.5 and Table 4.3 below. 4.10 In tune with the size of their network and business, PPIs had the highest share of complaints accounting for 85.81% of the total complaints, followed by Bharat Bill Payment Central Unit (BBPCU)/ Bharat Bill Payment Operating Unit (BBPOU) with 4.18% share in total complaints. Other entities accounted for 10.01% of total complaints.
| Table 4.3: Entity type-wise break-up of complaints received at OODTs during July 1, 2020 to March 31, 2021 | | Entity | 2020-21
(Jul- Mar) | | Prepaid Payment Instruments | 2,528 | | 85.81% | | BBPCU/ BBPOU | 123 | | 4.18% | | Others | 295 | | 10.01% | | Note: Figures in % indicate percentage to total complaints | Nature of complaints handled 4.11 Clause 8 of the Scheme specifies the grounds on which a customer can file a complaint before the Ombudsman. Table 4.4 categorizes complaints received on the grounds of deficiency in digital banking services as specified under Clause 8 of the OSDT, 2019. | Table 4.4 – Category-wise distribution of complaints | | Category | 2019-20
(Jul - Jun) | 2020-21*
(Apr - Mar) | 2020-21
(Jul - Mar) | | Fund Transfers/ UPI/ BBPS/ Bharat QR Code | 1,089 | 1,775 | 1,507 | | 43.89% | 49.39% | 51.15% | | Mobile/Electronic Fund Transfers / Mobile/Electronic Banking | 598 | 824 | 665 | | 24.10% | 22.93% | 22.57% | | Non-reversal of Funds due to Wrong Beneficiary Transfer by System Participant | 218 | 291 | 241 | | 8.79% | 8.10% | 8.18% | | Prepaid Payment Instruments (PPI) | 198 | 253 | 203 | | 7.98% | 7.04% | 6.89% | | Violation of RBI Directives in relation to Fees/Charges | 58 | 100 | 76 | | 2.34% | 2.78% | 2.58% | | Out of Subject | 75 | 57 | 33 | | 3.02% | 1.59% | 1.12% | | Others | 245 | 294 | 221 | | 9.88% | 8.18% | 7.50% | | Total | 2,481 | 3,594 | 2,946 | Note: Figures in percentages indicate share to total complaints
* Includes data pertaining to April 1, 2020 to June 30, 2020 which overlaps with the last quarter of the year, July 1, 2019 to June 30, 2020 | 4.12 During July 1, 2020 to March 31, 2021, complaints related to fund transfers/ UPI/ BBPS/ Bharat QR code constituted the largest share i.e. 51.15% of the total complaints received, followed by mobile/electronic fund transfers / mobile/electronic banking (22.57%) and non-reversal of funds due to wrong beneficiary transfer by System Participants (8.18%). Disposal of complaints 4.13 Despite the increased inflow of complaints with the roll out of CMS, and the ongoing COVID-19 pandemic, OODTs achieved a disposal rate of 99.13%. The OODT-wise position of complaints disposed during July 1, 2020 to March 31, 2021 is given at Appendix 4.5. 4.14 The details of the grounds under which the complaints have been disposed as non-maintainable are given in the Chart 4.6 below. As may be observed, complaints were considered non-maintainable largely due to i) the complaints not being represented properly, ii) complaints being FRCs iii) not under the definition of System Participants and digital transaction. 4.15 FRCs are those complaints which were lodged with the OODTs without the complainant approaching the concerned entity first. Such FRCs were forwarded to the respective System Participant for disposal at their end. Complainants were, however, advised through closure letters that they may approach the OODT again in case they were not satisfied with decision of the concerned entity. 4.16 The OODT-wise and entity-wise distribution of maintainable complaints is given at Appendix 4.6 and Appendix 4.7 respectively. Mode of disposal of maintainable complaints 4.17 ‘Maintainable’ complaints are those that are made before the ODT, relating to the grounds of complaint specified in Clause 8 of the OSDT and are otherwise in compliance with the requirements laid down in the Scheme. The Scheme endeavors to promote settlement of complaints by agreement through conciliation and/ or mediation by OODTs. If the parties fail to arrive at an acceptable agreement, the ODT gives a decision or passes an Award. However, no Award was issued during the year under the OSDT. 4.18 Table 4.5 depicts the way the maintainable complaints were disposed of during the year. Of the maintainable complaints, 57.54% were resolved through agreement and 42.46% were rejected. | Table 4.5 - Mode of disposal of maintainable complaints | | Disposal of Maintainable Complaints | 2019-20
(Jul – Jun) | 2020-21
(Jul – Mar) | | By Mutual Settlement/Agreement | 532 | 885 | | 56.12% | 57.54% | | Disposal by Award | 0 | 0 | | 0.00% | 0.00% | | Maintainable Complaints Rejected | 416 | 653 | | 43.88% | 42.46% | | Maintainable Complaints Withdrawn/Issued Advisory | 0 | 0 | | 0.00% | 0.00% | | Total | 948 | 1,538 | | Note: Figures in % indicate share to total complaints | Grounds for rejection of maintainable complaints 4.19 The grounds for rejection of maintainable complaints and their proportion to total complaints received during the year are indicated in Table 4.6. | Table 4.6 - Grounds for rejection of maintainable complaints | | Ground for Rejection | No. of Complaints Rejected | 2019-20
(Jul - Jun) | 2020-21
(Jul - Mar) | | Not on the grounds of complaint referred to in Clause 8 - Clause 13(1)(a) | 409 | 631 | | 98.32% | 96.63% | | Not in accordance with Sub Clause (3) of Clause 9 - Clause 13(1)(b) | 2 | 16 | | 0.48% | 2.45% | | Beyond the limit of compensation prescribed under Clause 12 (5) and 12(6) - Clause 13(1)(c) | 1 | 4 | | 0.24% | 0.61% | | Complaints without any sufficient cause - Clause 13(1)(e) | 4 | 1 | | 0.96% | 0.15% | | The complaint pertains to the same cause of action, for which any proceedings before any court, tribunal or arbitrator or any other forum is pending 13(2) | 0 | 1 | | 0.00% | 0.15% | | Total | 416 | 653 | | Note: Figures in percentages indicate the share to total complaints | 4.20 As may be seen from Table 4.6 above, the maximum number of rejections due to complaints ‘not on grounds of complaint referred to in Clause 8 -Clause 13(1)(a)’, inviting need for creation of greater awareness among complainants about the OSDT. Age-wise classification of pending complaints 4.21 Although OSDT does not specify any time limit for resolution of complaints by ODTs, efforts are made to resolve the same within two months. However, due to reasons such as non-submission and/ or delay in submission of complete information by complainants/ entities, the time taken for resolution may get extended in some cases. The ODTs and the PNOs of the System Participants were advised/ sensitized to ensure that complaints are redressed expeditiously. The age-wise classification of the number of pending complaints as on March 31, 2021 is detailed in Appendix 4.8. Appeals against the decisions of the ODTs 4.22 The DG-in-Charge of the CEPD, RBI is designated as the AA as per the provisions of the OSDT. CEPD provides the Secretariat to the AA. No Appeal was received during July 1, 2020 to March 31, 2021.
Chapter 5
Complaints received through Centralised Public Grievance Redress and Monitoring System (CPGRAMS)
and applications under Right to Information (RTI) Act, 2005 During the year 4,322 complaints were received through CPGRAMS and 1,243 applications were received under the RTI Act, 2005 in all the ORBIOs which were replied to. | CPGRAMS 5.1 CPGRAMS is a mechanism to receive and address consumer complaints regarding different products and schemes offered by the GoI or its agencies. The CPGRAMS portal has been developed by the Department of Administrative Reforms and Public Grievances of GoI. Government departments and banks are subordinate offices in this portal. CEPD is the Nodal Office for the Reserve Bank, and the ORBIOs are its subordinate offices. 5.2 A comparative position of the complaints received through this portal and handled by the ORBIOs during the last two years is given at Appendix 5.1. The complaints received through this portal went up from 1,515 in the previous year to 4,322 in the current year. RTI Act, 2005 5.3 The RBI Ombudsmen are the Central Public Information Officers (CPIOs) under the RTI Act, 2005 to receive applications and furnish information related to complaints handled by the ORBIOs. During the year, 1,243 RTI applications were received by all the ORBIOs. The office-wise position of such applications received during the last two years is detailed at Appendix 5.2.
Chapter 6
Other Developments Important regulatory efforts were made in the area of customer service during July 1, 2020 to March 31, 2021. These include the issuance of instructions for strengthening of grievance redress mechanism in banks on January 27, 2021. The instructions comprise of, inter-alia; (i) enhanced disclosures; (ii) recovery of cost of redress for complaints received at the OBOs above the average number of maintainable complaints in the peer-group of the bank, and (iii) intensive review and supervisory actions. The annual RCA of the major areas of complaints was carried out and steps to address the concerns identified were taken. A comprehensive framework for financial education from the perspective of consumer protection was formulated. The awareness campaigns on consumer protection and the Ombudsman Schemes were further intensified. Efforts were initiated towards inclusion of safe banking practices in educational curriculum.
Based on the recommendations of an In-house Committee, the existing three Ombudsman Schemes of RBI will be integrated into RB-IOS, 2021 and the CRPC will be set up along with the Contact Centre. The RB-IOS, 2021 will have an expanded coverage of nature of customer complaints as well as the REs falling under its ambit. It will cover all complaints falling under the definition of deficiency in service as defined therein, except for those falling in a small list of exclusions. To begin with RB-IOS, 2021 will include non-scheduled UCBs with a deposit size of ₹50 crore and above, in addition to the existing entities falling under the three extant Schemes. Going forward, the ambit of RB-IOS, 2021 would be further expanded to include more REs in a phased manner. CMS has been enhanced to meet the requirements of RB-IOS, 2021. | Regulations: Important regulatory measures taken by the Reserve Bank 6.1 The important regulations issued by the Reserve Bank during the period of review, with implications for customer service, covered facilities for exchange of notes and coins; security measures for electronic transactions; Know Your Customer (KYC) – including steps for digital KYC; availability of Real Time Gross Settlement System (RTGS) on 24x7 basis; streamlining Quick Response (QR) Code infrastructure, positive pay system for Cheque Truncation System (CTS), mandating payment system participants to provide online dispute resolution system for digital payments, upward revision in relaxation in requirement for additional factor authentication for contactless card withdrawal, apart from circular on strengthening of grievance redress mechanism in banks. A chronology of the salient measures is given at Appendix 6.1. Circular on strengthening of grievance redress mechanism in banks, dated January 27, 2021 6.2 A comprehensive framework for strengthening of the internal grievance redress mechanism in banks was issued on January 27, 2021. The framework comprises of the following aspects: i. Enhanced disclosures on complaints: The disclosures being made by the banks in their annual accounts were summary in nature. These disclosures have been enhanced and made granular by incorporating: (a) the mode of disposal of the complaints received by the ORBIOs against the banks; and (b) the top-five grounds on which complaints are received by the banks. ii. Recovery of cost of redress of maintainable complaints from the banks against whom: (a) average number of maintainable complaints per branch; (b) average number of maintainable complaints per 1,000 accounts (total of deposit and credit accounts) held by the bank; and (c) average number of maintainable digital complaints per 1,000 digital transactions executed through the bank by its customers; are in excess of their peer group averages, with peer groups being based on the asset-size of the banks. The cost for redress of complaints by the ORBIOs will be recovered to the extent of 30%, 60% or 100% of the cost incurred by the ORBIOs depending upon whether one, two or all the above three parameters are breached. iii. Intensive review of grievance redress mechanism on an annual basis based on the information available with RBI as also the information obtained from banks. Banks with persistent issues, as identified from the annual assessment, will be earmarked for further intensive review to identify underlying systemic issues and to initiate corrective measures for implementation within a specific time frame. In case no improvement is observed within the prescribed timeline, the concerned bank(s) will be subjected to corrective actions through appropriate regulatory and supervisory measures. Root Cause Analysis (RCA) of major areas of complaints 6.3 CEPD compiles the findings of RCA of the major areas of complaints received in the ORBIOs and CEPCs with the objective of identifying and addressing the factors underlying deficiencies in customer service and initiating actions to address them. This exercise has been initiated under Utkarsh 2022 under which one of the milestones was to conduct the RCAs. The findings of RCA conducted in March-April, 2021 is tabulated below: | Table 6.1 RCA-2021 – Major concerns, root causes identified and remedial measures | | S. No | Issue | Major Concerns Raised | Root-Causes | Remedial Measures | | 1. | Unauthorized / Fraudulent transactions in accounts | Instances of hacking / phishing / vishing leading to fraudulent transactions in Internet Banking / UPI/ mobile applications/ Debit Cards/ Credit Cards;
Transfer of funds to unknown merchants through dubious intermediaries or aggregators in the name of utility bill payments. | Sharing of credentials by victims; Lack of awareness;
Suspected involvement of organized groups using advanced technologies in committing fraud engaged in activities such as SIM swap, placing false details in google search;
Lapses in KYC validation;
System of service providers – example - blocking ATM/Credit cards, but transactions going through UPI; Gaps in the security of IT system of banks/ velocity check / pattern analysis of transactions in beneficiary accounts etc. | Awareness generation activities are underway.
Coordination with law enforcement agencies at Central and Regional level to be intensified.
National Crime Reporting Portal launched by Indian Cyber Crime Coordination Centre to be popularized.
Financial service providers have been sensitized on data security, KYC adherence, ensuring that any breach in ATM/Credit card/ internet banking credentials reported by customer is acted upon to plug all the vulnerable points. | | 2. | Practices related to loans and advances | Harassment by recovery agents; Lack of transparency in interest rates, applicable charges, etc.;
Levy of multiple bounce charges due to repeated presentation of postdated cheques / debit mandates | Relying on non-updated overdue data by recovery agents for collection of dues from customers;
Lenders presenting unrealized Electronic Clearing Service (ECS) mandates multiple times resulting in accumulation of bounce charges due to insufficient funds. | Necessary regulatory instructions have been issued mandating banks that, “The up to date details of the recovery agency firms / companies engaged by banks may also be posted on the bank’s website”. The instructions have been reiterated;
Issue of multiple presentation of cheques and debit mandates being taken up with service providers. | | 3. | COVID-19 related issues | Non-sanction of moratorium by lenders;
Presentation of ECS / National Automated Clearing House (NACH) mandates despite borrowers having opted for moratorium | Assumption on part of the borrowers that restructuring was not subject to any internal policy framed by the lender;
Lack of clear and proper communication from the banks regarding eligibility, conditions and board approved policy on moratorium; Failure to communicate the tenure of moratorium. | CEPD has advised lenders to inform their customers about the reliefs available according to their board approved policies. | | 4. | Credit Cards | Billing for undelivered / returned Credit Cards; Issue of unsolicited cards; Levy of Charges, Annual Fees & Equated Monthly Instalment (EMI);
Excessive Finance Charges / Late fees;
Harassment/ misbehavior by recovery agents;
Wrong reporting to Credit Information Companies (CICs). | Internal system deficiencies such as disconnect between the departments of credit card issuers, weak documentation while processing credit card applications through digital channels;
Opaqueness / non-disclosure of membership fee for subsequent years;
Instances of erroneous reporting by card issuers to credit information companies;
Lack of awareness about implications of payment of minimum balance due;
Negligence of customers in reading terms and conditions, policy of issuance and charges with respect to conversion of outstanding into EMIs. | Regulatory instructions exist on KYC, clarity in communication of terms and conditions, recovery measures, reporting to CICs.
REs have been advised to enhance the awareness among their credit card holders on implications of paying only the “minimum” due and Most Important Terms and Conditions (MITC). | | 5. | Interest / loan subsidy related | Delayed / Non-receipt of education loan subsidy, crop insurance subsidy, Pradhan Mantri Awas Yojana (PMAY) subsidy. | Lack of information on various government sponsored schemes, eligibility and subsidy details;
Lack of real time monitoring of subsidy application status and dispensing information regarding the same to borrowers;
Details of subsidy amounts credited are not conveyed properly to the borrowers by the bank;
Delay in submission of claims;
Lack of awareness on producing requisite certificates while lodging claims;
Lack of clarity on repayment schedule for both borrowers & branch officials;
Mismatch between documents (Identity proofs or documents such as Aadhar Card, Jambandi (Revenue Records), Election ID etc.);
Lack of understanding of PMAY guidelines by the frontline staff.
| Lack of awareness among staff, failure in adhering to prescribed procedures etc.
The REs have been advised in the matter. | | 6. | Remittances | Delay / Failure in online payments / fund transfer;
Erroneous Fund Transfer. | Negligence of customers in entering account details;
Lack of clarity on the entity to approach;
Delay in raising chargeback request by the banks;
Failure in daily reconciliation of transactions;
Lack of proper communication between the originating and destination banks;
Divergent and non-standardized practices adopted by the banks. | Customer awareness on precautions to be taken during remittance, and actions to be followed in the event of wrong remittance may be enhanced;
Timely lodgment of chargebacks by the remitter/issuer bank and suo-moto payment of compensation to customers in case of delay;
Ensuring strict adherence to NPCI guidelines to handle charge backs by REs. | | 7. | Misbehavior of staff | Non-adherence to provisions of Code of banks' commitment to customers. | Improper guidance on the issues faced by customers;
Communication barrier between staff and customers;
False claims by customers of misbehavior to strengthen their case with respect to some other grievance. | The matter is taken up with the REs during interactions with them. | | 8. | Miscellaneous | Entity specific and complaints related to various issues and activities of entities not regulated by RBI. | The root causes have been identified at entity level. | The matter has been taken up at entity level. | Status of implementation of the action plan set out in ‘Utkarsh 2022’ for the year, July 1, 2020 to March 31, 2021 6.4 The medium-term strategy of RBI, ‘Utkarsh 2022’, had set two milestones for the year 2020-21 as given below: i. Framework for financial education for greater customer awareness; ii. Extension of BOS, 2006 to Financially Sound Well-Managed (FSWM) UCBs. Framework for financial education for greater customer awareness 6.5 A framework for consumer education from the perspective of consumer protection has been prepared with the following components – (i) Target Group, (ii) Content, (iii) Delivery Channels, (iv) Coordination Aspects, and (v) Impact Analysis. The framework envisages focused financial education to target groups such as potential entrants to the financial sector, vulnerable consumers, educated but financially illiterate customers, rural youth, workers/migrants, etc. The framework comprises of targeted methodologies for dissemination of awareness messages/content through digital (SMS, television and print media advertisements, videos on RBI/ CMS portal etc.) and physical modes (townhall meetings, awareness campaigns, training programmes in coordination with National Centre for Financial Education for school teachers, etc.). Efforts have been made, in collaboration with Financial Inclusion and Development Department, to incorporate content on safe banking practices in the educational curriculum for school students. Extension of BOS, 2006 for FSWM UCBs 6.6 All scheduled UCBs are currently covered under BOS, 2006. The In-house Committee to review the Ombudsman Schemes had recommended inclusion of non-scheduled UCBs with a deposit base of ₹50 crore and above, as on the date of the audited balance sheet of the previous financial year. The inclusion shall be made in the RB-IOS, 2021 which will be rolled out shortly. Review of Ombudsman Schemes for updation and effective implementation, including through convergence 6.7 Based on the recommendations of the In-house Committee set up to examine, inter alia, issues relating to the convergence of the three Ombudsman Schemes - BOS, the OSNBFC and the OSDT, a series of measures have been initiated. A summary of the major changes is given below: i. Integration of the existing Ombudsman Schemes of RBI into RB-IOS, 2021. With this integration, it will not be incumbent upon the complainants to identify the scheme under which a complaint needs to be filed. ii. Establishment of CRPC for receipt of complaints from across the country and against any RE, along with a Contact Center with enhanced IVRS. On-tap information on the IVRS on details regarding registration of complaint and status of redress is being made available. iii. ‘One Nation One Ombudsman’ principle for handling of complaints replacing the jurisdiction-based approach under the earlier schemes; thereby reducing rejections on account of complaints registered under wrong jurisdictions/ time delay due to transfer of complaints among jurisdictions, etc. Further, to ensure uniformity in initial processing of complaints and reduce rejections due to improper/incomplete representation of complaints, registration of complaints received through physical mode and email shall be done centrally, at CRPC. iv. Filtering/handling and initial scrutiny of all complaints shall be done at the CRPC to weed out a major portion of non-maintainable complaints. Thereafter, only maintainable complaints and few potentially non-maintainable complaints will be allocated to the ORBIOs for better and efficient use of resources to address maintainable complaints. v. Complaints shall be distributed across ORBIOs in a near equitable manner based on an internal allocation algorithm to address the current unequal receipt of complaints across the ORBIOs. vi. Delegation: Complaints resolved through facilitation (irrespective of the disputed amount) and non-maintainable complaints shall be closed at the level of Deputy RBIO. vii. All REs shall be brought under the RB-IOS, 2021 in a phased manner. In terms of the Utkarsh 2022 milestones, the RB-IOS, 2021 will include in its initial phase, all non-scheduled UCBs with a deposit size of ₹50 crore and above. viii. The grounds of complaints covered under the RB-IOS, 2021 shall be broad-based. Complaints on deficiency in service provided by the REs, except for those given under the ‘exclusions’ list for rejection of a complaint, under grounds for non-maintainability, would be covered under the RB-IOS, 2021. ix. The CMS has been upgraded in a major way to enhance its functionality in line with the RB-IOS, 2021: -
Complaints on being registered in the CMS shall get auto-assigned to PNOs of the concerned RE, along with the allocation to any of the ORBIOs, on real-time basis. This shall reduce the time lag between the receipt of complaint by the ORBIO and the reference being made to the RE for comments. -
Filters for non-maintainability have been incorporated in the CMS portal in order to filter out non-maintainable complaints being registered on the portal. -
Operating procedures have been incorporated to synchronize the issuance of closure letters to complaints on real-time basis upon closure of complaints by the RBIO/ Deputy RBIO. -
Enhanced features have been built in for tracking of complaints registered on CMS. Awareness generation activities of CEPD and Ombudsmen 6.8 CEPD conducted multi-media campaigns on the Ombudsman Schemes as well as Basic Savings Bank Deposit Account (BSBDA), safe digital banking, and facilities for senior citizens and differently abled persons. The Ombudsmen conducted 15 townhall events wherein the Ombudsman Schemes and important customer service issues were discussed with members of public and the REs. Further, 139 awareness programmes were conducted with focus on specific groups such as servicemen, school/ college students, consumer groups etc. A list of the awareness programmes conducted by Ombudsmen is provided at Appendix 6.2. 6.9 Messages on awareness on safe banking practices were hosted on the Reserve Bank website, the ‘RBI Kehta Hai’ webpage and the CMS webpage on ‘cyber frauds’, ‘safe digital banking’, ‘Ombudsman Schemes of RBI’ and ‘CMS’. Nationwide Bank Customers’ Satisfaction Survey 6.10 A nationwide survey among bank customers was conducted during June-July 2021 to assess the satisfaction level with the bank’s grievance redress system. The survey was based on a sample of 20,619 bank customers covering rural, semi-urban, urban, and metropolitan branches of 30 banks from across 21 states of the country, drawn at confidence level of 99%. The sample comprised of all 12 Public Sector Banks, 12 Pvt. SBs (Axis Bank, Federal Bank, HDFC Bank, ICICI Bank, IDBI Bank, IDFC First Bank, IndusInd Bank, Karnataka Bank, Karur Vysya Bank, Kotak Mahindra Bank, RBL Bank and Yes Bank), four FBs (Citibank, DBS Bank, HSBC and Standard Chartered Bank) and two PBs (Airtel Payments Bank and Paytm Payments Bank). The survey was conducted by a third-party agency through telephonic interviews focusing on grievance redressal mechanism of the banks, including responses from the customers of recently merged banks, to assess the impact of the merger on the customer services being provided. The respondent profile for the said survey is depicted in Chart 6.1. 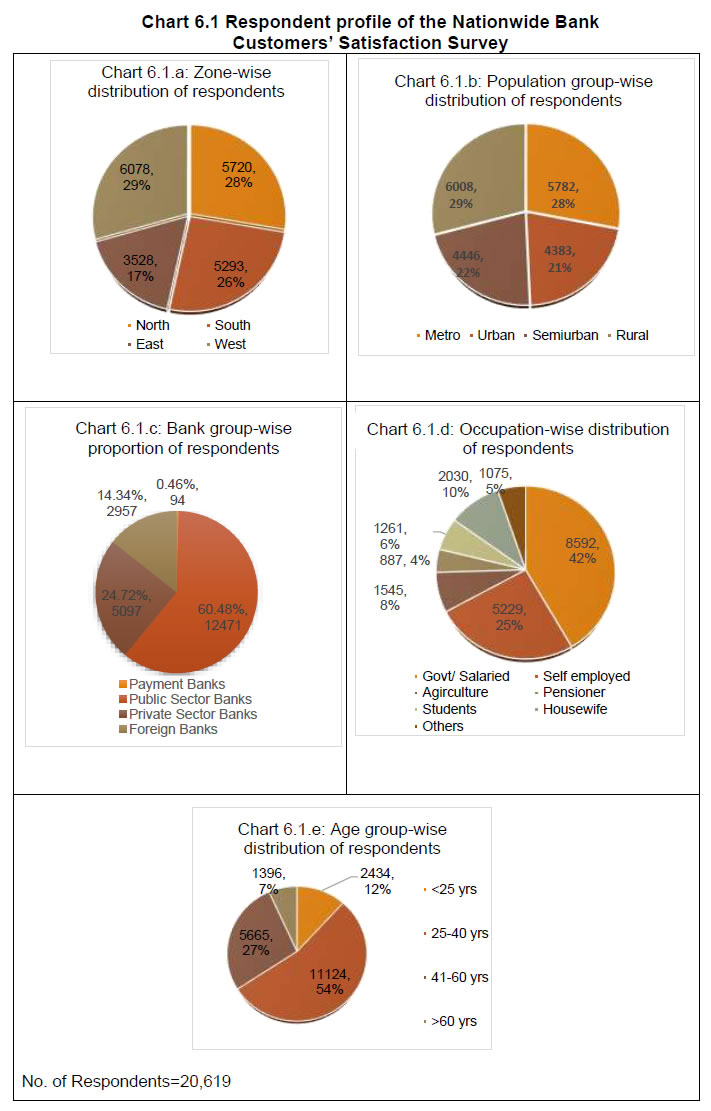 6.11 Of the 20,619 bank customers surveyed; 3,886 (18.85%) indicated having had a grievance against their bank in the recent past. Of these 3,886 customers; 1,927 (57.76%) reported that they were satisfied with the redress mechanism in their banks. 6.12 The most important factor driving satisfaction among the complainants was observed to be the time taken by the bank to resolve a complaint. 6.13 The survey also assessed the satisfaction of customers with the services being provided in recently merged banks as applicable. Of the 5,762 such respondents covered (out of 20,619); 1,144 (19.85%) respondents stated that their accounts were transferred to another branch after the merger. Of these 1,114 respondents, 946 (82.69%) indicated that their overall experience was satisfactory regarding the merger of banks. Winding down of Banking Codes and Standards Board of India (BCSBI) 6.14 BCSBI was institutionalized on the recommendation of the Committee on Procedures and Performance Audit of Public Services under the chairmanship of Shri S.S.Tarapore, former DG of RBI. It was registered as an independent and autonomous body under the Societies Registration Act, 1860 in February 2006. Upon a review conducted by CEPD, it was concluded that Reserve Bank can, by itself, undertake the activities that were identified for BCSBI; and that the BCSBI has now served the purpose for which it was set up. As such, the need for BCSBI to continue was reviewed based on the directions of the Committee of the Central Board in its meeting dated January 30, 2019 and its dissolution was approved. BCSBI ceased its operations and initiated the dissolution process in late 2019. However, due to the ongoing pandemic and the inability of the society to hold its mandatory special general body meeting, the process of dissolution got delayed. The dissolution process is in advanced stage. Way forward 6.15 During the period April 1, 2021 to March 31, 2022, CEPD will work towards implementing the milestones under Utkarsh 2022 which comprises of the following: -
Formulate policy/ scheme for handling complaints not covered under Ombudsman Scheme; -
Efforts for inclusion of safe banking practices in educational curriculum; -
Extension of IO Scheme for FSWM UCBs & RRBs. 6.16 Further, implementation of the lagging indicators identified for the Utkarsh goals completed during the previous two years is in process, including implementation of the recommendations made by the In-house Committee to review the Ombudsman Schemes. 6.17 Regulatory initiatives regarding financial consumer protection will be enhanced through regular RCA to identify issues to address, improving the internal grievance redress mechanism of REs, and measures for implementation of the framework for financial education shall be enhanced.
APPENDICES Appendices pertaining to BOS | Appendix 2.1 – OBO-wise receipt of complaints in the last two years | | Name of the OBO | No. of complaints received during | % change (Y-o-Y) 2020-21 (Apr-Mar) over 2019-20 (Jul – Jun) | % to total complaints 2020-21 (Jul-Mar) | 2019-20
(Jul-Jun) | 2020-21*
(Apr-Mar) | 2020-21
(Jul–Mar) | | Ahmedabad | 16,008 | 20,945 | 17,223 | 30.84% | 6.30% | | Bengaluru | 18,475 | 17,114 | 13,535 | -7.37% | 4.95% | | Bhopal | 14,510 | 15,482 | 12,377 | 6.70% | 4.53% | | Bhubaneswar | 5,311 | 6,783 | 5,678 | 27.72% | 2.08% | | Chandigarh | 31,594 | 36,488 | 28,019 | 15.49% | 10.26% | | Chennai | 17,724 | 19,697 | 16,098 | 11.13% | 5.89% | | Dehradun | 7,858 | 7,919 | 6,324 | 0.78% | 2.31% | | Guwahati | 3,641 | 3,493 | 2,678 | -4.06% | 0.98% | | Hyderabad | 19,947 | 21,898 | 17,088 | 9.78% | 6.25% | | Jaipur | 18,144 | 21,859 | 17,636 | 20.48% | 6.46% | | Jammu | 1,530 | 1,744 | 1,368 | 13.99% | 0.50% | | Kanpur | 23,895 | 26,278 | 21,169 | 9.97% | 7.75% | | Kolkata | 11,699 | 14,207 | 11,817 | 21.44% | 4.33% | | Mumbai I | 19,473 | 22,268 | 18,629 | 14.35% | 6.82% | | Mumbai II | 17,917 | 18,604 | 15,215 | 3.83% | 5.57% | | New Delhi I | 18,147 | 22,957 | 18,767 | 26.51% | 6.87% | | New Delhi II | 20,817 | 19,956 | 16,057 | -4.14% | 5.88% | | New Delhi III | 9,589 | 11,011 | 8,416 | 14.83% | 3.08% | | Patna | 17,392 | 17,253 | 12,560 | -0.80% | 4.60% | | Raipur | 3,682 | 3,964 | 3,075 | 7.66% | 1.13% | | Ranchi | 4,581 | 4,724 | 3,797 | 3.12% | 1.39% | | Thiruvananthapuram | 6,696 | 7,103 | 5,678 | 6.08% | 2.08% | | Grand Total | 3,08,630 | 3,41,747 | 2,73,204 | 10.73% | 100.00% | | * Includes data pertaining to April 1, 2020 to June 30, 2020 which overlaps with the last quarter of the year, July 1, 2019 to June 30, 2020 |
| Appendix 2.2 – OBO-wise position of customer complaints handled in the last two years | | Particulars | 2019-20
(Jul - Jun) | 2020-21
(Jul - Mar) | | Complaints brought forward from the previous year | 12,069 | 24,498 | | Complaints received | 3,08,630 | 2,73,204 | | Complaints received by email before June 30, 2020 but registered on or after July 1, 2020; including complaints transferred from CEPCs on or later than July 1, 2020 | - | 4,789 | | Total number of complaints handled | 3,20,699 | 3,02,491 | | Complaints disposed | 2,96,201 | 2,92,409 | | Complaints pending at the end of the year | 24,498 | 10,082 | | 7.64% | 3.33% | | Complaints pending for less than one month (30 days) | 6,086 | 6543 | | 1.90% | 2.16% | | Complaints pending for one to two months | 3,223 | 1864 | | 1.00% | 0.62% | | Complaints pending for two to three months | 1,833 | 848 | | 0.57% | 0.28% | | Complaints pending for more than three months | 13,356 | 827 | | 4.16% | 0.27% | | Note: Figures in % show percentage to the total complaints handled during the respective year |
| Appendix 2.3 – OBO-wise cost for the year, July 1, 2020 to March 31, 2021 | | OBO | Average cost of handling per complaint (₹) | Total cost (₹) | | Ahmedabad | 1,966 | 3,61,90,003 | | Bengaluru | 1,707 | 3,97,18,700 | | Bhopal | 1,676 | 2,14,61,973 | | Bhubaneswar | 4,008 | 2,31,90,000 | | Chandigarh | 1,066 | 3,00,61,549 | | Chennai | 1,901 | 3,15,54,869 | | Dehradun | 1,382 | 1,15,71,500 | | Guwahati | 6,624 | 1,82,96,000 | | Hyderabad | 1,876 | 3,30,00,000 | | Jaipur | 1,113 | 2,00,00,000 | | Jammu | 9,367 | 1,30,10,486 | | Kanpur | 1,927 | 4,78,40,000 | | Kolkata | 4,645 | 6,16,85,104 | | Mumbai-I | 1,787 | 3,69,76,604 | | Mumbai-II | 1,995 | 3,55,75,072 | | New Delhi-I | 1,790 | 3,62,20,926 | | New Delhi-II | 1,536 | 2,65,77,787 | | New Delhi-III | 2,763 | 2,48,10,000 | | Patna | 1,813 | 2,41,31,249 | | Raipur | 3,075 | 97,35,608 | | Ranchi | 3,829 | 1,51,50,000 | | Thiruvananthapuram | 3,906 | 2,25,40,000 | | Overheads including CMS | 171 | 5,17,31,209 | | All India | 1,605 | 48,54,59,506 |
| Appendix 2.4– Mode of receipt of complaints during July 1, 2020 to March 31, 2021 | | Mode of Receipt | No. of Complaints received during | % change (Y-o-Y) 2020-21 (Apr-Mar) over 2019-20 (Jul – Jun) | 2019-20
(Jul-Jun) | 2020-21*
(Apr - Mar) | 2020-21
(Jul - Mar) | | Email | 1,09,740 | 1,07,443 | 79,492 | -2.09% | | 35.56% | 31.44% | 29.10% | | Online | 1,54,580 | 2,01,581 | 1,64,432 | 30.41% | | 50.09% | 58.99% | 60.19% | | Post/Fax/Courier/hand delivery | 44,310 | 32,723 | 29,280 | -26.15% | | 14.36% | 9.58% | 10.72% | | Total | 3,08,630 | 3,41,747 | 2,73,204 | 10.73% | Note: Figures in % indicate percentage to total complaints received during the respective year
* Includes data pertaining to April 1, 2020 to June 30, 2020 which overlaps with the last quarter of the year, July 1, 2019 to June 30, 2020 |
| Appendix 2.5 – Population group-wise distribution of complaints received during July 1, 2020 to March 31, 2021 | | Population group | No of complaints received during | % change (Y-o-Y) | 2019-20
(Jul-Jun) | 2020-21*
(Apr - Mar) | 2020-21
(Jul - Mar) | 2020-21 (Apr-Mar) over 2019-20 (Jul - Jun) | | Rural | 30,979 | 32,898 | 25,861 | 6.20% | | 10.04% | 9.63% | 9.47% | | Semi Urban | 56,286 | 56,717 | 44,683 | 0.77% | | 18.24% | 16.60% | 16.36% | | Urban | 70,081 | 70,394 | 55,482 | 0.45% | | 22.71% | 20.60% | 20.31% | | Metropolitan | 1,51,284 | 1,81,738 | 1,47,178 | 20.13% | | 49.02% | 53.18% | 53.87% | | Total | 3,08,630 | 3,41,747 | 2,73,204 | 10.73% | Note: Figures in % under respective years indicate percentage to total complaints
* Includes data pertaining to April 1, 2020 to June 30, 2020 which overlaps with the last quarter of the year, July 1, 2019 to June 30, 2020 |
| Appendix 2.6 - Nature of complaints across population groups received during July 1, 2020 to March 31, 2021 | | Nature of Complaints | Rural | Semi Urban | Urban | Metro | | ATM / Debit Cards | 14.01% | 21.59% | 23.75% | 40.64% | | Mobile / electronic banking | 10.82% | 19.50% | 24.51% | 45.17% | | Non-observance of FPC | 10.55% | 21.82% | 25.46% | 42.18% | | Credit Cards | 0.31% | 0.79% | 1.57% | 97.33% | | Failure to meet commitments | 8.89% | 16.10% | 26.37% | 48.64% | | Levy of charges without prior notice | 5.35% | 15.27% | 24.11% | 55.27% | | Loans and advances | 11.57% | 17.53% | 23.24% | 47.66% | | Non-adherence to BCSBI Codes | 11.52% | 17.99% | 29.19% | 41.29% | | Deposit Accounts related | 11.58% | 17.68% | 23.77% | 46.96% | | Pension payments | 15.07% | 25.95% | 29.36% | 29.62% | | Remittances | 9.51% | 18.65% | 24.53% | 47.31% | | DSAs and recovery agents | 2.24% | 5.03% | 10.49% | 82.24% | | Para banking | 13.59% | 25.18% | 21.56% | 39.67% | | Notes and Coins | 12.95% | 22.80% | 24.35% | 39.90% | | Others | 10.19% | 17.27% | 20.52% | 52.02% | | Out of purview of BOS | 10.82% | 21.25% | 22.45% | 45.48% | | Total | 9.47% | 16.36% | 20.31% | 53.87% | | Note: Figures in % indicate percentage to total complaints |
| Appendix 2.7 – Zone-wise distribution of complaints received during July 1, 2020 to March 31, 2021 | | OBO | 2019-20
(Jul - Jun) | 2020-21*
(Apr - Mar) | 2020-21
(Jul – Mar) | % change Y-o-Y 2020-21 (Apr-Mar) over 2019-20 (Jul-Jun) | | East Zone | | Bhubaneshwar | 5,311 | 6,783 | 5,678 | 27.72% | | Guwahati | 3,641 | 3,493 | 2,678 | -4.06% | | Kolkata | 11,699 | 14,207 | 11,817 | 21.44% | | Patna | 17,392 | 17,253 | 12,560 | -0.80% | | Ranchi | 4,581 | 4,724 | 3,797 | 3.12% | | Total | 42,624 | 46,460 | 36,530 | 9.00% | | % share to All India | 13.81% | 13.59% | 13.37% | | | | | | | | | North Zone | | Chandigarh | 31,594 | 36,488 | 28,019 | 15.49% | | Dehradun | 7,858 | 7,919 | 6,324 | 0.78% | | Jaipur | 18,144 | 21,859 | 17,636 | 20.48% | | Jammu | 1,530 | 1,744 | 1,368 | 13.99% | | Kanpur | 23,895 | 26,278 | 21,169 | 9.97% | | New Delhi-I | 18,147 | 22,957 | 18,767 | 26.51% | | New Delhi-II | 20,817 | 19,956 | 16,057 | -4.14% | | New Delhi-III | 9,589 | 11,011 | 8,416 | 14.83% | | Total | 1,31,574 | 1,48,212 | 1,17,756 | 12.65% | | % share to All India | 42.63% | 43.37% | 43.10% | | | | | | | | | South Zone | | Bengaluru | 18,475 | 17,114 | 13,535 | -7.37% | | Chennai | 17,724 | 19,697 | 16,098 | 11.13% | | Hyderabad | 19,947 | 21,898 | 17,088 | 9.78% | | Thiruvananthapuram | 6,696 | 7,103 | 5,678 | 6.08% | | Total | 62,842 | 65,812 | 52,399 | 4.73% | | % share to All India | 20.36% | 19.26% | 19.18% | | | | | | | | | West Zone | | Ahmedabad | 16,008 | 20,945 | 17,223 | 30.84% | | Bhopal | 14,510 | 15,482 | 12,377 | 6.70% | | Mumbai-I | 19,473 | 22,268 | 18,629 | 14.35% | | Mumbai-II | 17,917 | 18,604 | 15,215 | 3.83% | | Raipur | 3,682 | 3,964 | 3,075 | 7.66% | | Total | 71,590 | 81,263 | 66,519 | 13.51% | | % share to All India | 23.20% | 23.78% | 24.35% | | | All India Total | 3,08,630 | 3,41,747 | 2,73,204 | | | * Includes data pertaining to April 1, 2020 to June 30, 2020 which overlaps with the last quarter of the year, July 1, 2019 to June 30, 2020 |
| Appendix 2.8– Complainant group-wise classification of complaints received during July 1, 2020 to March 31, 2021 | | Complainant group | Complaints received | 2019-20
(Jul - Jun) | 2020-21*
(Apr - Mar) | 2020-21
(Jul - Mar) | | Individual | 2,61,573 | 2,83,102 | 2,25,879 | | 84.75% | 82.84% | 82.68% | | Individual – Business | 10,142 | 12,279 | 9,905 | | 3.29% | 3.59% | 3.63% | | Proprietorship / Partnership | 5,286 | 6,878 | 5,700 | | 1.71% | 2.01% | 2.09% | | Limited Company | 6,409 | 7,483 | 6,022 | | 2.08% | 2.19% | 2.20% | | Trust | 541 | 607 | 477 | | 0.18% | 0.18% | 0.17% | | Association | 436 | 353 | 289 | | 0.14% | 0.10% | 0.11% | | Government Department | 5,075 | 6,219 | 4,939 | | 1.64% | 1.82% | 1.81% | | PSU | 1,268 | 1,417 | 1,145 | | 0.41% | 0.41% | 0.42% | | Senior Citizen | 8,149 | 9,915 | 7,981 | | 2.64% | 2.90% | 2.92% | | Others | 9,751 | 13,494 | 10,867 | | 3.16% | 3.95% | 3.98% | | Total | 3,08,630 | 3,41,747 | 2,73,204 | Note: Figures in % indicate percentages share to total complaints
* Includes data pertaining to April 1, 2020 to June 30, 2020 which overlaps with the last quarter of the year, July 1, 2019 to June 30, 2020 |
| Appendix 2.9 – Bank group-wise classification of complaints received during July 1, 2020 to March 31, 2021 | | Bank Group | 2019-20
(Jul - Jun) | 2020-21*
(Apr-Mar) | 2020-21
(Jul - Mar) | % change (Y-o-Y) 2020-21 (Apr-Mar) over 2019-20 (Jul – Jun) | | Nationalized Banks | 92,503 | 100,855 | 82,184 | 9.03% | | 29.97% | 29.51% | 30.08% | | SBI | 91,584 | 74,119 | 57,472 | -19.07% | | 29.67% | 21.69% | 21.04% | | Private Sector Banks | 98,623 | 126,303 | 101,590 | 28.07% | | 31.96% | 36.96% | 37.18% | | Payments and Small Finance Banks | 5227 | 6,918 | 5,603 | 32.35% | | 1.69% | 2.02% | 2.05% | | Foreign Banks | 5,935 | 6,157 | 4,902 | 3.74% | | 1.92% | 1.80% | 1.79% | | RRBs/ Scheduled Primary Urban Co-op. Banks | 6,060 | 6,382 | 4,950 | 5.31% | | 1.96% | 1.87% | 1.81% | | Others | 8,698 | 21,013 | 16,503 | 141.58% | | 2.82% | 6.15% | 6.04% | | Total | 3,08,630 | 3,41,747 | 2,73,204 | | Note: Figures in % indicate percentage share to total complaints
* Includes data pertaining to April 1, 2020 to June 30, 2020 which overlaps with the last quarter of July 1, 2019 to June 30, 2020 |
| Appendix 2.10 – OBO-wise position of complaints disposed during July 1, 2020 to March 31, 2021 | | OBO | Complaints pending at the beginning of the Year | Complaints transferred from CEPCs and Draft Complaints | Complaints received during the Year | Complaints handled | Complaints disposed | Pending at the end of the year | Rate of disposal (%) | | Ahmedabad | 1,096 | 85 | 17,223 | 18,404 | 18,383 | 21 | 99.89% | | Bengaluru | 9,149 | 588 | 13,535 | 23,272 | 21,778 | 1,494 | 93.58% | | Bhopal | 371 | 61 | 12,377 | 12,809 | 12,099 | 710 | 94.46% | | Bhubaneswar | 71 | 37 | 5,678 | 5,786 | 5,635 | 151 | 97.39% | | Chandigarh | 1 | 174 | 28,019 | 28,194 | 28,194 | 0 | 100.00% | | Chennai | 475 | 30 | 16,098 | 16,603 | 16,271 | 332 | 98.00% | | Dehradun | 1,946 | 102 | 6,324 | 8,372 | 8,198 | 174 | 97.92% | | Guwahati | 73 | 11 | 2,678 | 2,762 | 2,742 | 20 | 99.28% | | Hyderabad | 312 | 187 | 17,088 | 17,587 | 17,399 | 188 | 98.93% | | Jaipur | 70 | 256 | 17,636 | 17,962 | 17,090 | 872 | 95.15% | | Jammu | 4 | 17 | 1,368 | 1,389 | 1,388 | 1 | 99.93% | | Kanpur | 3,525 | 128 | 21,169 | 24,822 | 23,028 | 1,794 | 92.77% | | Kolkata | 1,180 | 284 | 11,817 | 13,281 | 12,603 | 678 | 94.89% | | Mumbai-I | 1,774 | 289 | 18,629 | 20,692 | 20,294 | 398 | 98.08% | | Mumbai -II | 1,963 | 657 | 15,215 | 17,835 | 17,577 | 258 | 98.55% | | New Delhi-I | 683 | 786 | 18,767 | 20,236 | 19,704 | 532 | 97.37% | | New Delhi-II | 844 | 402 | 16,057 | 17,303 | 15,848 | 1,455 | 91.59% | | New Delhi - III | 166 | 398 | 8,416 | 8,980 | 8,773 | 207 | 97.69% | | Patna | 567 | 181 | 12,560 | 13,308 | 12,783 | 525 | 96.06% | | Raipur | 38 | 53 | 3,075 | 3,166 | 3,141 | 25 | 99.21% | | Ranchi | 121 | 39 | 3,797 | 3,957 | 3,909 | 48 | 98.79% | | Thiruvananthapuram | 69 | 24 | 5,678 | 5,771 | 5,572 | 199 | 96.55% | | Total | 24,498 | 4,789 | 2,73,204 | 3,02,491 | 2,92,409 | 10,082 | 96.67% |
| Appendix 2.11 – OBO-wise break-up of maintainable complaints disposed during July 1, 2020 to March 31, 2021 | | OBO | No. of maintainable complaints disposed during 2020-21
(Jul – Mar) | | Ahmedabad | 5,295 | | Bengaluru | 16,209 | | Bhopal | 9,754 | | Bhubaneswar | 2,869 | | Chandigarh | 25,674 | | Chennai | 10,664 | | Dehradun | 4,286 | | Guwahati | 1,639 | | Hyderabad | 7,744 | | Jaipur | 10,719 | | Jammu | 1,053 | | Kanpur | 12,327 | | Kolkata | 6,428 | | Mumbai | 10,768 | | Mumbai II | 9,763 | | New Delhi I | 11,577 | | New Delhi II | 9,938 | | New Delhi III | 5,422 | | Patna | 4,221 | | Raipur | 1,438 | | Ranchi | 2,070 | | Thiruvananthapuram | 1,864 | | Grand Total | 1,71,722 |
| Appendix 2.12 - TAT of complaints disposed during July 1, 2020 to March 31, 2021 – category-wise (in days) | | Complaint category | 2019-20
(Jul-Jun) | 2020-21
(Jul-Mar) | | ATM / Debit Cards | 102 | 62 | | Mobile / electronic banking | 95 | 56 | | Non-observance of FPC | 93 | 54 | | Credit Cards | 96 | 50 | | Failure to meet commitments | 74 | 34 | | Levy of charges without prior notice | 89 | 50 | | Loans and advances | 87 | 54 | | Non-adherence to BCSBI Codes | 78 | 88 | | Deposit Accounts related | 96 | 51 | | Pension payments | 95 | 59 | | Remittances | 95 | 59 | | DSAs and recovery agents | 104 | 49 | | Para banking | 89 | 55 | | Notes and Coins | 85 | 36 | | Others | 106 | 59 | | Average | 95 | 55 |
| Appendix 2.13- Age-wise classification of pending complaints as on March 31, 2021 | | Particulars | 2019-20
(Jul - Jun) | 2020-21
(Jul - Mar) | | Complaints pending for less than one month (30 days) | 6,086 | 6,543 | | | 1.90% | 2.16% | | Complaints pending for one to two months | 3,223 | 1,864 | | | 1.00% | 0.62% | | Complaints pending for two to three months | 1,833 | 848 | | | 0.57% | 0.28% | | Complaints pending for more than three months | 13,356 | 827 | | | 4.16% | 0.27% | | Complaints pending at the end of the year as on March 31, 2021 | 24,498 | 10,082 | | | 7.64% | 3.33% | | Total number of complaints handled during the year | 3,20,699 | 3,02,491 | | Note: Figures in % indicate percentage share to total complaints handled |
| Appendix 2.14 Bank-wise maintainable complaints and their mode of disposal, including through passing of Awards during July 1, 2020 to March 31, 2021 | | Bank Name | Number of maintainable complaints disposed during the year 2020-21 (Jul-Mar), including brought forward | Of (2), complaints resolved through conciliation/ mediation/ issuance of advisories6 | Of (2), complaints resolved after passing of Awards | Of (4), no. of Awards unimplemented within the specified time (other than Awards appealed) | | (1) | (2) | (3) | (4) | (5) | | STATE BANK OF INDIA | 38,333 | 29,218 | 7 | 0 | | HDFC BANK LIMITED | 17,371 | 12,628 | 0 | 0 | | PUNJAB NATIONAL BANK | 14,075 | 11,377 | 13 | 0 | | ICICI BANK LIMITED | 13,741 | 8,782 | 0 | 0 | | AXIS BANK LIMITED | 10,232 | 7,291 | 1 | 0 | | BANK OF BARODA | 7,971 | 6,004 | 4 | 0 | | UNION BANK OF INDIA | 6,981 | 5,304 | 7 | 0 | | SBI CARDS | 6,660 | 4,539 | 1 | 0 | | CANARA BANK | 6,090 | 4,468 | 0 | 0 | | KOTAK MAHINDRA BANK LIMITED | 5,778 | 3,526 | 2 | 0 | | RBL BANK LIMITED | 4,829 | 3,709 | 0 | 0 | | BANK OF INDIA | 4,613 | 3,474 | 1 | 0 | | CENTRAL BANK OF INDIA | 4,532 | 3,535 | 3 | 0 | | INDIAN BANK | 3,844 | 2,724 | 1 | 0 | | INDUSIND BANK LIMITED | 3,361 | 2,427 | 0 | 0 | | IDFC BANK LIMITED | 2,002 | 1,554 | 0 | 0 | | IDBI BANK LIMITED | 1,667 | 1,119 | 1 | 0 | | YES BANK LIMITED | 1,659 | 1,177 | 0 | 0 | | UCO BANK | 1,617 | 1,249 | 6 | 0 | | INDIAN OVERSEAS BANK | 1,509 | 984 | 5 | 0 | | STANDARD CHARTERED BANK | 1,509 | 905 | 0 | 0 | | BANK OF MAHARASHTRA | 1,239 | 743 | 2 | 0 | | AIRTEL PAYMENTS BANK LIMITED | 1,178 | 1,016 | 0 | 0 | | PAYTM PAYMENTS BANK LIMITED | 1,045 | 687 | 0 | 0 | | CITIBANK N.A | 852 | 454 | 0 | 0 | | PUNJAB AND SIND BANK | 792 | 710 | 0 | 0 | | FEDERAL BANK LIMITED | 499 | 323 | 0 | 0 | | JAMMU & KASHMIR BANK LIMITED | 470 | 318 | 0 | 0 | | DCB BANK LIMITED | 450 | 338 | 0 | 0 | | KARNATAKA BANK LIMITED | 441 | 290 | 0 | 0 | | KARUR VYSYA BANK LIMITED | 327 | 174 | 0 | 0 | | HONGKONG AND SHANGHAI BANKING CORPN.LIMITED | 313 | 182 | 0 | 0 | | BANDHAN BANK LIMITED | 293 | 201 | 0 | 0 | | DBS BANK INDIA LIMITED | 290 | 166 | 0 | 0 | | AU SMALL FINANCE BANK LIMITED | 286 | 240 | 0 | 0 | | SOUTH INDIAN BANK LIMITED | 225 | 139 | 0 | 0 | | AMERICAN EXPRESS BANKING CORP. | 223 | 131 | 0 | 0 | | TAMILNAD MERCANTILE BANK LIMITED | 181 | 105 | 0 | 0 | | BARODA RAJASTHAN KSHETRIYA GRAMIN BANK | 179 | 156 | 0 | 0 | | CITY UNION BANK LIMITED | 174 | 104 | 0 | 0 | | BARODA UTTAR PRADESH GRAMIN BANK | 146 | 111 | 0 | 0 | | SARASWAT CO-OP.BANK LIMITED | 145 | 64 | 0 | 0 | | JANA SMALL FINANCE BANK LIMITED | 138 | 97 | 0 | 0 | | UTTAR BIHAR GRAMIN BANK | 120 | 99 | 0 | 0 | | SARVA HARYANA GRAMIN BANK | 118 | 98 | 0 | 0 | | EQUITAS SMALL FINANCE BANK LIMITED | 116 | 70 | 0 | 0 | | UJJIVAN SMALL FINANCE BANK LIMITED | 116 | 87 | 0 | 0 | | GRAMIN BANK OF ARYAVART | 115 | 87 | 0 | 0 | | RAJASTHAN MARUDHARA GRAMIN BANK | 107 | 89 | 0 | 0 | | FINO PAYMENTS BANK LIMITED | 102 | 73 | 0 | 0 | | PUNJAB GRAMIN BANK | 101 | 101 | 0 | 0 | | FINCARE SMALL FINANCE BANK LIMITED | 94 | 74 | 0 | 0 | | PRATHAMA BANK | 83 | 69 | 1 | 0 | | MADHYA BIHAR GRAMIN BANK | 82 | 50 | 0 | 0 | | PRAGATHI KRISHNA GRAMIN BANK | 82 | 54 | 0 | 0 | | ANDHRA PRADESH GRAMEENA VIKAS BANK | 79 | 46 | 0 | 0 | | DEUTSCHE BANK AG | 77 | 49 | 0 | 0 | | SARVA U.P. GRAMIN BANK | 70 | 60 | 0 | 0 | | PURVANCHAL BANK | 67 | 53 | 0 | 0 | | KASHI GOMTI SAMYUT GRAMIN BANK | 64 | 53 | 0 | 0 | | KERALA GRAMIN BANK | 62 | 46 | 0 | 0 | | ALLAHABAD UP GRAMIN BANK | 59 | 48 | 0 | 0 | | MAHARASHTRA GRAMIN BANK | 59 | 18 | 0 | 0 | | ABHYUDAYA CO-OP.BANK LIMITEDBOMBAY | 56 | 15 | 0 | 0 | | ANDHRA PRAGATHI GRAMEENA BANK | 55 | 44 | 0 | 0 | | MADHYANCHAL GRAMIN BANK | 53 | 27 | 2 | 0 | | KAVERI GRAMEENA BANK | 51 | 31 | 0 | 0 | | NARMADA JHABUA GRAMIN BANK | 51 | 35 | 0 | 0 | | CATHOLIC SYRIAN BANK LIMITED | 49 | 37 | 0 | 0 | | HIMACHAL PRADESH GRAMIN BANK | 47 | 47 | 0 | 0 | | SVC CO-OP. BANK LIMITED | 46 | 21 | 0 | 0 | | KARNATAKA VIKAS GRAMEENA BANK | 45 | 22 | 0 | 0 | | UTKARSH SMALL FINANCE BANK LIMITED | 41 | 33 | 0 | 0 | | CENTRAL MADHYA PRADESH GRAMIN BANK | 39 | 26 | 0 | 0 | | ASSAM GRAMIN VIKASH BANK | 38 | 32 | 0 | 0 | | COSMOS CO-OPERATIVE BANK LIMITEDPUNE | 38 | 19 | 0 | 0 | | BIHAR GRAMIN BANK | 37 | 24 | 0 | 0 | | NAINITAL BANK LIMITED | 37 | 26 | 0 | 0 | | CHHATTISGARH RAJYA GRAMIN BANK | 36 | 24 | 0 | 0 | | BANGIYA GRAMIN VIKASH BANK | 35 | 35 | 0 | 0 | | UTTARAKHAND GRAMIN BANK | 35 | 27 | 0 | 0 | | INDIA POST PAYMENTS BANK LIMITED | 32 | 23 | 0 | 0 | | DHANLAXMI BANK LIMITED | 30 | 17 | 0 | 0 | | CAPITAL SMALL FINANCE BANK LIMITED | 29 | 29 | 0 | 0 | | ODISHA GRAMYA BANK | 29 | 13 | 0 | 0 | | VIDHARBHA KONKAN GRAMIN BANK | 25 | 13 | 0 | 0 | | PALLAVAN GRAMA BANK | 24 | 13 | 0 | 0 | | ESAF SMALL FINANCE BANK LIMITED | 23 | 18 | 0 | 0 | | NORTH KANARA G.S.B.CO-OP.BANK LIMITED | 23 | 8 | 0 | 0 | | NSDL PAYMENTS BANK LIMITED | 23 | 21 | 2 | 0 | | TRIPURA GRAMIN BANK | 23 | 23 | 0 | 0 | | THANE JANATA SAHAKARI BANK LIMITED | 22 | 4 | 0 | 0 | | JHARKHAND GRAMIN BANK | 21 | 12 | 0 | 0 | | TELANGANA GRAMEENA BANK | 20 | 14 | 0 | 0 | | CHAITANYA GODAVARI GRAMEENA BANK | 19 | 11 | 0 | 0 | | BASSEIN CATHOLIC CO-OP.BANK LIMITED | 17 | 9 | 0 | 0 | | NEW INDIA CO-OP.BANK LIMITED | 17 | 4 | 0 | 0 | | PASCHIM BANGA GRAMIN BANK | 17 | 11 | 0 | 0 | | J & K GRAMEEN BANK | 16 | 8 | 0 | 0 | | PUNJAB AND MAHARASHTRA COOP.BK.LIMITED | 16 | 1 | 0 | 0 | | PANDYAN GRAMA BANK | 15 | 6 | 0 | 0 | | APNA SAHAKARI BANK LIMITED | 14 | 2 | 0 | 0 | | UTTAR BANGA KSHETRIYA GRAMIN BANK | 13 | 13 | 0 | 0 | | BARCLAYS BANK PLC | 11 | 7 | 0 | 0 | | SURYODAY SMALL FINANCE BANK LIMITED | 11 | 7 | 0 | 0 | | DOMBIVALI NAGARI SAHAKARI BANK LIMITED | 10 | 5 | 0 | 0 | | BHARAT CO-OP.BANK LIMITEDBANGALORE | 9 | 2 | 0 | 0 | | BOMBAY MERCANTILE CO-OP.BANK LIMITED | 9 | 4 | 0 | 0 | | GOPINATH PATIL PARSIK JANATA SAHAKARI BANK LIMITED | 9 | 2 | 0 | 0 | | GREATER BOMBAY CO-OP.BANK LIMITED | 8 | 3 | 0 | 0 | | JANATA SAHAKARI BANK LIMITED | 8 | 4 | 0 | 0 | | KALUPUR COMM.CO-OP.BANK LIMITED | 8 | 5 | 0 | 0 | | BARODA GUJARAT GRAMIN BANK | 7 | 6 | 0 | 0 | | JANAKALYAN SAHAKARI BANK LIMITED(BOMBAY) | 7 | 3 | 0 | 0 | | JIO PAYMENTS BANK LIMITED | 7 | 6 | 0 | 0 | | SAPTAGIRI GRAMEENA BANK | 7 | 4 | 0 | 0 | | SURAT PEOPLE'S CO-OP.BANK LIMITED | 7 | 7 | 0 | 0 | | THE KALYAN JANATA SAH.BANK LIMITEDKALYAN | 7 | 0 | 0 | 0 | | VASAI VIKAS SAHAKARI BANK LIMITED | 7 | 1 | 0 | 0 | | RUPEE CO-OP.BANK LIMITED(PUNE) | 6 | 0 | 0 | 0 | | SHINHAN BANK | 6 | 3 | 0 | 0 | | SOLAPUR JANATA SAHAKARI BANK | 6 | 2 | 0 | 0 | | DENA GUJARAT GRAMIN BANK | 5 | 5 | 0 | 0 | | ELLAQUAI DEHATI BANK | 5 | 2 | 0 | 0 | | JALGAON JANATA SAHAKARI BANK LIMITED | 5 | 0 | 0 | 0 | | KARAD URBAN CO-OP.BANK LIMITED | 5 | 2 | 0 | 0 | | NAGAR URBAN CO-OP.BANK LIMITED | 5 | 1 | 0 | 0 | | NAGPUR NAGARIK SAHAKARI BANK LIMITED | 5 | 1 | 0 | 0 | | RAJKOT NAGRIK SAHAKARI BANK LIMITED | 5 | 1 | 0 | 0 | | THE BHARAT CO-OP.BANK (MUMBAI) LIMITED | 5 | 2 | 0 | 0 | | THE JALGAON PEOPLES CO OP. BANK LIMITED | 5 | 3 | 0 | 0 | | THE MAHANAGAR CO-OP.BANK LIMITED MUMBAI | 5 | 3 | 0 | 0 | | UTKAL GRAMEEN BANK | 5 | 3 | 0 | 0 | | CITIZEN CREDIT CO-OP.BANK LIMITEDMUMBAI | 4 | 3 | 0 | 0 | | KALLAPPANNA AWADE ICHALKARANJI JANATA SAHAKARI BANK LIMITED | 4 | 1 | 0 | 0 | | SHIKSHAK SAHAKARI BANK LIMITEDNAGPUR | 4 | 1 | 0 | 0 | | THANE BHARAT SAHAKARI BANK LIMITED | 4 | 2 | 0 | 0 | | THE ROYAL BANK OF SCOTLAND PLC | 4 | 3 | 0 | 0 | | A.P.MAHESH CO-OP.URBAN BANK LIMITED | 3 | 2 | 0 | 0 | | MAHANAGAR Co-Op BANK | 3 | 0 | 0 | 0 | | NASIK MERCHANTS' CO-OP.BANK LIMITED | 3 | 1 | 0 | 0 | | NUTAN NAGRIK SAH.BANK LIMITED(AHMEDABAD) | 3 | 3 | 0 | 0 | | THE AKOLA JANTA COMMERCIAL CO-OP.BANK LT | 3 | 0 | 0 | 0 | | THE KARNATAKA CO-OP.BANK LIMITED MUDDEBIHAL | 3 | 1 | 0 | 0 | | AHMEDABAD MERCANTILE CO-OP.BANK LIMITED | 2 | 2 | 0 | 0 | | BHARATI SAHAKARI BANK LIMITED(POONA) | 2 | 1 | 0 | 0 | | KHAMGAON URBAN CO-OP.BANK LIMITED | 2 | 1 | 0 | 0 | | MEHSANA URBAN CO-OPERATIVE BANK LIMITED | 2 | 2 | 0 | 0 | | MIZORAM RURAL BANK | 2 | 2 | 0 | 0 | | VANANCHAL GRAMIN BANK | 2 | 1 | 0 | 0 | | AKOLA URBAN CO-OP.BANK LIMITED | 1 | 0 | 0 | 0 | | AMANATH CO-OP.BANK LIMITEDBANGALORE | 1 | 0 | 0 | 0 | | BANK OF AMERICA NATIONAL ASSOCIATION | 1 | 1 | 0 | 0 | | BANK OF BAHRAIN & KUWAIT B.S.C. | 1 | 0 | 0 | 0 | | BNP PARIBAS | 1 | 0 | 0 | 0 | | GOA URBAN CO-OP.BANK LIMITED | 1 | 0 | 0 | 0 | | HCBL CO-OPERATIVE BANK LIMITED | 1 | 1 | 0 | 0 | | INDIAN MERCANTILE COOP.BANK LIMITED LUCKNOW | 1 | 0 | 0 | 0 | | JANATA SAHAKARI BANK LIMITED(SATARA) | 1 | 0 | 0 | 0 | | KAPOL CO-OPERATIVE BANK LIMITEDMUMBAI | 1 | 0 | 0 | 0 | | MEGALAYA RURAL BANK | 1 | 1 | 0 | 0 | | NATIONAL AUSTRALIA BANK | 1 | 0 | 0 | 0 | | NORTH EAST SMALL FINANCE BANK LIMITED | 1 | 1 | 0 | 0 | | PARSIK JANATA SAHAKARI BANK LIMITED | 1 | 1 | 0 | 0 | | PRAVARA SAHAKARI BANK LIMITED | 1 | 0 | 0 | 0 | | PUDUVAI BHARATHIAR GRAMA BANK | 1 | 0 | 0 | 0 | | SANGLI URBAN CO-OP.BANK LIMITED | 1 | 0 | 0 | 0 | | ZOROASTRIAN COOPERATIVE BANK LIMITED | 1 | 1 | 0 | 0 | | Others | 159 | 106 | 0 | 0 | | Grand Total | 1,71,722 | 125,097 | 59 | 0 | Appendices pertaining to OSNBFC | Appendix 3.1 - Complaints received by ONBFCOs during July 1, 2020 to March 31, 2021 | | ONBFCO | 2019-20
(Jul – Jun) | 2020-21*
(Apr - Mar) | 2020-21
(Jul - Mar) | Y-o-Y growth % | | Chennai | 3,300 | 7,600 | 5,845 | 130.30% | | 16.98% | 20.57% | 21.68% | | | Delhi | 6,884 | 14,588 | 10,712 | 111.91% | | 35.43% | 39.48% | 39.74% | | | Kolkata | 1,227 | 2,714 | 2,047 | 121.19% | | 6.31% | 7.34% | 7.59% | | | Mumbai | 8,021 | 12,049 | 8,353 | 50.22% | | 41.28% | 32.61% | 30.99% | | | Total | 19,432 | 36,951 | 26,957 | 90.16% | Note: Figures in % indicate percentage share to total complaints received
* Includes data pertaining to April 1, 2020 to June 30, 2020 which overlaps with the last quarter of the year, July 1, 2019 to June 30, 2020 |
| Appendix 3.2 - Cost of handling a complaint ONBFCO-wise during July 1, 2020 to March 31, 2021 | | ONBFCO | Cost of handling (₹/ Complaint) | Total cost
(₹) | | Chennai | 2,107 | 1,44,11,336 | | Kolkata | 3,617 | 82,33,080 | | Mumbai | 1,235 | 1,06,00,000 | | New Delhi | 1,025 | 1,14,10,000 | | Overheads including CMS | 171 | 50,19,530 | | Total | 1,692 | 4,96,73,946 |
| Appendix 3.3 Mode of receipt of complaints at ONBFCOs during July 1, 2020 to March 31, 2021 | | Mode of receipt | No. of complaints received during 2019-20 (Jul – Jun) | No. of complaints received during 2020-21* (Apr - Mar) | No. of complaints received during 2020-21 (Jul - Mar) | | Email | 10,365 | 18,156 | 12,523 | | 53.34% | 49.14% | 46.46% | | Online | 7,737 | 16,999 | 12,724 | | 39.82% | 46.00% | 47.20% | | Post / Fax / Courier / hand delivery | 1,330 | 1,796 | 1,710 | | 6.84% | 4.86% | 6.34% | | Total | 19,432 | 36,951 | 26,957 | Note: Figures in % show percentage to total complaints received
* Includes data pertaining to April 1, 2020 to June 30, 2020 which overlaps with the last quarter of the year, July 1, 2019 to June 30, 2020 |
| Appendix 3.4–Complainant group-wise receipt of complaints at ONBFCOs during July 1, 2020 to March 31, 2021 | | Complainant category | Complaint received | 2019-20
(Jul – Jun) | 2020-21
(Apr - Mar) | 2020-21
(Jul - Mar) | | Individual | 9,943 | 19,250 | 14,098 | | 51.17% | 52.10% | 52.30% | | Individual - Business | 580 | 1,199 | 862 | | 2.98% | 3.24% | 3.20% | | Proprietorship / Partnership | 277 | 598 | 458 | | 1.43% | 1.62% | 1.70% | | Limited Company | 425 | 782 | 587 | | 2.19% | 2.12% | 2.18% | | Trust | 13 | 49 | 41 | | 0.07% | 0.13% | 0.15% | | Association | 7 | 15 | 11 | | 0.04% | 0.04% | 0.04% | | Government Department | 66 | 151 | 117 | | 0.34% | 0.41% | 0.43% | | PSU | 21 | 35 | 30 | | 0.11% | 0.09% | 0.11% | | Senior Citizen | 63 | 115 | 91 | | 0.32% | 0.31% | 0.34% | | Others | 8,037 | 14,757 | 10,662 | | 41.36% | 39.94% | 39.55% | | Total | 19,432 | 36,951 | 26,957 | Note: Figures in % indicate percentage share to total complaints received
* Includes data pertaining to April 1, 2020 to June 30, 2020 which overlaps with the last quarter of the year, July 1, 2019 to June 30, 2020 |
| Appendix 3.5 – ONBFCO-wise position of complaints during July 1, 2020 to March 31, 2021 | | ONBFC-O | Complaints brought forward from previous year | Complaints received | Complaints of 2019-20 (transferred from CEPCs and drafts converted) | Complaints
handled | Complaints
disposed | Pending at the end of the year | Rate of disposal | | Chennai | 222 | 5,845 | 395 | 6,462 | 6,278 | 184 | 97.15% | | Delhi | 426 | 10,712 | 700 | 11,838 | 10,703 | 1,135 | 90.41% | | Kolkata | 8 | 2,047 | 42 | 2,097 | 2,097 | 0 | 100% | | Mumbai | 252 | 8,353 | 349 | 8,954 | 8,954 | 0 | 100% | | Total | 908 | 26,957 | 1,486 | 29,351 | 28,032 | 1,319 | 95.51% |
| Appendix 3.6 – ONBFCO-wise position of maintainable complaints disposed during July 1, 2020 to March 31, 2021 | | ONBFCO | Maintainable complaints disposed | | Chennai | 4,147 | | Delhi | 4,339 | | Kolkata | 1,209 | | Mumbai | 2,137 | | Total | 11,832 |
| Appendix 3.7: Entity-wise list of maintainable complaints disposed during July 1, 2020 to March 31, 2021 | | NBFC Name | Maintainable Complaints | | BAJAJ FINANCE LIMITED | 3,490 | | INDIABULLS CONSUMER FINANCE LIMITED | 827 | | HDB FINANCIAL SERVICES LIMITED | 609 | | DMI FINANCE PRIVATE LIMITED | 534 | | FULLERTON INDIA CREDIT COMPANY LIMITED | 515 | | TATA CAPITAL FINANCIAL SERVICES LIMITED | 446 | | KOTAK MAHINDRA PRIME LIMITED | 398 | | ADITYA BIRLA FINANCE LIMITED | 386 | | CHOLAMANDALAM INVESTMENT AND FINANCE COMPANY LIMITED | 349 | | HOME CREDIT INDIA FINANCE PRIVATE LIMITED | 285 | | SHRIRAM CITY UNION FINANCE LIMITED | 208 | | LENDINGKART FINANCE LIMITED | 193 | | BAJAJ HOLDINGS AND INVESTMENT LIMITED | 188 | | MAHINDRA & MAHINDRA FINANCIAL SERVICES LIMITED | 174 | | MUTHOOT FINANCE LIMITED | 174 | | HERO FINCORP LIMITED | 142 | | INDIA INFOLINE FINANCE LIMITED | 135 | | TVS CREDIT SERVICES LIMITED | 114 | | HINDUJA LEYLAND FINANCE LIMITED | 113 | | BHANIX FINANCE & INVESTMENT LIMITED | 101 | | SMALL BUSINESS FINCREDIT INDIA PRIVATE LIMITED | 97 | | P.C. FINANCIAL SERVICES PRIVATE LIMITED | 88 | | MAGMA FINCORP LIMITED | 87 | | SHRIRAM TRANSPORT FINANCE COMPANY LIMITED | 85 | | MANAPPURAM FINANCE LIMITED | 84 | | L&T FINANCE LIMITED | 79 | | CAPFLOAT FINANCIAL SERVICES PRIVATE LIMITED. | 79 | | INDIABULLS COMMERCIAL CREDIT LIMITED | 75 | | CAPRI GLOBAL CAPITAL LIMITED | 64 | | SI CREVA CAPITAL SERVICES PRIVATE LIMITED | 63 | | ASHISH SECURITIES PRIVATE LIMITED | 60 | | CLIX CAPITAL SERVICES PRIVATE LIMITED | 51 | | TAMILNADU POWER FINANCE AND INFRASTRUCTURE DEVELOPMENT CORPORATION LIMITED | 46 | | ADITYA BIRLA CAPITAL LIMITED | 45 | | NEOGROWTH CREDIT PRIVATE LIMITED | 42 | | BAJAJ FINSERV LIMITED | 41 | | TATA MOTORS FINANCE LIMITED | 39 | | SREI EQUIPMENT FINANCE LIMITED | 38 | | ECL FINANCE LIMITED | 38 | | AVANSE FINANCIAL SERVICES LIMITED | 33 | | HDFC CREDILA FINANCIAL SERVICES PRIVATE LIMITED | 32 | | MANBA FINANCE PRIVATE LIMITED | 29 | | SUNDARAM FINANCE LIMITED | 29 | | VISU LEASING AND FINANCE PRIVATELIMITED | 27 | | ADITYA BIRLA FINANCIAL SERVICES PRIVATE LIMITED | 26 | | BAJAJ FINVEST PRIVATE LIMITED | 25 | | BFL INVESTMENTS & FINANCIAL CONSULTANTS PRIVATE LIMITED | 25 | | RELIANCE COMMERCIAL FINANCE LIMITED | 25 | | TATA MOTORS FINANCE SOLUTIONS LIMITED | 25 | | BOB FINANCIAL SOLUTIONS LIMITED | 24 | | TOYOTA FINANCIAL SERVICES INDIA LIMITED | 22 | | MUTHOOT FINCORP LIMITED | 22 | | EDELWEISS FINANCE & INVESTMENTS LIMITED | 21 | | NISSAN RENAULT FINANCIAL SERVICES INDIA PRIVATE LIMITED | 21 | | DAIMLER FINANCIAL SERVICES INDIA PRIVATE LIMITED | 21 | | L & T FINANCE LIMITED | 20 | | INDIABULLS FINANCE COMPANY PRIVATE LIMITED | 20 | | INDOSTAR CAPITAL FINANCE LIMITED | 19 | | AEON CREDIT SERVICE INDIA PRIVATE LIMITED | 18 | | RELIGARE FINVEST LIMITED | 17 | | CITICORP FINANCE (INDIA) LIMITED | 17 | | EDELWEISS RETAIL FINANCE LIMITED | 16 | | AMBIT FINVEST PRIVATE LIMITED FORMERLY: AMBIT RETAIL FINANCE PRIVATE LIMITED | 16 | | ORIX LEASING &FINANCIAL SERVICES INDIA LIMITED (FORMERELY OAIS AUTO FINANCIAL SERVICES LIMITED | 14 | | FEDBANK FINANCIAL SERVICES LIMITED | 14 | | ANNAPURNA MICROFINANCE PRIVATE LIMITED | 14 | | JALAN CHEMICAL INDUSTRIES (P) LIMITED | 14 | | MUTHOOT CAPITAL SERVICES LIMITED | 14 | | IIFL WEALTH FINANCE LIMITED | 13 | | ESS KAY FINCORP LIMITED | 10 | | RATTANINDIA FINANCE PRIVATE LIMITED | 10 | | VOLKSWAGEN FINANCE PRIVATE LIMITED | 10 | | FORD CREDIT INDIA PRIVATE LIMITED | 10 | | AROHAN FINANCIAL SERVICES PRIVATE LIMITED | 10 | | HINDUJA FINANCE PRIVATE LIMITED | 9 | | AVAIL FINANCIAL SERVICES PRIVATE LIMITED | 9 | | NORTHERN ARC CAPITAL LIMITED | 9 | | BAJAJ LEASING AND FINANCE LIMITED | 9 | | BLUE JAY FINLEASE LIMITED | 9 | | EDELWEISS FINVEST PRIVATE LIMITED | 8 | | FIVE STAR BUSINESS FINANCE LIMITED | 8 | | SHRI RAM FINANCE CORPORATION PRIVATE LIMITED | 8 | | TVS FINANCE AND SERVICES LIMITED | 7 | | ANAND RATHI GLOBAL FINANCE LIMITED FORMERLY: RATHI GLOBAL FINANCE LIMITED | 7 | | BMW INDIA FINANCIAL SERVICES PRIVATE LIMITED | 7 | | KRAZYBEE SERVICES PRIVATE LIMITED | 7 | | MUTHOOT VEHICLE & ASSET FINANCE LIMITED | 7 | | TAMILNADU TRANSPORT DEVELOPMENT FINANCE CORPORATION LIMITED | 7 | | THIRUMENI FINANCE PRIVATE LIMITED | 7 | | BUSSAN AUTO FINANCE INDIA PRIVATE LIMITED | 6 | | KARVY FINANCIAL SERVICES LIMITED | 6 | | J R G FINCORP LIMITED | 6 | | AYE FINANCE PRIVATE LIMITED | 6 | | KOSAMATTAM FINANCE LIMITED | 6 | | SAKTHI FINANCE LIMITED | 6 | | RELIANCE CAPITAL LIMITED | 5 | | OXYZO FINANCIAL SERVICES PRIVATE LIMITED | 5 | | BARCLAYS INVESTMENTS & LOANS (INDIA) LIMITED | 5 | | VERITAS FINANCE PRIVATE LIMITED | 5 | | VISAGE HOLDINGS AND FINANCE PRIVATE LIMITED | 5 | | ASIRVAD MICRO FINANCE LIMITED | 5 | | LOTUS SREE FILCO PRIVATE LIMITED | 5 | | UNITED PETRO FINANCE LIMITED | 5 | | HDFC HOLDINGS LIMITED | 4 | | RELIANCE FINANCIAL LIMITED | 4 | | BERAR FINANCE LIMITED | 4 | | CAPITAL TRUST LIMITED | 4 | | KOGTA FINANCIAL (INDIA) LIMITED | 4 | | RELIANCE COMMERCIAL CO. LIMITED | 4 | | ELECTRONICA FINANCE LIMITED | 4 | | SIDVIK LEASING PRIVATE LIMITED | 4 | | IKF FINANCE LIMITED | 4 | | INDIAN SCHOOL FINANCE COMPANY PRIVATE LIMITED | 4 | | JUMBO FINVEST (INDIA) LIMITED | 4 | | LAXMI INDIA FINLEASECAP PRIVATE LIMITED | 4 | | MONEYWISE FINANCIAL SERVICES PRIVATE LIMITED | 4 | | MUTHOOT MICROFIN LIMITED | 4 | | VISTAAR FINANCIAL SERVICES P LIMITED | 4 | | VISTAR FINANCIERS (P) LIMITED | 4 | | FINOVA CAPITAL PRIVATE LIMITED | 4 | | THE PEERLESS GENERAL FINANCE & INVESTMENT COMPANY LIMITED | 4 | | SAVERY TRANSPORT FINANCE LIMITED | 4 | | CLIX FINANCE INDIA PRIVATE LIMITED | 3 | | ALTICO CAPITAL INDIA LIMITED(ALTICO CAPITAL INDIA PRIVATE LIMITED ) | 3 | | AUXILO FINSERVE PRIVATE LIMITED | 3 | | INDITRADE MICROFINANCE LIMITED | 3 | | BAJAJ AUTO HOLDINGS LIMITED | 3 | | L&T INFRASTRUCTURE FINANCE COMPANY LIMITED | 3 | | TATA FINANCE LIMITED | 3 | | BELL FINVEST (INDIA) LIMITED | 3 | | FORTUNE INTEGRATED ASSETS FINANCE LIMITED | 3 | | MADURA MICRO FINANCE LIMITED | 3 | | SUSTAINABLE AGRO-COMMERCIAL FINANCE LIMITED | 3 | | UAE EXCHANGE & FINANCIAL SERVICES LIMITED | 3 | | MUTHOOTTU MINI FINANCIERS LIMITED | 3 | | ORANGE RETAIL FINANCE INDIA PRIVATE LIMITED | 3 | | CSL FINANCE LIMITED | 3 | | KANAKADURGA FINANCE LIMITED | 3 | | IDFC LIMITED | 2 | | MOTILAL OSWAL FINANCIAL SERVICES LIMITED | 2 | | EPIMONEY PRIVATE LIMITED | 2 | | AXIS FINANCE LIMITED | 2 | | MAHINDRA HOLDINGS & FINANCE LIMITED | 2 | | ADANI CAPITAL PRIVATE LIMITED | 2 | | SIEMENS FINANCIAL SERVICES PRIVATE LIMITED | 2 | | SPANDANA SPHOORTY FINANCIAL LIMITED | 2 | | SREI INFRASTRUCTURE FINANCE LIMITED | 2 | | BHARAT FINANCIAL INCLUSION LIMITED | 2 | | LOTUS CAPITAL FINANCIAL SERVICES LIMITED | 2 | | NIYOGIN FINTECH LIMITED | 2 | | RELIGARE ENTERPRISES LIMITED | 2 | | VEDIKA CREDIT CAPITAL LIMITED | 2 | | AKME FINTRADE (INDIA) LIMITED | 2 | | BAID LEASING & FINANCE CO. LIMITED | 2 | | JOHN DEERE FINANCIAL INDIA PRIVATE LIMITED | 2 | | BALAJI INSTALMENTS LIMITED | 2 | | KOTAK MAHINDRA FINANCE LIMITED | 2 | | MAXVALUE CREDITS & INVESTMENTS (P) LIMITED | 2 | | SEYAD SHARIAT FINANCE LIMITED | 2 | | ARIS CAPITAL PRIVATE LIMITED | 2 | | CANBANK FACTORS LIMITED | 2 | | CHOLA FINANCE LIMITED | 2 | | MANAPPURAM ASSET FINANCE LIMITED | 2 | | RELIGARE FINANCE LIMITED | 2 | | YOGAKSHEMAM LOANS LIMITED | 2 | | SAIJA FINANCE PRIVATE LIMITED | 2 | | HDFC INVESTMENTS LIMITED | 1 | | AKARA CAPITAL ADVISORS PRIVATE LIMITED | 1 | | INTEC CAPITAL LIMITED | 1 | | DEWAN MOTORS INVESTMENT & FINANCE LIMITED | 1 | | PAISALO DIGITAL LIMITED | 1 | | SATIN CREDITCARE NETWORK LIMITED | 1 | | CAPITAL INDIA FINANCE LIMITED | 1 | | CAPITAL FIRST LIMITED | 1 | | CITICORP FINANCE (INDIA) LIMITED | 1 | | PUNJAB KASHMIR FINANCE LIMITED | 1 | | ASHISH FISCAL SERVICES PRIVATE LIMITED | 1 | | ICL FINCORP LIMITED | 1 | | INDIABULLS FINANCIAL SERVICES LIMITED | 1 | | SHRI RAM G FINANCIAL SERVICES LIMITED | 1 | | UP MONEY LIMITED | 1 | | A K CAPITAL FINANCE PRIVATE LIMITED | 1 | | JUMBO FINANCE LIMITED | 1 | | RELIANCE COMMERCIAL FINANCE PRIVATE LIMITED | 1 | | CREDITACCESS GRAMEEN LIMITED | 1 | | FEDBANK FINANCIAL SERVICES LIMITED | 1 | | POOJA FINLEASE LIMITED | 1 | | APOLLO TRADING AND FINANCE PRIVATE LIMITED | 1 | | CENTRUM FINANCIAL SERVICES LIMITED | 1 | | KLM AXIVA FINVEST LIMITED | 1 | | MUTHOOT MONEY PRIVATE LIMITED | 1 | | NEWLINK OVERSEAS FINANCE LIMITED | 1 | | POONAWALLA FINANCE PRIVATE LIMITED | 1 | | ADVENTZ FINANCE PRIVATE LIMITED | 1 | | APTUS FINANCE INDIA PRIVATE LIMITED | 1 | | CAPARO FINANCIAL SOLUTIONS LIMITED | 1 | | CHAITANYA RURAL INTERMEDIATION DEVELOPMENT SERVICES PRIVATE LIMITED | 1 | | EQUITAS HOLDINGS LIMITED | 1 | | GEO VPL FINANCE PRIVATELIMITED . | 1 | | IFCI FACTORS LIMITED | 1 | | IFCI VENTURE CAPITAL FUNDS LIMITED | 1 | | INFINITY FINCORP SOLUTIONS PRIVATE LIMITED | 1 | | JM FINANCIAL CREDIT SOLUTIONS LIMITED | 1 | | MOUNT INTRA FINANCE PRIVATE LIMITED | 1 | | NAMDEV FINVEST PRIVATE LIMITED | 1 | | POONAWALLA CREDIT PRIVATE LIMITED | 1 | | REPCO MICRO FINANCE LIMITED | 1 | | S M L FINANCE LIMITED | 1 | | SAMASTA MICROFINANCE LIMITED | 1 | | SHAREKHAN BNP PARIBAS FINANCIAL SERVICES P LIMITED | 1 | | SUBHAM CAPITAL PRIVATE LIMITED | 1 | | SUNDRAM FASTENERS INVESTMENTS LIMITED | 1 | | APOLLO FINVEST (INDIA) LIMITED | 1 | | ASHV FINANCE LIMITED | 1 | | BAJAJ HOLDINGS & INVESTMENT LIMITED | 1 | | BALANCEHERO INDIA PRIVATE LIMITED | 1 | | BSS MICROFINANCE PRIVATE LIMITED | 1 | | C MAHENDRA CAPITAL LIMITED | 1 | | CHAITANYA INDIA FIN CREDIT PRIVATE LIMITED | 1 | | CHOKHANI SECURITIES LIMITED | 1 | | ESSEL FINANCE BUSINESS LOANS LIMITED | 1 | | GLOBE FINCAP LIMITED | 1 | | GOVE FINANCE LIMITED | 1 | | INDO ASIA FINANCE LIMITED | 1 | | INTELLECASH MICROFINANCE NETWORK COMPANY PRIVATE LIMITED | 1 | | JM FINANCIAL PRODUCTS LIMITED | 1 | | KOTAK MAHINDRA CAPITAL CO. | 1 | | L & T INFRA DEBT FUND LIMITED | 1 | | M POWER MICRO FINANCE PRIVATE LIMITED | 1 | | MEGA ASSETS & CAPITAL MANAGEMENT P LIMITED | 1 | | NAHAR CAPITAL AND FINANCIAL SERVICES LIMITED(NDSI) | 1 | | NEOWORTH COMMERCIAL PRIVATE LIMITED | 1 | | PAYU PAYMENTS PRIVATE LIMITED | 1 | | PCR INVESTMENTS LIMITED | 1 | | PUNJAB STATE INDUSTRIAL DEVELOPMENT CORP. LIMITED | 1 | | SURYODAY MICRO FINANCE LIMITED | 1 | | TATA CAPITAL LIMITED (CIC) | 1 | | TOURISM FINANCE CORPORATION OF INDIA LIMITED | 1 | | VOLVO FINANCIAL SERVICES (INDIA) PRIVATE LIMITED | 1 | | WHEELSEMI PRIVATE LIMITED | 1 | | B R D SECURITIES LIMITED | 1 | | CHEMMANUR CREDITS AND INVESTMENTS LIMITED | 1 | | DIGAMBER CAPFIN LIMITED | 1 | | KERALA TRANSPORT DEVELOPMENT FINANCE CORPORATION LIMITED | 1 | | ONE CAPITALL LIMITED FORMERLY: ONE CAPITALL PRIVATE LIMITED | 1 | | P C COMBINES PRIVATE LIMITED | 1 | | PEERLESS FINANCIAL SERVICES LIMITED | 1 | | KINARA FINANCIAL PRIVATE LIMITED | 1 | | S.B.S. FINANCE LIMITED | 1 | | OTHERS | 110 | | TOTAL | 11,832 | Appendices pertaining to OSDT | Appendix 4.1: Office-wise receipt of Complaints by OODTs during July 1, 2020 to March 31, 2021 | | Name of the ODT | Complaints received during | % change in 2020-21 (Apr-Mar) over 2019-20 (Jul – Jun) | % to total complaints 2020-21 (Jul-Mar) | 2019-20
(Jul - Jun) | 2020-21*
(Apr - Mar) | 2020-21
(Jul - Mar) | | Ahmedabad | 74 | 133 | 112 | 79.73% | 3.80% | | Bengaluru | 222 | 293 | 242 | 31.98% | 8.21% | | Bhopal | 167 | 305 | 259 | 82.63% | 8.79% | | Bhubaneswar | 75 | 137 | 114 | 82.67% | 3.87% | | Chandigarh | 108 | 131 | 93 | 21.30% | 3.16% | | Chennai | 133 | 149 | 124 | 12.03% | 4.21% | | Dehradun | 55 | 51 | 33 | -7.27% | 1.12% | | Guwahati | 20 | 50 | 43 | 150.00% | 1.46% | | Hyderabad | 196 | 263 | 225 | 34.18% | 7.64% | | Jaipur | 141 | 235 | 207 | 66.67% | 7.03% | | Jammu | 8 | 23 | 21 | 187.50% | 0.71% | | Kanpur | 131 | 221 | 173 | 68.70% | 5.87% | | Kolkata | 220 | 239 | 176 | 8.64% | 5.97% | | Mumbai I | 176 | 211 | 173 | 19.89% | 5.87% | | Mumbai II | 217 | 346 | 292 | 59.45% | 9.91% | | New Delhi I | 142 | 281 | 245 | 97.89% | 8.32% | | New Delhi II | 128 | 129 | 104 | 0.78% | 3.53% | | New Delhi III | 55 | 80 | 62 | 45.45% | 2.10% | | Patna | 122 | 203 | 162 | 66.39% | 5.50% | | Raipur | 23 | 54 | 44 | 134.78% | 1.49% | | Ranchi | 41 | 41 | 30 | 0.00% | 1.02% | | Thiruvananthapuram | 27 | 19 | 12 | -29.63% | 0.41% | | Grand Total | 2,481 | 3,594 | 2,946 | 44.86% | 100% | | * Includes data pertaining to April 1, 2020 to June 30, 2020 which overlaps with the last quarter of the year, July 1, 2019 to June 30, 2020 |
| Appendix 4.2 - Mode of receipt of complaints by OODTs during July 1, 2020 to March 31, 2021 | | Mode of receipt | No. of complaints received during | 2019-20
(Jul – Jun) | 2020-21*
(Apr - Mar) | 2020-21
(Jul - Mar) | | Email | 227 | 260 | 188 | | 9.15% | 7.23% | 6.38% | | Online | 2,239 | 3,331 | 2,755 | | 90.25% | 92.68% | 93.52% | | Post/ Fax/ Courier/ Hand delivery | 15 | 3 | 3 | | 0.60% | 0.08% | 0.10% | | Total | 2,481 | 3,594 | 2,946 | Note: Figures in % indicate percentage to total complaints received
* Includes data pertaining to April 1, 2020 to June 30, 2020 which overlaps with the last quarter of the year July 1, 2019 to June 30, 2020 |
| Appendix 4.3 – Zone-wise receipt of OODT complaints during July 1, 2020 to March 31, 2021 | | OODT | 2019-20
(Jul – Jun) | 2020-21*
(Apr-Mar) | 2020-21
(Jul-Mar) | % change in 2020-21*
(Apr-Mar) | | East Zone | | Bhubaneshwar | 75 | 137 | 114 | 82.67% | | Guwahati | 20 | 50 | 43 | 150.00% | | Kolkata | 220 | 239 | 176 | 8.64% | | Patna | 122 | 203 | 162 | 66.39% | | Ranchi | 41 | 41 | 30 | 0.00% | | % share to all India | 19.27% | 18.64% | 17.82% | | | Total | 478 | 670 | 525 | 40.17% | | North Zone | | Chandigarh | 108 | 131 | 93 | 21.30% | | Dehradun | 55 | 51 | 33 | -7.27% | | Jaipur | 141 | 235 | 207 | 66.67% | | Jammu | 8 | 23 | 21 | 187.50% | | Kanpur | 131 | 221 | 173 | 68.70% | | New Delhi-I | 142 | 281 | 245 | 97.89% | | New Delhi-II | 128 | 129 | 104 | 0.78% | | New Delhi-III | 55 | 80 | 62 | 45.45% | | % share to all India | 30.96% | 32.03% | 31.84% | | | Total | 768 | 1,151 | 938 | 49.87% | | South Zone | | Bengaluru | 222 | 293 | 242 | 31.98% | | Chennai | 133 | 149 | 124 | 12.03% | | Hyderabad | 196 | 263 | 225 | 34.18% | | Thiruvananthapuram | 27 | 19 | 12 | -29.63% | | % share to all India | 23.30% | 20.14% | 20.47% | | | Total | 578 | 724 | 603 | 25.26% | | West Zone | | Ahmedabad | 74 | 133 | 112 | 79.73% | | Bhopal | 167 | 305 | 259 | 82.63% | | Mumbai-I | 176 | 211 | 173 | 19.89% | | Mumbai-II | 217 | 346 | 292 | 59.45% | | Raipur | 23 | 54 | 44 | 134.78% | | % share to all India | 26.48% | 29.19% | 29.87% | | | Total | 657 | 1,049 | 880 | 59.67% | | * Includes data pertaining to April 1, 2020 to June 30, 2020 which overlaps with the last quarter of July 1, 2019 to June 30, 2020 |
| Appendix 4.4 – Complainant group-wise receipt of complaints at OODTs during July 1, 2020 to March 31, 2021 | | Complainant Category | Complaints Received | 2019-20
(Jul- Jun) | 2020-21* (Apr- Mar) | 2020-21 (Jul - Mar) | | Individual | 1,916 | 2,741 | 2,261 | | 77.23% | 76.27% | 76.75% | | Individual-Business | 109 | 136 | 110 | | 4.39% | 3.78% | 3.73% | | Limited Company | 83 | 116 | 85 | | 3.35% | 3.23% | 2.89% | | Government Department | 39 | 77 | 66 | | 1.57% | 2.14% | 2.24% | | Proprietorship Partnership | 20 | 29 | 24 | | 0.81% | 0.81% | 0.81% | | Senior Citizen | 25 | 31 | 24 | | 1.01% | 0.86% | 0.81% | | PSU | 8 | 23 | 22 | | 0.32% | 0.64% | 0.75% | | Trust | 5 | 9 | 6 | | 0.20% | 0.25% | 0.20% | | Association | 3 | 4 | 3 | | 0.12% | 0.11% | 0.10% | | Others | 273 | 428 | 345 | | 11.00% | 11.91% | 11.71% | | Grand Total | 2,481 | 3,594 | 2,946 | Note: Figures in % indicate percentage to total complaints received.
* Includes data pertaining to April 1, 2020 to June 30, 2020 which overlaps with the last quarter of July 1, 2019 to June 30, 2020 |
| Appendix 4.5 Office-wise receipt and disposal of complaints received at OODTs during July 1, 2020 to March 31, 2021 | | Name of the ODT | Complaints pending at the beginning of the year | Complaints of 2019-20 (transferred from CEPCs and drafts converted) | Complaints received during the year (Jul-Mar) | Complaints handled | Complaints disposed | Pending at the end of the year | Rate of disposal (%) | | Ahmedabad | 0 | 1 | 112 | 113 | 113 | 0 | 100.00 | | Bengaluru | 174 | 10 | 242 | 426 | 406 | 20 | 95.31 | | Bhopal | 3 | 3 | 259 | 265 | 262 | 3 | 98.87 | | Bhubaneswar | 0 | 1 | 114 | 115 | 115 | 0 | 100.00 | | Chandigarh | 0 | 2 | 93 | 95 | 95 | 0 | 100.00 | | Chennai | 0 | 0 | 124 | 124 | 124 | 0 | 100.00 | | Dehradun | 23 | 0 | 33 | 56 | 53 | 3 | 94.64 | | Guwahati | 0 | 0 | 43 | 43 | 43 | 0 | 100.00 | | Hyderabad | 0 | 0 | 225 | 225 | 225 | 0 | 100.00 | | Jaipur | 0 | 0 | 207 | 207 | 207 | 0 | 100.00 | | Jammu | 0 | 0 | 21 | 21 | 21 | 0 | 100.00 | | Kanpur | 1 | 1 | 173 | 175 | 174 | 1 | 99.43 | | Kolkata | 0 | 0 | 176 | 176 | 176 | 0 | 100.00 | | Mumbai I | 23 | 4 | 173 | 200 | 200 | 0 | 100.00 | | Mumbai II | 3 | 0 | 292 | 295 | 295 | 0 | 100.00 | | New Delhi I | 0 | 3 | 245 | 248 | 248 | 0 | 100.00 | | New Delhi II | 0 | 1 | 104 | 105 | 105 | 0 | 100.00 | | New Delhi III | 0 | 1 | 62 | 63 | 63 | 0 | 100.00 | | Patna | 0 | 0 | 162 | 162 | 161 | 1 | 99.38 | | Raipur | 3 | 0 | 44 | 47 | 47 | 0 | 100.00 | | Ranchi | 0 | 0 | 30 | 30 | 30 | 0 | 100.00 | | Thiruvananthapuram | 0 | 0 | 12 | 12 | 12 | 0 | 100.00 | | Grand Total | 230 | 27 | 2,946 | 3,203 | 3,175 | 28 | 99.13 |
| Appendix 4.6 - OODT-wise distribution of maintainable complaints disposed during July 1, 2020 to March 31, 2021 | | Name of the ODT | No. of maintainable complaints disposed in 2020-21 (Jul – Mar) | | Ahmedabad | 39 | | Bengaluru | 280 | | Bhopal | 214 | | Bhubaneswar | 43 | | Chandigarh | 88 | | Chennai | 59 | | Dehradun | 29 | | Guwahati | 20 | | Hyderabad | 29 | | Jaipur | 181 | | Jammu | 17 | | Kanpur | 61 | | Kolkata | 28 | | Mumbai I | 103 | | Mumbai II | 84 | | New Delhi I | 135 | | New Delhi II | 24 | | New Delhi III | 35 | | Patna | 46 | | Raipur | 10 | | Ranchi | 8 | | Thiruvananthapuram | 5 | | Grand Total | 1,538 |
| Appendix 4.7: System Participant-wise distribution of maintainable complaints disposed during July 1, 2020 to March 31, 2021 | | Name of the System Participant | No. of maintainable complaints | | AIRCEL SMART MONEY LIMITED | 2 | | AMAZON PAY (INDIA) PRIVATE LIMITED | 190 | | APPNIT TECHNOLOGIES PRIVATE LIMITED | 7 | | AVENUES INDIA PRIVATE LIMITED | 9 | | BALANCEHERO INDIA PRIVATE LIMITED | 4 | | CARD PRO SOLUTIONS PRIVATE LIMITED | 4 | | CSC E – GOVERNANCE SERVICES INDIA LIMITED | 14 | | DELHI METRO RAIL CORPORATION LIMITED | 1 | | DIGITSECURE INDIA PRIVATE LIMITED | 2 | | EDENRED (INDIA) PRIVATE LIMITED – NEE ACCOR SERVICES PRIVATE LIMITED | 2 | | EKO INDIA FINANCIAL SERVICES PRIVATE LIMITED | 1 | | EURONET SERVICES INDIA PRIVATE LIMITED | 7 | | GI TECHNOLOGY PRIVATE LIMITED | 2 | | INCASHME MOBILE WALLET SERVICES PRIVATE LIMITED | 1 | | INDIA TRANSACT SERVICES LIMITED | 1 | | INDIAIDEAS. COM LIMITED | 6 | | ITZ CASH CARD LIMITED | 5 | | MY MOBILE PAYMENTS LIMITED | 2 | | ONE MOBIKWIK SYSTEMS PRIVATE LIMITED | 172 | | OXIGEN SERVICES (INDIA) PRIVATE LIMITED | 9 | | PAY POINT INDIA NETWORK PRIVATE LIMITED | 4 | | PAYU PAYMENTS PRIVATE LIMITED | 83 | | PHONEPE PRIVATE LIMITED | 853 | | PINE LABS PRIVATE LIMITED | 11 | | QWIKCILVER SOLUTIONS PRIVATE LIMITED | 3 | | RAPIPAY FINTECH PRIVATE LIMITED | 1 | | SMART PAYMENT SOLUTIONS PRIVATE LIMITED | 2 | | SODEXO SVC INDIA PRIVATE LIMITED | 2 | | SPICE DIGITAL LIMITED | 6 | | TECHPROCESS PAYMENT SERVICES LIMITED | 5 | | TRANSACTION ANALYSTS (INDIA) PRIVATE LIMITED | 2 | | TRANSERV PRIVATE LIMITED | 8 | | VODAFONE M-PESA LIMITED | 1 | | ZIPCASH CARD SERVICES PRIVATE LIMITED | 17 | | OTHERS | 99 | | Grand Total | 1,538 |
| Appendix 4.8: Position of complaints pending as on March 31, 2021 at OODTs | | Age | No. of complaints | | 1 month | 18 | | 0.56% | | 1-2 months | 3 | | 0.09% | | 2-3 months | 2 | | 0.06% | | More than 3 months | 5 | | 0.16% | | Total pending | 28 | | 0.87% | | Complaints handled | 3,203 | | Note: Figures in % indicate percentage to complaints handled |
| Appendix 5.1 - Position of complaints received through CPGRAMS during July 1, 2020 to March 31, 2021 | | Name of the OBO | 2019-20
(Jul – Jun) | 2020-21
(Jul – Mar) | | Ahmedabad | 68 | 86 | | Bengaluru | 52 | 88 | | Bhopal | 31 | 42 | | Bhubaneswar | 40 | 17 | | Chandigarh | 31 | 49 | | Chennai | 438 | 765* | | Dehradun | 18 | 24 | | Guwahati | 10 | 15 | | Hyderabad | 31 | 43 | | Jaipur | 58 | 45 | | Jammu | 2 | 2 | | Kanpur | 11 | 108 | | Kolkata | 40 | 501* | | Mumbai-I | 82 | 121 | | Mumbai-II | 166 | 99 | | New Delhi-I | 129 | 109 | | New Delhi-II | 225 | 62 | | New Delhi-III | 14 | 46 | | Patna | 51 | 29 | | Raipur | 2 | 6 | | Ranchi | 7 | 14 | | Thiruvananthapuram | 9 | 23 | | Total (A) | 1,515 | 2,294 |
| Name of the NBFCO | 2020-21 | | Mumbai | 829 | | New Delhi | 1,199 | | Total (B) | 2,028 | | Grand Total (A) + (B) | 4,322 | | * Figures for OBO, Chennai and OBO, Kolkata includes complaints forwarded to NBFCO, Chennai and NBFCO, Kolkata respectively. NBFCO, Mumbai and NBFCO, New Delhi are separate subordinate offices on CPGRAMS portal. |
| Appendix 5.2 - Applications received by OBOs under RTI Act, 2005 during July 1, 2020 to March 31, 2021 | | Name of the OBO | 2019-20
(Jul – Jun) | 2020-21
(Jul – Mar) | | Ahmedabad | 28 | 16 | | Bengaluru | 49 | 47 | | Bhopal | 15 | 24 | | Bhubaneswar | 18 | 18 | | Chandigarh | 175 | 133 | | Chennai | 103 | 58 | | Dehradun | 40 | 37 | | Guwahati | 9 | 13 | | Hyderabad | 80 | 26 | | Jaipur | 99 | 97 | | Jammu | 1 | 3 | | Kanpur | 159 | 159 | | Kolkata | 46 | 58 | | Mumbai-I | 106 | 88 | | Mumbai-II | 83 | 69 | | New Delhi-I | 148 | 79 | | New Delhi-II | 117 | 85 | | New Delhi-III | 33 | 35 | | Patna | 90 | 68 | | Raipur | 9 | 7 | | Ranchi | 22 | 6 | | Thiruvananthapuram | 6 | 10 | | Total (A) | 1,436 | 1,136 |
| Name of the NBFCO | 2020-21 | | Chennai | 23 | | Kolkata | 3 | | Mumbai | 20 | | New Delhi | 53 | | Total (B) | 99 |
| Name of the OODT | 2020-21 | | Bhopal | 1 | | Hyderabad | 1 | | Kanpur | 4 | | Kolkata | 1 | | Mumbai - II | 1 | | Total (C) | 8 | | Grand Total (A) + (B) + (C) | 1,243 |
| Appendix 6.1 Important notifications relating to Customer Service issued by the RBI during July 1, 2020 to March 31, 2021 | | July 1, 2020 | Master Circular – Facility for Exchange of Notes and Coins (RBI/2020-21/07 DCM (NE) No.G-3/08.07.18/2020-21): The Master Circular has inter alia mandated all branches of banks in all parts of the country to issue fresh / good quality notes and coins of all denominations on demand to the members of public so that there is no need for them to approach the RBI Regional Offices for this purpose, exchange soiled / mutilated / defective notes and accept coins and notes either for transactions or exchange. All branches should provide the aforementioned facilities to members of public without any discrimination on all working days. The availability of the said facilities at the bank branches should be given wide publicity for information of the public at large. None of the bank branches should refuse to accept small denomination notes and / or coins tendered at their counters. | | July 1, 2020 | Master Circular – Scheme of Penalties for bank branches based on performance in rendering customer service to the members of public (RBI/2020-21/08 DCM (CC) No.G-1/03.44.01/2020-21): The Scheme of Penalties for bank branches including currency chests has been formulated in order to ensure that all bank branches provide better customer service to members of public with regard to exchange of notes and coins, in keeping with the objectives of Clean Note Policy. Penalties may be imposed on banks for deficiencies in exchange of notes and coins/ remittances sent to RBI/ operations of currency chests etc. | | July 16, 2020 | Fair Practices Code for Asset Reconstruction Companies (RBI/2020-21/13 DOR.NBFC(ARC) CC. No. 9/26.03.001/2020-21): Asset Reconstruction Companies (ARCs) registered with the Bank were advised to adopt ‘Fair Practices Code’ so as to ensure transparency and fairness in their operation. In the matter of recovery of loans, ARCs shall not resort to harassment of the debtor. ARCs shall ensure that the staff are adequately trained to deal with customers in an appropriate manner. ARCs shall put in place a Board approved Code of Conduct for Recovery Agents and obtain their undertaking to abide by that Code. ARCs, as principals, are responsible for the actions of their Recovery Agents. It is essential that the Recovery Agents observe strict customer confidentiality. ARCs shall ensure that Recovery Agents are properly trained to handle their responsibilities with care and sensitivity, particularly in respect of aspects such as hours of calling, privacy of customer information, etc. They should ensure that Recovery Agents do not induce adoption of uncivilized, unlawful and questionable behaviour or recovery process. ARCs should constitute Grievance Redressal machinery within the organisation. The name and contact number of designated grievance redressal officer of the ARC should be mentioned in the communication with the borrowers. The designated officer should ensure that genuine grievances are redressed promptly. ARCs' Grievance Redressal machinery will also deal with the issue relating to services provided by the outsourced agency and recovery agents, if any. | | August 6, 2020 | Online Dispute Resolution (ODR) System for Digital Payments (RBI/2020-21/21 DPSS.CO.PD No.116/02.12.004/2020-21): Reserve Bank of India (RBI) had announced introduction of Online Dispute Resolution (ODR) system for resolving customer disputes and grievances pertaining to digital payments, using a system-driven and rule-based mechanism with zero or minimal manual intervention. The Payment System Vision-2021 of Reserve Bank highlights the need for technology-driven, rule-based, customer-friendly and transparent dispute redressal systems. As a step in this direction, authorised Payment System Operators (PSOs) – banks and non-banks – and their participants were advised to put in place system/s for ODR for resolving disputes and grievances of customers. To begin with, authorised PSOs were required to implement an ODR system for disputes and grievances related to failed transactions in their respective payment systems by January 1, 2021. The PSOs shall provide access to such a system to its participating members i.e., Payment System Participants (PSPs). Any entity setting up a payment system in India thereafter or participating therein, shall make available the ODR system at the commencement of its operations. Based on experience gained, ODR arrangement would later be extended to cover disputes and grievances other than those related to failed transactions. Please note that if the grievance remains unresolved up to one month, the customer may approach the respective ombudsman. | | August 6, 2020 | Offline Retail Payments using Cards / Wallets / Mobile Devices – Pilot (RBI/2020-21/22 DPSS.CO.PD.No.115/02.14.003/2020-21): Reserve Bank has prioritised security measures for digital payments such as the requirement of Additional Factor of Authentication and online alerts for every transaction. These measures have significantly increased customer confidence and safety leading to increased adoption of digital payments. Absence of, or erratic, internet connectivity, especially in remote areas, is a major impediment for adoption of digital payments. Availability of options to make offline payments, using cards, wallets or mobile devices could boost the adoption of digital payments. To encourage technological innovations that enable offline digital transactions, Reserve Bank has permitted a pilot scheme to be conducted for a limited period. Under the pilot scheme, authorised Payment System Operators (PSOs) – banks and non-banks – will be able to provide offline payment solutions using cards, wallets or mobile devices for remote or proximity payments. The pilot scheme shall be undertaken till March 31, 2021 only. The Reserve Bank shall decide on formalising such a system based on the experience gained under the pilot. | | September 25, 2020 | Positive Pay System for Cheque Truncation System (RBI/2020-21/41 DPSS.CO.RPPD.No.309/04.07.005/2020-21): The concept of Positive Pay involves a process of reconfirming key details of large value cheques. Under this process, the issuer of the cheque submits electronically, through channels like SMS, mobile app, internet banking, ATM, etc., certain minimum details of that cheque (like date, name of the beneficiary / payee, amount, etc.) to the drawee bank, details of which are cross checked with the presented cheque by CTS. Any discrepancy is flagged by CTS to the drawee bank and presenting bank, who would take redressal measures. National Payments Corporation of India (NPCI) shall develop the facility of Positive Pay in CTS and make it available to participant banks. Banks, in turn, shall enable it for all account holders issuing cheques for amounts of ₹50,000 and above. While availing of this facility is at the discretion of the account holder, banks may consider making it mandatory in case of cheques for amounts of ₹5,00,000 and above. Only those cheques which are compliant with above instructions will be accepted under dispute resolution mechanism at the CTS grids. Member banks may implement similar arrangements for cheques cleared / collected outside CTS as well. Banks were advised to create adequate awareness among their customers on features of Positive Pay System through SMS alerts, display in branches, ATMs as well as through their web-site and internet banking. Positive Pay System shall be implemented from January 01, 2021. | | October 22, 2020 | Digital Payment Transactions – Streamlining QR Code infrastructure (RBI/2020-21/59 DPSS.CO.PD.No.497/02.14.003/2020-21): Reserve Bank had constituted a Committee (Chairperson: Prof Deepak Phatak) to review the current system of Quick Response (QR) Codes in India and suggest measures for moving towards interoperable QR Codes. After examining the recommendations and the feedback received, it has been decided that Payment System Operators (PSOs) that use proprietary QR codes shall shift to one or more interoperable QR codes; the process of migration shall be completed by March 31, 2022. PSOs may take initiative to increase awareness about interoperable QR codes. The above measure is expected to reinforce the acceptance infrastructure, provide better user convenience due to interoperability and enhance system efficiency. | | December 4, 2020 | 24x7 Availability of Real Time Gross Settlement (RTGS) System (RBI/2020-21/70 DPSS (CO) RTGS No.750/04.04.016/2020-21): Reserve Bank of India (RBI) on October 09, 2020 had announced making available the Real Time Gross Settlement (RTGS) system round the clock on all days. Accordingly, it has been decided to make RTGS available round the clock on all days of the year with effect from 00:30 hours on December 14, 2020. Members were advised to put in place necessary infrastructure to provide RTGS round the clock to their customers. RTGS transactions undertaken after normal banking hours are expected to be automated using ‘Straight Through Processing (STP)’ modes. Members were further advised to disseminate information on the extended availability of RTGS to all their customers. | | December 4, 2020 | Card transactions in Contactless mode - Relaxation in requirement of Additional Factor of Authentication (RBI/2020-21/71 DPSS.CO.PD No.752/02.14.003/2020-21): The present COVID-19 pandemic has underlined the benefits of contactless transactions. Keeping this in view and based on stakeholder feedback, it was announced in the Statement on Developmental and Regulatory Policies dated December 4, 2020 that per transaction limit for Additional Factor of Authentication (AFA) relaxation for contactless card transactions will be increased. Accordingly, given the sufficient protection available to users, it has been decided to increase the per transaction limit to ₹ 5,000/-. | | December 18, 2020 | Amendment to Master Direction (MD) on KYC – Centralized KYC Registry – Roll out of Legal Entity Template & other changes (RBI/2020-21/80 DOR.AML.BC.No.31/14.01.001/2020-21): REs have been uploading the KYC data pertaining to all individual accounts opened on or after January 1, 2017 on to Central KYC Records Registry (CKYCR) in terms of the provisions of the Prevention of Money Laundering (Maintenance of Records) Rules, 2005. Changes to the template, as and when required are released by CERSAI after consulting the Reserve Bank. As the CKYCR is now fully operational for individual customers, it has been decided to extend the CKYCR to Legal Entities (LEs). Accordingly, REs shall upload the KYC data pertaining to accounts of LEs opened on or after April 1, 2021, on to CKYCR in terms of Rule 9 (1A) of the PML Rules. REs shall also ensure that in case of accounts of LEs opened prior to April 1, 2021, the KYC records are uploaded on to CKYCR during the process of periodic updation as specified in Section 38 of the Master Direction, or earlier when the updated KYC information is obtained/received from the customer in certain cases. REs shall ensure that during periodic updation, the customers’ KYC details are migrated to current Customer Due Diligence (CDD) standards.
In order to ensure that all existing KYC records of individual customers are incrementally uploaded on to CKYCR, REs shall upload the KYC data pertaining to accounts of individuals opened prior to January 01, 2017, at the time of periodic updation as specified in Section 38 of the Master Direction, or earlier when the updated KYC information is obtained/received from the customer in certain cases. REs shall ensure that during periodic updation, the customers’ KYC details are migrated to current CDD standard.
Where a customer, for the purpose of establishing an account based relationship, submits a KYC Identifier to a RE, with an explicit consent to download records from CKYCR, then such RE shall retrieve the KYC records online from CKYCR using the KYC Identifier and the customer shall not be required to submit the same KYC records or information or any other additional identification documents or details, unless – -
there is a change in the information of the customer as existing in the records of CKYCR; -
the current address of the customer is required to be verified; -
the RE considers it necessary in order to verify the identity or address of the customer, or to perform enhanced due diligence or to build an appropriate risk profile of the client. Once KYC Identifier is generated by CKYCR, the REs shall ensure that the same is communicated to the individual/legal entity as the case may be. | | January 5, 2021 | Operationalisation of Payments Infrastructure Development Fund (PIDF) Scheme (RBI/2020-21/81 DPSS.CO.AD No.900/02.29.005/2020-21): RBI had announced creation of PIDF on October 04, 2019. PIDF is intended to subsidise deployment of payment acceptance infrastructure in Tier-3 to Tier-6 centres with special focus on North-Eastern States of the country. It envisages creating 30 lakh new touch points every year for digital payments. PIDF will be operational for a period of three years from January 01, 2021 and may be extended for two more years depending upon the progress. | | January 27, 2021 | Strengthening of Grievance Redress Mechanism in Banks (RBI/2020-21/87 CEPD.CO.PRD.Cir.No.01/13.01.013/2020-21): RBI had announced in the ‘Statement on Developmental and Regulatory Policies’ issued as part of the Monetary Policy statement dated December 4, 2020 that with a view to strengthen and improve the efficacy of the grievance redress mechanism of banks, a comprehensive framework will be put in place during January 2021. Accordingly, a framework comprising of i) enhanced disclosures on complaints to be made by the banks; ii) recovery of the cost of redress of maintainable complaints from the banks against whom the number of complaints received in the OBOs are in excess of their peer group averages; and iii) intensive review by RBI of the grievance redress mechanism of banks having persisting issues in their redress mechanism has been issued. The redress of complaints will continue to be cost-free for the customers of banks and members of public. The framework intends to, inter-alia, provide greater insight into the volume and nature of complaints received by the banks as also the quality and turnaround time of redressal, promote satisfactory customer outcomes and improved customer confidence, and identify remedial steps to be taken by the banks having persisting issues in grievance redress mechanism. | | February 16, 2021 | Remittances to International Financial Services Centres (IFSCs) in India under the Liberalised Remittance Scheme (LRS) (RBI/2020-21/99 A.P. (DIR Series) Circular No. 11): With a view to deepen the financial markets in International Financial Services Centres (IFSCs) and provide an opportunity to resident individuals to diversify their portfolio, the extant guidelines on Liberalised Remittance Scheme (LRS) have been reviewed and it has been decided to permit resident individuals to make remittances under LRS to IFSCs set up in India under the Special Economic Zone Act, 2005, as amended from time to time. Accordingly, AD Category - I banks may allow resident individuals to make remittances under LRS to IFSCs in India, subject to the following conditions: -
The remittance shall be made only for making investments in IFSCs in securities, other than those issued by entities/companies resident (outside IFSC) in India. -
Resident Individuals may also open a non interest bearing Foreign Currency Account (FCA) in IFSCs, for making the above permissible investments under LRS. Any funds lying idle in the account for a period upto 15 days from the date of its receipt into the account shall be immediately repatriated to domestic INR account of the investor in India. -
Resident Individuals shall not settle any domestic transactions with other residents through these FCAs held in IFSC. AD Category - I banks, while allowing such remittances, shall ensure compliance with all other terms and conditions, including reporting requirements prescribed under the Scheme. It may be noted that any person resident in India (outside IFSC) entering into any transaction with a person/entity in IFSC shall only be governed by regulations/directions and rules issued/notified by the Reserve Bank of India and the Government of India respectively under Foreign Exchange Management Act (FEMA), 1999. Further, compounding of any contravention of FEMA provision by such person resident in India shall be dealt by the Reserve Bank of India in accordance with the extant instructions/provisions on compounding of contraventions under FEMA.
Master Direction No.7 (Master Direction – Liberalised Remittance Scheme) is being updated to reflect the above changes. AD Category - I banks should bring the contents of this circular to the notice of their constituents and customers. | | February 17, 2021 | Master Direction – Non-Banking Financial Company – Housing Finance Company (Reserve Bank) Directions, 2021 (RBI/2020-21/73 DOR.FIN.HFC.CC.No.120/03.10.136/2020-21): Every Housing Finance Company (HFC) shall have a system and a procedure for receiving, registering and disposing of complaints and grievances in each of its offices, including those received on-line.
If a complaint has been received in writing from a customer, an HFC shall endeavor to send him/ her an acknowledgement/ response within a week. The acknowledgement should contain the name & designation of the official who will deal with the grievance. If the complaint is relayed over phone at HFC’s designated telephone helpdesk or customer service number, the customer shall be provided with a complaint reference number and be kept informed of the progress within a reasonable period of time.
After examining the matter, an HFC shall send the customer its final response or explain why it needs more time to respond and shall endeavor to do so within six weeks of receipt of a complaint and he/ she should be informed how to take his/ her complaint further if he/ she is still not satisfied.
Every HFC shall publicize its grievance redressal procedure (e-mail id and other contact details at which the complaints can be lodged, turnaround time for resolving the issue, matrix for escalation, etc.) for lodging the complaints by the aggrieved borrower and ensure specifically that it is made available on its website. HFC shall clearly display in all its offices/ branches and on the website that in case the complainant does not receive response from the company within a period of one month or is dissatisfied with the response received, the complainant may approach the Complaint Redressal Cell of NHB by lodging its complaints online on the website of NHB or through post to NHB, New Delhi.
Fair Practices Code (which shall preferably be in the vernacular language or a language as understood by the borrower) based on the directions outlined shall be put in place by all HFCs with the approval of their Boards. HFCs will have the freedom of drafting the Fair Practices Code, enhancing the scope of the directions but in no way sacrificing the spirit underlying the above directions. The same shall be put up on their website, for the information of various stakeholders. | | February 18, 2021 | Master Direction on Digital Payment Security Controls (RBI/2020-21/74 DoS.CO.CSITE.SEC.No.1852/31.01.015/2020-21): The Master Direction provides necessary guidelines for the Regulated Entities (Scheduled Commercial Banks, Small Finance Banks, Payment Banks and Credit Card issuing NBFCs) to set up a robust governance structure and implement common minimum standards of security controls for digital payment products and services. The guidelines are technology and platform agnostic and shall create an enhanced and enabling environment for customers to use digital payment products in a more safe and secure manner.
The Master Direction consolidates important control aspects broadly in the following areas viz., Governance and Management of Security Risks, Generic Security Controls, Application Security Life Cycle (ASLC), Authentication Framework, Fraud Risk Management, Reconciliation Mechanism, Customer Protection, Awareness and Grievance Redressal Mechanism, specific controls related to Internet Banking, Mobile Payments Application Security Controls and Card Payments Security. | | March 15, 2021 | Extension of Cheque Truncation System (CTS) across all bank branches in the country (RBI/2020-21/107 DPSS.CO.RPPD.No.SUO 21102/04.07.005/2020-21): To leverage the availability of CTS and provide uniform customer experience irrespective of location of her/his bank branch, it has been decided to extend CTS across all bank branches in the country. To facilitate this, banks shall have to ensure that all their branches participate in image-based CTS under respective grids by September 30, 2021. They are free to adopt a model of their choice, like deploying suitable infrastructure in every branch or following a hub and spoke model, etc. and concerned banks shall coordinate with the respective Regional Offices of RBI to operationalize this. | | March 31, 2021 | Guidelines on Regulation of Payment Aggregators and Payment Gateways (RBI/2020-21/117 CO.DPSS.POLC.No.S33/02-14-008/2020-2021): As per RBI’s circular DPSS.CO.PD.No.1810/02.14.008/2019-20 dated March 17, 2020 (as updated from time to time) and the clarification dated September 17, 2020 issued on the subject, neither the authorised Payment Aggregators (PAs) nor the merchants on-boarded by them can store customer card credentials within their database or server.
Based on the representations received from the industry seeking additional time for implementing the above instructions, it has been decided, as a one-time measure, to extend the timeline for non-bank PAs by six months, i.e., till December 31, 2021, to enable the payment system providers and participants to put in place workable solutions, such as tokenisation, within the framework set out in the circular dated March 17, 2020 cited above and our circular DPSS.CO.PD No.1463/02.14.003/2018-19 dated January 08, 2019 on “Tokenisation – Card transactions”. | | March 31, 2021 | Framework for processing of e-mandates for recurring online transactions (RBI/2020-21/118 CO.DPSS.POLC.No.S34/02-14-003/2020-2021): RBI vide its circulars DPSS.CO.PD.No.447/02.14.003/2019-20 dated August 21, 2019, DPSS.CO.PD.No.1324/02.23.001/2019-20 dated January 10, 2020 and DPSS.CO.PD.No.754/02.14.003/2020-21 dated December 4, 2020, had put in place a framework for registering e-mandates for recurring online transactions using cards / wallets / Unified Payments Interface. The framework had ensured that changing payment needs of customers were accommodated by adequately balancing safety, security and convenience of such transactions. Stakeholders were given sufficient time to complete the process of migration to the framework by March 31, 2021. Keeping in view the requests of some stakeholders and to prevent any inconvenience to customers, it has been decided, as a one-time measure, to extend the timeline for ensuring full compliance to the framework till September 30, 2021. During the extended timeline, no new mandate for recurring online transactions shall be registered by stakeholders, unless such mandates are compliant with the framework. |
| Appendix 6.2 Number of awareness programmes conducted during July 1, 2020 to March 31, 2021 | | Office of Ombudsman | No. of Townhall Events | No. of Awareness Programmes | | Ahmedabad | 1 | 7 | | Bengaluru | 0 | 8 | | Bhopal | 1 | 8 | | Bhubaneswar | 0 | 2 | | Chandigarh | 1 | 38 | | Chennai | 0 | 2 | | Dehradun | 0 | 0 | | Guwahati | 1 | 9 | | Hyderabad | 2 | 6 | | Jaipur | 0 | 0 | | Jammu | 2 | 6 | | Kanpur | 0 | 2 | | Kolkata | 0 | 0 | | Mumbai-I | 2 | 7 | | Mumbai - II | 0 | 10 | | New Delhi I | 0 | 8 | | New Delhi II | 2 | 12 | | New Delhi-III | 0 | 1 | | Patna | 0 | 4 | | Raipur | 1 | 2 | | Ranchi | 1 | 2 | | Thiruvananthapuram | 1 | 5 | | Total | 15 | 139 |
| Annex 1 - Statement of complaints received by the OBOs during July 1, 2020 - March 31, 2021 | | Period : July 01, 2020 - March 31, 2021 | | | Complaints related to digital modes of payment | | | | | | | | | | | | | | | | | | | S.No. | Name of the Bank | Total compl aints rece ived | Comp laints per branch | Comp laints related to ATM/DC* per 1,000 ATM/DC* outsta nding | Comp laints related to CC* per 1,000 outsta nding CC* | Digital comp laints per 1,000 digital transa ctions exe cuted thro ugh the bank | Non-digital Comp laints per 1,000 acco unts# | ATM / Debit Cards | Mobile / elect ronic ban king | Non-obser vance of FPC | Credit Cards | Failure to meet commi tments | Levy of charges without prior notice | Loans and adva nces | Non-adhe rence to BCSBI Codes | Deposit Accounts related | Pen sion paym ents | Remitta nces | DSAs and reco very agents | Para ban king | Notes and Coins | Others | Out of purview of BOS | | | Public Sector Banks | | | | | | | | | | | | | | | | | | | | | | | | 1 | State Bank of India | 57472 | 2.30 | 0.05 | 0.08 | 0.003 | 0.056 | 14081 | 10011 | 5084 | 1002 | 5534 | 2718 | 3539 | 1884 | 1766 | 1910 | 594 | 107 | 234 | 54 | 7559 | 1395 | | 2 | Bank of Baroda | 13362 | 1.58 | 0.04 | 0.57 | 0.004 | 0.050 | 2727 | 2089 | 1433 | 368 | 1261 | 708 | 924 | 578 | 501 | 200 | 223 | 24 | 36 | 16 | 1830 | 444 | | 3 | Bank of India | 7103 | 1.33 | 0.06 | 0.56 | 0.004 | 0.035 | 2678 | 861 | 629 | 94 | 478 | 269 | 484 | 122 | 197 | 133 | 87 | 7 | 37 | 5 | 831 | 191 | | 4 | Bank of Maharashtra | 1816 | 0.91 | 0.07 | 0.16 | 0.003 | 0.029 | 692 | 256 | 114 | 7 | 116 | 115 | 97 | 22 | 45 | 13 | 13 | 2 | 11 | 3 | 237 | 73 | | 5 | Canara Bank | 9121 | 0.84 | 0.04 | 0.21 | 0.002 | 0.055 | 1655 | 1082 | 1184 | 161 | 1046 | 525 | 627 | 662 | 317 | 189 | 148 | 12 | 44 | 12 | 1154 | 303 | | 6 | Central Bank of India | 6981 | 1.45 | 0.10 | NA | 0.006 | 0.036 | 2769 | 978 | 572 | 69 | 516 | 174 | 346 | 115 | 159 | 307 | 66 | 13 | 12 | 10 | 726 | 149 | | 8 | Indian Bank | 6580 | 1.04 | 0.08 | 0.34 | 0.004 | 0.032 | 1901 | 971 | 738 | 45 | 700 | 258 | 452 | 144 | 222 | 161 | 109 | 14 | 14 | 5 | 702 | 144 | | 7 | Indian Overseas Bank | 2174 | 0.66 | 0.02 | 0.38 | 0.002 | 0.036 | 480 | 292 | 317 | 23 | 319 | 86 | 203 | 57 | 66 | 45 | 24 | 6 | 10 | 2 | 195 | 49 | | 9 | Punjab and Sind Bank | 976 | 0.62 | 0.07 | NA | 0.006 | 0.055 | 211 | 111 | 75 | 5 | 285 | 27 | 71 | 7 | 37 | 11 | 7 | 3 | 1 | 0 | 102 | 23 | | 10 | Punjab National Bank | 20499 | 1.71 | 0.13 | 0.63 | 0.007 | 0.070 | 5639 | 3291 | 1419 | 192 | 2953 | 721 | 1124 | 276 | 794 | 676 | 286 | 23 | 81 | 22 | 2502 | 500 | | 12 | UCO Bank | 2444 | 0.78 | 0.06 | NA | 0.004 | 0.038 | 629 | 398 | 259 | 12 | 253 | 104 | 182 | 46 | 76 | 57 | 49 | 3 | 7 | 5 | 300 | 64 | | 11 | Union Bank of India | 11128 | 1.13 | 0.08 | 0.29 | 0.003 | 0.041 | 3499 | 1678 | 1111 | 139 | 906 | 391 | 619 | 541 | 330 | 191 | 128 | 13 | 31 | 8 | 1255 | 288 | | | All Public Sector Banks | 139656 | 1.51 | 0.06 | 0.15 | 0.004 | 0.050 | 36961 | 22018 | 12935 | 2117 | 14367 | 6096 | 8668 | 4454 | 4510 | 3893 | 1734 | 227 | 518 | 142 | 17393 | 3623 | | | | | | | | | | | | | | | | | | | | | | | | | | | | Private Sector Banks | | | | | | | | | | | | | | | | | | | | | | | | 1 | Axis Bank Limited | 16927 | 3.56 | 0.07 | 0.50 | 0.003 | 0.184 | 1652 | 1637 | 1921 | 3591 | 1790 | 2214 | 861 | 671 | 307 | 6 | 109 | 185 | 69 | 15 | 1544 | 355 | | 2 | Bandhan Bank Limited | 558 | 0.10 | 0.03 | NA | 0.002 | 0.010 | 113 | 71 | 85 | 2 | 52 | 16 | 82 | 9 | 13 | 0 | 6 | 5 | 1 | 2 | 78 | 23 | | 3 | Catholic Syrian Bank Limited | 94 | 0.17 | 0.02 | NA | 0.001 | 0.035 | 12 | 3 | 28 | 1 | 12 | 20 | 2 | 2 | 3 | 0 | 0 | 0 | 1 | 0 | 6 | 4 | | 4 | City Union Bank Limited | 272 | 0.38 | 0.02 | 1.92 | 0.001 | 0.027 | 42 | 61 | 43 | 6 | 29 | 17 | 20 | 6 | 3 | 1 | 2 | 1 | 0 | 0 | 33 | 8 | | 5 | DCB Bank Limited | 685 | 1.83 | 0.02 | 1.12 | 0.002 | 0.338 | 16 | 30 | 116 | 6 | 128 | 72 | 129 | 26 | 17 | 0 | 6 | 4 | 3 | 0 | 118 | 14 | | 6 | Dhanlaxmi Bank Limited | 79 | 0.29 | 0.02 | 0.17 | 0.001 | 0.027 | 10 | 7 | 27 | 1 | 4 | 7 | 7 | 3 | 2 | 0 | 0 | 0 | 0 | 0 | 5 | 6 | | 7 | Federal Bank Limited | 814 | 0.62 | 0.02 | NA | 0.001 | 0.033 | 209 | 121 | 127 | 15 | 40 | 55 | 56 | 24 | 29 | 0 | 5 | 3 | 2 | 1 | 80 | 47 | | 8 | HDFC Bank Limited | 27324 | 4.81 | 0.05 | 0.50 | 0.004 | 0.155 | 2016 | 2506 | 3178 | 7466 | 3154 | 2112 | 1391 | 1046 | 373 | 12 | 189 | 386 | 100 | 26 | 2807 | 562 | | 9 | ICICI Bank Limited | 22458 | 4.28 | 0.04 | 0.35 | 0.002 | 0.153 | 1673 | 2798 | 2690 | 3672 | 2580 | 2263 | 1861 | 878 | 365 | 8 | 198 | 188 | 86 | 23 | 2633 | 542 | | 10 | IDBI Bank Limited | 2787 | 1.33 | 0.04 | 0.53 | 0.002 | 0.137 | 499 | 318 | 337 | 20 | 326 | 249 | 342 | 110 | 59 | 5 | 37 | 6 | 46 | 6 | 332 | 95 | | 11 | IDFC First Bank Limited | 3016 | 3.80 | 0.04 | 0.20 | 0.001 | 0.138 | 125 | 127 | 533 | 47 | 464 | 216 | 406 | 149 | 45 | 0 | 21 | 156 | 15 | 0 | 567 | 145 | | 12 | Indusind Bank Limited | 5013 | 2.63 | 0.06 | 1.01 | 0.004 | 0.084 | 385 | 280 | 487 | 1547 | 749 | 380 | 197 | 173 | 87 | 0 | 29 | 72 | 23 | 1 | 499 | 104 | | 13 | Jammu & Kashmir Bank Limited | 566 | 0.58 | 0.05 | 0.12 | 0.002 | 0.015 | 204 | 72 | 100 | 10 | 25 | 18 | 40 | 4 | 25 | 2 | 7 | 0 | 1 | 10 | 41 | 7 | | 14 | Karnataka Bank Limited | 549 | 0.62 | 0.02 | NA | 0.001 | 0.028 | 83 | 94 | 52 | 2 | 40 | 58 | 30 | 96 | 8 | 0 | 4 | 0 | 3 | 1 | 73 | 5 | | 15 | Karur Vysya Bank Limited | 479 | 0.56 | 0.01 | 1.15 | 0.001 | 0.033 | 61 | 61 | 93 | 3 | 50 | 47 | 42 | 37 | 14 | 0 | 4 | 5 | 0 | 0 | 52 | 10 | | 16 | Kotak Mahindra Bank Limited | 8624 | 4.96 | 0.04 | 0.55 | 0.004 | 0.300 | 799 | 1230 | 871 | 1316 | 949 | 725 | 457 | 320 | 183 | 6 | 61 | 259 | 32 | 4 | 1195 | 217 | | 17 | Nainital Bank Limited | 63 | 0.38 | NA | NA | 0.006 | 0.047 | 8 | 5 | 16 | 0 | 8 | 1 | 6 | 1 | 0 | 0 | 1 | 0 | 0 | 0 | 11 | 6 | | 18 | RBL Bank Limited | 7571 | 16.94 | 0.09 | 1.56 | 0.026 | 0.199 | 111 | 251 | 488 | 4627 | 552 | 364 | 115 | 172 | 50 | 0 | 10 | 384 | 15 | 1 | 362 | 69 | | 19 | South Indian Bank | 410 | 0.43 | 0.03 | NA | 0.001 | 0.025 | 105 | 65 | 69 | 4 | 33 | 41 | 21 | 11 | 4 | 0 | 2 | 1 | 1 | 1 | 24 | 28 | | 20 | Tamilnad Mercantile Bank Limited | 278 | 0.53 | 0.03 | 0.06 | 0.001 | 0.025 | 61 | 40 | 39 | 2 | 46 | 21 | 16 | 14 | 2 | 0 | 4 | 3 | 0 | 1 | 20 | 9 | | 21 | Yes Bank Limited | 3023 | 2.80 | 0.05 | 0.33 | 0.000 | 0.312 | 175 | 224 | 367 | 312 | 640 | 285 | 211 | 133 | 87 | 1 | 25 | 55 | 17 | 5 | 400 | 86 | | | All Private Sector Banks | 101590 | 2.77 | 0.05 | 0.55 | 0.002 | 0.127 | 8359 | 10001 | 11667 | 22650 | 11671 | 9181 | 6292 | 3885 | 1676 | 41 | 720 | 1713 | 415 | 97 | 10880 | 2342 | | | | | | | | | | | | | | | | | | | | | | | | | | | | Payment Banks | | | | | | | | | | | | | | | | | | | | | | | | 1 | Aditya Birla Idea Payments Bank Limited | 9 | NA | NA | NA | NA | NA | 0 | 2 | 0 | 0 | 0 | 0 | 4 | 0 | 1 | 0 | 1 | 1 | 0 | 0 | 0 | 0 | | 2 | Airtel Payments Bank Limited | 2026 | 75.04 | 0.04 | NA | 0.002 | NA | 63 | 716 | 119 | 10 | 400 | 45 | 0 | 38 | 147 | 3 | 24 | 0 | 6 | 1 | 373 | 81 | | 3 | Fino Payments Bank Limited | 193 | 3.51 | 0.03 | NA | 0.001 | NA | 58 | 34 | 8 | 2 | 14 | 4 | 5 | 4 | 19 | 0 | 4 | 0 | 0 | 1 | 39 | 1 | | 4 | India Post Payments Bank Limited | 159 | 0.24 | 0.02 | NA | 0.001 | NA | 25 | 36 | 12 | 0 | 23 | 9 | 1 | 8 | 16 | 1 | 3 | 0 | 1 | 1 | 20 | 3 | | 5 | Jio Payments Bank Limited | 26 | 2.89 | NA | NA | 0.004 | NA | 1 | 12 | 1 | 0 | 3 | 0 | 0 | 0 | 2 | 0 | 0 | 0 | 0 | 0 | 5 | 2 | | 7 | NSDL Payments Bank Limited | 46 | 46.00 | 0.01 | NA | 0.002 | NA | 2 | 9 | 4 | 0 | 10 | 9 | 0 | 0 | 8 | 0 | 0 | 0 | 0 | 0 | 3 | 1 | | 6 | Paytm Payments Bank Limited | 1838 | 306.33 | 0.00 | NA | 0.000 | NA | 138 | 777 | 106 | 22 | 188 | 35 | 3 | 49 | 88 | 0 | 28 | 7 | 3 | 0 | 324 | 70 | | | All Payment Banks | 4297 | 5.74 | 0.00 | NA | 0.000 | NA | 287 | 1586 | 250 | 34 | 638 | 102 | 13 | 99 | 281 | 4 | 60 | 8 | 10 | 3 | 764 | 158 | | | | | | | | | | | | | | | | | | | | | | | | | | | | Small Finance Banks | | | | | | | | | | | | | | | | | | | | | | | | 1 | Au Small Finance Bank Limited | 432 | 0.76 | 0.01 | 0.00 | 0.001 | 0.201 | 20 | 21 | 37 | 0 | 62 | 42 | 87 | 5 | 14 | 0 | 3 | 11 | 2 | 2 | 116 | 10 | | 2 | Capital Small Finance Bank Limited | 40 | 0.25 | 0.02 | NA | 0.002 | 0.056 | 3 | 2 | 1 | 0 | 13 | 4 | 4 | 2 | 2 | 0 | 0 | 0 | 0 | 1 | 7 | 1 | | 3 | Fincare Small Finance Bank Limited | 157 | 0.28 | 0.00 | NA | 0.003 | 0.022 | 13 | 28 | 22 | 2 | 24 | 7 | 4 | 11 | 17 | 0 | 1 | 1 | 1 | 0 | 22 | 4 | | 4 | Equitas Small Finance Bank Limited | 175 | 0.20 | 0.00 | NA | 0.000 | 0.038 | 5 | 13 | 29 | 1 | 35 | 19 | 18 | 6 | 5 | 0 | 5 | 2 | 0 | 0 | 33 | 4 | | 5 | ESAF Small Finance Bank Limited | 46 | 0.08 | 0.01 | NA | 0.001 | 0.003 | 20 | 2 | 11 | 0 | 2 | 1 | 2 | 1 | 1 | 0 | 0 | 0 | 0 | 0 | 2 | 4 | | 6 | Suryoday Small Finance Bank Limited | 23 | 0.04 | 0.00 | NA | 0.001 | 0.008 | 1 | 1 | 3 | 0 | 1 | 0 | 4 | 4 | 6 | 0 | 0 | 0 | 0 | 0 | 1 | 2 | | 7 | Ujjivan Small Finance Bank Limited | 190 | 0.33 | 0.00 | NA | 0.001 | 0.013 | 30 | 21 | 19 | 0 | 29 | 10 | 19 | 17 | 7 | 0 | 0 | 4 | 1 | 0 | 32 | 1 | | 8 | Utkarsh Small Finance Bank Limited | 51 | 0.09 | 0.01 | NA | 0.003 | 0.011 | 5 | 5 | 7 | 0 | 8 | 2 | 9 | 1 | 4 | 0 | 0 | 0 | 0 | 0 | 5 | 5 | | 9 | North East Small Finance Bank Limited | 2 | 0.01 | 0.00 | NA | 0.000 | 0.002 | 0 | 0 | 0 | 0 | 0 | 0 | 1 | 0 | 0 | 0 | 0 | 0 | 0 | 0 | 0 | 1 | | 10 | Jana Small Finance Bank Limited | 190 | 0.38 | 0.02 | NA | 0.004 | 0.025 | 39 | 3 | 22 | 3 | 28 | 16 | 17 | 10 | 11 | 0 | 2 | 2 | 3 | 0 | 27 | 7 | | | All Small Finance Banks | 1306 | 0.26 | 0.01 | NA | 0.001 | 0.025 | 136 | 96 | 151 | 6 | 202 | 101 | 165 | 57 | 67 | 0 | 11 | 20 | 7 | 3 | 245 | 39 | | | | | | | | | | | | | | | | | | | | | | | | | | | | Foreign Banks | | | | | | | | | | | | | | | | | | | | | | | | 1 | AB Bank Limited | 6 | 6.00 | NA | NA | NA | 9.709 | 2 | 0 | 0 | 0 | 0 | 2 | 1 | 0 | 1 | 0 | 0 | 0 | 0 | 0 | 0 | 0 | | 2 | Abu Dhabi Commercial Bank PJSC | 2 | 2.00 | NA | NA | 0.000 | NA | 0 | 0 | 0 | 0 | 0 | 0 | 0 | 0 | 0 | 0 | 0 | 1 | 0 | 0 | 0 | 1 | | 3 | American Express Banking Corporation | 353 | 176.50 | NA | 0.15 | 0.006 | 0.056 | 0 | 1 | 29 | 225 | 31 | 24 | 3 | 16 | 1 | 0 | 1 | 4 | 1 | 0 | 13 | 4 | | 4 | Barclays Bank Plc | 20 | 5.00 | 0.00 | NA | 0.015 | 0.858 | 0 | 0 | 2 | 10 | 5 | 0 | 0 | 3 | 0 | 0 | 0 | 0 | 0 | 0 | 0 | 0 | | 5 | Bank of America | 2 | 0.50 | NA | 0.08 | 0.000 | 0.000 | 0 | 0 | 0 | 2 | 0 | 0 | 0 | 0 | 0 | 0 | 0 | 0 | 0 | 0 | 0 | 0 | | 6 | Bank of Bahrain and Kuwait B.S.C | 1 | 0.25 | NA | NA | 0.000 | 0.046 | 0 | 0 | 0 | 0 | 0 | 0 | 0 | 0 | 0 | 0 | 0 | 0 | 0 | 0 | 1 | 0 | | 7 | BNP Paribas | 2 | 0.20 | NA | NA | 0.000 | 0.631 | 0 | 0 | 0 | 0 | 0 | 0 | 0 | 0 | 0 | 0 | 0 | 0 | 0 | 0 | 0 | 2 | | 8 | Citibank N.A. | 1429 | 34.85 | 0.03 | 0.27 | 0.003 | 0.085 | 54 | 142 | 135 | 720 | 96 | 49 | 28 | 59 | 18 | 0 | 18 | 7 | 1 | 0 | 82 | 20 | | 9 | DBS Bank India Limited | 399 | 0.64 | 0.02 | NA | 0.001 | 0.062 | 48 | 93 | 57 | 0 | 46 | 18 | 8 | 20 | 18 | 0 | 6 | 2 | 2 | 0 | 69 | 12 | | 10 | Deutsche Bank | 134 | 6.70 | 0.04 | NA | 0.000 | 0.385 | 5 | 8 | 29 | 1 | 34 | 8 | 12 | 4 | 6 | 0 | 2 | 2 | 0 | 0 | 20 | 3 | | 11 | FirstRand Bank Limited | 1 | 1.00 | NA | NA | 0.000 | 0.061 | 0 | 0 | 0 | 0 | 0 | 0 | 0 | 0 | 0 | 0 | 0 | 0 | 0 | 0 | 1 | 0 | | 12 | Hong Kong and Shanghai Banking Corporation Limited | 468 | 15.60 | 0.05 | 0.24 | 0.003 | 0.139 | 26 | 34 | 48 | 202 | 41 | 12 | 27 | 28 | 6 | 0 | 5 | 1 | 1 | 0 | 29 | 8 | | 13 | Industrial & Commercial Bank of China Limited | 1 | 1.00 | NA | NA | 0.092 | 0.000 | 0 | 0 | 0 | 1 | 0 | 0 | 0 | 0 | 0 | 0 | 0 | 0 | 0 | 0 | 0 | 0 | | 14 | JP Morgan Chase Bank N.A. | 1 | 0.25 | NA | NA | 0.000 | 0.034 | 0 | 0 | 0 | 0 | 0 | 0 | 1 | 0 | 0 | 0 | 0 | 0 | 0 | 0 | 0 | 0 | | 15 | Krung Thai Bank Public Co. Limited | 1 | 0.33 | NA | NA | 0.754 | 0.000 | 0 | 0 | 0 | 1 | 0 | 0 | 0 | 0 | 0 | 0 | 0 | 0 | 0 | 0 | 0 | 0 | | 16 | Mashreqbank PSC | 3 | 3.00 | NA | NA | 0.000 | 8.451 | 0 | 0 | 0 | 0 | 1 | 0 | 0 | 0 | 0 | 0 | 1 | 0 | 0 | 0 | 1 | 0 | | 17 | Mizuho Bank Limited | 1 | 0.20 | NA | NA | 0.000 | 0.371 | 0 | 0 | 0 | 0 | 0 | 0 | 0 | 0 | 0 | 0 | 0 | 0 | 0 | 0 | 1 | 0 | | 18 | MUFG Bank, Ltd. | 1 | 0.20 | NA | NA | 0.000 | 0.204 | 0 | 0 | 1 | 0 | 0 | 0 | 0 | 0 | 0 | 0 | 0 | 0 | 0 | 0 | 0 | 0 | | 19 | SBM Bank (India) Limited | 4 | 0.50 | 0.10 | 0.01 | 0.000 | 0.039 | 1 | 0 | 0 | 1 | 0 | 0 | 0 | 0 | 0 | 0 | 0 | 0 | 0 | 0 | 2 | 0 | | 20 | Shinhan Bank | 16 | 2.67 | NA | NA | 0.003 | 0.516 | 0 | 1 | 7 | 0 | 0 | 0 | 6 | 2 | 0 | 0 | 0 | 0 | 0 | 0 | 0 | 0 | | 21 | Societe Generale India | 1 | 0.50 | NA | NA | 0.000 | 3.106 | 0 | 0 | 1 | 0 | 0 | 0 | 0 | 0 | 0 | 0 | 0 | 0 | 0 | 0 | 0 | 0 | | 22 | Standard Chartered Bank | 2047 | 19.68 | 0.13 | 0.45 | 0.005 | 0.444 | 134 | 144 | 222 | 665 | 171 | 153 | 148 | 97 | 19 | 3 | 14 | 25 | 1 | 0 | 215 | 36 | | 23 | United Overseas Bank Limited | 1 | 0.50 | NA | NA | 3.257 | 0.000 | 1 | 0 | 0 | 0 | 0 | 0 | 0 | 0 | 0 | 0 | 0 | 0 | 0 | 0 | 0 | 0 | | 24 | Natwest Markets PLC | 8 | 4.00 | NA | NA | 157.895 | NA | 0 | 0 | 0 | 6 | 1 | 0 | 0 | 0 | 0 | 0 | 0 | 0 | 0 | 0 | 1 | 0 | | | All Foreign Banks | 4902 | 5.55 | 0.05 | 0.28 | 0.003 | 0.140 | 271 | 423 | 531 | 1834 | 426 | 266 | 234 | 229 | 69 | 3 | 47 | 42 | 6 | 0 | 435 | 86 | | | | | | | | | | | | | | | | | | | | | | | | | | | | SBI Card | 10354 | | | | | | 134 | 312 | 638 | 6976 | 706 | 517 | 29 | 262 | 25 | 0 | 5 | 215 | 4 | 0 | 460 | 71 | | | Primary Urban Cooperative Banks | 1118 | | | | | | 200 | 156 | 220 | 13 | 70 | 59 | 72 | 21 | 57 | 0 | 15 | 5 | 5 | 2 | 160 | 63 | | | Regional Rural Banks | 3832 | | | | | | 964 | 339 | 585 | 70 | 306 | 109 | 420 | 133 | 132 | 19 | 52 | 10 | 36 | 4 | 497 | 156 | | | Others | 6149 | | | | | | 234 | 527 | 872 | 62 | 704 | 83 | 150 | 795 | 64 | 30 | 32 | 19 | 26 | 2 | 854 | 1695 | | | Grand Total | 273204 | | | | | | 47546 | 35458 | 27849 | 33762 | 29090 | 16514 | 16043 | 9935 | 6881 | 3990 | 2676 | 2259 | 1027 | 253 | 31688 | 8233 |
| Annex 2 - Statement of complaints received by the ONBFCOs during July 1, 2020 to March 31, 2021 | | Name of the NBFC | Non-adherence to Fair Practices Code | Not covered under the clause 8 of the Scheme | Non- observance of RBI directions to NBFC | Levying of charges without notice | Delay in repayment of deposits | No transparency in contract/loan | Delay in release of securities / documents | No communication about loan sanctioned | Non-understandable or no adequate notice on terms and conditions | Non-understandable or sanction letter/terms | Delay in payment of interest | Other categories | Total | | DEPOSIT TAKING NBFCS | | | ADITYA HOUSING & FINANCE PVT LTD | 1 | 0 | 0 | 0 | 0 | 0 | 0 | 0 | 0 | 0 | 0 | 0 | 1 | | AKME FINTRADE (INDIA) LTD | 4 | 0 | 0 | 0 | 0 | 0 | 0 | 0 | 0 | 0 | 0 | 0 | 4 | | AMRIT MALWA CAPITAL LTD | 1 | 0 | 0 | 0 | 0 | 0 | 0 | 0 | 0 | 0 | 0 | 0 | 1 | | ASHISH FINANCE & LEASING CO. LTD | 1 | 0 | 0 | 0 | 0 | 0 | 0 | 0 | 0 | 0 | 0 | 0 | 1 | | BAJAJ FINANCE LTD | 3651 | 273 | 661 | 949 | 50 | 366 | 53 | 96 | 28 | 19 | 64 | 633 | 6843 | | BALAJI INSTALMENTS LTD | 1 | 0 | 1 | 0 | 0 | 0 | 0 | 0 | 0 | 0 | 0 | 1 | 3 | | BERAR FINANCE LTD | 6 | 2 | 1 | 3 | 0 | 0 | 0 | 0 | 1 | 0 | 0 | 2 | 15 | | CHOLA FINANCE LTD | 1 | 0 | 0 | 1 | 0 | 0 | 0 | 0 | 0 | 0 | 0 | 0 | 2 | | DCM FINANCIAL SERVICES LTD | 2 | 0 | 0 | 0 | 1 | 0 | 0 | 0 | 0 | 0 | 0 | 0 | 3 | | EKJOT ADVANCES LTD JALANDHAR | 0 | 0 | 0 | 0 | 1 | 0 | 0 | 0 | 0 | 0 | 1 | 0 | 2 | | EXCELLENT FIN-INVEST LTD | 0 | 0 | 0 | 1 | 0 | 0 | 0 | 0 | 0 | 0 | 0 | 0 | 1 | | FULLERTON INDIA CREDIT COMPANY LTD | 448 | 34 | 126 | 78 | 10 | 34 | 8 | 8 | 4 | 1 | 3 | 131 | 885 | | GOVE FINANCE LTD | 1 | 0 | 0 | 0 | 0 | 0 | 0 | 0 | 0 | 0 | 0 | 0 | 1 | | HERO FINANCIAL SERVICES LTD | 2 | 0 | 0 | 0 | 0 | 0 | 0 | 0 | 0 | 0 | 0 | 0 | 2 | | INDO ASIA FINANCE LTD | 1 | 0 | 0 | 0 | 0 | 0 | 0 | 0 | 0 | 0 | 0 | 0 | 1 | | INTEGRATED FINANCE COMPANY LTD | 1 | 0 | 0 | 0 | 1 | 0 | 0 | 0 | 0 | 0 | 0 | 0 | 2 | | KANAK INSTALMENTS LTD | 1 | 0 | 0 | 0 | 0 | 0 | 0 | 0 | 0 | 0 | 0 | 0 | 1 | | KERALA STATE POWER AND INFRASTRUCTURE FINANCE CORPORATION LTD | 0 | 1 | 0 | 0 | 0 | 0 | 0 | 0 | 0 | 0 | 0 | 0 | 1 | | KOTAK MAHINDRA FINANCE LTD | 1 | 1 | 0 | 1 | 0 | 0 | 0 | 0 | 0 | 0 | 0 | 0 | 3 | | LLOYDS FINANCE LTD | 1 | 0 | 0 | 0 | 0 | 0 | 0 | 0 | 0 | 0 | 0 | 0 | 1 | | MAHINDRA & MAHINDRA FINANCIAL SERVICES LTD | 185 | 12 | 43 | 40 | 1 | 19 | 5 | 4 | 1 | 1 | 3 | 33 | 347 | | MUTHOOT VEHICLE & ASSET FINANCE LTD | 2 | 1 | 4 | 1 | 0 | 0 | 0 | 0 | 0 | 0 | 1 | 1 | 10 | | MUTHOOT CAPITAL SERVICES LTD | 4 | 0 | 5 | 1 | 1 | 1 | 2 | 0 | 0 | 0 | 0 | 1 | 15 | | NEWLINK OVERSEAS FINANCE LTD | 2 | 0 | 0 | 0 | 1 | 0 | 0 | 0 | 0 | 0 | 0 | 0 | 3 | | P. H. F. LEASING LTD | 1 | 0 | 1 | 1 | 0 | 0 | 0 | 0 | 0 | 0 | 0 | 0 | 3 | | P. K. F. FINANCE LTD | 1 | 0 | 0 | 0 | 0 | 0 | 0 | 0 | 0 | 0 | 0 | 0 | 1 | | PUNJAB KASHMIR FINANCE LTD | 5 | 1 | 0 | 1 | 0 | 0 | 0 | 0 | 0 | 0 | 0 | 0 | 7 | | S P R FINANCE LTD | 0 | 0 | 0 | 0 | 0 | 0 | 0 | 0 | 0 | 1 | 0 | 0 | 1 | | SAHARA INDIA FINANCIAL CORPORATION LTD | 1 | 0 | 0 | 0 | 0 | 0 | 0 | 0 | 0 | 0 | 0 | 0 | 1 | | SAKTHI FINANCE LTD | 7 | 0 | 0 | 0 | 0 | 0 | 0 | 0 | 0 | 0 | 0 | 0 | 7 | | SAVERY TRANSPORT FINANCE LTD | 4 | 0 | 0 | 0 | 0 | 0 | 0 | 0 | 0 | 0 | 0 | 0 | 4 | | SEYAD SHARIAT FINANCE LTD | 0 | 0 | 0 | 0 | 0 | 0 | 0 | 0 | 0 | 0 | 0 | 3 | 3 | | SHRIRAM CITY UNION FINANCE LTD | 210 | 9 | 44 | 24 | 6 | 17 | 12 | 1 | 0 | 0 | 2 | 26 | 351 | | SHRIRAM TRANSPORT FINANCE COMPANY LTD | 104 | 2 | 20 | 19 | 2 | 7 | 7 | 5 | 1 | 0 | 2 | 13 | 182 | | SINGHLAND INVESTMENT LTD | 0 | 0 | 0 | 0 | 1 | 0 | 0 | 0 | 0 | 0 | 0 | 0 | 1 | | STAR INSTALMENT SUPPLY CO. LTD | 0 | 0 | 1 | 0 | 0 | 0 | 0 | 0 | 0 | 0 | 0 | 0 | 1 | | SUNDARAM FINANCE LTD | 30 | 2 | 12 | 0 | 0 | 4 | 2 | 1 | 0 | 0 | 1 | 5 | 57 | | SYNERGY FINANCIAL EXCHANGE LTD | 0 | 0 | 0 | 0 | 1 | 0 | 0 | 0 | 0 | 0 | 0 | 0 | 1 | | TAMILNADU INDUSTRIAL DEVELOPMENT CORPORATION LTD | 0 | 0 | 0 | 0 | 0 | 0 | 0 | 0 | 0 | 0 | 0 | 1 | 1 | | TAMILNADU POWER FINANCE AND INFRASTRUCTURE DEVELOPMENT CORPORATION LTD | 20 | 0 | 1 | 1 | 7 | 1 | 0 | 0 | 0 | 0 | 8 | 8 | 46 | | TAMILNADU TRANSPORT DEVELOPMENT FINANCE CORPORATION LTD | 4 | 0 | 0 | 0 | 3 | 0 | 0 | 0 | 0 | 0 | 1 | 0 | 8 | | TATA FINANCE LTD | 2 | 0 | 0 | 1 | 1 | 0 | 0 | 0 | 0 | 0 | 0 | 1 | 5 | | THE PEERLESS GENERAL FINANCE & INVESTMENT COMPANY LTD | 5 | 0 | 0 | 0 | 0 | 1 | 0 | 0 | 0 | 0 | 0 | 0 | 6 | | UMEED LEASING & FINANCE LTD | 1 | 0 | 2 | 0 | 0 | 0 | 0 | 0 | 0 | 0 | 0 | 0 | 3 | | UPWARD FINANCIAL SERVICES LTD | 0 | 0 | 1 | 0 | 0 | 0 | 0 | 0 | 0 | 0 | 0 | 0 | 1 | | WEST BENGAL INDUSTRIAL DEVELOPMENT CORPN. LTD | 0 | 0 | 0 | 2 | 0 | 0 | 0 | 0 | 0 | 0 | 0 | 0 | 2 | | WEST BENGAL INFRASTRUCTURE DEVELOPMENT FINANCE CORPN | 0 | 0 | 0 | 1 | 0 | 0 | 0 | 0 | 0 | 0 | 0 | 0 | 1 | | TOTAL | 4712 | 338 | 923 | 1125 | 87 | 450 | 89 | 115 | 35 | 22 | 86 | 859 | 8841 | | NON-DEPOSIT TAKING NBFCs | | ABANS FINANCE PVT LTD | 0 | 0 | 0 | 0 | 0 | 0 | 0 | 0 | 0 | 0 | 0 | 1 | 1 | | A & A CAPITAL SERVICES PVT LTD | 0 | 0 | 0 | 1 | 1 | 0 | 0 | 0 | 0 | 0 | 0 | 0 | 2 | | A K CAPITAL FINANCE PVT LTD | 1 | 0 | 1 | 1 | 0 | 0 | 0 | 1 | 0 | 0 | 0 | 1 | 5 | | A S CONFIN PVT LTD | 0 | 0 | 0 | 0 | 0 | 0 | 1 | 0 | 0 | 0 | 0 | 0 | 1 | | AAGAM HOLDINGS PVT LTD | 0 | 0 | 1 | 0 | 0 | 0 | 0 | 0 | 0 | 0 | 0 | 0 | 1 | | AARKAY INVESTMENTS (P) LTD | 0 | 1 | 0 | 0 | 0 | 0 | 0 | 0 | 0 | 0 | 0 | 0 | 1 | | ACG LEASING PVT LTD | 1 | 0 | 0 | 0 | 0 | 0 | 0 | 0 | 0 | 0 | 0 | 0 | 1 | | ACME RESOURCES LTD | 0 | 0 | 0 | 0 | 1 | 1 | 0 | 0 | 0 | 0 | 0 | 0 | 2 | | ADANI CAPITAL PVT LTD | 1 | 0 | 2 | 0 | 0 | 1 | 1 | 0 | 0 | 1 | 0 | 1 | 7 | | ADITYA BIRLA CAPITAL LTD | 90 | 3 | 3 | 4 | 2 | 2 | 0 | 0 | 0 | 0 | 0 | 14 | 118 | | ADITYA BIRLA FINANCE LTD | 351 | 33 | 180 | 61 | 15 | 38 | 16 | 15 | 5 | 5 | 7 | 111 | 837 | | ADVENTZ FINANCE PVT LTD | 0 | 0 | 0 | 0 | 0 | 0 | 0 | 1 | 0 | 0 | 0 | 1 | 2 | | AKG FINVEST | 1 | 0 | 0 | 0 | 0 | 0 | 0 | 0 | 0 | 0 | 0 | 0 | 1 | | AKME FINCON LTD | 3 | 0 | 0 | 0 | 0 | 0 | 0 | 0 | 0 | 0 | 0 | 0 | 3 | | ALTHAEA FINANCE & LEASING PVT LTD | 1 | 0 | 0 | 0 | 0 | 0 | 0 | 0 | 0 | 0 | 0 | 0 | 1 | | ALTICO CAPITAL INDIA LTD | 11 | 0 | 0 | 0 | 0 | 1 | 0 | 0 | 0 | 0 | 0 | 0 | 12 | | ANAND RATHI GLOBAL FINANCE LTD | 6 | 1 | 3 | 0 | 0 | 2 | 0 | 0 | 0 | 0 | 0 | 2 | 14 | | ANANYA FINANCE FOR INCLUSIVE GROWTH PVT LTD | 0 | 0 | 1 | 0 | 0 | 0 | 0 | 0 | 0 | 0 | 0 | 0 | 1 | | ANASHRI FINVEST LTD | 1 | 0 | 0 | 0 | 0 | 0 | 0 | 0 | 0 | 0 | 0 | 0 | 1 | | ANNAPURNA MICROFINANCE PVT LTD | 8 | 1 | 0 | 4 | 0 | 2 | 1 | 0 | 0 | 0 | 0 | 4 | 20 | | APHELION FINANCE PVT LTD | 2 | 0 | 0 | 0 | 0 | 0 | 0 | 0 | 0 | 0 | 0 | 1 | 3 | | APOLLO FINANCE LTD | 1 | 0 | 0 | 0 | 0 | 0 | 0 | 0 | 0 | 0 | 0 | 0 | 1 | | APOLLO FINVEST (INDIA) LTD | 0 | 0 | 0 | 0 | 0 | 0 | 0 | 1 | 0 | 0 | 0 | 0 | 1 | | APOLLO TRADING AND FINANCE PVT LTD | 0 | 0 | 0 | 1 | 0 | 0 | 1 | 0 | 0 | 0 | 0 | 1 | 3 | | ARIS CAPITAL PVT LTD | 1 | 0 | 0 | 0 | 0 | 0 | 0 | 0 | 0 | 0 | 0 | 1 | 2 | | AROHAN FINANCIAL SERVICES PVT LTD | 10 | 2 | 1 | 0 | 0 | 1 | 0 | 0 | 0 | 0 | 0 | 0 | 14 | | ASA INTERNATIONAL INDIA MICRO FINANCE PVT LTD | 1 | 0 | 0 | 0 | 0 | 0 | 0 | 0 | 0 | 0 | 0 | 0 | 1 | | ASHISH FISCAL SERVICES PVT LTD | 3 | 0 | 3 | 0 | 0 | 0 | 0 | 0 | 0 | 0 | 0 | 0 | 6 | | ASHISH SECURITIES PVT LTD | 96 | 20 | 8 | 1 | 0 | 6 | 0 | 0 | 0 | 0 | 0 | 2 | 133 | | ASHV FINANCE LTD | 0 | 1 | 0 | 0 | 0 | 0 | 0 | 0 | 0 | 0 | 0 | 0 | 1 | | AVAIL FINANCIAL SERVICES PVT LTD | 7 | 0 | 3 | 2 | 0 | 0 | 0 | 0 | 0 | 0 | 0 | 6 | 18 | | AVANSE FINANCIAL SERVICES LTD | 30 | 2 | 12 | 5 | 1 | 5 | 0 | 0 | 0 | 0 | 0 | 14 | 69 | | AXIS FINANCE LTD | 6 | 0 | 0 | 0 | 0 | 1 | 1 | 0 | 0 | 0 | 0 | 1 | 9 | | AYE FINANCE PVT LTD | 6 | 1 | 0 | 1 | 0 | 0 | 0 | 1 | 0 | 0 | 0 | 0 | 9 | | BAID LEASING & FINANCE CO. LTD | 1 | 0 | 1 | 1 | 0 | 0 | 0 | 0 | 0 | 0 | 0 | 1 | 4 | | BAJAJ AUTO HOLDINGS LTD | 5 | 0 | 0 | 0 | 0 | 0 | 0 | 0 | 0 | 0 | 0 | 0 | 5 | | BAJAJ FINVEST PVT LTD | 46 | 0 | 0 | 3 | 0 | 1 | 0 | 1 | 0 | 0 | 2 | 2 | 55 | | BAJAJ LEASING AND FINANCE LTD | 12 | 0 | 0 | 0 | 0 | 0 | 0 | 0 | 0 | 0 | 0 | 0 | 12 | | BANDHAN FINANCIAL SERVICES LTD | 1 | 0 | 0 | 0 | 0 | 1 | 0 | 1 | 0 | 0 | 1 | 1 | 5 | | BARCLAYS INVESTMENTS & LOANS (INDIA) LTD. | 7 | 0 | 0 | 1 | 0 | 1 | 0 | 0 | 0 | 0 | 1 | 1 | 11 | | BARODA AGENTS & TRADING CO PVT LTD | 0 | 0 | 0 | 0 | 0 | 0 | 0 | 0 | 0 | 0 | 1 | 0 | 1 | | BELSTAR INVESTMENT AND FINANCE PVT LTD | 1 | 0 | 1 | 0 | 0 | 0 | 0 | 0 | 0 | 0 | 0 | 0 | 2 | | BEST CAPITAL SERVICES LTD | 2 | 0 | 0 | 0 | 0 | 0 | 0 | 0 | 0 | 0 | 0 | 0 | 2 | | BHADANI FINANCERS (P) LTD | 1 | 0 | 0 | 0 | 0 | 0 | 0 | 0 | 0 | 0 | 0 | 0 | 1 | | BHANIX FINANCE & INVESTMENT LTD | 143 | 11 | 15 | 6 | 1 | 20 | 0 | 0 | 0 | 0 | 2 | 5 | 203 | | BLUE JAY FINLEASE LTD | 8 | 0 | 2 | 0 | 0 | 0 | 0 | 0 | 0 | 0 | 0 | 2 | 12 | | BMW FIN-INVEST PVT LTD | 1 | 0 | 0 | 0 | 0 | 0 | 0 | 0 | 0 | 0 | 0 | 0 | 1 | | BSS MICROFINANCE PVT LTD | 0 | 0 | 1 | 0 | 0 | 0 | 0 | 0 | 0 | 0 | 0 | 0 | 1 | | C MAHENDRA CAPITAL LTD | 1 | 0 | 0 | 0 | 0 | 0 | 0 | 0 | 0 | 0 | 0 | 0 | 1 | | CANBANK FACTORS LTD | 2 | 0 | 0 | 0 | 0 | 0 | 0 | 0 | 0 | 0 | 0 | 0 | 2 | | CAPARO FINANCIAL SOLUTIONS LTD | 1 | 0 | 0 | 0 | 0 | 0 | 0 | 0 | 0 | 0 | 1 | 0 | 2 | | CAPFLOAT FINANCIAL SERVICES PVT LTD. | 57 | 5 | 21 | 10 | 3 | 8 | 1 | 2 | 2 | 0 | 0 | 14 | 123 | | CAPITAL INDIA FINANCE LTD | 1 | 0 | 0 | 0 | 1 | 0 | 0 | 4 | 0 | 0 | 0 | 3 | 9 | | CAPITAL TRUST LTD | 7 | 1 | 0 | 1 | 1 | 0 | 0 | 0 | 0 | 0 | 0 | 3 | 13 | | CAPRI GLOBAL CAPITAL LTD | 49 | 14 | 14 | 10 | 2 | 2 | 1 | 2 | 1 | 1 | 1 | 17 | 114 | | CENTRUM FINANCIAL SERVICES LTD | 1 | 0 | 0 | 0 | 0 | 1 | 1 | 0 | 0 | 0 | 0 | 0 | 3 | | CHADHA FINANCE PVT LTD | 1 | 0 | 0 | 0 | 0 | 0 | 0 | 0 | 0 | 0 | 0 | 0 | 1 | | CHAITANYA RURAL INTERMEDIATION DEVELOPMENT SERVICES PVT LTD | 0 | 0 | 2 | 0 | 0 | 0 | 0 | 0 | 0 | 0 | 0 | 0 | 2 | | CHOKHANI SECURITIES LTD | 1 | 0 | 0 | 0 | 0 | 0 | 0 | 0 | 0 | 0 | 0 | 0 | 1 | | CHOLAMANDALAM FACTORING LTD | 1 | 0 | 0 | 0 | 0 | 0 | 0 | 0 | 0 | 0 | 0 | 0 | 1 | | CHOLAMANDALAM INVESTMENT AND FINANCE COMPANY LTD | 329 | 17 | 80 | 36 | 7 | 25 | 17 | 8 | 0 | 0 | 2 | 81 | 602 | | CLIX CAPITAL SERVICES PVT LTD | 51 | 3 | 5 | 8 | 0 | 2 | 1 | 2 | 1 | 0 | 0 | 11 | 84 | | CLIX FINANCE INDIA PVT LTD | 12 | 0 | 0 | 0 | 0 | 4 | 0 | 0 | 0 | 0 | 0 | 1 | 17 | | CREDIT SUISSE FINANCE (INDIA) PVT LTD | 1 | 0 | 1 | 0 | 0 | 0 | 0 | 0 | 0 | 0 | 0 | 0 | 2 | | CREDITACCESS GRAMEEN LTD | 3 | 0 | 0 | 0 | 0 | 0 | 0 | 0 | 0 | 0 | 0 | 1 | 4 | | CSL FINANCE LTD | 1 | 0 | 1 | 0 | 0 | 0 | 0 | 0 | 0 | 0 | 0 | 0 | 2 | | DATSON EXPORTS LTD | 3 | 0 | 0 | 0 | 0 | 0 | 0 | 0 | 0 | 0 | 0 | 0 | 3 | | DEALING BENEFICIAL FINANCIAL SERVICES PVT LTD | 1 | 0 | 0 | 0 | 0 | 0 | 0 | 0 | 0 | 0 | 0 | 0 | 1 | | DEWAN MOTORS INVESTMENT & FINANCE LTD | 2 | 0 | 4 | 0 | 1 | 2 | 1 | 1 | 0 | 0 | 0 | 2 | 13 | | DHANALAKSHMI HIRE PURCHASE & LEASING (P) LTD | 1 | 0 | 0 | 0 | 0 | 0 | 0 | 0 | 0 | 0 | 0 | 0 | 1 | | DRP TRADING & INVESTMENTS (P) LTD | 0 | 0 | 2 | 0 | 0 | 0 | 0 | 0 | 0 | 0 | 0 | 0 | 2 | | EDELWEISS FINANCE & INVESTMENTS LTD | 35 | 1 | 5 | 2 | 1 | 12 | 0 | 0 | 2 | 0 | 0 | 10 | 68 | | EDELWEISS RETAIL FINANCE LTD | 12 | 3 | 5 | 5 | 2 | 0 | 1 | 0 | 0 | 0 | 0 | 5 | 33 | | ELECTRONICA FINANCE LTD | 7 | 1 | 1 | 0 | 0 | 0 | 0 | 0 | 0 | 0 | 0 | 1 | 10 | | EMERALD COMPANY PVT LTD | 0 | 0 | 1 | 0 | 0 | 0 | 0 | 0 | 0 | 0 | 0 | 0 | 1 | | EPIMONEY PVT LTD | 4 | 0 | 2 | 2 | 0 | 1 | 0 | 0 | 0 | 0 | 0 | 1 | 10 | | ESS KAY FINCORP LTD | 7 | 1 | 2 | 1 | 0 | 0 | 2 | 0 | 0 | 0 | 1 | 5 | 19 | | ESSEL FINANCE BUSINESS LOANS LTD | 0 | 0 | 0 | 0 | 1 | 0 | 0 | 0 | 0 | 0 | 0 | 0 | 1 | | EWS FINANCE AND INVESTMENTS PVT LTD | 15 | 0 | 0 | 0 | 7 | 0 | 0 | 10 | 0 | 0 | 0 | 0 | 32 | | FINCARE FINANCE PVT LTD | 0 | 0 | 0 | 1 | 0 | 0 | 0 | 0 | 0 | 0 | 0 | 0 | 1 | | FINKURVE FINANCIAL SERVICES LTD | 1 | 0 | 0 | 0 | 0 | 0 | 0 | 0 | 0 | 0 | 0 | 0 | 1 | | FINO FINANCE PVT LTD | 2 | 0 | 0 | 0 | 0 | 0 | 0 | 0 | 0 | 0 | 0 | 0 | 2 | | FINOVA CAPITAL PVT LTD | 2 | 0 | 1 | 0 | 0 | 1 | 0 | 0 | 0 | 0 | 0 | 3 | 7 | | FIVE STAR BUSINESS FINANCE LTD | 11 | 0 | 2 | 1 | 0 | 0 | 0 | 0 | 0 | 0 | 0 | 1 | 15 | | FUSION MICROFINANCE PVT LTD | 0 | 1 | 0 | 0 | 0 | 0 | 0 | 0 | 0 | 0 | 0 | 0 | 1 | | GEO VPL FINANCE PVTLTD | 2 | 0 | 0 | 0 | 0 | 0 | 0 | 0 | 0 | 0 | 0 | 0 | 2 | | GEOJIT CREDITS (P) LTD | 0 | 0 | 1 | 0 | 0 | 0 | 0 | 0 | 0 | 0 | 0 | 0 | 1 | | GOYAL ASSOCIATES LTD | 1 | 0 | 0 | 0 | 0 | 0 | 0 | 0 | 0 | 0 | 0 | 0 | 1 | | HARTON PVT LTD | 0 | 0 | 0 | 1 | 0 | 0 | 0 | 0 | 0 | 0 | 0 | 0 | 1 | | HDB FINANCIAL SERVICES LTD | 546 | 71 | 143 | 76 | 15 | 43 | 4 | 9 | 6 | 0 | 14 | 136 | 1063 | | HDFC INVESTMENTS LTD | 6 | 0 | 3 | 3 | 2 | 1 | 3 | 0 | 0 | 0 | 0 | 3 | 21 | | HELP FINANCE LTD | 0 | 0 | 0 | 0 | 1 | 0 | 0 | 0 | 0 | 0 | 0 | 0 | 1 | | HERO FINCORP LTD | 144 | 4 | 36 | 22 | 3 | 11 | 1 | 7 | 0 | 3 | 3 | 32 | 266 | | HOME CREDIT INDIA FINANCE PVT LTD | 278 | 23 | 59 | 55 | 10 | 34 | 3 | 4 | 6 | 1 | 19 | 69 | 561 | | HONHAR INVESTMENTS LTD | 1 | 0 | 0 | 0 | 0 | 0 | 0 | 0 | 0 | 0 | 0 | 0 | 1 | | HSBC INVESTDIRECT FINANCIAL SERVICES (INDIA) LTD | 0 | 0 | 0 | 0 | 0 | 1 | 0 | 0 | 0 | 0 | 0 | 0 | 1 | | ICICI SECURITIES PRIMARYDEALERSHIP LTD | 5 | 0 | 2 | 1 | 0 | 0 | 0 | 2 | 0 | 0 | 0 | 1 | 11 | | ICL FINCORP LTD | 6 | 0 | 0 | 0 | 0 | 0 | 0 | 0 | 0 | 0 | 0 | 0 | 6 | | IDFC LTD | 3 | 0 | 9 | 7 | 5 | 1 | 0 | 1 | 0 | 0 | 3 | 1 | 30 | | IFCI FACTORS LTD | 0 | 0 | 0 | 0 | 1 | 0 | 0 | 0 | 0 | 0 | 1 | 0 | 2 | | IIFL WEALTH FINANCE LTD | 32 | 0 | 6 | 8 | 3 | 10 | 7 | 1 | 0 | 0 | 0 | 13 | 80 | | IKF FINANCE LTD | 3 | 0 | 2 | 0 | 1 | 1 | 0 | 0 | 0 | 0 | 0 | 2 | 9 | | INDEL MONEY PVT LTD | 2 | 0 | 0 | 0 | 0 | 0 | 0 | 0 | 0 | 0 | 0 | 0 | 2 | | INDIABULLS CONSUMER FINANCE LTD | 675 | 36 | 206 | 262 | 39 | 105 | 18 | 22 | 13 | 5 | 17 | 236 | 1634 | | INDIABULLS FINANCE COMPANY PVT LTD | 28 | 3 | 0 | 1 | 2 | 4 | 0 | 0 | 0 | 0 | 3 | 7 | 48 | | INDIAN RENEWABLE ENERGY DEVELOPMENT AGENCY LTD | 1 | 0 | 1 | 0 | 0 | 0 | 0 | 0 | 0 | 0 | 0 | 0 | 2 | | INDIAN SCHOOL FINANCECOMPANY PVT LTD | 5 | 1 | 0 | 0 | 1 | 1 | 1 | 0 | 0 | 0 | 0 | 0 | 9 | | INTEC CAPITAL LTD | 12 | 0 | 1 | 1 | 0 | 0 | 0 | 0 | 0 | 0 | 0 | 1 | 15 | | INTELLECASH MICROFINANCE NETWORK COMPANY PVT LTD | 0 | 0 | 0 | 0 | 0 | 1 | 0 | 0 | 0 | 0 | 0 | 0 | 1 | | JALAN CHEMICAL INDUSTRIES (P) LTD | 10 | 1 | 2 | 1 | 0 | 0 | 0 | 0 | 0 | 0 | 1 | 3 | 18 | | JFC FINANCE (INDIA) LTD | 0 | 0 | 1 | 0 | 0 | 0 | 0 | 0 | 0 | 1 | 0 | 0 | 2 | | JM FINANCIAL CAPITAL LTD | 0 | 0 | 0 | 0 | 0 | 0 | 0 | 0 | 0 | 0 | 1 | 0 | 1 | | JM FINANCIAL CREDIT SOLUTIONS LTD | 1 | 1 | 0 | 0 | 0 | 0 | 0 | 0 | 0 | 0 | 0 | 0 | 2 | | JM FINANCIAL PRODUCTS LTD | 1 | 0 | 0 | 0 | 0 | 0 | 0 | 0 | 0 | 0 | 0 | 0 | 1 | | JUMBO FINANCE LTD | 2 | 0 | 1 | 0 | 0 | 0 | 0 | 1 | 0 | 0 | 0 | 1 | 5 | | K.G.S.CAPITALS PVTLTD | 1 | 0 | 0 | 0 | 0 | 0 | 0 | 0 | 0 | 0 | 0 | 0 | 1 | | KAILASH AUTO FINANCE LTD | 2 | 0 | 0 | 0 | 0 | 0 | 0 | 0 | 0 | 0 | 0 | 0 | 2 | | KANAKADURGA FINANCELTD | 1 | 0 | 0 | 1 | 0 | 0 | 0 | 0 | 0 | 0 | 0 | 0 | 2 | | KARVY FINANCIAL SERVICES LTD | 6 | 4 | 1 | 0 | 2 | 0 | 0 | 0 | 0 | 0 | 2 | 1 | 16 | | KAYGEE INVESMENTS PVT LTD | 0 | 0 | 0 | 1 | 0 | 0 | 0 | 0 | 0 | 0 | 0 | 0 | 1 | | KEMEX ENGINEERING (P) LTD | 1 | 0 | 0 | 0 | 0 | 0 | 0 | 0 | 0 | 0 | 0 | 0 | 1 | | KKR INDIA ASSET FINANCE PVT LTD | 2 | 0 | 0 | 0 | 0 | 0 | 0 | 0 | 0 | 0 | 0 | 0 | 2 | | KOGTA FINANCIAL (INDIA) LTD | 7 | 0 | 0 | 0 | 1 | 0 | 0 | 0 | 0 | 0 | 0 | 3 | 11 | | KOSAMATTAM FINANCELTD | 9 | 0 | 0 | 0 | 0 | 0 | 0 | 0 | 0 | 0 | 0 | 0 | 9 | | KOTAK INVESTMENTS LTD | 0 | 0 | 0 | 1 | 0 | 0 | 0 | 0 | 0 | 0 | 0 | 0 | 1 | | KOTAK MAHINDRA CAPITAL CO. | 1 | 0 | 0 | 0 | 0 | 0 | 0 | 0 | 0 | 0 | 0 | 0 | 1 | | KOTAK MAHINDRA INVESTMENTS LTD | 4 | 0 | 0 | 0 | 0 | 0 | 0 | 0 | 0 | 0 | 0 | 0 | 4 | | KOTAK MAHINDRA PRIME LTD | 230 | 19 | 63 | 70 | 3 | 15 | 6 | 0 | 0 | 1 | 1 | 109 | 517 | | KRAZYBEE SERVICES PVT LTD | 5 | 0 | 2 | 0 | 0 | 1 | 0 | 1 | 0 | 0 | 0 | 1 | 10 | | L & T FINANCE LTD | 131 | 4 | 27 | 35 | 2 | 21 | 6 | 5 | 1 | 1 | 0 | 21 | 254 | | LAXMI INDIA FINLEASECAP PVT LTD | 5 | 0 | 3 | 1 | 0 | 0 | 0 | 0 | 0 | 0 | 0 | 0 | 9 | | LENDINGKART FINANCE LTD | 121 | 5 | 49 | 33 | 2 | 30 | 1 | 1 | 2 | 1 | 2 | 25 | 272 | | LITTLEMAN FISCAL SERVICES PVT LTD | 1 | 0 | 0 | 0 | 0 | 0 | 0 | 0 | 0 | 0 | 0 | 0 | 1 | | LKP FINANCE LTD | 0 | 0 | 1 | 0 | 0 | 0 | 0 | 0 | 0 | 0 | 1 | 0 | 2 | | LLOYDS COMMERCIAL (P) LTD | 1 | 0 | 0 | 0 | 0 | 0 | 0 | 0 | 0 | 0 | 0 | 0 | 1 | | LOTUS CAPITAL FINANCIAL SERVICES LTD | 3 | 0 | 0 | 0 | 0 | 2 | 0 | 0 | 0 | 0 | 0 | 0 | 5 | | LOTUS SREE FILCO PVT LTD | 6 | 2 | 0 | 0 | 0 | 1 | 0 | 0 | 0 | 0 | 0 | 0 | 9 | | LUCKY HOLDINGS PVT LTD | 0 | 0 | 0 | 0 | 1 | 0 | 0 | 0 | 0 | 0 | 0 | 0 | 1 | | MAG FINSERV CO. LTD | 1 | 1 | 0 | 0 | 0 | 0 | 0 | 0 | 0 | 0 | 0 | 0 | 2 | | MAGMA FINCORP LTD | 95 | 4 | 29 | 19 | 2 | 10 | 5 | 3 | 4 | 1 | 2 | 21 | 195 | | MAHAVEER FINANCE INDIA LTD | 0 | 0 | 1 | 0 | 0 | 0 | 0 | 0 | 0 | 0 | 0 | 3 | 4 | | MAHINDRA HOLDINGS & FINANCE LTD | 6 | 0 | 0 | 2 | 0 | 0 | 0 | 0 | 0 | 0 | 0 | 0 | 8 | | MANAPPURAM ASSET FINANCE LTD | 1 | 0 | 1 | 0 | 0 | 0 | 0 | 0 | 0 | 0 | 0 | 0 | 2 | | MANAPPURAM FINANCE LTD | 75 | 17 | 25 | 8 | 2 | 4 | 1 | 4 | 0 | 0 | 2 | 11 | 149 | | MANBA FINANCE PVT LTD | 36 | 0 | 13 | 1 | 1 | 3 | 2 | 0 | 1 | 0 | 1 | 2 | 60 | | MARUTI COUNTRYWIDE AUTO FINANCIAL SERVICES PVT LTD | 1 | 0 | 1 | 0 | 0 | 0 | 0 | 0 | 0 | 0 | 0 | 0 | 2 | | MAS FINANCIAL SERVICES LTD | 2 | 0 | 1 | 1 | 0 | 0 | 0 | 0 | 0 | 1 | 1 | 1 | 7 | | MAXVALUE CREDITS & INVESTMENTS (P) LTD | 0 | 0 | 0 | 1 | 0 | 0 | 2 | 0 | 0 | 0 | 0 | 0 | 3 | | MAYOGA INVESTMENTS LTD | 0 | 1 | 0 | 0 | 0 | 0 | 0 | 0 | 0 | 0 | 0 | 0 | 1 | | MEGA ASSETS & CAPITAL MANAGEMENT P LTD | 1 | 0 | 0 | 0 | 0 | 0 | 0 | 0 | 0 | 0 | 0 | 0 | 1 | | MICRO FINANCE PVT LTD | 1 | 0 | 0 | 0 | 0 | 0 | 0 | 0 | 0 | 0 | 0 | 0 | 1 | | MICRO MANAGEMENT LTD | 1 | 0 | 0 | 0 | 0 | 0 | 0 | 0 | 0 | 0 | 0 | 0 | 1 | | MIDLAND MICROFIN LTD | 1 | 0 | 0 | 0 | 0 | 0 | 0 | 0 | 0 | 0 | 0 | 0 | 1 | | MONEYWISE FINANCIAL SERVICES PVT LTD | 6 | 0 | 0 | 0 | 0 | 1 | 0 | 0 | 0 | 0 | 1 | 1 | 9 | | MOTILAL MAKHANLAL HOLDINGS (P) LTD | 1 | 0 | 0 | 0 | 0 | 0 | 0 | 0 | 0 | 0 | 0 | 0 | 1 | | MOUNT INTRA FINANCE PVT LTD | 1 | 0 | 0 | 0 | 0 | 0 | 0 | 0 | 0 | 0 | 0 | 1 | 2 | | MOUNT SHIKHAR FINANCIAL SERVICES LTD | 1 | 0 | 0 | 0 | 0 | 0 | 0 | 0 | 0 | 0 | 0 | 0 | 1 | | MSM MICROFINANCE LTD | 3 | 0 | 0 | 0 | 0 | 0 | 0 | 0 | 0 | 0 | 0 | 0 | 3 | | MUTHOOT MICROFIN LTD | 3 | 0 | 1 | 2 | 0 | 0 | 0 | 0 | 0 | 0 | 0 | 2 | 8 | | MUTHOOT MONEY PVT LTD | 3 | 0 | 0 | 0 | 0 | 0 | 0 | 0 | 0 | 0 | 0 | 0 | 3 | | NABARD FINANCIAL SERVICES LTD | 0 | 0 | 1 | 0 | 0 | 0 | 0 | 0 | 0 | 0 | 0 | 0 | 1 | | NAMAN FINANCE & INVESTMENT PVT LTD | 0 | 0 | 2 | 0 | 0 | 0 | 0 | 0 | 0 | 0 | 0 | 0 | 2 | | NAMDEV FINVEST PVT LTD | 2 | 0 | 0 | 0 | 0 | 0 | 0 | 0 | 0 | 0 | 0 | 0 | 2 | | NEOGROWTH CREDIT PVT LTD | 36 | 5 | 12 | 4 | 0 | 7 | 1 | 1 | 0 | 0 | 0 | 9 | 75 | | NISSAN RENAULT FINANCIAL SERVICES INDIA PVT LTD | 15 | 4 | 2 | 5 | 3 | 3 | 0 | 1 | 0 | 0 | 1 | 7 | 41 | | NIYOGIN FINTECH LTD | 4 | 0 | 1 | 0 | 0 | 0 | 0 | 0 | 0 | 0 | 0 | 0 | 5 | | NORTHERN ARC CAPITAL LTD | 8 | 2 | 5 | 0 | 1 | 1 | 0 | 0 | 0 | 0 | 0 | 1 | 18 | | OCEAN CAPITAL MARKET LTD | 0 | 0 | 1 | 0 | 0 | 0 | 0 | 0 | 0 | 0 | 0 | 0 | 1 | | ORANGE RETAIL FINANCE INDIA PVT LTD | 2 | 0 | 0 | 1 | 0 | 0 | 0 | 0 | 0 | 0 | 0 | 0 | 3 | | ORIX AUTO INFRASTRUCTURE SERVICES LTD | 0 | 0 | 0 | 1 | 1 | 0 | 0 | 0 | 0 | 0 | 0 | 0 | 2 | | P C MEDIA SYSTEMS LTD | 0 | 0 | 0 | 0 | 1 | 0 | 0 | 1 | 0 | 0 | 0 | 1 | 3 | | P N Y SABHA FINANCE LTD | 1 | 2 | 0 | 1 | 0 | 0 | 0 | 0 | 0 | 0 | 0 | 0 | 4 | | P.C. FINANCIAL SERVICES PVT LTD | 114 | 1 | 14 | 9 | 1 | 1 | 0 | 0 | 0 | 0 | 0 | 14 | 154 | | PAISALO DIGITAL LTD | 5 | 0 | 2 | 0 | 0 | 1 | 0 | 2 | 0 | 0 | 2 | 0 | 12 | | PHOENIX INVESTMENT P LTD | 1 | 0 | 0 | 0 | 0 | 0 | 0 | 0 | 0 | 0 | 0 | 0 | 1 | | PIRAMAL FINANCE & INVESTMENTS PVT LTD | 1 | 0 | 0 | 0 | 0 | 0 | 0 | 0 | 0 | 0 | 0 | 0 | 1 | | PIRAMAL FINANCE LTD | 1 | 0 | 0 | 0 | 0 | 0 | 0 | 0 | 0 | 0 | 0 | 0 | 1 | | POLYTEX INDIA LTD | 1 | 0 | 0 | 0 | 0 | 0 | 0 | 0 | 0 | 0 | 0 | 0 | 1 | | POOJA FINLEASE LTD | 1 | 0 | 1 | 2 | 0 | 0 | 0 | 0 | 0 | 0 | 0 | 0 | 4 | | POONAWALLA CREDIT PVT LTD | 0 | 0 | 1 | 0 | 0 | 0 | 0 | 0 | 0 | 0 | 1 | 0 | 2 | | POWER FINANCE CORPORATION LTD | 0 | 0 | 0 | 0 | 0 | 0 | 0 | 0 | 0 | 0 | 1 | 1 | 2 | | PROUD SECURITIES & CREDITS (P) LTD | 1 | 0 | 0 | 0 | 0 | 0 | 0 | 0 | 0 | 0 | 0 | 0 | 1 | | PUDHUAARU FINANCIAL SERVICES PVT LTD | 0 | 0 | 0 | 0 | 1 | 0 | 0 | 0 | 0 | 0 | 0 | 0 | 1 | | PUNJAB STATE INDUSTRIAL DEVELOPMENT CORP. LTD | 0 | 0 | 0 | 0 | 0 | 0 | 0 | 0 | 0 | 0 | 1 | 0 | 1 | | RATTANINDIA FINANCE PVT LTD | 7 | 3 | 4 | 0 | 0 | 0 | 0 | 2 | 0 | 0 | 0 | 2 | 18 | | RELIANCE CAPITAL LTD | 13 | 0 | 1 | 1 | 0 | 3 | 0 | 1 | 0 | 0 | 0 | 2 | 21 | | RELIANCE COMMERCIAL CO. LTD | 7 | 0 | 1 | 0 | 0 | 1 | 0 | 0 | 0 | 0 | 0 | 2 | 11 | | RELIGARE ENTERPRISESLTD | 0 | 0 | 0 | 2 | 0 | 0 | 2 | 0 | 0 | 0 | 0 | 1 | 5 | | RELIGARE FINVEST LTD | 32 | 0 | 5 | 3 | 0 | 2 | 2 | 0 | 0 | 0 | 1 | 3 | 48 | | RHINO FINANCE PVTLTD | 13 | 0 | 0 | 0 | 0 | 0 | 0 | 0 | 0 | 0 | 0 | 0 | 13 | | RIVIERA INVESTORS PVT LTD | 3 | 0 | 0 | 0 | 0 | 0 | 0 | 0 | 0 | 0 | 0 | 0 | 3 | | S M L FINANCE LTD | 0 | 0 | 1 | 0 | 0 | 1 | 0 | 0 | 0 | 0 | 0 | 0 | 2 | | S.M.I.L.E MICRO FINANCE LTD | 0 | 0 | 0 | 0 | 0 | 0 | 0 | 1 | 0 | 0 | 0 | 0 | 1 | | S.V.CREDITLINE PVT LTD | 0 | 0 | 1 | 0 | 0 | 0 | 0 | 0 | 0 | 0 | 0 | 0 | 1 | | SAAN POPULAR FINANCE PVT LTD | 2 | 0 | 0 | 0 | 0 | 0 | 0 | 0 | 0 | 0 | 0 | 0 | 2 | | SAI POINT FINANCE CORPORATION LTD | 1 | 0 | 0 | 0 | 0 | 0 | 0 | 0 | 0 | 0 | 0 | 0 | 1 | | SAMASTA MICROFINANCE LTD | 1 | 1 | 0 | 0 | 0 | 0 | 0 | 0 | 0 | 0 | 0 | 0 | 2 | | SATIN CREDITCARE NETWORK LTD | 7 | 0 | 0 | 1 | 0 | 0 | 0 | 0 | 0 | 0 | 0 | 2 | 10 | | SATYA MICROCAPITAL LTD | 1 | 0 | 0 | 0 | 0 | 0 | 0 | 0 | 0 | 0 | 0 | 1 | 2 | | SHAHA FINLEASE PVT LTD | 1 | 0 | 0 | 0 | 0 | 0 | 0 | 0 | 0 | 0 | 0 | 0 | 1 | | SHAPOORJI PALLONJI FINANCE PVT LTD | 0 | 0 | 0 | 1 | 0 | 0 | 0 | 0 | 0 | 0 | 0 | 0 | 1 | | SHIKHAR MICROFINANCE PVT LTD | 1 | 0 | 0 | 0 | 0 | 0 | 0 | 0 | 0 | 0 | 0 | 0 | 1 | | SHREE RAMANJANEYA LEASING & FINANCE PVT LTD | 1 | 0 | 0 | 0 | 0 | 0 | 0 | 0 | 0 | 0 | 0 | 0 | 1 | | SHRI RAM G FINANCIAL SERVICES LTD | 6 | 0 | 0 | 0 | 0 | 0 | 0 | 0 | 0 | 0 | 0 | 0 | 6 | | SHRIRAM OVERSEAS INVESTMENTS PVT LTD | 0 | 0 | 0 | 0 | 1 | 0 | 0 | 0 | 0 | 0 | 0 | 0 | 1 | | SIDVIK LEASING PVTLTD | 7 | 0 | 1 | 0 | 0 | 0 | 1 | 0 | 0 | 0 | 0 | 1 | 10 | | SONATA FINANCE PVT LTD- MFI | 1 | 0 | 0 | 0 | 0 | 0 | 1 | 0 | 0 | 0 | 0 | 0 | 2 | | SOUTH KERALA GENERAL FINANCE (P) LTD | 1 | 0 | 0 | 0 | 0 | 0 | 0 | 0 | 0 | 0 | 0 | 0 | 1 | | SREI INFRASTRUCTURE FINANCE LTD | 3 | 2 | 1 | 0 | 0 | 0 | 0 | 0 | 0 | 0 | 0 | 0 | 6 | | STARAGRI FINANCE LTD | 2 | 0 | 0 | 1 | 0 | 0 | 2 | 0 | 0 | 0 | 0 | 2 | 7 | | SUBHAM CAPITAL PVT LTD | 1 | 0 | 0 | 1 | 0 | 0 | 0 | 0 | 0 | 0 | 0 | 0 | 2 | | SUNDRAM FASTENERS INVESTMENTS LTD | 2 | 0 | 0 | 0 | 0 | 0 | 0 | 0 | 0 | 0 | 0 | 0 | 2 | | TAB CAPITAL LTD | 1 | 0 | 0 | 0 | 0 | 0 | 0 | 0 | 0 | 0 | 0 | 0 | 1 | | TATA INVESTMENT CORPORATION LTD | 2 | 0 | 0 | 0 | 0 | 0 | 0 | 0 | 0 | 0 | 0 | 0 | 2 | | TATA MOTORS FINANCE LTD | 44 | 2 | 7 | 12 | 0 | 10 | 0 | 0 | 0 | 0 | 0 | 3 | 78 | | TATA MOTORS FINANCE SOLUTIONS LTD | 10 | 0 | 4 | 8 | 1 | 2 | 0 | 2 | 0 | 0 | 1 | 13 | 41 | | TCI FINANCE LTD | 0 | 0 | 0 | 0 | 1 | 0 | 0 | 0 | 0 | 0 | 0 | 0 | 1 | | THE KARNATAKA STATE INDUSTRIAL & INFRASTRUCTURE DEVELOPMENT CORPORATION LTD | 0 | 0 | 1 | 0 | 0 | 0 | 0 | 0 | 0 | 0 | 0 | 0 | 1 | | THIRUMENI FINANCE PVT LTD | 6 | 0 | 1 | 0 | 0 | 0 | 0 | 0 | 0 | 0 | 0 | 1 | 8 | | TOURISM FINANCE CORPORATION OF INDIA LTD | 1 | 0 | 0 | 0 | 0 | 0 | 0 | 0 | 0 | 0 | 0 | 0 | 1 | | TRIDENT MICROFIN PVT LTD | 1 | 0 | 0 | 0 | 0 | 0 | 0 | 0 | 0 | 0 | 0 | 0 | 1 | | TVS FINANCE AND SERVICES LTD | 12 | 0 | 0 | 1 | 1 | 0 | 0 | 0 | 0 | 0 | 0 | 1 | 15 | | UAE EXCHANGE & FINANCIAL SERVICES LTD | 2 | 0 | 1 | 0 | 0 | 0 | 0 | 0 | 0 | 0 | 0 | 1 | 4 | | UJJIVAN FINANCIAL SERVICES LTD | 1 | 0 | 0 | 0 | 0 | 0 | 0 | 0 | 0 | 0 | 0 | 0 | 1 | | UNITED PETRO FINANCE LTD | 5 | 0 | 1 | 0 | 0 | 0 | 0 | 0 | 0 | 0 | 0 | 0 | 6 | | UP MONEY LTD | 4 | 0 | 0 | 0 | 0 | 1 | 0 | 0 | 0 | | 0 | 1 | 6 | | UPHAR FINVEST LTD | 0 | 0 | 0 | 0 | 0 | 0 | 0 | 0 | 0 | 0 | 0 | 1 | 1 | | USHA FINANCIAL SERVICES PVTLTD | 2 | 0 | 0 | 0 | 0 | 0 | 0 | 0 | 0 | 0 | 0 | 0 | 2 | | V S G LEASING & FINANCE CO LTD | 3 | 0 | 0 | 0 | 0 | 0 | 0 | 0 | 0 | 0 | 0 | 0 | 3 | | VANCHINAD FINANCE PVTLTD | 0 | 0 | 1 | 0 | 0 | 0 | 0 | 0 | 0 | 0 | 0 | 0 | 1 | | VEDIKA CREDIT CAPITAL LTD | 4 | 0 | 0 | 1 | 0 | 0 | 0 | 0 | 0 | 0 | 0 | 0 | 5 | | VILLAGE FINANCIAL SERVICES LTD | 1 | 0 | 0 | 0 | 0 | 0 | 0 | 0 | 0 | 0 | 0 | 0 | 1 | | VISAGE HOLDINGS AND FINANCE PVT LTD | 9 | 0 | 1 | 0 | 0 | 1 | 0 | 0 | 0 | 0 | 0 | 0 | 11 | | VISTAAR FINANCIAL SERVICES P LTD | 6 | 0 | 0 | 1 | 0 | 0 | 0 | 0 | 0 | 0 | 0 | 1 | 8 | | VISTAR FINANCIERS (P) LTD | 2 | 0 | 2 | 1 | 0 | 0 | 1 | 0 | 0 | 1 | 0 | 1 | 8 | | VISU LEASING AND FINANCE PVTLTD | 51 | 1 | 5 | 6 | 1 | 1 | 0 | 1 | 0 | 0 | 0 | 4 | 70 | | VLS FINANCE LTD | 2 | 0 | 0 | 0 | 0 | 0 | 0 | 0 | 0 | 0 | 0 | 0 | 2 | | VOLVO FINANCIAL SERVICES (INDIA) PVT LTD | 0 | 0 | 0 | 0 | 0 | 1 | 0 | 0 | 0 | 0 | 0 | 0 | 1 | | XANDER FINANCE PVT LTD | 2 | 0 | 0 | 0 | 0 | 0 | 0 | 0 | 0 | 0 | 0 | 0 | 2 | | YMS FINANCE PVT LTD | 0 | 0 | 0 | 1 | 0 | 1 | 0 | 0 | 0 | 0 | 0 | 0 | 2 | | YOGAKSHEMAM LOANS LTD | 2 | 0 | 0 | 0 | 0 | 0 | 0 | 0 | 0 | 0 | 0 | 0 | 2 | | TOTAL | 4507 | 343 | 1159 | 847 | 159 | 479 | 116 | 123 | 44 | 23 | 102 | 1115 | 9017 | | Newly Registered NBFCs | | ADITYA BIRLA FINANCIAL SERVICES PVT LTD | 39 | 0 | 2 | 0 | 0 | 0 | 0 | 0 | 0 | 0 | 0 | 0 | 41 | | ADMIRAL FINSTOCK PVT LTD | 1 | 0 | 0 | 0 | 0 | 0 | 0 | 0 | 0 | 0 | 0 | 0 | 1 | | AEON CREDIT SERVICE INDIA PVT LTD | 9 | 3 | 2 | 5 | 2 | 2 | 0 | 1 | 0 | 0 | 1 | 3 | 28 | | AKARA CAPITAL ADVISORS PVT LTD | 8 | 0 | 4 | 2 | 0 | 1 | 0 | 0 | 0 | 0 | 0 | 3 | 18 | | AMBIT FINVEST PVT LTD | 10 | 3 | 5 | 1 | 0 | 1 | 0 | 0 | 0 | 0 | 0 | 1 | 21 | | ANGEL FINCAP PVT LTD | 1 | 0 | 0 | 0 | 1 | 0 | 0 | 0 | 0 | 0 | 0 | 0 | 2 | | APTUS FINANCE INDIA PVT LTD | 1 | 0 | 1 | 0 | 0 | 0 | 0 | 0 | 0 | 0 | 0 | 0 | 2 | | ARTH MICRO FINANCE (PVT) LTD | 1 | 0 | 0 | 0 | 0 | 0 | 0 | 0 | 0 | 0 | 0 | 0 | 1 | | ASIRVAD MICRO FINANCE LTD | 7 | 0 | 0 | 0 | 0 | 0 | 0 | 1 | 0 | 0 | 0 | 2 | 10 | | AUXILO FINSERVE PVT LTD | 4 | 1 | 0 | 0 | 3 | 2 | 0 | 0 | 0 | 0 | 0 | 0 | 10 | | BAJAJ FINSERV LTD | 40 | 8 | 3 | 3 | 0 | 9 | 0 | 0 | 0 | 0 | 0 | 12 | 75 | | BAJAJ HOLDINGS & INVESTMENT LTD | 101 | 4 | 63 | 52 | 4 | 36 | 5 | 4 | 3 | 1 | 5 | 24 | 302 | | BELL FINVEST (INDIA) LTD | 1 | 0 | 0 | 0 | 0 | 1 | 2 | 0 | 0 | 0 | 0 | 0 | 4 | | BFL INVESTMENTS & FINANCIAL CONSULTANTS PVT LTD | 8 | 1 | 17 | 10 | 2 | 4 | 0 | 1 | 1 | 0 | 1 | 6 | 51 | | BHARAT FINANCIAL INCLUSION LTD | 2 | 1 | 2 | 0 | 0 | 0 | 0 | 0 | 0 | 0 | 0 | 0 | 5 | | BMW INDIA FINANCIAL SERVICES PVT LTD | 9 | 1 | 1 | 2 | 0 | 0 | 0 | 0 | 0 | 0 | 0 | 1 | 14 | | BOB FINANCIAL SOLUTIONS LTD | 15 | 0 | 2 | 8 | 0 | 1 | 0 | 1 | 1 | 1 | 2 | 10 | 41 | | BUSSAN AUTO FINANCE INDIA PVT LTD | 7 | 0 | 1 | 0 | 0 | 1 | 1 | 0 | 1 | 0 | 1 | 4 | 16 | | CAPITAL FIRST LTD | 3 | 0 | 1 | 3 | 0 | 0 | 0 | 1 | 0 | 0 | 0 | 0 | 8 | | CENTRUM MICROCREDIT PVT LTD | 1 | 0 | 0 | 0 | 0 | 0 | 0 | 0 | 0 | 0 | 0 | 0 | 1 | | CHAITANYA INDIA FIN CREDIT PVT LTD | 1 | 0 | 0 | 0 | 0 | 0 | 0 | 0 | 0 | 0 | 0 | 0 | 1 | | CITICORP CAPITAL MARKETS LTD | 1 | 0 | 0 | 0 | 0 | 0 | 0 | 0 | 0 | 0 | 0 | 0 | 1 | | CITICORP FINANCE (INDIA) LTD | 15 | 0 | 4 | 0 | 0 | 3 | 4 | 0 | 0 | 0 | 0 | 5 | 31 | | COMMUNITY FINANCE PVT LTD | 1 | 0 | 0 | 0 | 0 | 0 | 0 | 0 | 0 | 0 | 0 | 0 | 1 | | DAIMLER FINANCIAL SERVICES INDIA PVT LTD | 28 | 0 | 2 | 2 | 0 | 0 | 0 | 0 | 0 | 0 | 0 | 3 | 35 | | DE LAGE LANDEN FINANCIAL SERVICES INDIA PVT LTD | 1 | 0 | 0 | 0 | 0 | 0 | 0 | 0 | 0 | 0 | 0 | 0 | 1 | | DIGICREDIT FINANCE PVT LTD | 1 | 0 | 0 | 0 | 0 | 0 | 0 | 0 | 0 | 0 | 0 | 0 | 1 | | DIGVIJAY FINLEASE LTD | 1 | 0 | 0 | 0 | 0 | 0 | 0 | 0 | 0 | 0 | 0 | 0 | 1 | | DMI FINANCE PVT LTD | 424 | 7 | 122 | 69 | 33 | 40 | 10 | 23 | 4 | 2 | 11 | 113 | 858 | | ECL FINANCE LTD | 24 | 9 | 6 | 6 | 2 | 8 | 2 | 0 | 0 | 0 | 1 | 8 | 66 | | EDELWEISS FINVEST PVT LTD | 15 | 0 | 2 | 0 | 0 | 4 | 0 | 0 | 0 | 0 | 0 | 1 | 22 | | FEDBANK FINANCIAL SERVICES LTD | 18 | 2 | 1 | 1 | 0 | 1 | 0 | 0 | 0 | 1 | 0 | 1 | 25 | | FINTREE FINANCE PVT LTD | 2 | 0 | 0 | 0 | 0 | 0 | 0 | 0 | 0 | 0 | 0 | 0 | 2 | | FORD CREDIT INDIA PVT LTD | 5 | 0 | 4 | 0 | 1 | 0 | 1 | 0 | 0 | 0 | 0 | 5 | 16 | | FORTUNE INTEGRATED ASSETS FINANCE LTD | 1 | 1 | 0 | 0 | 1 | 0 | 0 | 1 | 0 | 0 | 0 | 0 | 4 | | GLOBE FINCAP LTD | 0 | 0 | 0 | 0 | 0 | 1 | 0 | 0 | 0 | 0 | 0 | 0 | 1 | | GROMOR FINANCE PVT LTD | 1 | 0 | 0 | 0 | 0 | 0 | 0 | 0 | 0 | 0 | 0 | 0 | 1 | | HDFC CREDILA FINANCIAL SERVICES PVT LTD | 15 | 3 | 15 | 5 | 2 | 6 | 4 | 1 | 0 | 1 | 2 | 6 | 60 | | HDFC HOLDINGS LTD | 3 | 0 | 7 | 6 | 1 | 2 | 2 | 1 | 1 | 0 | 0 | 6 | 29 | | HINDUJA FINANCE PVT LTD | 7 | 1 | 2 | 2 | 1 | 1 | 2 | 0 | 0 | 0 | 0 | 3 | 19 | | HINDUJA LEYLAND FINANCE LTD | 88 | 2 | 8 | 18 | 4 | 5 | 6 | 2 | 1 | 0 | 5 | 26 | 165 | | IDFC FINANCE LTD | 1 | 0 | 0 | 0 | 0 | 0 | 0 | 0 | 0 | 0 | 0 | 0 | 1 | | IDFC INFRASTRUCTURE FINANCE LTD | 1 | 0 | 0 | 0 | 0 | 0 | 0 | 0 | 0 | 0 | 0 | 0 | 1 | | IFCI VENTURE CAPITAL FUNDS LTD | 2 | 0 | 0 | 0 | 0 | 0 | 0 | 0 | 0 | 0 | 0 | 0 | 2 | | IL & FS FINANCIAL SERVICES LTD | 1 | 0 | 1 | 0 | 1 | 0 | 0 | 0 | 0 | 0 | 0 | 0 | 3 | | INDIA INFOLINE FINANCE LTD | 186 | 10 | 34 | 31 | 9 | 19 | 10 | 5 | 3 | 3 | 4 | 41 | 355 | | INDIABULLS COMMERCIAL CREDIT LTD | 156 | 3 | 19 | 27 | 5 | 13 | 4 | 1 | 3 | 0 | 3 | 17 | 251 | | INDIABULLS CREDIT SERVICES LTD | 1 | 0 | 0 | 0 | 0 | 0 | 0 | 0 | 0 | 0 | 0 | 0 | 1 | | INDIABULLS FINANCIAL SERVICES LTD | 5 | 0 | 0 | 0 | 0 | 1 | 0 | 0 | 0 | 0 | 0 | 0 | 6 | | INDITRADE MICROFINANCE LTD | 7 | 1 | 1 | 0 | 0 | 0 | 0 | 0 | 0 | 0 | 0 | 0 | 9 | | INDOSTAR CAPITAL FINANCE LTD | 39 | 1 | 1 | 2 | 0 | 1 | 1 | 0 | 0 | 0 | 0 | 4 | 49 | | INFINITY FINCORP SOLUTIONS PVT LTD | 1 | 0 | 0 | 0 | 0 | 0 | 1 | 0 | 0 | 0 | 0 | 0 | 2 | | INNOVEN CAPITAL INDIA PVT LTD | 1 | 0 | 0 | 0 | 0 | 0 | 0 | 0 | 0 | 0 | 0 | 0 | 1 | | J M FINANCIAL & INVESTMENT CONSULTANCY SERVICES PVT LTD | 0 | 0 | 1 | 0 | 0 | 0 | 0 | 0 | 0 | 0 | 0 | 0 | 1 | | J R G FINCORP LTD | 9 | 0 | 3 | 0 | 0 | 0 | 0 | 0 | 0 | 0 | 0 | 0 | 12 | | JOHN DEERE FINANCIAL INDIA PVT LTD | 3 | 0 | 1 | 0 | 0 | 0 | 0 | 0 | 0 | 0 | 0 | 0 | 4 | | JUMBO FINVEST (INDIA) LTD | 5 | 0 | 0 | 1 | 0 | 1 | 0 | 0 | 0 | 0 | 1 | 1 | 9 | | KLM AXIVA FINVEST LTD | 2 | 1 | 0 | 0 | 0 | 0 | 0 | 0 | 0 | 0 | 0 | 0 | 3 | | KNAB FINANCE ADVISORS PVT LTD | 1 | 0 | 0 | 0 | 0 | 0 | 0 | 0 | 0 | 0 | 0 | 0 | 1 | | KUDOS FINANCE & INVESTMENTS PVT LTD | 17 | 0 | 0 | 0 | 0 | 0 | 0 | 0 | 0 | 0 | 0 | 0 | 17 | | L & T INFRA DEBT FUND LTD | 0 | 0 | 0 | 0 | 0 | 0 | 0 | 0 | 0 | 0 | 1 | 0 | 1 | | L&T INFRASTRUCTURE FINANCE COMPANY LTD | 4 | 0 | 0 | 0 | 0 | 0 | 0 | 0 | 0 | 0 | 1 | 0 | 5 | | M POWER MICRO FINANCE PVT LTD | 1 | 0 | 0 | 0 | 0 | 0 | 0 | 0 | 0 | 0 | 0 | 0 | 1 | | MADURA MICRO FINANCE LTD | 0 | 0 | 1 | 0 | 1 | 0 | 0 | 0 | 0 | 0 | 0 | 2 | 4 | | MAITREYA CAPITAL AND BUSINESS SERVICES PVT LTD | 1 | 0 | 0 | 0 | 0 | 0 | 0 | 0 | 0 | 0 | 0 | 0 | 1 | | MENTOR CAPITAL LTD | 1 | 0 | 0 | 0 | 0 | 0 | 0 | 0 | 0 | 0 | 0 | 0 | 1 | | MOTILAL OSWAL FINANCIAL SERVICES LTD | 12 | 0 | 4 | 1 | 0 | 1 | 3 | 0 | 0 | 1 | 0 | 3 | 25 | | MUTHOOT FINANCE LTD | 163 | 16 | 38 | 23 | 4 | 10 | 1 | 2 | 1 | 1 | 8 | 25 | 292 | | MUTHOOT FINCORP LTD | 15 | 3 | 1 | 1 | 0 | 1 | 1 | 0 | 0 | 0 | 0 | 2 | 24 | | MUTHOOT MERCANTILE LTD | 2 | 0 | 0 | 0 | 0 | 0 | 0 | 0 | 0 | 0 | 0 | 0 | 2 | | MUTHOOTTU MINI FINANCIERS LTD | 1 | 0 | 0 | 0 | 0 | 0 | 1 | 0 | 0 | 0 | 0 | 1 | 3 | | NAHAR CAPITAL AND FINANCIAL SERVICES LTD | 1 | 0 | 0 | 0 | 0 | 0 | 0 | 0 | 0 | 0 | 0 | 0 | 1 | | NAMAN FINLEASE PVT LTD | 1 | 0 | 0 | 0 | 0 | 1 | 0 | 0 | 0 | 0 | 0 | 0 | 2 | | NEOWORTH COMMERCIAL PVT LTD | 1 | 0 | 0 | 0 | 0 | 0 | 0 | 0 | 0 | 0 | 0 | 0 | 1 | | NORTH EASTERN DEVELOPMENT FINANCE CORPORATION LTD | 1 | 0 | 1 | 0 | 0 | 0 | 0 | 0 | 0 | 0 | 0 | 0 | 2 | | ORIX LEASING &FINANCIAL SERVICES INDIA LTD | 12 | 4 | 2 | 2 | 0 | 1 | 0 | 0 | 0 | 1 | 0 | 8 | 30 | | OXYZO FINANCIAL SERVICES PVT LTD | 12 | 1 | 1 | 0 | 0 | 2 | 0 | 0 | 0 | 0 | 0 | 1 | 17 | | PNB GILTS LTD | 0 | 0 | 0 | 0 | 0 | 0 | 0 | 0 | 0 | 0 | 0 | 2 | 2 | | POONAWALLA FINANCE PVT LTD | 3 | 0 | 0 | 0 | 0 | 0 | 0 | 0 | 0 | 0 | 0 | 0 | 3 | | PROFECTUS CAPITAL PVT LTD | 2 | 0 | 0 | 1 | 0 | 0 | 0 | 0 | 0 | 0 | 0 | 0 | 3 | | RELIANCE COMMERCIAL FINANCE LTD | 24 | 2 | 1 | 3 | 2 | 1 | 4 | 0 | 0 | 0 | 1 | 8 | 46 | | RELIANCE FINANCIAL LTD | 9 | 1 | 0 | 4 | 2 | 5 | 0 | 1 | 0 | 0 | 1 | 4 | 27 | | RELIANCE RETAIL FINANCE LTD | 0 | 0 | 0 | 0 | 0 | 0 | 0 | 1 | 0 | 0 | 0 | 0 | 1 | | RELIGARE FINANCE LTD | 2 | 0 | 0 | 0 | 0 | 0 | 0 | 0 | 0 | 0 | 0 | 0 | 2 | | REPCO MICRO FINANCE LTD | 2 | 0 | 0 | 0 | 0 | 0 | 0 | 0 | 0 | 0 | 0 | 0 | 2 | | RHC FINANCE PVT. LTD | 0 | 0 | 0 | 1 | 0 | 0 | 0 | 0 | 0 | 0 | 0 | 1 | 2 | | SAHARA INDIA FINANCE & INVESTMENT LTD | 1 | 0 | 0 | 0 | 0 | 0 | 0 | 0 | 0 | 0 | 0 | 1 | 2 | | SAMUNNATI FINANCIAL INTERMEDIATION & SERVICES PVT LTD | 1 | 0 | 0 | 0 | 0 | 0 | 0 | 0 | 0 | 0 | 0 | 0 | 1 | | SBI CARDS & PAYMENT SERVICES PVT LTD | 7 | 2 | 0 | 3 | 1 | 2 | 0 | 0 | 0 | 0 | 0 | 1 | 16 | | SBI GLOBAL FACTORS LTD | 0 | 0 | 0 | 0 | 1 | 0 | 0 | 0 | 0 | 0 | 0 | 0 | 1 | | SHARE MICROFIN LTD | 1 | 0 | 0 | 0 | 0 | 0 | 0 | 0 | 0 | 0 | 0 | 0 | 1 | | SHAREKHAN BNP PARIBAS FINANCIAL SERVICES P LTD | 1 | 0 | 0 | 0 | 0 | 0 | 0 | 0 | 0 | 0 | 0 | 1 | 2 | | SHREM INVESTMENTS PVT LTD | 0 | 0 | 0 | 0 | 0 | 1 | 0 | 0 | 0 | 0 | 0 | 0 | 1 | | SHRI RAM FINANCE CORPORATION PVT LTD | 6 | 0 | 1 | 1 | 1 | 1 | 1 | 0 | 0 | 0 | 0 | 4 | 15 | | SHRIRAM EQUIPMENT FINANCE COMPANY LTD | 2 | 0 | 0 | 0 | 0 | 0 | 0 | 0 | 0 | 0 | 0 | 0 | 2 | | SI CREVA CAPITAL SERVICES PVT LTD | 148 | 12 | 6 | 4 | 0 | 0 | 0 | 0 | 0 | 0 | 1 | 6 | 177 | | SIEMENS FINANCIAL SERVICES PVT LTD | 3 | 0 | 3 | 0 | 0 | 0 | 0 | 0 | 0 | 0 | 0 | 0 | 6 | | SMALL BUSINESS FINCREDIT INDIA PVT LTD | 110 | 7 | 22 | 9 | 3 | 3 | 10 | 0 | 1 | 0 | 1 | 15 | 181 | | SPANDANA SPHOORTY FINANCIAL LTD | 3 | 1 | 1 | 1 | 0 | 0 | 0 | 0 | 0 | 0 | 0 | 0 | 6 | | SREI EQUIPMENT FINANCE LTD | 34 | 1 | 18 | 13 | 1 | 3 | 4 | 0 | 0 | 1 | 1 | 11 | 87 | | SURYODAY MICRO FINANCE LTD | 1 | 0 | 0 | 0 | 0 | 0 | 0 | 0 | 0 | 0 | 0 | 0 | 1 | | SUSTAINABLE AGRO-COMMERCIAL FINANCE LTD | 2 | 1 | 0 | 0 | 0 | 0 | 0 | 0 | 0 | 0 | 0 | 1 | 4 | | TATA CAPITAL FINANCIAL SERVICES LTD | 496 | 46 | 126 | 73 | 13 | 41 | 15 | 9 | 3 | 3 | 3 | 99 | 927 | | TATA CLEANTECH CAPITAL LTD | 2 | 0 | 0 | 0 | 0 | 0 | 0 | 0 | 0 | 0 | 0 | 0 | 2 | | THE KERALA STATE BACKWARD CLASSES DEVELOPMENT CORPORATION LTD | 1 | 0 | 1 | 0 | 0 | 0 | 0 | 0 | 0 | 0 | 0 | 0 | 2 | | TOYOTA FINANCIAL SERVICES INDIA LTD | 36 | 0 | 4 | 1 | 0 | 0 | 0 | 0 | 0 | 0 | 0 | 4 | 45 | | TVS CREDIT SERVICES LTD | 64 | 3 | 23 | 28 | 1 | 1 | 4 | 0 | 1 | 1 | 4 | 12 | 142 | | UNITECH HOLDINGS LTD | 1 | 0 | 0 | 0 | 0 | 0 | 0 | 0 | 0 | 0 | 0 | 0 | 1 | | VERITAS FINANCE PVT LTD | 7 | 0 | 0 | 2 | 0 | 2 | 0 | 0 | 0 | 0 | 0 | 0 | 11 | | VIVRITI CAPITAL PVT LTD | 1 | 0 | 0 | 0 | 0 | 0 | 0 | 0 | 0 | 0 | 0 | 0 | 1 | | VOLKSWAGEN FINANCE PVT LTD | 14 | 0 | 1 | 0 | 0 | 0 | 0 | 1 | 0 | 0 | 0 | 1 | 17 | | WESTERN INDIA TRANSPORT FINANCE COMPANY PVT LTD | 0 | 0 | 0 | 0 | 0 | 0 | 0 | 0 | 0 | 0 | 0 | 1 | 1 | | WHEELSEMI PVT LTD | 1 | 0 | 0 | 0 | 0 | 0 | 0 | 0 | 0 | 0 | 0 | 0 | 1 | | WILLIAMSON MAGOR & CO LTD | 0 | 0 | 0 | 0 | 0 | 0 | 0 | 0 | 0 | 0 | 0 | 1 | 1 | | TOTAL | 2571 | 163 | 593 | 427 | 102 | 240 | 99 | 57 | 24 | 17 | 59 | 521 | 4873 | | | | | | | | | | | | | | | | | OTHERS | 2968 | 118 | 324 | 145 | 58 | 111 | 50 | 19 | 11 | 5 | 12 | 405 | 4226 | | GRAND TOTAL | 14758 | 962 | 2999 | 2544 | 406 | 1280 | 354 | 314 | 114 | 67 | 259 | 2900 | 26957 | | Note: For complaints received over the CMS portal, the grounds of complaints are as identified by the complainants. |
| Annex 3 - Statement of complaints received by the OODTs during July 1, 2020 to March 31, 2021 | | Name of the System Participant | Mobile/ Electronic Fund Transfers / Mobile/ Electronic Banking | Non-Reversal of Funds due to Wrong Beneficiary Transfer by System Participant | Prepaid Payment Instruments (PPI) | Violation of RBI Directives in Relation to Fees/Charges | Out of Subject | Others | Total | | Bharat Bill Payment Central Unit | | National Payments Corporation of India | 1 | 0 | 0 | 0 | 0 | 0 | 1 | | | | Bharat Bill Payment Operating Units | | Avenues India Private Limited | 20 | 1 | 3 | 0 | 0 | 1 | 25 | | CSC E – Governance Services India Limited | 27 | 3 | 2 | 0 | 0 | 1 | 33 | | Euronet Services India Private Limited | 15 | 0 | 1 | 0 | 0 | 0 | 16 | | Indiaideas. Com Limited | 5 | 0 | 2 | 1 | 0 | 1 | 9 | | Itz Cash Card Limited | 5 | 0 | 3 | 0 | 0 | 0 | 8 | | Oxigen Services (India) Private Limited | 6 | 0 | 2 | 0 | 1 | 0 | 9 | | Spice Digital Limited | 6 | 1 | 0 | 0 | 0 | 3 | 10 | | Techprocess Payment Services Limited | 8 | 4 | 0 | 0 | 0 | 0 | 12 | | Sub Total | 92 | 9 | 13 | 1 | 1 | 6 | 122 | | | | Prepaid Payment Instruments | | Aircel Smart Money Limited | 6 | 4 | 1 | 0 | 0 | 1 | 12 | | Amazon Pay (India) Private Limited | 241 | 26 | 40 | 2 | 3 | 25 | 337 | | Appnit Technologies Private Limited | 4 | 1 | 7 | 1 | 0 | 3 | 16 | | Balancehero India Private Limited | 3 | 0 | 3 | 6 | 0 | 1 | 13 | | Card Pro Solutions Private Limited | 4 | 4 | 0 | 0 | 0 | 1 | 9 | | Delhi Integrated Multi-Modal Transit System Limited | 1 | 0 | 0 | 0 | 0 | 0 | 1 | | Delhi Metro Rail Corporation Limited | 1 | 0 | 0 | 0 | 0 | 0 | 1 | | Digitsecure India Private Limited | 4 | 0 | 0 | 0 | 0 | 0 | 4 | | Edenred (India) Private Limited – Nee Accor Services Private Limited | 0 | 0 | 1 | 1 | 0 | 0 | 2 | | Eko India Financial Services Private Limited | 1 | 0 | 0 | 0 | 0 | 0 | 1 | | Flytech Aviation Limited | 1 | 0 | 0 | 0 | 0 | 0 | 1 | | GI Technology Private Limited | 13 | 0 | 1 | 0 | 0 | 0 | 14 | | Incashme Mobile Wallet Services Private Limited | 4 | 0 | 0 | 0 | 0 | 0 | 4 | | India Transact Services Limited | 3 | 0 | 0 | 2 | 0 | 0 | 5 | | Itz Cash Card Limited | 0 | 0 | 0 | 0 | 0 | 1 | 1 | | Manappuram Finance Limited | 1 | 0 | 0 | 1 | 0 | 2 | 4 | | Mpurse Services Private Limited | 0 | 0 | 0 | 1 | 0 | 0 | 1 | | My Mobile Payments Limited | 9 | 1 | 2 | 0 | 0 | 0 | 12 | | Obopay Mobile Technology India Private Limited | 2 | 0 | 0 | 0 | 0 | 0 | 2 | | One Mobikwik Systems Private Limited | 156 | 10 | 32 | 17 | 2 | 25 | 242 | | Oxigen Services (India) Private Limited | 1 | 1 | 1 | 0 | 0 | 4 | 7 | | Pay Point India Network Private Limited | 4 | 1 | 1 | 1 | 0 | 1 | 8 | | Payu Payments Private Limited | 129 | 14 | 9 | 5 | 2 | 13 | 172 | | Phonepe Private Limited | 1,272 | 151 | 61 | 4 | 5 | 79 | 1,572 | | Pine Labs Private Limited | 14 | 3 | 2 | 6 | 0 | 0 | 25 | | Premium Ebusiness Ventures Private Limited | 1 | 0 | 0 | 1 | 0 | 0 | 2 | | Qwikcilver Solutions Private Limited | 2 | 0 | 4 | 0 | 0 | 1 | 7 | | Rapipay Fintech Private Limited | 2 | 0 | 0 | 0 | 0 | 0 | 2 | | Smart Payment Solutions Private Limited | 2 | 0 | 0 | 1 | 0 | 1 | 4 | | Sodexo Svc India Private Limited | 1 | 0 | 2 | 0 | 0 | 0 | 3 | | Spice Digital Limited | 0 | 2 | 0 | 1 | 0 | 1 | 4 | | Supreme Securities Limited | 0 | 1 | 0 | 0 | 0 | 0 | 1 | | Transaction Analysts (India) Private Limited | 4 | 1 | 0 | 0 | 0 | 0 | 5 | | Transerv Private Limited | 3 | 1 | 3 | 2 | 1 | 3 | 13 | | Tri O Tech Solutions Private Limited | 1 | 0 | 0 | 0 | 0 | 0 | 1 | | UAE Exchange & Financial Services Limited | 1 | 0 | 0 | 0 | 0 | 0 | 1 | | Vodafone M-Pesa Limited | 0 | 1 | 0 | 0 | 0 | 0 | 1 | | Y-Cash Software Solutions Private Limited | 0 | 0 | 0 | 1 | 0 | 0 | 1 | | Zipcash Card Services Private Limited | 6 | 0 | 5 | 3 | 0 | 1 | 15 | | Sub Total | 1,897 | 222 | 175 | 56 | 13 | 163 | 2,526 | | | | Others | 182 | 10 | 15 | 19 | 19 | 52 | 297 | | Total | 2,172 | 241 | 203 | 76 | 33 | 221 | 2,946 |
|