Exports and foreign capital are the twin engines of growth in an open economy. Post-COVID, a strategic policy reset in India can help harness these growth opportunities. Based on empirical assessment of constraints to export growth, this Chapter finds that India has revealed comparative advantage (RCA) in certain export categories; past free trade agreements (FTAs) have not been trade creating; without higher import and technology-intensity of exports, raising India’s participation in global value chain may be difficult; and exchange rate stability helps promote exports. While the Production Linked Incentive (PLI) Scheme can incentivise effective diversification of the export basket, it needs to emphasise global quality benchmarks, including carbon emission standards, to be able to harness green export opportunities and to achieve ambitious exports target of US$1 trillion by 2030. Ongoing and future FTAs may need to prioritise transfer of technology and easier access to critical intermediate inputs to widen the basket of items where India can build its RCA. Greater openness to imports at lower tariff and non-tariff restrictions and FDI can not only boost exports but also enhance the capacity to absorb foreign capital. 1. Introduction IV.1 For an open economy, trade and financial integration, including through global value chains (GVCs), can generate strong impulses of economic growth, supported by a congenial domestic policy environment. The COVID-19 pandemic disrupted global supply chains, shipping and logistics, which persist even today. Global trade volume (of goods and services) contracted by 7.9 per cent in 2020. In 2021, as world trade (goods and services) staged a robust recovery from the deep contraction in 2020, India’s merchandise exports also regained momentum from pandemic lows, registering a growth of 43.8 per cent in 2021-22 and by 33.9 per cent over pre-pandemic level. Imports too revived and surged as domestic demand picked-up steam. IV.2 The theme of this chapter is the sustainability of this rebound in exports as the Indian economy revives and reconstructs in the post-pandemic years, exploiting opportunities opening up via greater participation in GVCs, a focus on services exports and strategic trade integration through free trade agreements (Das, 2020). The Chapter also explores the role of strategic policies in addressing challenges and harnessing opportunities. IV.3 The absorptive capacity of the economy in respect of capital flows can also influence the growth outlook of an emerging market economy and hence their size and composition matters. Accordingly, the chapter attempts to evaluate the growth enhancing effects of foreign capital, especially FDI, and policies for attracting growth capital. Section 2 focuses on India’s export competitiveness, drilling down to sectors with cutting edge and identifies areas for adoption of frontier technologies that can potentially enhance India’s participation in GVCs and raise exports. Section 3 evaluates Aatmanirbhar Bharat, particularly the role of imports in boosting exports. Section 4 examines the role of capital flows in financing domestic growth and exchange rate effects. Section 5 summarises the findings and presents policy options. 2. Trade Openness, Export Competitiveness and Growth IV.4 A virtuous model of economic growth tracks the interrelationship between exports and growth by boosting productivity through increasing returns to scale, which makes the growth process ‘circular’ and ‘cumulative’ (Verdoorn, 1949; Kaldor, 1966). Exports ease an important impediment to import purchasing power and thereby domestic demand, allowing all other components of aggregate demand, viz., consumption, investment, and government expenditure to expand and break through the limits to growth that a foreign exchange constrained developing economy typically encounters in the early and intermediate stages of development. This model essentially operationalises Harrod’s super trade multiplier in an open economy context. In the case of India, it is estimated that a sharp fall in the income elasticity of imports improved the contribution of net exports to GDP growth during 2013-14 to 2020-21 despite a moderation in export growth (Box IV.1). Box IV.1
Dynamic Foreign Trade Multiplier of India where g is the GDP growth rate, x is export volume growth and em is the income elasticity of imports. Export growth, in turn, depends on the income elasticity of exports (ex) and world income (w). From a macroeconomic perspective, if the income elasticity of demand for imports exceeds unity, exports must grow faster than overall output to support growth on a sustainable basis. A cointegration and vector error correction model is used on quarterly data from 2000Q1 to 2019Q4 (the pre-COVID period) for estimating the peace-time FTM for India, the choice of the period being governed by availability of data. Estimates are also generated separately for the pre-GFC and post-GFC periods to ascertain any structural shift in the imports-GDP relationship following a major shock. The estimated results show that the income elasticity of imports has come down in the last decade, especially after the GFC (Table 1). A combination of factors such as rising trade protectionism (both in India and world), weaker demand conditions for India’s exports, and policies for securing domestic supply chains may have contributed to the decline in import elasticity. Despite average export growth moderating sharply during 2013-14 to 2020-21, India’s FTM has improved on the back of a sharp decline in the income elasticity of imports (Chart 1). The deceleration in average GDP growth during 2013-14 to 2020-21 would have been sharper without this improvement in the foreign trade multiplier. In 2021-22, however, the post-pandemic pick-up in imports has weakened the FTM despite stronger export growth (Chart 2). | Table 1: Income Elasticity of Imports | | Period | Income Elasticity of Imports | | Period 1: 2000Q1 to 2007Q4 | 2.25** | | Period 2: 2009Q1 to 2019Q4 | 0.60** | | Full Sample: 2000Q1 to 2019Q4 | 1.0 ** | | Note: Statistically significant at 5 per cent. |
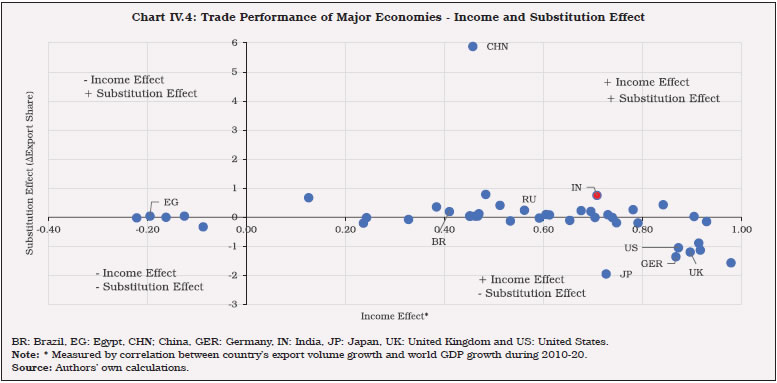
In the post-pandemic recovery, further improvement in FTM can result from higher export growth via expanding to new product lines and new markets. Substitution of imports with domestically available alternatives can also help reduce the income elasticity of imports. References: Thirlwall, A. P. (March 1979), “The balance of payments constraint as an explanation of international growth rate differences”, Banca Nazionale del Lavoro Quarterly Review, vol. 32(128), pages 45-53. Thirlwall, A. P. (2013) Economic Growth in an Open Developing Economy: The Role of Structure and Demand, Cheltenham: Edward Elgar. Downing College, Cambridge, CB2 1DQ, UK. | IV.5 In the years leading up to the pandemic, a fall was observed in India’s trade openness, particularly from 2013-14. The moderation in imports was more perceptible than exports (Chart IV.1a). The sharp increase in imports during 2021-22 has lowered the direct contribution of net exports to GDP growth even further (Chart IV.1b). IV.6 Among India’s 40 major trading partners, only 15 economies, accounting for 20.1 per cent of world import demand are projected by the IMF to grow faster than the world average in 2022-26. These 15 economies account for 31 per cent of India’s total exports (Chart IV.2). IV.7 Going forward, low growth economies may limit country’s export prospects. The focus should be to not only expand the export basket to high growth economies but also to improvethe intensive margin of exports in low growth economies,1 which account for more than two-thirds of world imports (Table IV.1). IV.8 India’s business cycle is more synchronised with that of trading partners and the co-movement has intensified further in recent years (Raj, 2017; Kaur, 2019). The correlation between the cyclical component of India’s GDPand OECD+ economies2 has increased from 0.48 during 2000:Q1 - 2009:Q4 to 0.89 during 2010:Q1 - 2020:Q4 (Charts IV.3a and b). IV.9 In terms of static comparative advantage, a country’s competitive export strengths are based on specialisation and its ability to produce certain products at lower cost than other countries. Competitiveness, on the other hand, is a function of trade policies and development strategies, viz., tariffs; non-tariff measures; real exchange rates; export infrastructure; R&D and innovations. IV.10 In the post-GFC period, India’s merchandise exports have gained from the substitution effect (by gaining market share in export markets) as well as the income effect (by co-moving with global income) (Chart IV.4). India’s merchandise exports need to grow at a compound rate of 12 per cent to attain the target of US$ 1 trillion by 2030. Unless supported by rapid improvement in net terms of trade (implying higher export prices), this export growth may seem ambitious, given that the world import volume growth is projected by the IMF to average 4.2 per cent over the next five years (2022-26). Hence, substantial gains through both the income effect and the substitution effect would be necessary. 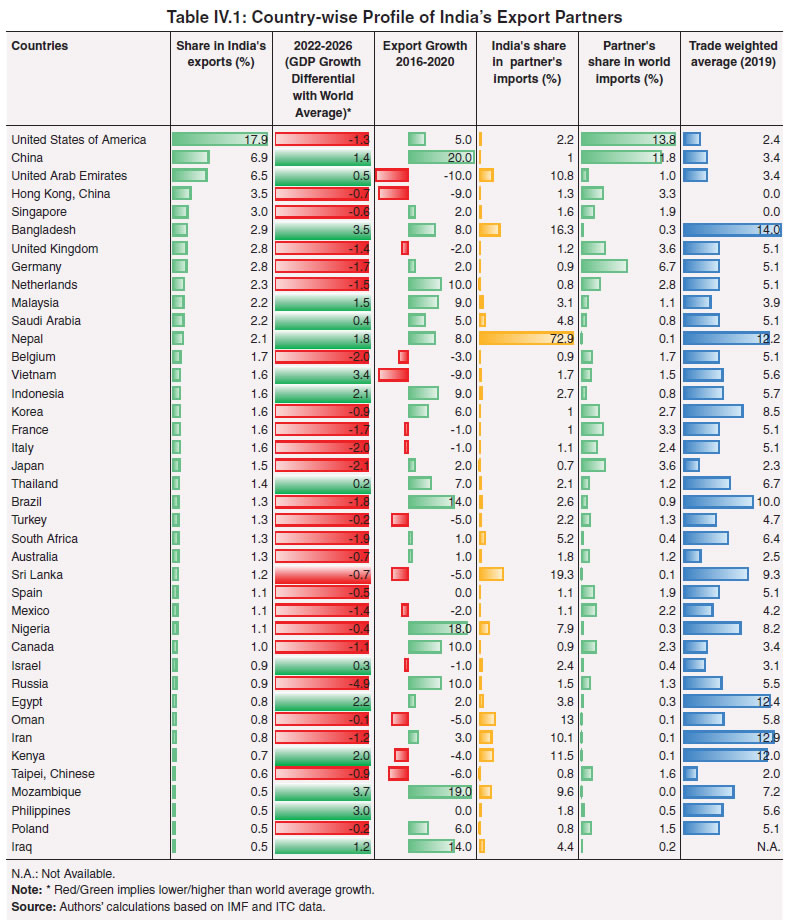
 IV.11 In this context, the production linked incentive (PLI) scheme targeted at creating domestic capacity and boosting export potential could be a game changer in making Indian manufacturing globally competitive, creating economies of scale and integrating India into the global value chain. In fact, a strong manufacturing base has greater potential to absorb a low-skilled labour force as compared to services. IV.12 While the revealed comparative advantage3 (RCA) of sectors has shifted over the last two decades, the number of sectors with RCA greater than one remained broadly the same in 2010-20 vis-à-vis 2001-09 (Chart IV.5). An inter-temporal comparison shows that out of 91 sectors which currently enjoy comparative advantage (i.e., RCA index greater than one), the index improved for 47 sectors but deteriorated for 44 sectors during 2010-20. Out of the remaining 167 sectors with RCA of less than one, 58 per cent gained market share by moving closer to the RCA value of 1 (Table IV.2).
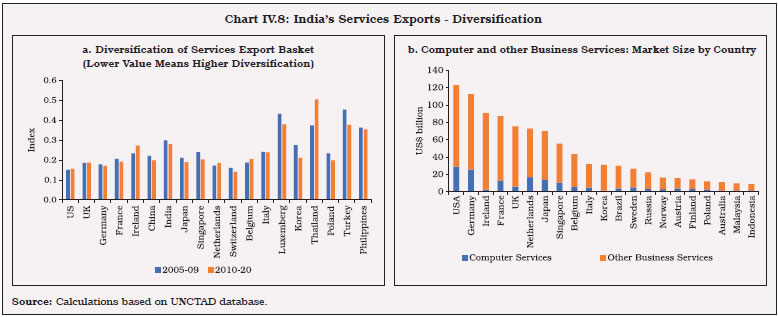
| Table IV.2: Change in Revealed Comparative Advantage (2010-20 over 2001-09) | | | RCA>1 | RCA<1 | Total | | Increase | 47 | 97 | 144 | | Decrease | 44 | 72 | 116 | | Total | 91 | 167 | 258 | | Note: RCA index as defined by Balassa (1965) is as follows: Where Xij represents country i’s exports of commodity j and w represents world exports. If RCA is greater than 1, it is interpreted that the country has a comparative advantage in exports. | IV.13 An inter-temporal comparison of product group-wise comparative advantage suggests that the RCA index of exports of consumer goods improved during 2011-19. Capital goods exports gained market share but remained well below the threshold level of RCA. By contrast, the RCA for intermediate goods and raw materials was eroded reflecting a lower scale of participation in GVCs. An item-wise comparison shows that RCA improved for exports of fuels, chemicals, transportation, machinery and electrical, wood, plastic and metals during 2011-19, whereas it declined for food products, footwear, textile and clothing, stones and glass and minerals. Overall, commodity groups accounting for 58 per cent weight in the export basket gained RCA during 2011-19 (Charts IV.6a and b). 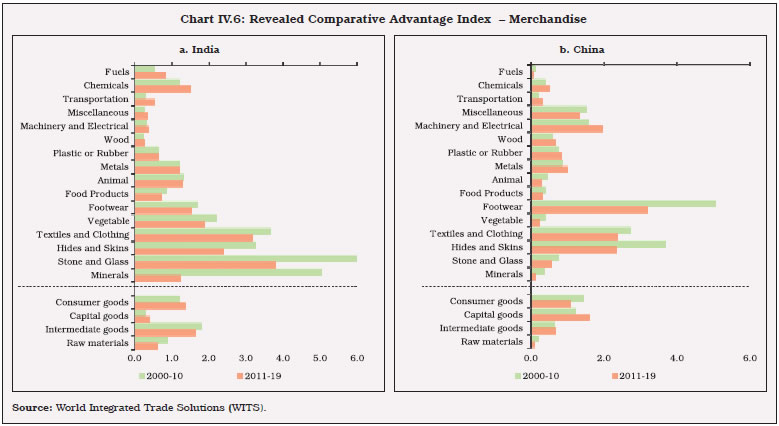 IV.14 While services exports accounted for 22 per cent of total exports globally during 2010-21, the share of India’s services exports was much higher at 36 per cent. Further, world trade in services has been more resilient than merchandise trade in the post-GFC period, which provides an upside potential for growth in low labour cost economies like India. While the pandemic and the resultant supply chain disruptions severely impacted world trade in commercial services in 2020, India’s net exports of services were relatively resilient, primarily on the back of robust software exports earnings. India needs to tap the post-pandemic global opportunities arising from accelerated digital investment with a growing focus on contactless commerce, live commerce, and B2B consumerisation. IV.15 Despite being the seventh largest exporter of services with a global share of 3.3 per cent during 2010-21, India enjoys comparative advantage only in computer services (including software) covered under the category of telecommunication, computer and information services. In this segment too, the RCA index has moderated during 2011-20 due to growing competition from other countries in the last few years (Chart IV.7). IV.16 Lower RCAs across services exports reflect India’s highly skewed services export basket (Chart IV.8a). In telecommunication, computer and information services and other business services, (together contributing two-thirds of India’s services exports), India caters to just over 6 per cent of the global demand, implying a vast export potential in untapped markets (Chart IV.8b). In order to achieve the indicative target of services exports ofUS$ 1 trillion by 20304, the services export basket needs to be diversified. Today, IT companies deliver computer and IT enabled services not only through Mode 1 (cross-border supply), but also through Mode 4 (movement of natural persons) and Mode 3 (commercial presence). 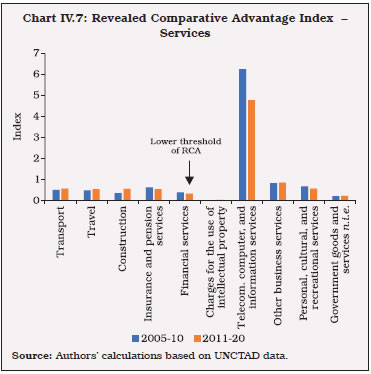
 IV.17 India’s RCA in computer services needs to be enhanced further by tapping new opportunities in this sector. Export potential in other segments, viz., professional and management consulting services, charges for intellectual property rights, financial services, entertainment services including audio-visual and gaming, auditing services, education and healthcare, may be explored, especially through new or renegotiated FTAs. For instance, India’s Comprehensive Economic Partnership Agreement (CEPA) with the United Arab Emirates (UAE) in February 2022 focuses on 11 service sectors and over 100 sub-sectors including inter alia business services, telecommunications, construction, education, tourism, nursing and finance, besides goods. Some segments involving digital modes for delivery of services are fraught with regulatory issues relating to data privacy, storage and localisation which may weaken the case for a push to services exports through bilateral/multilateral trade agreements. Incidentally, India’s openness in services trade is lower than other major advanced economies in most of the segments, as estimated by OECD’s services trade restrictiveness index (STRI) [Charts IV.9a and b]. Given India’s Act East Policy and strategic partnership with East Asia and the Asia-Pacific region, there is immense potential to increase services trade with countries like Japan and Australia. 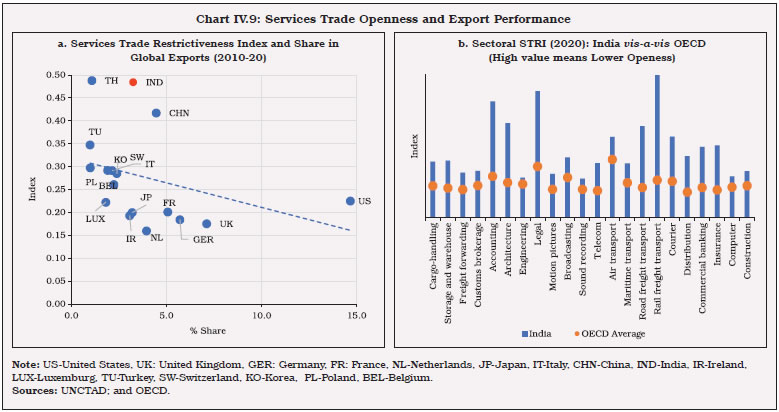 IV.18 Export market diversification can help to overcome export instability and the negative impact of net terms of trade shocks originating from concentration in a few commodities. On this metric, India fared better than other large economies during 2010-20 as its top-20 export destinations accounted for two-thirds of total goods exports. India’s overall export market diversification measured by the Herfindahl- Hirschman market concentration index also showslower concentration of exports (Chart IV.10)5. 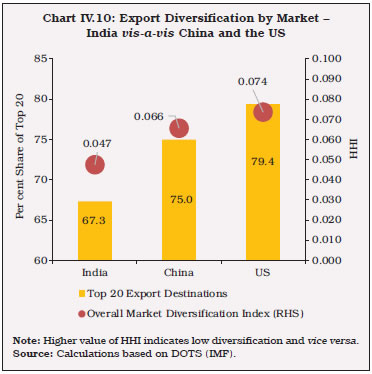 IV.19 An analysis based on the tradecomplementarity index (TCI)6 shows that India’s export basket has high complementarity with import baskets of Italy, Belgium, the Netherlands, the UK and Brazil, but they account for a lower share in India’s total exports than other countries, viz., the USA, China, the UAE and Hong Kong which exhibit modest levels of trade complementarity. Similarly, India’s import basket complements exports from the USA, Singapore, the UK, Netherlands and Malaysia. As a high degree of complementarity indicates more favourable prospects for successful trade arrangements, India’s exports have scope to expand in countries with high TCI (Table IV.3). IV.20 In order to expand market overseas for domestic products, it is imperative to not only ease supply-side bottlenecks but also undertake reforms that facilitate a process of structural transformation from producing “poor-country goods” to “rich-country goods” by enhancing the efficiency and competitiveness of domestic industry (Box IV.2). | Table IV.3: Trade Complementarity Index | | India’s TCI ranking with Top Exporting Countries | Major Partner Countries TCI Ranking to India | | Country | Share in total exports (%) | TCI (2019) | Country | Share in total imports (%) | TCI (2019) | | USA | 17.7 | 59.1 | USA | 7.34 | 67.6 | | China | 7.3 | 55.4 | China | 14.07 | 54.7 | | UAE | 5.7 | 61.2 | UAE | 6.76 | 48.8 | | Hong Kong | 3.5 | 39.5 | Hong Kong | 3.85 | 57.6 | | Bangladesh | 3.1 | 56.1 | Bangladesh | 0.26 | 5.7 | | Singapore | 3.0 | 51.1 | Singapore | 3.38 | 67.8 | | UK | 2.8 | 67.7 | UK | 1.42 | 63.6 | | Germany | 2.8 | 64.5 | Germany | 3.32 | 56.1 | | Nepal | 2.3 | 63.3 | Nepal | 0.14 | 23.2 | | Netherlands | 2.2 | 65.9 | Netherlands | 0.73 | 67.0 | | Malaysia | 2.1 | 59.6 | Malaysia | 2.13 | 61.6 | | Saudi Arabia | 2.0 | 60.2 | Saudi Arabia | 5.59 | 31.5 | | Belgium | 1.8 | 69.9 | Belgium | 1.76 | 59.9 | | Indonesia | 1.7 | 65.7 | Indonesia | 3.17 | 55.3 | | Vietnam | 1.7 | 50.7 | Vietnam | 1.56 | 40.4 | | France | 1.6 | 65.0 | France | 1.32 | 55.4 | | Italy | 1.6 | 72.8 | Italy | 0.97 | 54.6 | | Korea | 1.6 | 61.5 | Korea | 3.25 | 61.5 | | Japan | 1.5 | 64.6 | Japan | 2.78 | 56.6 | | Brazil | 1.5 | 66.3 | Brazil | 0.63 | 43.5 | | Source: WITS. |
Box IV.2
Country and Product Identification Strategy for Enhancing India’s Export Potential As India revamps its trade policy strategy to re-engage with the rest of the world post-COVID, an effective export promotion strategy identifies markets with high growth potential and augments comparative advantage of a larger set of products in the export basket. An empirical analysis to identify India’s all-weather-partners using a measure of trade frequency, i.e., the number of times a country has registered as India’s top-10 trade partners in the last decade may be useful. While countries such as the US, the UK, the UAE, Singapore, Hong Kong, Germany and China have consistently remained in the list of India’s top-10 trade partners, trading partners such as Sri Lanka, South Korea, Indonesia, France and Brazil have made sporadic entries and exits. The medium-term growth potential of India’s top trading partners is identified on the basis of IMF’s latest growth projections in the post Covid-19 period, i.e., 2023 to 2026. The choice of the period ensures that a mechanical rebound on account of base effects does not overestimate the actual growth potential of a country. Next, revealed comparative advantage (RCA) is explored to gauge India’s export potential. Product differentiation is a short-run phenomenon between new trading partners and its importance dissipates over time (Herman and Lee, 2019). From the medium-term perspective, it is imperative that India captures a greater market share, based on differentiated products, especially during a time when global supply chains are going through a major transformation. Accordingly, product classification in terms of organised exchange, referenced price, and differentiated products (Rauch, 1999) is examined, and mapped to sectoral RCAs7 and the medium-term growth potential of India’s trading partners. The desirable country and product mix may meet the following criteria: (i) the product classified as differentiated; (ii) India’s RCA in that product category vis-a-vis trading partners; and (iii) trade in that product with a country that has a high growth potential. This aspect is examined by applying K-means clustering8 to identify centroids based on (a) a scatter of sectoral RCAs and country’s medium-term growth potential; and (b) a scatter of sectoral RCAs and product classification (Charts 1a and b). The blue cluster represents a centroid associated with relatively high RCA value and low GDP growth. On the other hand, the green cluster represents a centroid associated with relatively high GDP growth values and relatively low RCA value. The red cluster represents relatively low RCA and low GDP growth values. A medium-term repositioning of India’s trade strategies must focus on the centroids that can help reap the untapped potential in high growth economies. References: Herman, Peter and Lee, Ryan (2019), “The Short-Run Effects of Product Differentiation on Trade (November 7, 2019)”, USITC Office of Economics Working Paper 2019-11-A, Available at SSRN: https://ssrn.com/abstract=2690336 or http://dx.doi.org/10.2139/ssrn.2690336. Rauch, James E. (1999), “Networks versus markets in international trade”, Journal of International Economics, Vol.48, Issue 1, pp.7-35. | IV.21 There is a need to re-examine the domestic incentive structure for exporters in consonance with the WTO guidelines in order to boostexports.9 In recent years, India’s export incentive schemes have been challenged at the WTO dispute settlement mechanism. These schemes include i) Export Oriented Units (EOU) Scheme; (ii) Sector-Specific schemes, viz., Electronics Hardware Technology Park (EHTP) Scheme, Software Technology Park (STP) Scheme and Bio-Technology Park (BTP) scheme; (iii) Merchandise Exports from India Scheme (MEIS); (iv) Export Promotion Capital Goods (EPCG) Scheme; (v) Special Economic Zones (SEZ) Scheme; and (vi) Duty-Free Imports for Exporters Scheme (DFIS). IV.22 Taking cognisance of the non-compliance with WTO guidelines, the Government has introduced the Remission of Duties and Taxes on Exported Products (RoDTEP) (that replaces the MEIS) and PLI scheme for 13 sectors which are WTO-compliant. The RoDTEP scheme aims to reimburse taxes/duties/levies at the central, state and local level incurred in the process of manufacture and distribution of exported products. RoDTEP is based on the principle that taxes and levies on the exported products should be either exempted or remitted to exporters and thereforeis a step towards zero-rating of exports.10 The PLI schemes mandate investment thresholds and targets for incremental sales for availing the scheme incentives. Improvement in export competitiveness in the long-run would, however, require infrastructure and logistics support to provide exporters a level playing field in the global market. IV.23 On India’s export potential, the Bloomberg Economics ranked India at the first position among 10 Asian economies. The Confederation of Indian Industry (CII) shortlisted 31 export items whichcould improve India’s export potential.11 IV.24 The large-scale digitalisation of the economy that is currently underway, along with the advances in frontier technologies such as artificial intelligence (AI), robotics, biotechnology and nanotechnology, are likely to drive economic development going forward. While telecommunications, information services, hardware manufacturing, software and IT consulting form the core of this digital economy, these frontier technologies have opened up avenues in digital services, cloud platforms, e-commerce, e-business, industry, precision agriculture and algorithm-driven business processes. IV.25 Adoption of digital technologies can improve India’s trade competitiveness through economies of scale, scope and speed of trade. It affects all stages of a value chain, including pre-production, production and post-production, improves access of domestic firms to new export markets and also exposes domestic consumers to new products and producers (Banga, 2019). Firms in the financial and manufacturing sectors have been some of the early adopters of frontier technologies including AI, IoT, big data and blockchain (Table IV.4). IV.26 Financial firms, especially new age FinTech firms, have leveraged these technologies for credit decisions, risk management, fraud prevention, trading, personalised banking and process automation (UNCTAD, 2021). On the other hand, the manufacturing sector has used these technologies for predictive maintenance, quality control and human-robot combined working activities. Frontier technologies currently represent a global market of US$ 350 billion, which is expected to grow to over US$ 3.2 trillion by 2025 (Charts IV.11a and b). | Table IV.4: Frontier Technologies, Description and Early Adopters | | Technology | Description | Early Adopters | | Artificial intelligence (AI) | AI is normally defined as the capability of a machine to engage in cognitive activities typically performed by the human brain. | Retail, banking, discrete manufacturing | | Internet of Things (IoT) | IoT refers to Internet-enabled physical devices that are collecting and sharing data and has potential applications in areas such as wearable devices, smart homes, healthcare, smart cities and industrial automation. | Consumer, insurance, healthcare providers | | Big data | Big data refers to datasets whose size or type is beyond the ability of traditional database structures to capture, manage and process. | Banking, manufacturing, professional services | | Blockchain | A blockchain refers to an immutable time-stamped series of data records supervised by a cluster of computers not owned by any single entity and is used as a base technology for cryptocurrencies and also enables peer-to-peer transactions. | Finance, manufacturing, retail | | 5G | 5G networks are the next generation of mobile internet connectivity, offering download speeds of around 1-10 giga bytes per second as well as more reliable connections. | Energy utilities, manufacturing, public safety | | 3D printing | 3D printing (i.e., additive manufacturing) produces three-dimensional objects based on a digital file using less material than traditional manufacturing. | Discrete manufacturing, healthcare, education | | Robotics | Robots are programmable machines that can carry out actions and interact with the environment via sensors and actuators either autonomously or semi-autonomously. | Discrete manufacturing, process manufacturing, Resource industry | | Drones | A drone, also known as unmanned aerial vehicle (UAV) or unmanned aircraft systems (UAS), is a flying robot that can be remotely controlled or fly autonomously using software with sensors and global positioning system (GPS). | Utilities, construction, discrete manufacturing | | Gene editing | Gene editing, also known as genome editing, is a genetic engineering tool to insert, delete or modify the genome in organisms. | Pharma-biotech, academic/ research centre, agri-genomic/ contract research organisations | | Nano-technology | Nano-technology deals with the manufacturing of objects in scales smaller than 1 micrometre. | Medicine, manufacturing, energy | | Solar photovoltaic (Solar PV) | Solar photovoltaic (Solar PV) technology transforms sunlight into direct current electricity using semiconductors within PV cells. | Residential, Commercial, Utilities | Sources: UNESCAP (2018) and UNCTAD (2021). | 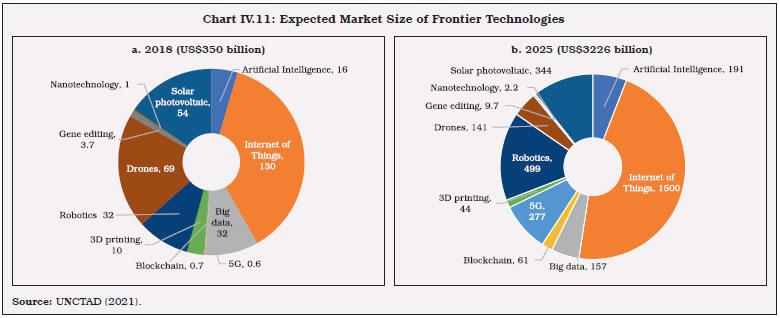 IV.27 India could create a digital economy of US$ 800 billion - US$ 1 trillion (equivalent to 18 to 23 per cent of India’s nominal GDP) by 2025 (MEITY, 2019). As per available data, India’s high-technology exports were roughly 10.3 per cent of total manufactured exports, while ICT goods exports were about 2 per cent (Table IV.5). IV.28 There is also a need for domestic firms to reap the opportunity thrown by “green” industrialisation. Countries are likely to induce shifts in consumer preference for lower-emission goods and services and facilitate adoption of climate-friendly technology. Trade baskets could, therefore, undergo compositional shifts to theextent that CO2 emission control norms are embedded into export and import baskets. India is likely to face sharper contraction in volumes of exports than imports over the long-run (OECD, 2017; UNCTAD, 2019). Mobilising green investments, adopting cleaner technologies, and promoting green collaborations to reduce carbon footprints in domestic production early could rebalance the export basket towards climate friendly goods for environment sensitive markets. India has so far not been able to tap this export potential due to institutional and infrastructure bottlenecks (Nguyen and Kalirajan, 2013). | Table IV.5: Trade and Research and Development Statistics for India | | Parameters | Value | | Researchers (per million, 2010-18) | 253 | | Technicians (per million, 2010-18) | 73 | | Scientific and Technical Journal Articles | 1,35,788 | | R&D Expenditure (% GDP, 2010-18) | 0.65 | | High-technology Exports (% manufacturing exports, as of 2019) | 10.3 | | ICT Goods Exports (% total goods exports, as of 2019) | 2.0 | | Patent Applications Filed (as of 2019) | 53,627 | | Trademark Applications Filed (as of 2019) | 45,467 | | Industrial Design Applications Filed (as of 2019) | 13,723 | | Source: World Bank Database. | 3. Role of Imports IV.29 Experience with the export-led growth strategies highlights the critical role of imports in raising exports and productivity (Kim, 2007 and Chen, 2020). Economies can raise participation in GVCs by importing foreign inputs to produce goods and services meant for exports (backward GVC participation) and also by exporting domestically produced inputs to trading partners for value addition at different stages of production (forward GVC participation). Import substitution policies work against opportunities for becoming more productive and cost competitive (Charts IV.12a and b). In the case of India, it has been empirically established that higher GDP and export growth can be induced by imports (Shirazi and Manap, 2005; Maitra, 2020). 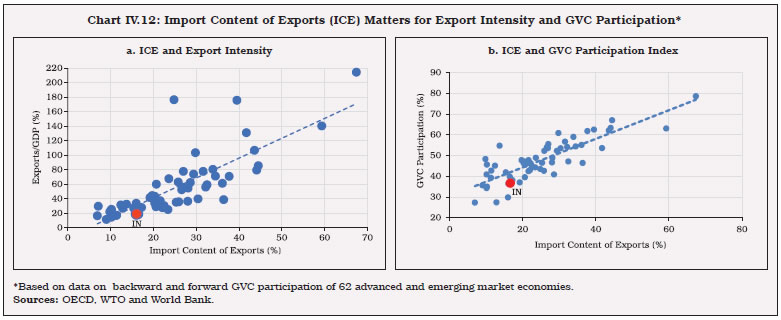 IV.30 The composition of imports also matters, including for productive absorption of capital from abroad. India’s import basket has undergone a shift away from raw materials to intermediate and capital goods over the last two decades (Chart IV.13a). Nevertheless, the share of capital goods in India’s total imports at 22.8 per cent is significantly lower than economies with higher export intensity (Chart IV.13b). Going forward, India’s foreign trade policy must not be oblivious to the experience of firms in most competitive economies which source foreign inputs of superior quality and improve competitiveness. 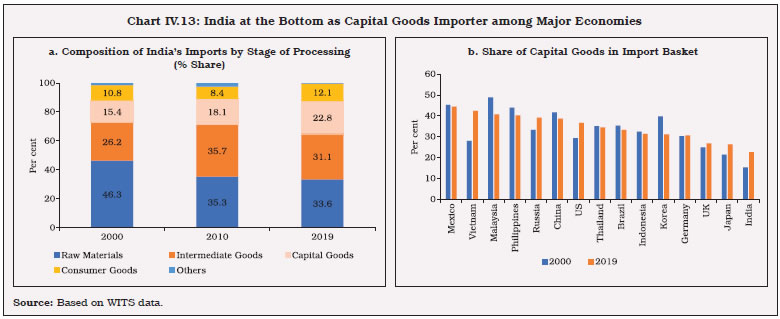
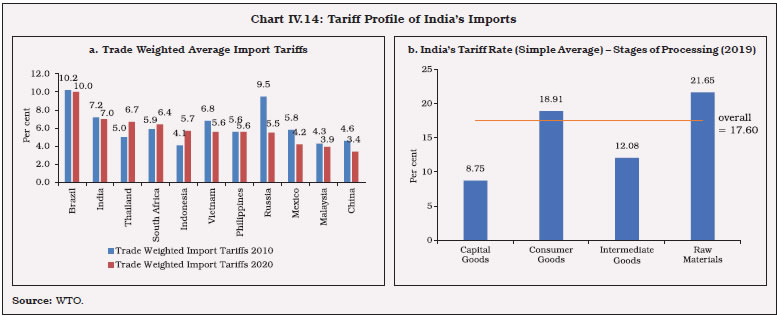 IV.31 The focus on building domestic capacities under ‘Aatmanirbhar Bharat’ aims at putting in place an eco-system that strengthens the supply chains within the country for products with export opportunities. The focus is to provide incentives and create an enabling environment for the private sector for creating capacities while fostering competitiveness. The correction in the inverted duty structure is one such example in recent years, i.e., lower tariffs on imports of raw materials/inputs than final goods. Downward adjustments in India’s average import tariff levels, which remain higher than other EMEs, can help in further enhancing export competitiveness and higher participation in GVCs (Panagariya, 2021). India regulates its trade in agricultural commodities more intensively than manufactured products and natural resources. There is scope for a more stable and open policy regime to promote agricultural exports (Charts IV.14a and b). IV.32 Diversification of India’s import basket away from a few source countries to a larger set of countries may also help domestic firms to become more resilient to global supply chain disruptions. At present, China accounts for 43.5 per cent of India’s imports of electrical machinery and equipment, 37.8 per cent of imports of other machineries, mechanical appliances, nuclear reactors, boilers and parts thereof, and 45.6 per cent of organic chemicals. An analysis based on HS 6-digit data shows that there is a scope for diversification of India’s imports to other alternative suppliers (Table IV.6). IV.33 India’s experience with various trade agreements so far may not have been encouraging (as import growth often exceeded export growth), but there is a need to secure favourable trade terms with partners for the right kind of imports that augment domestic production capacity and make the conditions for export competitiveness more conducive (Box IV.3). | Table IV.6: Commodities with High Import Dependence on China and Alternative Suppliers | | | Sr. No. | Commodities at HS-6 digit | Alternative Suppliers | | I. Electrical machinery, equipment and parts | | High import value | 1. | Parts of telephone sets | Hong Kong, Vietnam, Korea, Singapore | | 2. | Processors and controllers | Hong Kong, Malaysia, USA, Singapore | | 3. | Photosensitive semiconductor devices* | Malaysia, Japan, Korea, Vietnam | | 4. | Telephones for wireless network/mobile phones* | Vietnam, Hong Kong, UAE, USA | | 5. | Parts of machines such as transmission/radar/reception apparatus, cameras, etc. | Korea, Hong Kong, Taiwan, Vietnam | | 6. | Lithium-ion accumulators (such as batteries mostly used in laptops, PCs and mobile phones) | Korea, Hong Kong, Japan, Poland | | 7. | Static converters (such as electric inverter, rectifier, stabilizers, etc.) | Germany, Hong Kong, USA, Japan | | Low import value but crucial | 1. | Parts of Electronic ICs and micro assemble | Malaysia, Hong Kong, Japan, Singapore, USA | | 2. | Electronic ICs | Hong Kong, Singapore, Malaysia, USA | | II. Machinery/mechanical appliances/nuclear reactors/boilers & parts | | High import value | 1. | Data processing machines such as PCs** | USA, Germany, Hong Kong, Czech | | 2. | Parts such as microprocessors, motherboards | Hong Kong, USA, Korea, Taiwan | | 3. | Parts of road rollers, ships, cranes | USA, Germany, Japan, Korea | | 4. | Other pumps, compressors etc. | Germany, USA, Romania, Italy | | 5. | Air conditioners** | Thailand, Malaysia, UAE, Korea | | 6. | Ball bearings | Japan, Germany, Italy, France | | Low import value but crucial | 1. | Agricultural/horticultural mechanical appliances | USA, Israel, Italy, Turkey | | 2. | Numerically controlled shearing machines | Germany, Italy, Netherlands, Turkey | | 3. | Condensers for steam/other vapour power units* | Korea, Indonesia, USA | | III. Organic chemicals primarily bulk drugs and active pharmaceutical ingredient (API) | | High import value | 1. | Heterocyclic compounds with nitrogen hetero-atom[s] only | Switzerland, Ireland, Germany | | 2. | Penicillin and its derivatives* | Spain, Italy, Singapore | | 3. | Other ‘Rifampicin and its salts’ | Switzerland, Italy, USA | | 4. | Other heterocyclic compounds | Ireland, Japan, Switzerland, Germany | *: China’s share is more than 40 per cent in world exports; **: China dominates with more than 55 per cent share in world exports.
Source: Authors’ calculations based on ITC data. | IV.34 Given the growing focus on meeting climate change goals, India’s dependence on imported fossil fuels for meeting domestic energy demand needs to be reduced. India has set visionary targets to achieve 50 per cent of installed electric power capacity from non-fossil fuel sources and reduce the carbon emission intensity of its GDP by 33-35 per cent compared to 2005 levels by 2030. In this regard, the Aatmanirbhar Bharat initiative may play an important role by incentivising use of lower-carbon fuels for power generation, conservation of energy, and production of greener vehicles. Lower dependence on import of crude oil and coal by switching to domestically available substitutes can also reduce the income elasticity of imports. In this direction, various measures have been undertaken, including the target of 20 per cent ethanol blending by 2023-24 and 100 per cent ethanol-run vehicles over time, the focus on efficient battery technologies, and setting up of 5,000 compressed bio-gas plants to turn municipal and agricultural wastes into energy. Box IV.3
India’s Free Trade Agreements – For Trade Creation or Diversion? Trade Agreements12 as a strategy to expand trade, investment and economic cooperation is required to manage post-COVID challenges. FTA countries, however, accounted for just 21 per cent and 18 per cent of India’s exports and imports, respectively, during 2017-21. In order to examine the impact of free trade and other preferential agreements on India’s trade, a fixed effects model is attempted, using bilateral panel data of the following form: where c represents bilateral country-wise exports/imports of India in year t. The dependent variables that capture trade relationships are measured by bilateral exports (LBEXP) and bilateral imports (LBIMP). X is a vector of other variables such as domestic GDP (LGDPIND) and GDP of trade partners (LGDPTP). The coefficient of interest is ɑ1 to assess the impact of trade agreements (Dummy TA) on India’s exports and imports. The sample covers 1995-2020 period and comprises India’s 30 major trading partners that include 10 countries13 having either FTA or any other bilateral or multilateral trade agreement with India. The results suggest that trade agreements do not have any positive and statistically significant impact on India’s exports. In the case of imports, however, it is found that the trade agreements have a positive and statistically significant impact (Table 1). Any trade agreement is more likely to benefit countries having complementary export and import baskets. Evidently, India has recorded higher trade deficits with some of the ASEAN countries in the post-FTA period, underscoring the limited benefits of FTAs due to a combination of factors such as unequal decline in tariffs vis-à-vis trade partners, high cost of compliance of FTAs, and non-tariff measures continuing even after entering into FTAs. In fact, India’s net imports in certain segments increased manifold. In the case of steel, 74 per cent of India’s imports are from Japan and Korea at much lower tariffs under the FTAs, affecting the domestic sector (EXIM Bank, 2020). | Table 1: Impact of Trade Agreements on Exports and Imports | | | LBEXP | LBIMP | | LGDPTP | 0.628**
(0.0434) | | | LGDPIND | 0.829**
(0.048)** | 1.244**
(0.078) | | Dummy_TA | -0.015
(0.047) | 0.170*
(0.088) | | Obs. | 780 | 780 | | R-squared | 0.55 | 0.40 | | Year FE | Yes | Yes | | Country FE | Yes | Yes | * statistically significant at 10% level.
** statistically significant at 1% level.
Note: Figures in parentheses are standard errors. | Ongoing trade negotiations with the UK, Canada, the US, and the European region provide new opportunities, but they need to be structured strategically in terms of market access for exports and assurance on high technology imports. FTAs are more likely to benefit India through trade in services without losing the focus on merchandise trade. Reference: Relooking India’s Tariff Policy Framework, EXIM Bank. 2020. | IV.35 Despite these policy efforts, India’s energy transition, however, may face renewed uncertainties owing to ongoing global supply chain disruptions during the post-pandemic period. A gradual switch to indigenous sources of renewable and non-renewable energy and thrust on improving energy efficiency will help achieve a reduction in dependency on imported energy, going forward. Securing energy security by diversifying from imports to indigenous sources would bode well for domestic growth as well. 4. Capital Flows, Exchange Rate and Growth IV.36 Neo-classical models of growth assume that capital flows from countries with high capital-to-labor ratios to those with relatively low capital-labour ratios. Foreign capital enables capital deficient countries with unexploited investment opportunities to grow faster as it may bring in new technologies and ease the domestic saving constraint on growth. IV.37 Empirical evidence on capital moving from surplus to deficient countries, however, remains limited. Instead, there has been substantive evidence on high correlation between domestic savings rates and domestic investment rates, which is a puzzle in the context of perceived benefits of financial openness (Feldstein and Horioka, 1980). Further, the modest level of capital flowing from the rich to poor countries (Lucas, 1990) is often due to a variety of bottlenecks, viz., low absorptive capacity - given inadequate infrastructure - low skilled labour force and poor governance, besides higher risk of default on foreign debt. In a demand constrained model, the growth impact of foreign capital depends on how it affects domestic investment, savings and import propensities (Bhanumurthy et al. 2014). In general, the received wisdom is that foreign capital does not always boost long-term growth in non-industrial developing countries (Prasad et al. 2007). IV.38 In the case of India, both domestic and foreign savings seem to play an important role in boosting growth, but the latter in excess of 2.5 per cent of GDP (i.e., the sustainable level of CAD) appears to be growth retarding (Box IV.4). Box IV.4
Impact of Foreign Capital on Growth An analysis is undertaken to examine the relative roles of domestic and foreign capital in India’s growth performance following the specifications suggested by Soto (2000). Data over the period 1980-2020 are used, covering various phases of domestic growth. Besides key variables, viz., the investment rate (IR), the saving rate (SR) and the current account deficit (CAD), other control variables used are trade openness (XMGDP), net terms of trade (TOT), government consumption (GCON). While XMGDP and TOT augment GDP growth, GCON is expected to have a negative impact on growth as it represents distortions introduced by government interventions (Barro and Sala-i-Martin, 1995). When the investment rate is split into the national savings rate and the CAD in order to distinguish between the effects of domestic savings and foreign savings, it is found that both sources of savings boost growth. However, the coefficient of the CAD turns out to be larger than SR, implying a greater per unit contribution of foreign savings to growth (equation 2). Coefficients of other control variables, viz., XMGDP, net TOT and GCON have expected signs (equation 1) as seen in the cross-country experience. Equation 3 which tests the presence of a non-linear relationship between CAD and growth finds that the coefficient of the squared term of CAD is negative, implying that growth tends to be negative at very high levels of CAD (Table 1). From equation 3, the threshold CAD works out to be 2.3 per cent of GDP beyond which growth begins to decelerate. A scatter plot of India’s current account balance and growth also confirms a non-linear relationship between these two variables, with the slope turning negative around a CAD level of 2.5 per cent of GDP (Chart 1). | Table 1: Impact of Domestic and Foreign Savings on Growth | | Variable | Regression Coefficients | | Equation | 1 | 2 | 3 | | C | -4.55 ** | -6.72 * | -2.11 | | IR | 0.42 * | | | | SR | | 0.28 *** | 0.53 *** | | CAD | | 1.04 ** | 2.31 * | | CAD2 | | | -0.51 ** | | XMGDP | 0.30 ** | 0.41 * | 0.09 ** | | LTOT | 1.13 * | 1.63 * | 0.55 ** | | LGDP(-1) | -0.02 | 0.01 | -0.001 | | LGCON(-1) | -0.05 | -0.08 | -0.04 | | Adj. R2 | 0.32 | 0.36 | 0.32 | | D.W | 1.69 | 1.86 | 1.71 | | F-Stat | 4.11 | 4.14 | 3.32 | | N | 40 | 40 | 40 | *, **, ***: Represent significance at 1per cent, 5 per cent and 10 per cent, respectively.
Note: IR: Inestiment Rate, SR: Saving Rate, CAD: Current Account Deficit (+)/Surplus(-) as ratio to GDP, XMGDP: Export and imports as ratio of GDP, LGDP; Log of real GDP, LGCON: Log of Government Consumption (constant prices), LTOT: Log of Net Terms of Trade Index and DUMS=Dummy 1 for current account surplus period 2001-03. |
The sustainable level of CAD can be raised by undertaking reforms that enhance the country’s export potential, quality of imports and higher external funding in the form of FDI. References: Barro, R. and X. Sala-I-Martin (1995), Economic Growth, McGraw-Hill, New York. Soto, Marcelo (2000), “Capital Flows and Growth in Developing Countries: Recent Empirical Evidence”, OECD Development Centre Working Papers 160, OECD Publishing. | IV.39 Net capital flows to India have generally exceeded the funding requirements of the economy, as reflected in overall balance of payments surpluses (i.e., build-up of foreign exchange reserves) over the last two decades (Chart IV.15). In an open economy, foreign exchange reserves contribute to growth and investment indirectly by insulating the economy from global spillovers, containing exchange rate volatility and mitigating external vulnerability concerns. 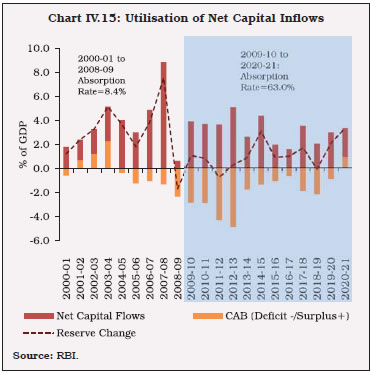 IV.40 Besides the size of foreign capital, its composition can also influence the growth outcome. The impact of FDI is widely perceived to be the largest in open economies with a skilled workforce and developed financial markets. Equity flows in the form of FDI are generally procyclical and inter alia driven by domestic growth prospects, implying that the latter can generate a virtuous cycle of stronger growth and higher FDI flows. While FDI benefits by diversifying the capital structure of local companies and providing positive externalities such as technology and knowledge diffusion (Mansfield and Romeo, 1980; Markusen and Venables, 1999; Blomström et al. 1994; Blomström and Kokko, 2002), its impact on growth also depends on whether it is for greenfield or brownfield projects. IV.41 India has followed a gradualist approach to capital account liberalisation in order to mitigate the destabilising impact of surges and sudden stops in capital flows. Recognising the critical role of FDI, the Government has put in place a transparent and predictable policy framework wherein 100 per cent ownership is permitted under the automatic route in most sectors/ activities, except for a few prohibited sectors. Its impact is reflected in the sharp improvement in OECD’s FDI Regulatory Restrictiveness Index, which measures statutory restrictions on foreign direct investment in 22 economic sectors (Chart IV.16a). In fact, the improvement in India’s FDI Regulatory Restrictiveness Index from 0.23 in 1997 to 0.04 in 2020 has been remarkable in the manufacturing sector (covered under secondary sector) and is closer to the OECD’s average of 0.02. Nevertheless, India’s inward FDI stock at 13.4 per cent of GDP during 2010-20 is modest when compared with other EMEs, viz., Brazil, Chile, Thailand, Mexico, Malaysia, Indonesia and Vietnam (Chart IV.16b). 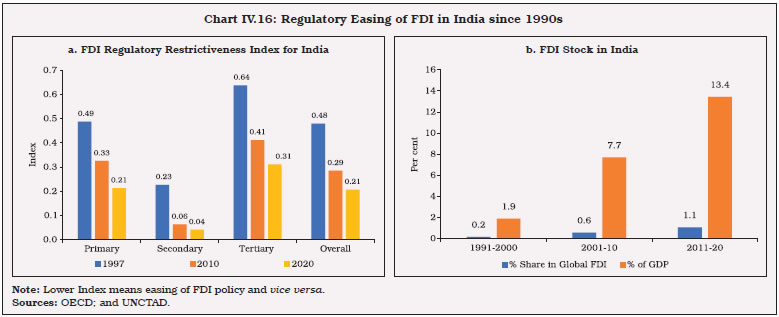 IV.42 Despite 100 per cent FDI in majority of sectors, FDI flows have remained skewed towards a handful of sectors. The PLI scheme by attracting foreign companies for domestic production can potentially generate additional exports in targeted sectors by 2026-27 (Chart IV.17). IV.43 One of the reasons that FDI has been less than potential in India is the lack of quality infrastructure which reduces the comparative advantage of firms/industries. While raising the FDI investment limits in certain sectors, particularly at the higher end of the engineering and economic value chain (e.g., defence), foreign firms expect full flexibility to own proprietary technology and decide on manufacturing processes. In the post-pandemic period, building supply chain resilience has been a top priority for domestic firms. In this regard, FDI in R&D needs to be integrated with domestic innovation systems by putting in place suitable enabling provisions in the intellectual property laws. 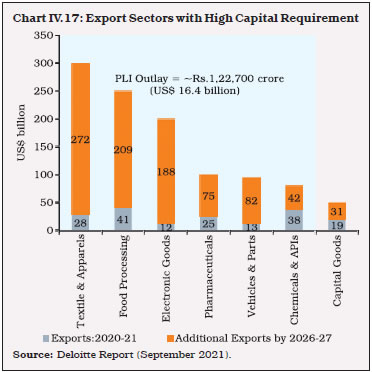 IV.44 India’s ongoing FTAs with advanced countries/regions may need to include special clauses relating to collaboration and investment promotion in the R&D sector. FDI in renewable energy sector, which has picked up in recent years, needs a further boost. The PLI scheme for High Efficiency Solar PV Modules to build domestic capacity could play a crucial role in bringing in resources such as capital and advanced technology through FDI (PIB, 2021). In order to harness growth and employment benefits of FDI, therefore, India needs to offer itself as a feasible alternative to concentrated GVCs by providing a globally competitive manufacturing environment and strengthening its commitment towards free trade. IV.45 As regards other capital flows, investment limits for FPIs’ participation in the debt segment of domestic capital market have been significantly eased in recent years. FPIs have also been provided flexibility to undertake exposures in the domestic debt market through alternative routes, viz., the voluntary retention route and the special access route. The policy framework for external commercial borrowings (ECBs) has been liberalised since 2015, particularly in terms of end-use restrictions with regard to working capital, general corporate purposes and repayment of Rupee loans availed domestically for capital expenditure subject to certain conditions. The liberalised policy framework allows greater access to funds for corporates and non-banking finance companies. Policies need to sustain the emphasis on composition of capital flows, while prioritising equity over debt flows (Box IV.5). Box IV.5
Composition of Capital Inflows and Growth Cross-country evidence suggests that FDI impacts growth positively, but the evidence is mixed on debt related flows (Aizenman et al., 2011; Soto, 2000). In order to estimate the sensitivity of growth in India to various components of capital flows, data on real GDP (LGDPVOL), net foreign direct investment (LNFDI), net foreign portfolio investment (LNFPI), external commercial borrowings (LECB) and trade credit (LSTC) are used for the period 2000:Q2 to 2021:Q1. As these variables are found to be cointegrated of order one, confirming the existence of a long-run relationship among them, a vector error correction model is specified to estimate the long-term elasticity of GDP with respect to various components of capital flows. While the long-term coefficients of FDI and FPI are found to be positive and statistically significant at 1 per cent, the coefficient of STC is weakly significant at 10 per cent level (Table 1). The VEC Granger Causality (Block Exogeneity Wald Test) confirms the causal influence of FDI and FPI on GDP growth but not for trade credit (Table 2). Empirical results do not support any growth enhancing role of ECB. | Table 1: Vector Error Correction Model | | Cointegrating Equation | | Variables | Coeff. | T-Value | | LGDPVOL | 1.00 | | | LNFDI | -0.37 | [-3.96] | | LNFPI | -0.86 | [-2.95] | | LNECB | 0.77 | [6.39] | | LSTC | -0.14 | [-1.65] | | ECT | -0.01 | [-2.81] | | Adj. R2 | 0.89 | | | F-Stat | 20.65 | | | Note: In VECM, a lag of five quarters was used. Signs need to be inversed while interpreting the coefficients in the cointegrating equation. |
| Table 2: VEC Granger Causality/Block Exogeneity Wald Tests | | Sample: 2000:Q2 - 2021:Q1 | | Included observations: 76 | | Dependent variable: DLOG(GDPVOL) | | Excluded | Chi-sq | df | Prob. | | DLNFDI | 12.35 | 5 | 0.03 | | DLNFPI | 19.00 | 5 | 0.00 | | DLNECB | 10.41 | 5 | 0.06 | | DLSTC | 2.14 | 5 | 0.83 | | All | 132.28 | 20 | 0.0 | References: Aizenman, Joshua; Yothin Jinjarak; Donghyun Park (2012), “Capital Flows and Economic Growth in the Era of Financial Integration and Crisis, 1990-2010”, NBER Working Paper 17502. Soto, Marcelo (2000), “Capital Flows and Growth in Developing Countries: Recent Empirical Evidence”, OECD Development Centre Working Papers 160, OECD Publishing. | IV.46 Exchange rate is another key factor that can affect the viability of external sector by influencing not only the trade performance of firms, but also their ability to undertake investments, especially those with foreign currency liabilities on their balance sheets. A panel cointegration relationship between export volume (LEXPVOL) of 59 countries and their respective real exchange rates (LREER) and nominal exchange rate volatility (ERVOL), world demand (LWGDP) and other competitiveness variables [viz., foreign direct investment (LFDI) and progress in global competitiveness index (GCI)] is estimated by using a fully modified ordinary least squares (FMOLS) approach for the period 2010-20, which suggests that sustained real appreciation of the exchange rate and increase in volatility have contractionary impact on export volumes (Table IV.7). Other control variables, viz., LWGDP, LFDI and D(GCI) have export boosting effects. | Table IV.7: Exchange Rate, Competitiveness and Exports Volume – FMOLS Estimates | | Dependent Variable: LEXPVOL | | Total panel (balanced) observations: 531 | | Long-run covariance estimates (Bartlett kernel, Newey-West fixed bandwidth) | | Variable | Coefficient | t-Statistic | Prob. | | LREER | -0.22 | -2.41 | 0.02 | | LWGDP | 0.59 | 7.03 | 0.00 | | ERVOL | -1.62 | -1.82 | 0.07 | | LFDI | 0.10 | 2.72 | 0.01 | | D(GCI) | 0.14 | 1.64 | 0.10 | | Adjusted R-squared | 0.97 | | | | Note: A majority of panel unit tests confirmed the presence of common unit root process. Panel Cointegraton tests, viz., Pedroni and Kao Cointegration Test confirmed the cointegrating relationship. | IV.47 Empirical research has shifted focus to firm level analysis where endogeneity between exchange rate and export decisions of firms is less of a concern (Forbes, 2002; Fitzgerald and Haller, 2010 and Campa, 2004) (Box IV.6). Box IV.6
Impact of Exchange Rate Movements on Exporting Firms Using data up to March 2020, an unbalanced panel is set up consisting of 11,075 exporting firms, of which 3,187 firms exported services and the rest were exporters of goods. The sample accounts for about 44 per cent of India’s total goods and services exports. The following fixed effects (FE) model is estimated : where, yit is a firm level outcome such as export earnings, operating profit, interest payment on foreign currency loans, and addition to gross fixed capital; xt is the independent variable of interest which is log of average exchange rate or average exchange rate volatility at time t; zt is a vector of other macro variables which may affect the outcome variables such as global GDP growth, inflation rate, etc.; vit-1 is a time varying firm level variable which may affect the outcome variables such as gross sales (it is taken at one period lag to ensure there is no reverse causality); t is time trend and are Eit idiosyncratic errors. Estimation results indicate that while exchange rate volatility has an adverse effect on export earnings of firms, the level of the exchange rate does not affect export earnings (Table 1). A 10 per cent increase in average exchange rate volatility decreases export earnings by 1.6 per cent. Among the other macro-economic variables, the effect of global GDP growth is positive and significant. | Table 1: Effect of Exchange Rate Volatility and Depreciation on Exporting Firms | | | Earnings from Export | Earnings from Export | | Average INR Volatility (In Log) | -4.2292***
(1.3562) | NA | | Average INR-USD (In Log) | NA | -7.3396
(5.9854) | | Average Inflation Rate | 0.1937
(0.3111) | -0.3336
(0.2356) | | Global GDP Growth | 0.2058**
(0.0984) | 0.2905***
(0.1070) | | Firm Size (Lag of Annual Sales) | 0.4718***
(0.1344) | 0.4717***
(0.1345) | | N | 50423 | 50423 | | Notes: The regressions are run on a nineteen-year panel of firms (unbalanced) with firm level fixed effects. Errors are clustered at the firm level. *p < 0.1, **p < 0.05, ***p < 0.01. | Analysing sectorally. the effect of volatility is found to be similar in magnitude for goods and services exporting firms. In terms of size of firms, the effect of volatility is observed for export earnings of larger firms while no statistically significant effect is observed for small firms. Analysis of firms’ profits reveals that both the level of the exchange rate and exchange rate volatility affect profits of exporters, with the effect of volatility being smaller than the exchange rate level (a 10 per cent increase in volatility decreases profits by 3 per cent, while a 10 per cent depreciation of INR against the US dollar decreases profit by 21 per cent). This may be explained by the fact that exchange rates movements may affect the cost of borrowings for firms which have foreign debt. Estimation results indicate that depreciation of exchange rate increases the interest payments on foreign loans although volatility has no significant effect (Table 2). The impact of exchange rate volatility on investment decisions of firms is also investigated but it is not found to be statistically significant. The estimation results, thus, indicate that export performance of firms is affected more by exchange rate volatility than by exchange rate levels. This is in line with the findings of Cheung and Sengupta (2013) which used firm level data and found that both exchange rate and its volatility have an impact on firms’ output and exports. | Table 2: Effect on Firms’ Profit and Cost of Debt | | | Operating Profit (INR) | Operating Profit (INR) | Interest Payments on Foreign Loans | Interest Payments on Foreign Loans | | Average INR Volatility (In Log) | -219.3699*
(127.8230) | | 0.0505
(0.6233) | | | Average INR-USD (In Log) | | -1422.3789***
(366.8112) | | -1.9530**
(0.8820) | | Average Inflation Rate | 45.8780***
(13.7187) | 1.7925
(14.0050) | 0.0465
(0.0487) | 0.0190
(0.0296) | | India GDP Growth | 9.2388
(15.4392) | 15.0752
(12.7094) | -0.0866
(0.0983) | -0.1010**
(0.0501) | | Global GDP Growth | 6.9624
(4.6268) | 7.2449
(5.2356) | -0.0009
(0.0135) | -0.0041
(0.0156) | | Firm Size | 0.0507*** | 0.0507*** | 0.0021*** | 0.0021*** | | (Lag of Annual Sales) | (0.0004) | (0.0186) | (0.0005) | (0.0000) | | N | 65832 | 65832 | 15274 | 15274 | | Notes: The regressions are run on a nineteen year panel of firms (unbalanced) with firm level fixed effects. Errors are clustered at the firm level. *p < 0.1, **p < 0.05, ***p < 0.01. | Reference: Cheung, Yin-Wong and Rajeswari Sengupta (2013), “Impact of exchange rate movements on exports: An analysis of Indian non-financial sector firms”, Journal of International Money and Finance, Vol. 39, Issue C, pp. 231-245. | 5. Conclusion IV.48 Enhancing the contribution of exports and capital flows to economic growth in the medium-term would require a strategic policy reset based on India’s own experience so far as also the evolving global macro-economic conditions and changing trade policy practices. Growing incidents of geo-political conflicts can have economic repercussions by strengthening the case for a reconfiguration of global supply chains. India’s foreign trade policy, therefore, needs to recognise the opportunities that may come along with the evolving world economic order. IV.49 In order to benefit from the global recovery in demand post-pandemic, certain preconditions such as improving the quality of exports through greater emphasis on innovations and R&D, easier access to critical inputs - both domestic and imported - exchange rate stability and more effective FTAs based on trade complementarities would be essential. IV.50 The growing focus on digitalisation offers immense opportunities. The early adopters of frontier technologies will have the first mover advantage by becoming more cost efficient. Small- and medium-sized businesses would need to gain access to global markets by using digital platforms and improving operational and supply chain efficiencies. Therefore, the foreign trade policy needs to foster the adoption of technologies that enhance the scope for complementarities between goods and services. IV.51 India’s ongoing and future FTA negotiations must focus not only on securing greater market access for domestic goods and services but also on better trade terms for high quality imports from partner countries and transfer of technology. The capital goods content in imports of major export-led economies is much higher than that of India. India’s recent focus on having bilateral FTAs with the USA, the UK, the European Union and Australia is a step in the right direction, though rebalancing in trade strategies is required keeping in view the changes taking place in the global economic environment. The focus of bilateral trade agreements with these advanced countries should be bilateral technology-sharing and forging partnership/alliance in sectors where indigenous capabilities may be weak. As the global trade environment is becoming increasingly complex and prone to more disputes, rules and provisions with regard to digitally enabled trade, data security issues and intellectual property rights should get adequate coverage in trade agreements. IV.52 While incentivising domestic production through various initiatives under Atmanirbhar Bharat to enhance export potential, it is important that global quality benchmarks are put in place for new capacities to be created in identified sectors under the PLI scheme. IV.53 Globally, it is well recognised that lower tariffs and easing of non-tariff measures can help a quicker global trade recovery. India has a strong services sector that contributes significantly to India’s total exports but faces Non-tariff Barriers (NTBs) in other countries. In order to expand exports, India needs to rationalise its tariff and non-tariff rate structure on a reciprocal basis, and this should be accorded priority under the ongoing FTAs. IV.54 Greater absorption of foreign capital in the economy for productive investment within the current sustainable level of CAD and raising the sustainable threshold for CAD in the medium-run through higher FDI flows and export conducive imports can raise the benefits of financial openness for India. When foreign exchange reserves exceed a certain precautionary level, further easing of outward FDI norms and incentivisation of capital goods imports can contain the fiscal (sterilisation) cost and/or appreciation pressure on the INR. It can also help strengthen India’s linkage in GVCs through a combination of trade and strategic partnerships abroad. IV.55 The growth inducing impact of FDI is higher than foreign debt flows. Despite significant easing of norms (limits and routes), FDI inflows in the manufacturing sector remain modest compared with the services sector. Relative to the size of the economy, FDI inflows in India are also much lower than export-led economies. It is well recognised that FDI eases supply-side constraints in the economy and domestic recipient firms become more efficient and cost effective through scale economies and vertical linkages (i.e., access to raw materials and technology). So far, only six sectors have accounted for about half of FDI equity flows and therefore, the policy focus should be to attract FDI in more sectors, particularly those with domestic technological gaps, viz., defence, industrial machinery, agricultural machinery, electronics and earthmoving machinery. The FDI policy needs to incentivise the adoption and transfer of cleaner technologies for domestic companies. References Aizenman, Joshua; Yothin Jinjarak and Donghyun Park (2012), “Capital Flows and Economic Growth in the Era of Financial Integration and Crisis, 1990-2010”, NBER Working Paper 17502. Balassa, B. (1965), ‘Trade liberalization and “revealed” comparative advantage’, The Manchester School of Economic and Social Studies No. 33, pp. 92–123. Banga, Rashmi (2019). Is India Digitally Prepared for International Trade?, Economic & Political Weekly, Vol. LIV, No.5, February, pp. 53–62. Barro, R. and X. Sala-I-Martin (1995), Economic Growth, McGraw-Hill, New York. Bhanumurthy, N. R., Sukanya Bose and Swayamsiddha Panda (2014), “Modeling India’s External Sector: Review and Some Empirics”, NIPFP Working Paper No. 2014-138. Blomström, M., A. Kokko and M. Zejan (1994), “Host Country Competition and Technology Transfer by Multinationals”, Weltwirtschaftliches Archiv, Band 130, pp. 521-533. Blomström, Magnus, and Ari Kokko (2002), “The Economics of International Investment Incentives”, https://www.oecd.org/daf/inv/investmentpolicy/2487874.pdf. Campa, Jose Manuel (2002), “Exchange rates and trade: How important is hysteresis in trade?”, European Economic Review, Vol. 48, pp. 527–48. Cheung, Yin-Wong and Rajeswari Sengupta (2013), “Impact of exchange rate movements on exports: An analysis of Indian non-financial sector firms”, Journal of International Money and Finance, Vol. 39, Issue C, pp. 231-245. Chen, Guifu; Shan Zhan, and Shigeyuki Hamori (2020), “The Influence of Quality and Variety of New Imports on Enterprise Innovation: Evidence from China”, Sustainability, Vol 20 (9537), pp. 1-20. Das, Shaktikanta (2020), “What Forces Could Drive the Recovery?”, Address at the FICCI’s National Executive Committee Meeting on September 16, 2020. Feldstein, M., and C. Horioka (1980), “Domestic Saving and International Capital Flows”, Economic Journal, Vol. 90, pp. 314–29. Fitzgerald, D. and Haller, S.A. (2008), “Exchange Rates and Producer Prices: Evidence from Micro Data” available at http://citeseerx.ist.psu.edu/viewdoc/download?doi=10.1.1.408.8583&rep=rep1&type=pdf. Forbes, J. Kristin (2002), “How Do Large Depreciations Affect Firm Performance?”, IMF Staff Papers, Vol. 49 (Special Issue), pp. 214–38. Herman, Peter and Lee, Ryan (2019), “The Short- Run Effects of Product Differentiation on Trade (November 7, 2019)”, USITC Office of Economics Working Paper 2019-11-A, Available at SSR N: https://ssrn.com/abstract=2690336 or http://dx.doi.org/10.2139/ssrn.2690336. Kaldor, N. (1966), Causes of the Slow Growth in the United Kingdom, Cambridge: Cambridge University Press. Kim, Sangho; Hyunjoon Lim and Donghyun Park (2007), “Could Imports be Beneficial for Economic Growth: Some Evidence from Republic of Korea”, ERD Working Paper No.103, Asian Development Bank. Lucas, Robert (1990), ';Why Doesn't Capital Flow from Rich to Poor Countries?';, American Economic Review, Vol. 80, pp. 92–96. Maitra, Biswajit (2020), “Exploring Import led Growth in India: Evidence from the Post-reform Period”, South Asian Journal of Macroeconomics and Public Finance, Vol.9(1), pp. 87–113. Mansfield, Edwin, and Anthony Romeo (1980), “Technology transfer to overseas subsidiaries by US-based firms”, Quarterly Journal of Economics, Vol. 95, pp. 737–50. Markusen, James R., and Anthony J. Venables (1999), “Foreign direct investment as a catalyst for industrial development”, European Economic Review, Vol. 43, pp. 335–56. MEITY (2019), India’s Trillion-Dollar Digital Opportunity. Ministry of Electronics and Information Technology, Government of India, New Delhi, India. Nguyen, Van Son and Kaliappa Kalirajan (2013), “Export of Environmental Goods: India's Potential and Constraints”, ASARC Working Paper No. 2013/15. Panagariya, Arvind (2021), “India’s Trade Policy: Past, Present and the Future”, EXIM Bank’s 36th Commencement Day Annual Lecture on March 19, 2021. Press Information Bureau (2021), Ministry of New and Renewable Energy, Government of India, New Delhi, India. Prasad, Eswar, Raghuram Rajan and Arvind Subramanian (2007), “The Paradox of Capital”, Finance and Development, Vol.44, No.1 (March), International Monetary Fund. Raj, Rajesh (2017), “Output Synchronization of the Indian Economy in the Post-reform Period: An Assessment”, Foreign Trade Review, Vol. 52, No. 2, pp. 63–89. Rauch, James E. (1999), “Networks versus markets in international trade”, Journal of International Economics, Vol.48, Issue 1, pp. 7-35 EXIM Bank (2020), Relooking India’s Tariff Policy Framework. Shirazi, N. S. and Abdul Manap, T. A. (2005), “Export-led growth hypothesis: Further econometric evidence from south Asia”, The Developing Economies, Vol. 43(4), pp. 472–488. Soto, Marcelo (2000), ';Capital Flows and Growth in Developing Countries: Recent Empirical Evidence';, OECD Development Centre Working Papers 160, OECD Publishing. Kaur, Sumanpreet (2019), ';Business Cycle Synchronization for India: An Appraisal via Trade Intensity,'; Romanian Economic Journal, Department of International Business and Economics from the Academy of Economic Studies Bucharest, Vol. 22(72), pp. 78-101. Thirlwall, A. P. (1979), ';The balance of payments constraint as an explanation of international growth rate differences';, Banca Nazionale del Lavoro Quarterly Review, Vol. 32(128), pp. 45-53. Thirlwall, A. P. (2013), Economic Growth in an Open Developing Economy: The Role of Structure and Demand, Cheltenham: Edward Elgar.Downing College , Cambridge , CB2 1DQ , UK. UNCTAD (2019), “Value Creation and Capture: Implications for Developing Countries”, Digital Economy Report 2019, United Nations Conference on Trade and Development, Geneva, Switzerland. UNCTAD (2021), “Catching technological waves: Innovation with equity”, Technology and Innovation Report 2021, United Nations Conference on Trade and Development, Geneva, Switzerland. UNESCAP (2018), Frontier Technlogies for sustainable development in Asia and the Pacific, United Nations Economic and Social Commission for Asia and the Pacific, Bangkok, Thailand. Verdoorn, P. J. (1949), “Fattori che Regolano lo Sviluppo della Produttività del Lavoro”, L’Industria, Vol. 1, pp. 3-10.
|