Today, the Reserve Bank released the results of its Consumer Confidence Survey (CCS)1 for the July 2022 round. The survey obtains current perceptions (vis-à-vis a year ago) and one year ahead expectations on general economic situation, employment scenario, overall price situation and own income and spending across 19 major cities. The latest round of the survey was conducted during July 07 to July 14, 2022, covering 6,083 responses. Highlights: -
Consumer confidence2 continues to recover in successive rounds of the survey after the historic low recorded in July 2021, though it remained in the pessimistic zone; the current situation index (CSI) rose by 1.4 points on account of improved perception on employment, household income and spending (Chart 1 and Tables 2, 5 and 6). -
Consumers’ perception of prevailing price level as well as inflation declined from that in the previous round of the survey; they expect further rise in prices, but inflation is expected to moderate marginally over the next one year (Tables 3 and 4). -
Consumers expressed optimism on the outlook for the economic situation and overall spending over the next one year, though it was partially countervailed by some weakening in expectations for employment, price level and household income, in relation to May 2022 round of the survey; as a result, the future expectations index (FEI) recorded only marginal improvement (Chart 1 and Tables 1, 2, 3, 5 and 6). -
Majority of the households reported a rise in their current spending and anticipated that the trend would continue for the year ahead (Tables 6). 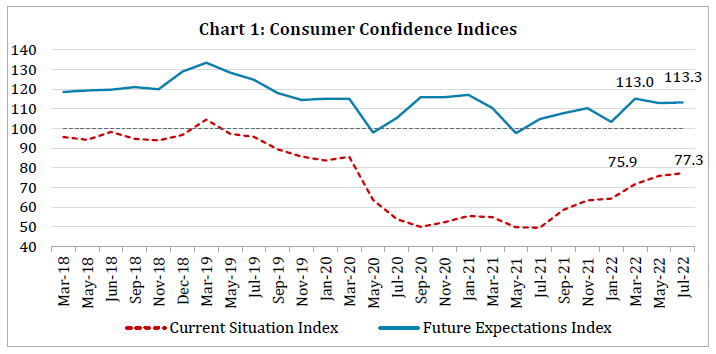 Note: Please see the excel file for time series data3
| Table 1: Perceptions and Expectations on the General Economic Situation | | (Percentage responses) | | Survey Round | Current Perception | One year ahead Expectation | | Improved | Remained Same | Worsened | Net Response | Will Improve | Will Remain Same | Will Worsen | Net Response | | Jul-21 | 10.0 | 12.1 | 78.0 | -68.0 | 40.1 | 16.3 | 43.6 | -3.4 | | Sep-21 | 15.4 | 13.0 | 71.6 | -56.2 | 42.3 | 18.1 | 39.6 | 2.7 | | Nov-21 | 17.4 | 12.6 | 70.1 | -52.7 | 44.6 | 17.3 | 38.1 | 6.4 | | Jan-22 | 17.8 | 15.6 | 66.7 | -48.9 | 40.8 | 16.7 | 42.5 | -1.7 | | Mar-22 | 21.7 | 16.2 | 62.2 | -40.5 | 49.2 | 15.2 | 35.7 | 13.5 | | May-22 | 22.5 | 14.9 | 62.7 | -40.2 | 45.4 | 15.3 | 39.4 | 6.0 | | Jul-22 | 21.6 | 15.4 | 63.0 | -41.5 | 46.4 | 14.9 | 38.8 | 7.6 |
| Table 2: Perceptions and Expectations on Employment | | (Percentage responses) | | Survey Round | Current Perception | One year ahead Expectation | | Improved | Remained Same | Worsened | Net Response | Will Improve | Will Remain Same | Will Worsen | Net Response | | Jul-21 | 10.9 | 11.6 | 77.5 | -66.5 | 42.7 | 16.6 | 40.7 | 2.0 | | Sep-21 | 15.6 | 13.5 | 70.9 | -55.4 | 45.7 | 18.1 | 36.3 | 9.4 | | Nov-21 | 19.6 | 16.5 | 64.0 | -44.4 | 48.9 | 18.1 | 33.0 | 16.0 | | Jan-22 | 17.4 | 17.2 | 65.4 | -48.0 | 41.4 | 19.3 | 39.3 | 2.2 | | Mar-22 | 23.6 | 17.0 | 59.5 | -35.9 | 52.9 | 17.0 | 30.2 | 22.7 | | May-22 | 27.3 | 17.8 | 54.9 | -27.6 | 51.3 | 16.7 | 32.1 | 19.2 | | Jul-22 | 28.1 | 17.3 | 54.6 | -26.5 | 50.7 | 17.2 | 32.0 | 18.7 |
| Table 3: Perceptions and Expectations on Price Level | | (Percentage responses) | | Survey Round | Current Perception | One year ahead Expectation | | Increased | Remained Same | Decreased | Net Response | Will Increase | Will Remain Same | Will Decrease | Net Response | | Jul-21 | 92.6 | 5.6 | 1.8 | -90.8 | 71.5 | 16.3 | 12.2 | -59.4 | | Sep-21 | 92.6 | 5.7 | 1.7 | -91.0 | 75.0 | 14.5 | 10.5 | -64.5 | | Nov-21 | 95.1 | 3.9 | 1.0 | -94.2 | 76.6 | 12.6 | 10.9 | -65.7 | | Jan-22 | 93.4 | 5.4 | 1.2 | -92.3 | 78.1 | 12.4 | 9.5 | -68.6 | | Mar-22 | 93.3 | 5.6 | 1.2 | -92.1 | 79.1 | 10.4 | 10.5 | -68.6 | | May-22 | 95.4 | 4.1 | 0.5 | -94.9 | 80.0 | 11.1 | 8.9 | -71.1 | | Jul-22 | 95.2 | 4.0 | 0.9 | -94.3 | 80.4 | 10.9 | 8.8 | -71.6 |
| Table 4: Perceptions and Expectations on Rate of Change in Price Level (Inflation)* | | (Percentage responses) | | Survey Round | Current Perception | One year ahead Expectation | | Increased | Remained Same | Decreased | Net Response | Will Increase | Will Remain Same | Will Decrease | Net Response | | Jul-21 | 87.6 | 10.4 | 2.0 | -85.6 | 79.8 | 15.9 | 4.3 | -75.5 | | Sep-21 | 88.2 | 9.0 | 2.9 | -85.3 | 82.9 | 12.9 | 4.3 | -78.6 | | Nov-21 | 90.6 | 7.1 | 2.3 | -88.4 | 82.4 | 13.2 | 4.4 | -78.0 | | Jan-22 | 88.1 | 8.7 | 3.2 | -84.9 | 81.7 | 13.5 | 4.7 | -77.0 | | Mar-22 | 88.5 | 9.3 | 2.2 | -86.2 | 83.9 | 12.4 | 3.7 | -80.2 | | May-22 | 91.3 | 7.0 | 1.7 | -89.7 | 81.7 | 14.2 | 4.1 | -77.6 | | Jul-22 | 88.5 | 8.9 | 2.6 | -85.9 | 81.8 | 13.6 | 4.6 | -77.3 | | *Applicable only for those respondents who felt price has increased/price will increase. |
| Table 5: Perceptions and Expectations on Income | | (Percentage responses) | | Survey Round | Current Perception | One year ahead Expectation | | Increased | Remained Same | Decreased | Net Response | Will Increase | Will Remain Same | Will Decrease | Net Response | | Jul-21 | 8.0 | 27.2 | 64.9 | -56.9 | 45.7 | 40.3 | 14.1 | 31.6 | | Sep-21 | 11.2 | 31.5 | 57.3 | -46.1 | 45.4 | 41.8 | 12.8 | 32.6 | | Nov-21 | 13.0 | 36.0 | 51.0 | -38.1 | 47.9 | 40.8 | 11.3 | 36.6 | | Jan-22 | 12.3 | 38.0 | 49.7 | -37.4 | 43.2 | 42.5 | 14.3 | 29.0 | | Mar-22 | 16.0 | 42.1 | 42.0 | -26.0 | 52.9 | 38.5 | 8.6 | 44.3 | | May-22 | 17.6 | 46.0 | 36.4 | -18.9 | 52.4 | 39.2 | 8.4 | 44.0 | | Jul-22 | 18.2 | 46.0 | 35.9 | -17.7 | 51.6 | 40.0 | 8.4 | 43.3 |
| Table 6: Perceptions and Expectations on Spending | | (Percentage responses) | | Survey Round | Current Perception | One year ahead Expectation | | Increased | Remained Same | Decreased | Net Response | Will Increase | Will Remain Same | Will Decrease | Net Response | | Jul-21 | 51.5 | 27.0 | 21.6 | 29.9 | 62.7 | 27.8 | 9.5 | 53.1 | | Sep-21 | 58.3 | 25.4 | 16.3 | 42.0 | 66.0 | 26.7 | 7.3 | 58.8 | | Nov-21 | 62.2 | 22.1 | 15.8 | 46.4 | 66.4 | 25.7 | 8.0 | 58.4 | | Jan-22 | 61.7 | 24.9 | 13.3 | 48.4 | 64.4 | 26.9 | 8.7 | 55.8 | | Mar-22 | 64.1 | 24.8 | 11.1 | 53.0 | 70.4 | 23.2 | 6.4 | 64.1 | | May-22 | 69.4 | 22.1 | 8.5 | 60.9 | 72.5 | 21.7 | 5.8 | 66.7 | | Jul-22 | 72.6 | 21.1 | 6.3 | 66.3 | 73.0 | 22.4 | 4.6 | 68.3 |
| Table 7: Perceptions and Expectations on Spending- Essential Items | | (Percentage responses) | | Survey Round | Current Perception | One year ahead Expectation | | Increased | Remained Same | Decreased | Net Response | Will Increase | Will Remain Same | Will Decrease | Net Response | | Jul-21 | 65.4 | 18.8 | 15.8 | 49.7 | 71.1 | 21.7 | 7.2 | 63.9 | | Sep-21 | 72.4 | 16.5 | 11.1 | 61.3 | 73.5 | 20.7 | 5.8 | 67.8 | | Nov-21 | 75.4 | 14.5 | 10.1 | 65.4 | 74.1 | 20.1 | 5.8 | 68.4 | | Jan-22 | 75.7 | 15.6 | 8.7 | 67.1 | 73.5 | 20.1 | 6.4 | 67.0 | | Mar-22 | 76.6 | 15.7 | 7.7 | 68.9 | 78.6 | 16.2 | 5.2 | 73.5 | | May-22 | 81.7 | 12.8 | 5.5 | 76.2 | 79.9 | 15.7 | 4.4 | 75.4 | | Jul-22 | 82.0 | 13.7 | 4.3 | 77.7 | 80.0 | 16.5 | 3.6 | 76.4 |
|
| Table 8: Perceptions and Expectations on Spending- Non-Essential Items | | (Percentage responses) | | Survey Round | Current Perception | One year ahead Expectation | | Increased | Remained Same | Decreased | Net Response | Will Increase | Will Remain Same | Will Decrease | Net Response | | Jul-21 | 9.3 | 26.9 | 63.8 | -54.5 | 23.9 | 36.9 | 39.2 | -15.3 | | Sep-21 | 10.2 | 28.9 | 60.8 | -50.6 | 25.5 | 37.0 | 37.5 | -12.0 | | Nov-21 | 12.9 | 26.8 | 60.4 | -47.5 | 25.0 | 36.3 | 38.7 | -13.7 | | Jan-22 | 14.3 | 31.1 | 54.5 | -40.2 | 23.6 | 38.6 | 37.8 | -14.2 | | Mar-22 | 16.1 | 31.6 | 52.2 | -36.1 | 28.9 | 36.7 | 34.4 | -5.5 | | May-22 | 16.6 | 34.1 | 49.3 | -32.7 | 27.5 | 38.4 | 34.1 | -6.6 | | Jul-22 | 18.7 | 35.9 | 45.5 | -26.8 | 29.3 | 38.5 | 32.2 | -2.9 |
|