| Table of Contents | | 1. Introduction | | 2. Governance for Banks in India: Structure, Reforms and Policy Amendments | | 2.1 Governance Structure for Banks in India | | 2.2 Governance Models across Countries: An International Comparison | | 2.3 Governance Reforms in India | | 2.4 Selected Governance Characteristics | | 3. Governance, Efficiency and Soundness of Banks: A Relevant Literature Review | | 3.1 Bank Governance: A Relevant Literature Review | | 3.2 Bank Efficiency: A Relevant Literature Review | | 3.3 Bank Soundness: A Relevant Literature Review | | 3.4 Relationship between Governance, Efficiency, and Soundness | | 4. Measurement of Bank Governance, Soundness and Efficiency | | 4.1 Governance Index: Norms and Dimensions | | 4.2 Bank Soundness Index: Indicators and Dimensions | | 4.3 The Constrained “benefit-of-the-doubt” Model | | 4.4 Estimation of Profit Efficiency | | 5. Data, Econometric Methodology, and Hypotheses | | 5.1 Database | | 5.2 Econometric Methods | | 5.2.1 Empirical Design of the Model and Panel Econometric Methods | | 5.3 Development of Key Testable Hypotheses | | 6. Empirical Results and Discussion | | 6.1 Bank Governance in India | | 6.1.1 Evolution of Governance in the Indian Banking Industry | | 6.1.2 Sources of Governance Non-compliance | | 6.1.3 Optimal Policy Weights on Governance Dimensions | | 6.2 Bank Soundness in India | | 6.2.1 Evolution of Soundness Level in the Indian Banking Industry | | 6.2.2 Dimensions of Bank Soundness | | 6.2.3 Optimal Policy Weights on Bank Soundness Dimensions | | 6.3 Profit Efficiency in the Indian Banking Industry | | 6.3.1 Evolution of Profit Efficiency in the Indian Banking Industry | | 6.4 Exploring a Relationship between Governance, Efficiency and Soundness | | 6.4.1 Results of Overall Governance and Bank Soundness | | 6.4.2 Dimensions of Governance and Bank Soundness | | 6.4.3. Selected Governance Indicators and Bank Soundness | | 6.5 Robustness Check using Alternate Econometric Methods | | 7. Conclusions and Policy Implications | | References | | Annexures | | Annexure-I: Governance Models across Countries: An International Comparison | | Annexure-II: Comparison of Governance Guidelines by Legislative Authorities in India | | Annexure-III: List of Banks | | Annexure-IV: Indicators, Norms, and Dimensions of Bank Soundness and Governance | | Annexure-V: Description of Variables | | Annexure-VI: Testing for the significance of the differences in Governance, Efficiency, and Soundness across distinct Bank Groups | | Annexure-VII: Results of Mean Unconditional Regressions | | Abbreviations |
Issued for Discussion DRG Studies Series Development Research Group (DRG) has been constituted in Reserve Bank of India in its Department of Economic and Policy Research. Its objective is to undertake quick and effective policy-oriented research backed by strong analytical and empirical basis, on subjects of current interest. The DRG studies are the outcome of collaborative efforts between experts from outside Reserve Bank of India and the pool of research talent within the Bank. These studies are released for wider circulation with a view to generating constructive discussion among the professional economists and policy makers. Responsibility for the views expressed and for the accuracy of statements contained in the contributions rests with the author(s). There is no objection to the study published herein being reproduced, provided an acknowledgement for the source is made that the study was funded by the Reserve Bank of India under the DRG Study Series. The reproduced study should not contradict the findings of the original DRG study. Further, the reproduced study may be published with the same set of authors as the original DRG study. DRG Studies are published on RBI website only and no printed copies will be made available. Director
Development Research Group |
Governance, Efficiency and Soundness of Indian Banks by Rachita Gulati1a
Sunil Kumarb
S. Chinngaihlianc
Rajendra Raghumandad
Prabal Bilantue Abstract The report delivers the response to the key research question: do governance and efficiency explain bank soundness in India? The subject of this report is of utmost significance for an emerging economy like India, but until now, it falls in little-investigated research territory. An empirical investigation is done using the unique panel dataset for the period spanning from 2009 to 2018. The study built the bank-wise non-parametric indices of corporate governance and bank soundness utilising the “Benefit-of-the-Doubt” approach and estimated the risk-adjusted profit efficiency scores for banks using the data envelopment analysis approach. Based on the publicly available information on banks, the empirical connection between governance, efficiency and soundness of banks is explored using the dynamic panel data econometric models. The empirical results uncover that although Indian banks have made impressive progress in adhering to the mostly mandatory corporate governance norms/standards in the last few years, the existing compliance level is not adequate to label the current governance structure as a “socially efficient” structure. The analysis of sampled banks reveals noticeable asymmetries in the policy priorities across ownership groups on underlined dimensions of governance and soundness. The results of the econometric estimation are robust, and reveal that the governance structure crucially determines bank soundness, and profit efficient banks are sound enough to hold the capability of absorbing shocks. The key policy implication stemming from the empirical outcomes is that inadequate regulatory adherence by banks with governance norms would be costlier and may have destabilising impact on the banking sector. JEL Codes: G21, G28, G38 Keywords: governance; bank soundness; profit efficiency; composite index; benefit-of-the-doubt approach; data envelopment analysis; dynamic panel econometric methods; panel quantile regression; Indian banks.
Acknowledgments It is our privilege to express a deep sense of gratitude to the Reserve Bank of India (RBI) for sponsoring this study on “Governance, Efficiency and Soundness of Indian Banks” as part of the Development Research Group (DRG) Studies under the aegis of the Department of Economic Policy and Research (DEPR). We deeply acknowledge our thanks to Dr. Rajeev Ranjan (then Officer-in-Charge, DEPR) for their encouragement to pursue this research. Thanks are also extended to Dr. Jai Chander, former Director, DRG, DEPR, and his team members for their valuable support at the various stages of the completion of this study. The report has also been benefitted from valuable comments of anonymous reviewers and suggestions of Shri Sitikantha Pattanaik (then Adviser-in-Charge), Dr. Arvind Kumar Jha (then Director, DRG), and Dr. Snehal Herwadkar (Director), RBI, and their team members on various drafts. We also acknowledge the comments and suggestions from the Department of Supervision and Dr. Pallavi Chavan (Director, DRG, DEPR), which have helped improve the quality of the report. Thanks are also to all the student assistants who helped us with this project. We are, however, responsible for all the errors that remain with the usual disclaimers. Rachita Gulati
Sunil Kumar
S. Chinngaihlian
Rajendra Raghumanda
Prabal Bilantu
Executive Summary This report answers the key research question: do governance and efficiency explain bank soundness in India? This subject is of significant interest to all the stakeholders. However, so far, there exists no sufficient evidence in this regard for the Indian banking industry. In particular, this study aims to examine the nexus between governance, efficiency, and soundness using a unique and new bank-level panel dataset obtained from publicly available information in the individual bank’s annual report for the period from 2008-09 to 2017-18. The research objectives are accomplished by constructing the non-parametric “Benefit-of-the-Doubt (BoD)” based composite indices for bank governance and soundness. An index of governance is built using 48 governance norms/standards, covering six key dimensions of bank governance: “board effectiveness”, “audit function”, “risk management”, “remuneration”, “shareholders’ rights and information”, and “disclosure and transparency”. For building a composite index of bank soundness, the study employs 14 ratio indicators encompassing five distinct dimensions: “capital adequacy”, “asset quality”, “profitability”, “liquidity”, and “management efficiency”. The risk-adjusted profit efficiency scores are calculated using a data envelopment analysis (DEA) model, which accommodates internal risk control variables in line with the ‘optimal’ approach suggested by Simper et al. (2017). The relationship between bank soundness, efficiency and governance is ascertained by using the state-of-the-art dynamic econometric methods for panel data. From the empirical analysis regarding levels and developments of governance and soundness across ownership groups, we reach to the following conclusions. First, albeit banks in India have made significant progress in complying with governance norms in the last few years, the current compliance level is insufficient to label the existing governance structure as “socially efficient”. Second, private banks showed relatively better performance in adhering to governance norms during the study period. Notably, public sector banks (PSBs) stumbled in achieving greater compliance with the dimensions of board effectiveness, risk management, and audit functions. Third, the analysis of trends in soundness levels of banks in India shows that from 2008-09 to 2012-13, the banking industry remained relatively sound before early signs of a decline began to appear in 2013-14. However, this up-turn in the bank soundness was reversed due to endogenous shocks coupled with an economic downturn, and banking groups experienced widened soundness gaps. Fourth, a significant drop in profitability and asset quality caused an increase in the fragility and vulnerability of the Indian banking system in the turbulent period. An assessment of policy priorities divulges that, on average, PSBs accord higher priority to disclosure and transparency, which is followed by the remuneration, and shareholders’ rights and information. In contrast, private banks ascribe a greater focus on audit function, followed by risk management and board quality. On dimensions of bank soundness, PSBs amply focused on management efficiency, while private banks zeroed in on management efficiency, followed by asset quality and profitability. These differences highlight asymmetries in the policy priorities of banks on governance and soundness across ownership groups. The report draws the following inferences while investigating the nexus between governance, efficiency and soundness using the cutting-edge dynamic econometric tools for panel data. First, governance significantly explains bank soundness, and any regulatory non-adherence to selected governance principles would be costly and may undermine soundness of the Indian banking system. Second, profit-efficient banks are sound enough to hold the capability of absorbing shocks, which may reduce destabilising effects. Therefore, to avoid the risk of bank failure in the long-run, business practices that assure sustainable profits with proportionate risk be encouraged. Third, there is a lack of instantaneous recovery in bank soundness may be due to the detrimental effects of many potential exogenous and endogenous shocks to the system. Fourth, government engagement can serve as an implicit assurance and safeguard, only to a point; beyond that, it may not necessarily foster bank soundness. Fifth, positive spillover effects of re-regulation and new regulatory reforms resulting from adverse events (like under-reporting of financial data by banks, inadequate compliance with governance standards/norms, management malpractices, etc.) are not felt immediately. The retrieval process is still in operation in pushing the banking industry back to an erstwhile soundness level. Based on this study's assessment of governance dimensions and norms on bank soundness, we draw attention to the following. First, a prominent emphasis only on stringent compliance with board attributes and a meagre focus on other important dimensions of governance may be costly and impede bank soundness. Second, pro-active regulatory developments in the aftermath of the year 2014 have resulted in increased audit compliance, contributing to greater bank soundness. Third, mere regulatory compliance with risk management principles is not adequate to make a bank sound. Instead, other policy interventions, especially in the form of greater supervisory power to resolution authorities and better compliance on risk governance, may improve soundness. Fourth, better remuneration practices help the board to decide performance-linked compensation packages for executives, lower agency conflicts and enhance bank soundness. Fifth, higher compliance with shareholders’ rights enhances the soundness of banks, and superfluous disclosure might precipitate the risk of being unsound and thus need rationalisation on this front. Finally, quality board meetings, a large proportion of outside directors on the audit committee, and a remuneration committee assist in exercising better controls and averting shocks in the industry. As to the effect of board independence on bank soundness, the impact is observed to be uneven across ownership groups. Finally, the empirical results mentioned in this paper are robust to different estimation models for panel data.
Governance, Efficiency and Soundness of Indian Banks 1. Introduction In the past few years, particularly since the global financial crisis (GFC) of 2007-09, the regulators, supervisors, and policymakers around the globe have begun to pay greater attention to issues such as bank soundness, bank efficiency, and good corporate governance issues of banks. The raison d'être for this renewed interest involved the colossal effects of the crisis that were brought about in large part by the inadequate bank corporate governance, which created a climate of inertia, caused a massive collapse, and resulted in increased vulnerability and fragility in the banking system (Jokippi & Monnin, 2013). The fall of the Royal Bank of Scotland (RBS) is one of the noteworthy examples illustrating how failure in bank corporate governance can have a lasting impact on a nation’s economic growth. This bank failed mainly because of the lack of sound decision-making abilities of its management executives and other fellow directors on the board. As a result, the government has to bail out RBS with taxpayer money to prevent its collapse. Financial Services Authority Board (2011) describes the economic cost of this bank failure as: “RBS’s failure has imposed large costs on UK citizens… The larger costs arise from the recession, which resulted from that crisis, within which RBS’s failure played a significant role. That recession has caused unemployment for many, losses of income and wealth for many more (p. 6)”. An example such as this illustrates clearly how inadequate bank corporate governance can not only wreak havoc on the bank’s finances, but also have detrimental effects on the economy of a country. Following such instances of bank failures, regulatory and supervisory authorities have been re-evaluating and redesigning banking sector policies with a clear focus on adopting appropriate governance norms to achieve a high level of soundness in the banking system. Such evidence of bank failures and the resulting insolvency in the banking systems of the Western world compelled the Reserve Bank of India (RBI) to establish a Financial Stability Unit in 2009 and pressed to include bank stability/soundness as its most coveted goal in the policy formulation. In conjunction with this, a series of recent developments in the Indian banking industry, such as large scale bank frauds, cases of money laundering, as well as the unusual exposure of Indian banks to credit risk, have raised concern over the inadequacies of the governance structure for banks and its ramifications for the soundness and efficiency of the banking industry. RBI has made various steps for furthering sound corporate governance and supervision in the Indian banking system in recent years (RBI, 2014, 2020). Specifically, the transparency and disclosure standards are aligned with international best practices, and the systems of off-line surveillance and prompt corrective action are adopted for promoting bank soundness. Overall, RBI recognised the importance of good governance of banks for achieving higher efficiency and soundness levels and has taken an array of proactive steps in this direction. This is clear from the remark of Mr. Shaktikanta Das, the Governor of RBI, in the foreword of the Financial Stability Report - 2019. In the report, he echoed the significance of good governance of banks by stating that “the importance of good corporate governance across the board is the most significant factor that can promote stability and lift the efficiency of our economy to its full potential”. According to the official statistics by the RBI, the ratios of gross and net non-performing assets as a percentage of total advances have raised significantly from 2.3 per cent and 1.1 per cent, respectively, in 2007-08 to 9.1 per cent and 3.7 per cent in 2018-19 (RBI, 2019a). Additionally, the banking industry registered a total of 6,801 frauds in 2018-19, worth INR 715.43 billion (RBI, 2019a). Regarding banking operations, 53 per cent of these frauds (i.e., 3,606 frauds) are predominantly related to credit lending. In publicly available sources, insider involvement and management “dishonesty” or failure to conduct effective internal and statutory audits or the breach of regulatory guidelines (particularly concerning issuing of letters of credit), or the senior management’s failure to implement an effective strategy for governance or all are hinted at as possibilities for why these frauds occurred. Therefore, it has served as an alarming bell to policy analysts and academic researchers to re-examine the level of existing governance standards and identify the impact of governance and efficiency on Indian banking soundness. Recognising the significance of effective governance for banks and its ramifications, numerous efforts have been made by the regulators and legislators to institutionalise governance mechanisms for banking companies in India (see, for details, RBI 2001, 2002, 2014; Ministry of Corporate Affairs, 2013; SEBI, 2015). It is noteworthy here that the Indian Government has set up an institutional system for bank governance, under their own legal and regulatory statutes; Companies Act (CA), 1956 (as amended in 2009 & 2013), which is based on guidelines established by the M/o. Corporate Affairs; the SEBI under Clause 49 (LODR) Regulations, 2000 (amended in 2005, 2009, 2015 & 2017); and Report of the Corporate Governance Committee, 2017. In the past two decades, the governance structure for banking companies in India has evolved from the “single-aspect,” comprising the board of directors and executive/board committees only, to the “multiple-aspects” including the role of audit, remuneration, nomination, risk management committees, and ownership structure. Nonetheless, Indian banks, especially PSBs, face trouble in the smooth implementation of all layers due to “dual regulation” by the Government of India (GoI) and RBI that has limited their capacity to compete with their private counterparts in terms of profitability and efficiency (RBI, 2001). Against this background, it has become crucial to develop a profound understanding of the degree of effectiveness of governance mechanisms, bank efficiency level, and how they impact the overall soundness of the banking industry in India. As an attempt in this direction, this report responds to the following pertinent research questions: What are the extent of governance compliance, bank efficiency and bank soundness in India? What are the optimal policy priorities of sampled banks regarding underlined dimensions of governance and soundness? In which dimension should a less sound (or less governed) bank focus? Do governance and efficiency explain bank soundness in India? In particular, the report helps to achieve the following research objectives: i) to explore the dynamics of bank governance, efficiency and soundness; ii) to estimate “benefit-of-the-doubt” (hereafter, BoD) based data-driven and endogenously defined optimal policy weights corresponding to the underlined dimensions of soundness and governance for Indian banks; and iii) to examine the relationship between bank governance, efficiency and soundness. It is fundamentally essential to answer these research questions at this critical moment when financial distress and fragility have reached a tangible limit and become a major policy concern for bank regulators. An innovative non-parametric constrained “benefit-of-the-doubt” (BoD) model, as proposed by Cherchye et al. (2004, 2007), is used to quantify and create composite governance and soundness indexes. Our composite index of bank soundness is based on 14 ratio indicators, as suggested in RBI (2010). The selected ratio indicators encompass five distinct aspects: “capital adequacy”, “asset quality”, “profitability”, “liquidity”, and “management efficiency”. It is imperative to indicate that the non-parametric index of bank soundness computed here is a more meaningful and holistic measure since it overcomes the significant inadequacies of the Z-score, the most popularly used bank soundness measure in the extant literature. Note that the Z-score is an accounting measure and captures bank insolvency risk2. It compares only bank buffers (returns & capitalisation) with risk (estimated by returns volatility). The main limitation of this measure is that it does not consider other aspects of bank soundness, such as asset quality, management performance, liquidity, or volatility to market risk (Huljak, 2015; Shaddady & Moore, 2019). The index of bank governance is based on the computational framework suggested by Gulati et al. (2020), which aggregates six dimensional indices of bank governance. These dimensions pertain to “board effectiveness”, “audit function”, “risk management”, “remuneration”, “shareholders’ rights and information”, and “disclosure and transparency”. This study considers 48 governance standards/norms defined by legislative and regulatory authorities for computing dimensional indices and the composite index of bank governance (see Sections 4.1 & 4.2 for more details). The BoD-based computational process used here for constructing the composite indices yields endogenous data-driven optimum policy weights for different dimensions of bank governance and soundness for each sampled bank. These weights explain the policy priorities and preferences of a bank and shed light on the area(s) of bank governance and soundness that needs policy interventions. In particular, the BoD approach is chosen due to its key advantages such as i) due to its non-parametric nature, it is not reliant on pre-assumptions and is appropriate for combining the unit invariant data; ii) it is also suitable for small samples; iii) the variants of the BoD approach allows the actual data (both positive & negative financial ratios) to choose endogenous weights (OECD, 2008); iv) it enables the extraction of “implicit” policy weights needed to linearly aggregate a set of dimensions from the observed data. Thus, the underlined extraction process eliminates the arbitrariness in choosing the weights required for aggregation; v) it takes a range of dimensions/indicators and assigns a single numerical score (so-called composite index) (Puyenbroeck, 2018); vi) it allows a differential weighting scheme that provides endogenous (i.e., decided by the model rather than predetermined) weights for dimensions that vary across sample units (Greco et al., 2019); and vii) the computational process is fairly intuitive and straightforward. At a final step, the study examines a connection between governance, profit efficiency and bank soundness using a two-step system generalised method of moments (GMM) approach3. An analysis of governance-soundness nexus is carried out by testing whether better compliance with any or all governance aspects predicts a bank’s soundness. The controlling effect of efficiency in impacting the connection between governance and soundness is also investigated. For this, the risk-adjusted profit efficiency scores of banks are estimated by choosing the “optimal” approach, suggested by Simper et al. (2017), for selecting an appropriate set of risk measures in a bank efficiency study. The DEA approach is used to obtain the profit efficiency scores for sampled banks. An empirical analysis is conducted using the data set for the period 2009-2018, which covers the adoption of the governance guidelines by Indian banks, as well as their revision and amendment. This study is expected to provide regulators and policymakers with a deeper understanding of interconnection between bank governance, profit efficiency and bank soundness. Further, the study results will help banks to focus on key governance and soundness issues that must be addressed urgently to avoid financial crises in the future. The study departs from existing work on corporate governance, efficiency, and soundness in several ways. First of all, the BoD model is used for the first time in this study to build non-parametric indices of corporate governance and bank soundness. Prior studies have either used unweighted averages or principal component analysis (PCA) when computing these indices (Gulati et al., 2020). However, PCA is inappropriate when sample sizes are small and variability is low (OECD, 2008). In addition, the linear average method eases the assumption that indicators are non-compensated. Thus, it is beneficial and appropriate to use the BoD approach to construct bank-level indices since it enables utilisation of unit-invariant data, applying idiosyncratic weights and aggregating multiple dimensions simultaneously to construct a composite index (Rogge & Puyenbroeck, 2007; Puyenbroeck, 2018). In light of the highlighted advantages of the BoD approach and shortfalls of its counterparts, this study constructs the bank governance and soundness indices based on a computationally less cumbersome algorithm that generates bank-specific data-driven endogenously determined weights for distinct dimensions rather than weights based on an abstract, subjective judgment. Furthermore, these weights indicate the policy priorities and preferences of sampled banks concerning underlined dimensions. Another contribution of this study lies in using data information on 14 ratio indicators and 48 equity and debt governance norms to construct bank soundness and governance indices, respectively. The corporate finance literature argues stakeholders for banking firms include not only shareholders (majority and minority), but also, comprises depositors and other creditors whose trust needs to remain intact in the bank by the managers. Therefore, the scope of corporate governance, particularly for banks, extends beyond the equity governance (shareholders) to encompass debt governance (debtholders)4. As far as we could possibly know, no previous empirical study used such a wide array of indicators to build these indices of bank soundness and governance. At long last, this is perhaps the first study that investigates a link between “governance-efficiency-soundness” in the banking industry in India. To the authors’ knowledge, there exists no study to date that attempted in this direction. In India, bank governance and soundness can be studied for two main reasons. First, dispersed ownership structures have led to several bank collapses and governance failures in developed nations, such as in the U.S. and the UK (Ard & Berg, 2010). In contrast, emerging and developing economies such as India, which have banking systems characterised by deeply concentrated financial holdings (particularly their state-owned banking segment), have experienced relatively fewer collapses and largely remained untouched by the GFC of 2007-09 (see, for example, Eichengreen and Gupta, 2013; Kumar et al., 2016; Gulati and Kumar, 2016). With this in mind, it would be worth investigating whether adhering to governance codes within a banking industry characterised by concentrated ownership guarantees soundness. The study's observations can also be applicable to countries such as Pakistan and China where the banking sector has a highly concentrated ownership structure5. Second, the tepid performance of banks, especially PSBs, in the domestic market and the significant decline in bank activities abroad due to frauds and money laundering, necessitate increased transparency and improved corporate governance. Since this study pinpoints specific areas where governance needs to be strengthened, its conclusions can be used for formulating a strategy for achieving sustainable growth in India’s banking sector. The remaining of the study proceeds as follows. In the following section, we discuss governance structures and reforms, as well as governance models across nations. A description of key governance indicators for the banking industry and across bank groups is also presented. The following section reviews the literature on bank soundness, corporate governance, and performance. We then look at indicators, ratios and dimensions of bank governance and soundness. Additionally, a discussion of governance dimensions and bank soundness is provided. We present the database, methodology, and analytical tools in the subsequent section. The penultimate section provides empirical results, and the final section discusses policy implications, limitations, and directions for future research. 2. Governance for Banks in India: Structure, Reforms and Policy Amendments 2.1 Governance Structure for Banks in India As of 1st April 2020, there are 12 public sector banks (PSBs) in which the GoI holds more than 50 per cent of the stake, 22 private banks (PBs), and 44 foreign banks (FBs). All public and private banks are listed except for three old private banks (the Catholic Syrian Bank, the Tamilnad Mercantile Bank, and the Bank of Nainital). Reserve Bank of India regulates banks under the Banking Regulation Act, 1949 (amended in 2017), which gives the industry a unified regulatory environment. Interestingly, governance regulations, especially concerning board composition, are separate for banks under distinct ownership types. Note here that even though efforts were made to harmonise the regulatory structure across ownership types, yet some differences still exist. The governance and regulatory structure of Indian banks are outlined in Table 1. From the table, it is observed that the “Banking Companies (Acquisition & Transfer of Undertakings) Acts of 1970 and 1980” govern the board composition and structure of the nationalised banks, while the State Bank of India (SBI) Act of 1955 defines the set of regulations for SBI. Private banks are governed under the Companies Act of 1956 (amended in 2009 & 2013), which is broadly based on entity laws. On contrasting governance structure across public and private bank groups, it is observed that in private banks, the board of directors play a supervisory role and appoints managers to run the bank. While in PSBs, the GoI, in consultation with RBI through the Appointments Committee of the Cabinet, decides the appointment of the board of directors except for shareholders appointees. The key agency concern that emerges because of this arrangement is that there exists a dual regulation system for PSBs, in which the Ministry of Finance of the GoI and RBI define the legal and regulatory frameworks for these banks. The presence of the dual regulation system debilitates the regulatory discipline leading to feeble corporate governance in PSBs. Further, ownership concentration and control with the government, especially of PSBs, raise the agency conflict of type II, which may have troubled the banks in the smooth implementation of all layers, and limited their ability to compete with their private counterparts (RBI, 2001). In addition, the ownership concentration varies significantly across PSBs. Interestingly, the proportion of government-owned equity shares in Indian state-owned banks is quite high that varies from a minimum of 63 per cent in the Bank of Baroda to a maximum of 93 per cent in the UCO Bank as of 1st April 2020. Table 1: Governance Structure of Banks in India
(As of end March-2018) | | Ownership type | Public Sector Banks (PSBs) | Private Banks (PBs) | | Banks | 11 Nationalised banks and State Bank of India. | 12 Old private and 10 New private banks. | | Regulatory framework | Banking Regulation Act, 1949 (amended in 2017). | Banking Regulation Act, 1949 (amended in 2017) | | Legal framework | Nationalised banks: The “Banking Companies (Acquisition & Transfer of Undertakings) Acts of 1970 & 1980”
SBI: State Bank of India Act of 1955. | Companies Act of 1956 (amended in 2009, 2013). | | Composition of board# | Nationalised Banks: 8 categories of directors on the board: Whole-time directors (Chairman & Executive Directors); Central Govt. official directors; RBI director; workmen employee directors; officer employee directors; Chartered Accountant directors; Central Govt. nominee directors; and Elected Shareholder directors.
SBI: 7 categories, excluding Chartered Accountant directors. | Three categories, with executive directors, part-time independent directors and part-time non-independent directors (earlier 5 categories). | | Board Strength | Minimum of 10 and maximum of 15 directors (incl. nominee directors) for companies with a net worth of INR 15 crore. | Minimum of two and maximum of 12 directors (excluding nominee directors). | | Appointments of directors | By the GoI, through appointments Committee of Cabinet, in consultation with RBI. RBI, vide their communication “DBOD. No.BC. No.47/ 29.39.001/ 2007-08 dated Nov.1, 2007”, notified banks to constitute the nomination committee of Board of Directors. However, the role of the nomination/ appointments committee is limited to elected/ appointed shareholder directors. | By nomination/appointments committee of the board of directors where the existing board of directors works with the CEO to appoint suitable new directors, and the final director appointment needs approval from the RBI. | | Board Meetings | At least 6 times in a year | At least 4 times in a year | | Listing of banks | All banks are listed on the BSE and the NSE and governed as per listing rule by listing regulator - SEBI - under Clause 49 [LODR] Regulations, 2000 (amended in 2005, 2009, 2015 & 2017) | All new private banks and nine old private banks are listed on the BSE and the NSE. Also, governed as per listing rules by listing regulator – SEBI - under the Clause 49 [LODR] Regulations, 2000 (amended in 2005, 2009, 2015 & 2017). | | Directorship in other companies or committees (Inter-locked directors) | A non-executive director on the board will be eligible to be a director on the boards of at most 6 other listed companies, and a whole-time director on at most 3 companies | A non-executive director on the board will be eligible to be a director on the boards of at most 7 other listed companies, and a whole-time director on at most 3 companies | | Remuneration and Compensation | Until 2007, the remuneration to the whole-time directors in the PSBs was as per the GoI guidelines. In accordance with M/o. Finance, Dept. of Economic Affairs (Banking Div.) notification F.No.20.I.2005-Bo-I, dated 09.03.2007, and the “Corporate Governance Voluntary Guidelines, 2009” by the Dept. of Corporate Affairs, many banks constituted the Remuneration Committee of the Board of Directors. They recommended the performance-linked incentives for the whole-time directors of PSBs; while the non-executive directors will only be paid the sitting fees for attending the meetings as per the GoI rules. | Compensation or Remuneration committee of the board of directors incentivises top management (i.e., CEO) in accordance with their performance reflected through bank profits or returns through stock options while an independent director will not be entitled to any stock options and may receive a sitting fee as per the GoI rules. | | Director’s age | Minimum age of 35 and maximum age of 60 as per the GoI rules | Minimum age of 21 and maximum age of 70 for directors of companies and the maximum age should be 65 for whole-time directors | | Director’s Tenure | The chairman shall be appointed on 5-year tenure; whole-time and other directors for 3-year tenure with a maximum period not exceeding 9 years, Chartered Accountant Director for not exceeding 15 years. | No non-executive independent director shall hold office for more than 10 years (2 consecutive terms) | Notes: # The executive directors are inside or whole-time directors on the board, while the non-executive directors are outside or part-time directors who either may be independent or non-independent. The non-independent or affiliated or “grey” directors are generally former company officials, relatives of the officials, or those who have any existing business relationships with the company, while non-executive or non-affiliated or independent directors, other than the nominee director to the company, are those who perform advisory or fiduciary roles for the interest of shareholders.
Source: Authors’ elaboration from various regulatory and legal acts and committee reports | 2.2 Governance Models across Countries: An International Comparison The groundwork for governance principles for banks is done by the Basel Committee on Banking Supervision (BCBS), who published the newest set of guidelines on the “Corporate Governance Principles for Banks” in 2015. From the perspective of the banking industry, the committee defines corporate governance as “a manner in which business and affairs of a bank are governed by the board of directors and senior management” (BCBS, 2015). Since then, the national regulatory authorities have been either amending or proposing a new set of governance codes, presumably, consistent with the latest principles of governance by the Basel Committee with the purpose of remaining globally competitive and financially stable. However, differences remain in the governance models adopted by banking systems across nations, mainly due to differences in legal, economic, regulatory, or political-cultural environments. The banking systems in the US, UK, and India follow the so-called “one-tier” board structure. In contrast, the Chinese banking system follows a “two-tier” board structure representing a separation of management and supervisory boards. Jurisdictions such as in India and Japan set limits on the number of bank directorships held by a director to reduce potential agency conflict of interests among stakeholders. Dissimilarities also exist in adopting a shareholder versus stakeholder models6, while India and the UK follow the Anglo-Saxon or shareholder (or rule-based model) of the US; Japan and China support a hybrid approach representing a mix of shareholder and stakeholder models. Japan (under the Abenomics agenda) introduced principles-based stewardship codes of “comply or explain” for listed banking companies. Aside from Japan, the bank boards in the US, UK, India, and China constitute a risk management committee. Only India forms a stakeholder’s relationship committee as an additional mandatory requirement to protect investors’ and shareholders’ rights7. 2.3 Governance Reforms in India In 1996, the Confederation of Indian Industry (CII) established a “National Task Force on Desirable Corporate Governance: A Code” (led by Rahul Bajaj) to strengthen and promote corporate governance standards. The committee was given the task of designing governance codes for Indian corporations, including banks and financial institutions, as well as recommending guiding principles for publicly listed firms. The task force's proposed corporate governance criteria were endorsed by SEBI's “Committee on Corporate Governance” (chaired by Kumar Mangalam Birla). In order to implement the recommendations of this committee, SEBI added a new clause to the listing requirements, widely recognised as Clause 49 of LODR. In 2003, SEBI established a “Committee on Corporate Governance”, chaired by N. Murthy, to improve the transparency of listed firms and line up their listing agreements with the Companies Act. SEBI took its recommendations into account in amending Clause 49 of the LODR to include independent directors, whistleblower mechanisms, remuneration committees, and board performance evaluations. Clause 49 has been revised three times since 2009: in 2009, 2015, and most recently in 2017. The most recent amendments were made in response to the suggestions of the ';Committee on Corporate Governance 2017'; (led by U. Kotak) that focuses on improving corporate governance, protecting investors, and boosting transparency in Indian industry. To develop cogent standards for governance in Indian commercial banks, the RBI formed the ';Standing Committee on International Financial Standards and Codes'; (chaired by Y.V. Reddy) in 2000, which later entrusted the task to the ';Advisory Group on Corporate Governance” in 2001 (chaired by R.H. Patil). This group compared frameworks for corporate governance practices in India with international best practices and put recommendations that encompass all aspects of corporate governance, as proposed by the OECD. The recommendations include such as directors' responsibilities, shareholders’/stakeholders' accountability, criteria for selecting independent directors, the board structure and composition, the constitution of committees (audit, nominating and remuneration, stakeholder relationship), and relevant disclosures. Further, RBI established the ';Consultative Group of Directors of Banks and Financial Institutions'; (chaired by A.S. Ganguly) for reviewing the role of boards as supervisors, which, in 2002, submitted a report making specific suggestions for scheduled commercial banks and non-banking finance companies. Recently, a review of boards of Indian banks was undertaken by the ';Committee to Review Governance of Boards of Banks in India'; (chaired by P. J. Nayak). It was recommended by the Nayak committee that listed banks should follow the SEBI regulations on corporate governance. The prevailing governance codes for banks are based on an ';Anglo-American'; one-tier board structure. It combines both executive (insiders) and non-executive (outsiders) directors into one unified body. As board members, the executive directors engage in both managerial and oversight roles; ownership and management are completely separated. Several recommendations have been made by the above committees over the years, including the following: i) ensuring an optimum mix of insider and outside directors, including at least one woman on the board; ii) having an appropriate frequency of board meetings; iii) maximum board size of fifteen including nominees; iv) having at least three functional committees of the board- audit, remuneration, and risk management; v) effective internal assurance functions; vi) disclosure and transparency in compliance with listing agreements; and vii) a separate report on the bank's corporate governance. As part of its plan to strengthen governance standards in banks, the RBI published a ';Discussion Paper on Governance in Commercial Banks in India'; in 2020. In accordance with existing guidelines/instructions issued by the FSB, the BCBS, and the BBB, this discussion paper solicits inputs and suggestions from the public. This paper outlines indicates sweeping changes to the current governance structure, which will optimise bank resource allocation, protect depositor interests, and maintain financial stability. 2.4 Selected Governance Characteristics In this sub-section, we examine the temporal variations in key variables related to the governance of public and private banking groups in India. The underlined governance parameters are i) board composition and structure, ii) audit committee and audit function, iii) risk management function, and iv) remuneration policy. Also, temporal changes in mean remuneration paid to executives and bank’s ownership equity shareholding with the government have been discussed. In 2013, the regulatory and legislative authorities introduced a series of new governance reforms, added new clauses, and amended existing governance standards. Therefore, to capture the impact of recent reforms on governance parameters, the study breaks the full period from 2009 to 2018 into two sub-periods: 2009-2013 and 2014-2018. Table 2 summarises the descriptive statistics of selected governance variables in the Indian banking industry. In addition, the yearly variations at three points in time 2009, 2014, and 2018 are presented in Figures 1-4. Board composition and structure: It is well established that an ideal board with a perfect mix of inside and outside directors is able to resolve agency conflicts effectively and enhance bank efficiency and soundness. In terms of the board's composition and structure, SEBI's listing agreement and CA 2013’s clause 149 (4) recommend that the board be composed of an appropriate mix of executive and non-executive members, with at least one woman director to ensure that they are able to discharge their fiduciary duties efficiently. The nominee director shall not be defined as an independent director, following the SEBI’s Clause 49 (II.B). The board should conduct a reasonable number of meetings and constitute qualified and independent board-level committees with their discrete functions. Following the US Sarbanes-Oxley Act of 2002, Indian regulators made it mandatory that the board have the majority of non-affiliated independent directors, who are free of decision-making in the business activities and functioning of the overall board as well as in board-level committees. In accordance with revised Clause 49 (I.A.i and ii, 2009), at least two-third of board members should be outsiders, in the case of a non-executive chairman, and for an executive chairman, it should at least half. A new Clause 49 (II.B) introduced in the SEBI 2015 and CA 2013 requires independent (outside) directors on the board to certify their independence & schedule at least one separate meeting in the financial year (see Table II.1 in Annexure-II, for more details). Table 2 and Figure 1 show that, on average, the bank board in India has 11 directors, including executive directors (inside or whole-time directors), non-executive (affiliated and non-affiliated) directors, and nominee directors. Among ownership groups, although the mean board size is more or less 10 over the years, PSBs have only 41 per cent board members as independent directors compared to 69 per cent in PBs in 2014. However, the percentage of independent directors on the board has declined to 32 per cent for PSBs and 58 per cent for PBs, respectively, in the terminal year of the study. In total, the sampled banks have 54 per cent independent directors during the first sub-period (2009-2013) compared to 47 per cent during the second sub-period (2014-2018). The observed decline in the independent directors on the bank boards in India seems consistent with developments in banking systems across Asia. According to the Global Financial Stability Report (2014), the share of independent directors on the bank boards in Asia is lower (about 30 per cent in 2012-13) than in Europe (about 50 per cent in 2012-13) and the United States (about 70 per cent in 2012-13). With respect to the frequency of board meetings and per cent of female directors, the study observes no discernible difference. On average, the bank board conducts 12 meetings per year, with a frequency of at least one meeting a month. To adhere to regulatory norms pertaining to gender diversity on the board, at least one woman director is preferably appointed, which is reflected from the mean percentage of women directors on the board as 10 per cent (see Table 2). In the case of CEO duality and appointment of non-executive chairman on the board, a remarkable difference is visible. As in 83 per cent of PSBs, the same person holds two positions of the chairman and the CEO, compared to only 18 per cent of PBs in 2009. Further, the percentage of PSBs representing CEO duality declined to 14 per cent in 2018. In 2018, 88 percent of PBs appointed a non-executive director as chairman. PSBs have seen a rise in the percentage of banks with a non-executive chairman from 9 per cent in 2009 to 48 per cent in 2018. 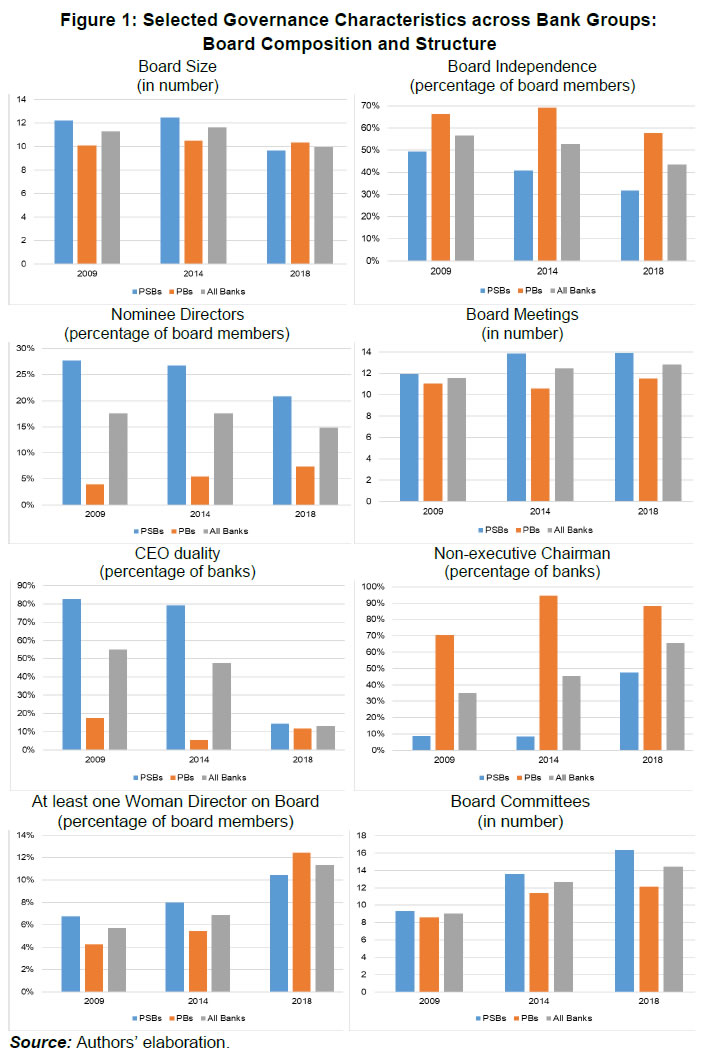 Audit committee and audit function: The legislative and regulatory authorities recommend that banks form an audit committee of their boards comprised of at least three non-executive directors, preferably two-thirds of them should be independent. The audit committee can invite an executive director as a special invitee. If, in any case, non-independent and insider directors form the part of the committee, the reason should be disclosed in the annual report. The internal audit function should be transparent and sound enough and explained as a part of the annual report, and the required details should be given to the statutory auditor(s). Both the internal and external auditors report directly to the committee. Table 2 and Figure 2 reveal that the average number of meetings held by the audit committee members is 9 in a year, the mean percentage of independent (outside) directors in the audit committee is 55 per cent, and the average number of directors on the audit committee is five during the period 2009-2018. Of the sampled banks, 95 per cent of banks append a certificate of compliance by the statutory auditor(s) in their annual report. 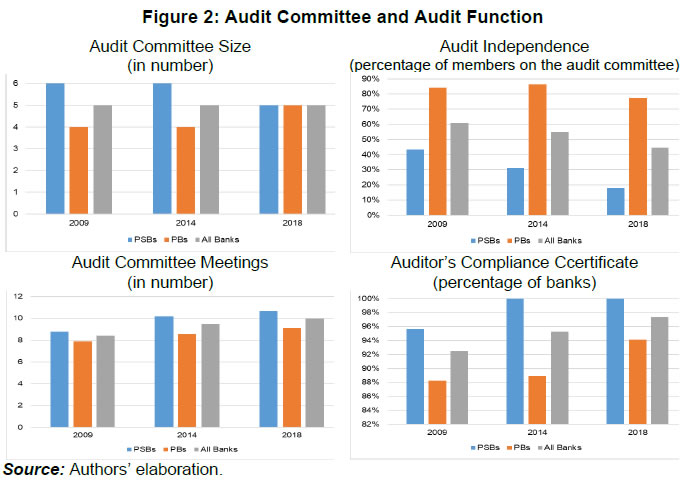 Interestingly, bank groups behave differently. On average, the audit committee of a PSB has six members and met more frequently, 9 times in 2009 to 11 in 2018. In PBs, the average committee size was 4 in 2014 and 5 in 2018. The average number of independent directors on the audit committee of PSBs and PBs are 35 per cent and 81 per cent, respectively. Almost 100 per cent of the PSBs in our sample obtained an auditor’s compliance certificate, while only 89 per cent of the PBs complied with this norm in 2014, and this percentage increased to 94 in 2018. | Table 2: Summary Statistics of Selected Governance Characteristics | | Governance Variables↓ | 2009-2018 | 2009-2013 | 2014-2018 | | Bank Groups→ | All banks | PSBs | PBs | All banks | PSBs | PBs | All banks | PSBs | PBs | | Board effectiveness | | BOARDSIZE | 11 | 11 | 10 | 11 | 11 | 10 | 11 | 10 | 11 | | BINDEP (%) | 50 | 40 | 64 | 54 | 44 | 67 | 47 | 37 | 61 | | BMEET | 12 | 13 | 11 | 12 | 13 | 11 | 12 | 13 | 11 | | CEOD (% of banks) | 38 | 61 | 8 | 51 | 82 | 8.2 | 25 | 38 | 7 | | BCOMM | 12 | 13 | 11 | 10 | 11 | 10 | 14 | 15 | 12 | | WOMENP (%) | 8 | 8 | 7 | 6 | 7 | 3.9 | 10 | 10 | 10 | | Audit committee and audit function | | AUDITSIZE | 5 | 6 | 4 | 5 | 6 | 4 | 5 | 5 | 5 | | AUDITINDEP (%) | 55 | 35 | 81 | 58 | 41 | 81 | 51 | 28 | 81 | | AUDITMEET | 9 | 10 | 9 | 9 | 10 | 8 | 10 | 10 | 9 | | AUDITCOMP (% of banks) | 95 | 99 | 90 | 94 | 98 | 88 | 96 | 99 | 92 | | Risk management function | | RISKSIZE | 5 | 6 | 5 | 5 | 5 | 5 | 5 | 6 | 5 | | RISKNEX (% of banks) | 32 | 12 | 59 | 24 | 4 | 51 | 41 | 22 | 68 | | RISKMEET | 4 | 5 | 4 | 4 | 5 | 4 | 5 | 5 | 4 | | Remuneration | | REMCOMM (% of banks) | 93 | 94 | 91 | 88 | 92 | 82 | 97 | 95 | 100 | | REMMEET | 2 | 1 | 4 | 2 | 1 | 3 | 3 | 1 | 4 | | MEXREM (INR in lakhs) | 190.0 | 58.2 | 372.8 | 133.2 | 46.5 | 258.0 | 249.3 | 71.0 | 485.1 | | MEDEXREM (INR in lakhs) | 63.9 | 53.2 | 78.8 | 55.0 | 51.4 | 83.0 | 72 | 61.0 | 200.0 | Notes: BOARDSIZE, Board size (no. of directors on the board); BINDEP, percentage of independent directors on the board; BMEET, Board meetings; CEOD, CEO duality (percentage of banks); BCOMM, Board committees; WOMENP, percentage of woman directors on the board; AUDITSIZE, size of the audit committee; AUDITINDEP, percentage of non-executive independent directors on the audit committee; AUDITMEET, no. of meetings held by audit committee; AUDITCOMP, self-reporting statutory auditor’s compliance certificate (percentage of banks); RISKSIZE, size of the risk committee; RISKNEX, non-executive chairman of the risk committee; RISKMEET, no. of meetings held by the risk management committee; REMCOMM, percentage of banks having remuneration committee; REMMEET, no. of meetings held by remuneration committee; MEXREM, mean executive remuneration; MEDEXREM, median executive remuneration.
Source: Authors’ calculations. | Risk management8: Regarding risk governance, the “Consultative Group of Directors of Banks/Financial Institutions, 2002” has recommended that each bank should constitute a stand-alone board-level risk management committee (RMC). The constitution of the RMC not only avoids the dual hatting of the chairman of the audit committee (OECD, 2014) but also allows independent monitoring of the risk policy for a bank. In India, the Central Vigilance Commission separately monitors the risk practices of the state-owned banks due to their corporate social responsibility. Besides, the “Report of the Corporate Governance Committee, 2017” (Chairman: Uday Kotak) recommended that all the top 500 of the largest listed companies should form this risk committee. Based on sampled data, we note that the percentage of banks having a non-executive member as a chairman of the risk management committee increased from 22.5 per cent in 2009 to 57 per cent in 2018 (see Table 2 & Figure 3). In PSBs, this percentage had escalated from 0 per cent in 2009 to 47 per cent in 2018. This figure is much larger in PBs (70 per cent vis-à-vis 47 per cent in 2018) than PSBs. On average, the risk management committee conducts four meetings in a year and has a mean size of 5 members (including the chairman). 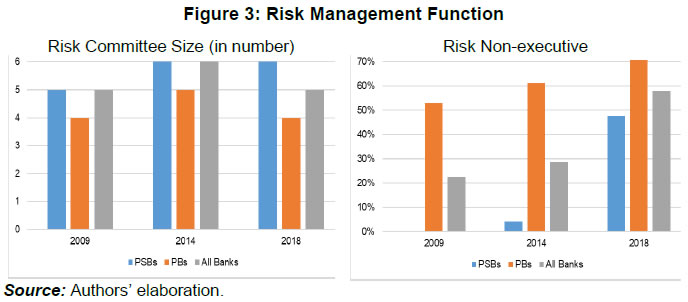 Remuneration committee and bank executive remuneration: Initially, the constitution of the remuneration committee was voluntary in 2009 (refer to SEBI revised Clause 49 (item 2) 2009 and Corporate Governance Voluntary Guidelines 2009). However, the new clause 49 (IV.E) 2015 and CA 2013 mandate the constitution of a remuneration committee with all non-executive directors and an independent director as the chairman. The statistics reveal that only 64 per cent of PBs had a dedicated remuneration committee in 2009 and 100 per cent in 2014. In PSBs, 95 per cent of banks constituted the remuneration committee in 2014. On average, this committee meets four times a year in PBs and only once a year in PSBs. Table 2 and Figure 4 presents the trends in remuneration paid to bank executives in India during the whole study period9. The average (median) executive remuneration has increased in the industry as a whole and across bank groups. The mean (median) executive remuneration turns out to be INR 110.97 lakhs (INR 34.96 lakhs) in 2009 and INR 296.22 lakhs (INR 93.02 lakhs) in 2018, with INR 190 lakhs (INR 93.02 lakhs) during the entire study period 2009-2018. This figure is smaller for the executives of PSBs because it is GoI, who decides it in consultation with RBI. Further, bank executives are not entitled to stock options and equity grants in PSBs during the study period. Only 8 PBs have paid stock options to their executives during the entire study period. Thus, there exist significant differences in the remuneration policy and executive remuneration packages across bank ownership groups. 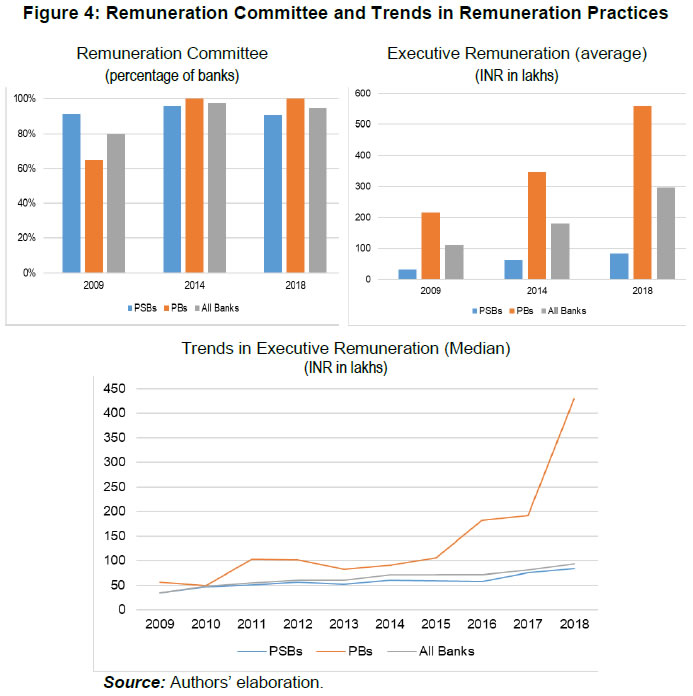 On average, in terms of ownership shareholding, government ownership in the bank’s equity shareholding has increased to 77.1 per cent for PSBs in 2018. In the case of PBs, only 17.5 per cent and 3.5 per cent of the shareholding rest with the government in 2014 and 2018, respectively (see Figure 5). 3. Governance, Efficiency and Soundness of Banks: A Relevant Literature Review 3.1 Bank Governance: A Relevant Literature Review Recently, corporate governance research in banking has gained momentum from both theoretical and empirical perspectives. In their influential theoretical research, Caprio and Levine (2002), Adams and Mehran (2003), Levine (2004), and De Haan and Vlahu (2016) considered two aspects of bank governance: i) how bank governance differs from that of non-bank organisations, and ii) how sound governance can improve management discipline, protect shareholders’ and other stakeholder' rights, reduce multi-agency conflicts, and promote financial stability. In a similar strand of research, Arun and Turner (2004), Mullineux (2006), Mülbert (2010), and Becht et al. (2011) conceptualised an argument that banks suffer from multiple agency conflicts because of the twin fiduciary duty of bank managers to creditors/depositors who are risk-averse, as well as shareholders who dare risk to maximise their return. Further, the special nature and the developmental roles that banks play across nations has necessitated a special consideration of governance in banking (Adams & Mehran, 2003; Hopt, 2013). In addition, Mülbert (2010) hinted that governance failures were stated to have been the primary cause of the GFC of 2007-09 by some recent research. Heremans (2007) explained how bank governance and stability are linked and argues that “as corporate governance is a necessary complement to regulatory and supervisory intervention, it should be approached not only from the point of view of profit maximisation but also from the perspective of financial stability”. Overall, the theoretical research on various aspects of bank governance broadly emphasises that effective governance of banking firms is indispensable for sustainable growth of these firms and can be achieved only through an empowered board, sound audit controls, robust risk management practices and a high level of disclosures and greater transparency along with well-defined shareholders’ rights. The empirical research on governance in banking, especially in the developing economies, is at an embryonic stage. A vital thread of this research focuses on quantifying bank governance by building a composite corporate governance index for banks (see Gulati et al., 2020, for more details). However, research efforts in this direction are diminutive. Song and Li (2012) developed an index of bank governance from 48 countries based on 15 indicators about board and ownership structures, executive pay, and transparency. Relying on 51 governance indicators, Peni and Vӓhӓmaa (2012) constructed a corporate governance index akin to the Gov-Score elaborated by Brown and Caylor (2006). Ellul and Yerramilli (2013) adopted a corporate governance index by Gompers et al. (2003). Combining 26 bank governance standards, Love and Rachinsky (2015) constructed a composite index of corporate governance and five standardised sub-indices for a sample of banks operating in Russia and Ukraine. They also probed the connection between corporate governance and financial performance in sampled banks. It has been inferred that there is a modest connection relationship between corporate governance and performance due to a feeble institutional environment. Based on risk and supervisory board variables, Andrieș et al. (2018) calculated the bank governance index for emerging economies. In a recent study, Misra and Das (2020) attempted to prepare the benchmark index of board composition based on six key norms pertaining to board structure and composition using the data of seven public sector and five private banks in India. Using 58 governance norms, Gulati et al. (2020) proposed an index of corporate governance for Indian banks using the constrained BoD approach. 3.2 Bank Efficiency: A Relevant Literature Review Over the past three decades, there has been a proliferation of studies on bank efficiency using frontier efficiency approaches. Stochastic Frontier Approach (SFA) is the widely used parametric technique, and data envelopment analysis (DEA) is the popular non-parametric approach in bank efficiency analysis. In the banking literature, the key research themes that have attracted the attention of researchers include i) the effect of financial sector reforms, deregulatory and restructuring measures, banking crises, and regulation and supervision on bank efficiency levels, ii) efficiency variations across ownership types and size classes, iii) cross-country contrasts in bank efficiency and productivity growth, iv) potential efficiency gains from bank mergers, and v) the impact of environmental factors on bank efficiency. One can easily observe wide variations in efficiency estimates even for an identical sample of banking firms because the results are highly sensitive to the choice of the methodological framework used and the approach chosen to specify input and output variables. The recent excellent survey article by Aiello and Bonanno (2018) clearly highlights the sources of heterogeneity in efficiency scores across 120 empirical studies conducted from 2000 to 2014. Based on meta-regression results, they infer that the parametric approach yields relatively lower efficiency scores irrespective of frontier type. The study further found that model specifications under a value-added approach produce a higher efficiency than production, intermediation or hybrid approaches. Different episodes of the financial crisis, notably the AFC of 1997 and the recent GFC of 2007-09, force the banking regulators as well as governments to pay serious attention to the risk-taking behaviour of the banking firms. Consequently, a growing number of studies explicitly account for internal risks in the bank’s production technology specification. While measuring the cost efficiency of US banks, Mester (1996) argues that “unless quality and risk are controlled for, one might miscalculate a bank’s level of inefficiency”. The author incorporates NPLs and equity into the cost function to reflect the banks' output quality and their risk level. There are two strands in the extant literature on incorporating risk in efficiency. The first strand treats risk as an exogenous factor and uses a two-stage efficiency framework in which the efficiency scores are calculated in the first stage, and then these scores are regressed on risk management ratios and other environmental factors in the second stage. Some notable studies that belong to this strand are Casu and Molyneux (2003), Ariff and Can (2008), Jiménez-Hernández et al. (2019), among others. The second strand of this literature uses the one-step approach in which a risk measure is directly adjusted/introduced as either input or output in deriving an efficient frontier. To obtain risk-adjusted estimates of bank efficiency, researchers focus primarily on incorporating credit risk measure(s) in the efficiency measurement model. The three widely used credit risk control variables in the extant literature are: i) equity capital, ii) loan loss provisions as good (desirable) inputs, and iii) non-performing loans (NPLs) as bad (undesirable) output (Simper et al., 2017). In the Indian context, the literature on bank efficiency is extensive (see, Kumar and Gulati, 2014). The key focal point of most of the studies is to explore the impact of financial deregulation programme on bank efficiency and computing efficiency gaps across distinct ownership types. Some recent studies likewise attempted to investigate the effect of the GFC of 2007-09. The works of Gulati and Kumar (2016), and Kumar et al. (2016) are among those who explored such impacts on bank efficiency in India. Additionally, only the efforts by Das and Ghosh (2009), Gulati and Kumar (2016), Jayaraman and Srinivasan (2014), and Jayaraman and Bhuyan (2020) focused on profit efficiency estimation of Indian banks. Interestingly, just the investigations by Fujii et al. (2014), Jayaraman and Srinivasan (2014), and Jayaraman and Bhuyan (2020) explicitly accommodate the presence of bank risk in the form of NPLs as an undesirable output in the bank’s production process. By and large, the extant literature on bank efficiency in India calls attention to that there is a dearth of studies that characterise the bank technology by jointly modeling the production of desirable (good) and undesirable (bad) outputs and the role of the bank’s input and output prices. 3.3 Bank Soundness: A Relevant Literature Review The contemporary growth literature suggests that the soundness of the banking sector plays a vital role in accelerating economic growth (Jokippi and Monnin, 2013), and the economy bears huge economic costs, especially in terms of loss of real output and employment if a crisis hits its banking system (Boyd et al., 2006; Dell’Ariccia et al., 2008). The global financial crisis of 2007-09 once again jolted the regulators and policy formulators to identify the leading indicators of banking sector problems. One of the key strands of the bank soundness literature focuses on identifying the leading indicators of banking fragility and developing an index of banking soundness. For the identification of indicators of fragility, the signaling approach and qualitative response models are frequently employed in the literature. However, the indicators used in explaining a banking crisis vary widely across studies. Kaminsky and Reinhart (1999) used the signaling approach to analyse the links between banking and currency crises. Indicators of bank stability are constructed, and their changes are used to provide a reliable signal for the emergence of crises between normal times and times of stress. Their analysis showed that banking and currency crises are found to be closely linked, and generally the problems in the banking sector precede a currency crisis, which activates a vicious spiral of economic recession. A multivariate logit model was utilised by Demirgüç-Kunt and Detragiache (1998) to forecast the banking crisis probabilities in both developed and developing countries from 1980-1994. Based on forecast probabilities, they developed an early warning system and a rating system of bank fragility. They found that the extreme behaviour of one or more macroeconomic variables can trigger a banking crisis. Based on the banks’ joint probability of default, Segoviano and Goodhart (2009) proposed a four-step non-parametric approach to construct a set of bank stability measures. They derived the stability measures from the banking system’s (portfolio) multivariate density (BSMD), which embeds the distress dependence among the banks and is based on copula functions characterising both linear and non-linear dependence. In the Indian context, only limited studies have been undertaken to measure bank soundness using a comprehensive multi-dimensional index-based approach. Bhattacharya and Roy (2012) used the index-based approach to identify the episodes of distress in the Indian banking sector during 1994-2007. Based on the probit regression model results, they found that the probability of bank fragility in India is explained by the economic slowdown, key policy rates, and trade-related factors. Using data on Indian banks for the period 1997‐2007, Ghosh (2011) developed a simple index of bank fragility using three indicators of banking operations: (i) loan-loss provisions to total asset ratio, (ii) capital adequacy ratio, and (iii) returns-on-asset. He found that majority of the Indian banks have remained moderately stable during the study period. The results of the panel regression analysis showed that bank fragility is explained significantly by prudential norms, concentration, and foreign bank presence. In the extant literature, a few studies used the CAMELS assessment framework of RBI for constructing the bank stability index (BSI). Mishra et al. (2013) constructed a banking stability indicator based on the weighted average ratios used in RBI’s CAMELS assessment. They also showed that the stability of the banking system affects the performance of financial markets and real output. However, financial market instability and the fall of the real output impact the bank stability with a lag. Using the PCA weighted CAMEL framework, Gulati and Singh (2019) constructed the BSI for the period 2007-2017. Notable findings of their study are i) the bank stability dwindled in the post-crisis period that marked a beginning in 2008-09, and ii) foreign banks dominate the high stable category, and no PSB belongs to this category. Using quarterly data of 39 banks in India, Dhal et al. (2011) endeavoured to employ the vector auto-regression model for studying policy transmission mechanisms comprising output, inflation, interest rates, and financial stability index (which was computed using the CAMEL indicators). One of the key findings of their study is that financial stability, growth, and inflation share a medium to long-term relationship. 3.4 Relationship between Governance, Efficiency and Soundness An important strand of current literature discusses the role of internal governance mechanisms, particularly boards, in determining the performance and risk-taking behaviour of banks. Using the sample of large banks in the EU, Agoraki et al. (2010) revealed a non-linear relation between board composition and bank efficiency, while a negative relationship with the board size. Grove et al. (2011) found a concave relationship between board size and performance of the US banks. Further, their study supported a negative association between CEO duality and bank performance. Also, Adam and Mehran (2012) examined 35 US bank holding companies and found that larger boards positively correlated with bank performance. However, they established no significant relationship between board composition and performance, which was measured by Tobin’s Q statistic. Nyamongo and Temesgen (2013) reported that the larger board size deteriorates the performance, while the independent directors enhance the performance of Kenyan banks. Further, Liang et al. (2013) divulged a significant positive impact of board meetings and independent directors and the negative influence of board size on the performance of Chinese banks. García-Meca et al. (2015), who highlighted the decisive role of female directors on the profitability of 159 listed banks in nine countries. Mamatzakis and Bermpei (2015) witnessed a positive effect of CEO power on bank performance but a negative relation of board ownership with the performance for a certain threshold. Dong et al. (2017) showed a positive influence of board independence, while CEO duality exerted a negative impact on the profit efficiency of Chinese banks. With the newly revised BCBS governance principles, scholars are now exploring how risk mitigation, disclosure practices, and compensation policies relate to the various aspects of bank soundness. For the sample of 800 banks in 72 countries, Marques and Oppers (2014) examined the impact of compensation policies on bank-risk taking. Andrieș et al. (2018) found that banks with rigid managing boards and tight risk management structure lower the cost and technical efficiency of sampled banks in 17 CEE nations. Also, there have been few attempts to establish the relationship between i) governance and capitalisation (Anginer et al., 2016), and ii) governance and bank failures (Berger et al., 2016). Also, in the context of emerging economies, researchers have made attempts to analyse the role of boards and tried to explore the inter-relationship between bank performance and bank board characteristics (see, for example, Bukhari et al. (2013) for Pakistan; Dong et al. (2017) for China; among others). While significant effort has been put into analysing corporate governance in listed companies in India, there has been little attention paid to corporate governance concerns in banking organisations. Mohan (2004), Chakrabarti (2005), Subbarao (2011) and Jain (2021) discussed governance reforms and the glitches and challenges confronted by Indian banks regarding these reforms. The study by Agarwal et al. (2015) studied 29 banks in India to analyse the relationship between board conduct and risk-taking behaviour. The effect of boards on performance of Indian banks was also investigated by Sarkar and Sarkar (2018). In brief, the prior literature offers two main issues that are innate in the measurement of governance and soundness for banks. These concerns pertain to i) the selection of indicators/ratios and dimensions for developing an overall index for the subject in question, and ii) the choice of the appropriate methodological framework for aggregating the indicators or dimensions. For the development of the bank governance index, a few studies utilised the self-structured framework, which depends on one or few indicators/ dimensions. To measure the strength and independence of the risk management functions, for the bank soundness index, despite some of the critical limitations, the Z-score is the leading indicator to capture the bank soundness. In addition, most of the existing studies have built a composite index of bank soundness, considering a few ratio indicators. For massing indicators/norms/dimensions, past studies generally relied either on weights by the expert judgment (Geršl and Heřmánek, 2006), or employed the traditional unweighted method (Central Bank of the Republic of Turkey, 2008; RBI 2010; Song and Li, 2012; Kočišová and Stavárek, 2018) or weights generated by PCA (Andrieș et al., 2018; Gulati and Singh, 2019). The following observations can be made based on a thorough study of the literature on governance and soundness for banking firms. First, in most studies, only one or a few indicators are used to create composite measures of governance and soundness. They have ignored a full set of indicators/norms in building the soundness/governance index. Second, methodologically, the studies have mainly employed the traditional unweighted method, which implicitly implies equal weights, ignoring the fact that all the dimensions of soundness/governance may not share the same policy priorities and preferences by banks. Third, in most empirical studies exploring the connection between governance and bank performance, the bank performance is proxied by traditional accounting-based financial ratios like returns of assets, returns of equity, etc., along with the measures like stock returns and Tobin’s Q. Only a few studies captured the bank performance as a multi-input and multi-output non-parametric frontier-based efficiency measure (see, for example, Mamatzakis & Bermpei, 2015; Dong et al., 2017; Andrieș et al., 2018; among others). However, the issues of bank efficiency measurement adopting an “optimal” approach to obtain robust estimates of risk-adjusted profit efficiency and establishing a link with governance and soundness for Indian banks are not attempted yet. Our study is an attempt to rationally consider these above mentioned issues. 4. Measurement of Bank Governance, Soundness and Efficiency 4.1 Governance Index: Norms and Dimensions The study calculates the governance index based on a ';Benefit-of-the-Doubt'; (BoD), as proposed by Gulati et al. (2020), that aggregates six different dimensional indices of corporate governance for obtaining yearly values of composite governance index for individual sampled banks over the period 2009-2018. The underlined dimensional indices are computed from 48 governance norms that pertain to “board effectiveness”, “audit function”, “risk management”, “remuneration”, “shareholders’ rights and information”, and “disclosure and transparency” (see Figure 6). A description of the coding process and grouping of the norms within each dimension of the bank-level governance index is given in Table IV.2 in Annexure IV. We make several data adjustments before we obtain the composite index of bank governance. First, after obtaining either quantitative or qualitative details about 48 governance norms, we code each norm as a dummy variable with a score of 1 if a bank complies with this regulatory norm and 0 otherwise. This data adjustment helps us in achieving homogeneity and uniformity in defining these norms. Second, to get individual dimensional indices, the study applies well known linear unweighted average method for aggregating the governance norms. One explanation for utilising this method for getting dimensional indices is that the underlined norms are addressed as a binary outcome. An index value, ranging from 0 to 1, is assigned to each dimension. Dimensional indices of governance (DI_G) are obtained as: 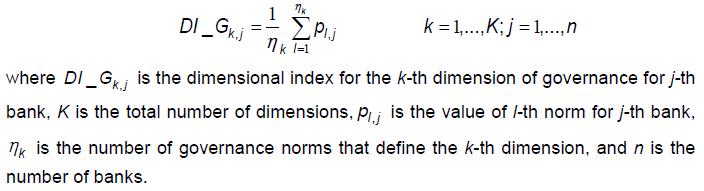 Third, we follow Vidoli and Fusco (2018) and normalise dimensional indices obtained in step (2) at the mean of 100 and standard deviation of 10 to deal with 0 and 1 scores of dimensional indices. Finally, we employ the non-parametric constrained BoD model for aggregating six normalised dimensional indices to determine the preferences (as defined through the weights obtained) of the bank on each dimension and to construct a bank-level composite index of governance (see Section 4.3 for the details on the constrained BoD model). This step, thus, provides a set of endogenously generated weights, which sheds important light on the priorities of a particular bank on different dimensions of corporate governance. The present study differs substantially from earlier ones. We instead use an idiosyncratic and bank-specific endogenous weights (specific to banks and dimensions), rather than the traditional linear weighted average or PCA. The index value thus computed by this methodology lies between 0 (worst) and 1 (best). 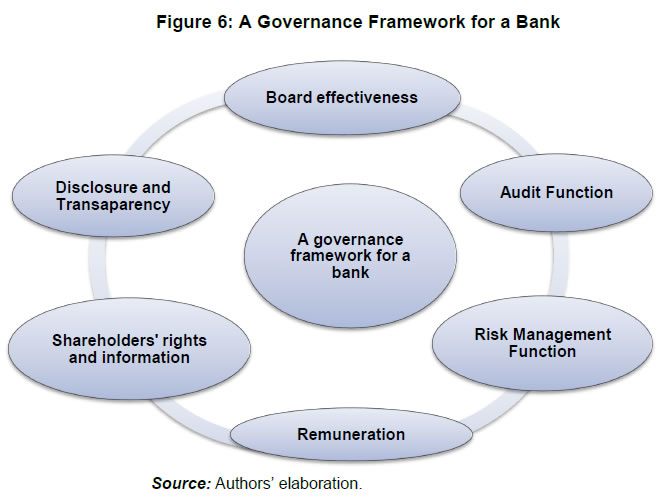 4.2 Bank Soundness Index: Indicators and Dimensions Adapting the five-dimensional framework of RBI (2010), we construct a composite bank soundness index (see Figure 7). This study chooses 14 ratio indicators and combines them to obtain five distinct dimensional indices, namely “capital adequacy”, “asset quality”, “profitability”, “liquidity”, and “management efficiency”. In terms of the new bank soundness index, one should note that both the financial resilience of banks and their major operations risks (such as credit or liquidity) were taken into consideration. For instance, capital adequacy acts as a shock absorber, which safeguards the bank against expected risks; liquidity measures the capacity of a bank to meet cash and collateral obligations; asset quality assesses the degree of default risk; profitability reflects the earning ability (Geršl & Heřmánek, 2006). Table IV.1 in Annexure-IV lists out ratio indicators used and an assessment of their effects on overall bank soundness and the adjustments implemented. 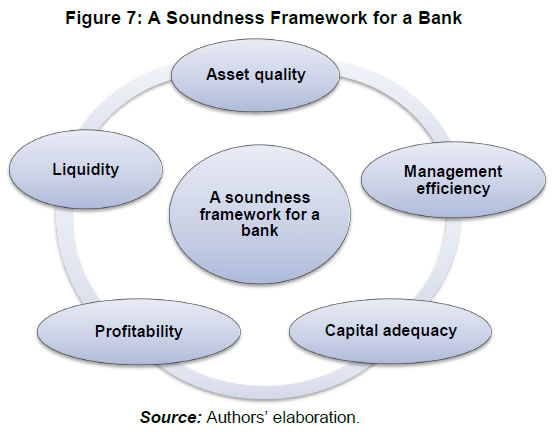 We apply several data adjustments to arrive at the composite index of bank soundness. First, to mitigate the impact of outliers, all 14 ratio indicators (yr) (expressed in the actual unit of measurement) are winsorised at the 10 per cent level. Second, then we use min-max method to normalise all ratio indicators based on their polarity with bank soundness as follows. where y*r,j = normalised score of the r-th indicator for j-th bank. Note that this normalisation adjustment transforms all the ratios on an identical scale of zero-one. Third, all the normalised ratios are combined using a linear unweighted average method to compute five different dimensional indices, one analogous to each dimension of soundness. The following formula is used for constructing i-th dimensional index of soundness for j-th bank. 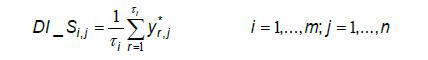 where y*r,j is normalised score of r-th ratio for j-th bank in i-th dimension, τi is the maximum ratios that define the i-th dimension, and m is the number of dimensions. Dimension indices range from 0 to 1. In the fourth step, the dimensional indices are again normalised using Vidoli and Fusco (2018)’s standardisation procedure. Finally, a bank-wise composite index of bank soundness is constructed based on the five normalised dimensional indices using the BoD approach (see Section 4.3 for more detail). A bank's soundness is measured by a composite index ranging from 0 (unstable) to 1 (fully stable). 4.3 The Constrained “benefit-of-the-doubt” Model To quantify bank governance and soundness, we used two-step procedure in the present study. Step 1 involves the computation of the dimensional indices by aggregating governance and soundness norms using the linear unweighted average method (see Sections 4.1 & 4.2 for further details). The second step is a bit different from the previous research efforts. It includes the use of a cutting-edge and innovative constrained BoD model for aggregating the dimensional indices gotten in the initial step. The BoD approach is based on a “multiplier” version of the CCR model (the first Data envelopment analysis (DEA) model), named after its developers Charnes, Cooper, and Rhodes (1978). The approach was initially proposed by Melyn and Moesen (1991) and later developed in-depth by Cherchye et al. (2004, 2007). In the BoD approach, we implement DEA with the outputs and a dummy input equal to 1 being all grouped into a single index (Lovell et al., 1995). Therefore, a typical BoD model tantamounts to a DEA model in a “pure output setting”. As a result, a BoD model only considers ';outcomes'; (e.g., outputs) without taking into account inputs (Lavigne et al., 2019). It compares the actual index (weighted average of the dimensions) to a benchmark index. This is in contrast to the traditional DEA models, where the actual output level is compared to the industry’s benchmark output level, given the amount of inputs. The constrained BoD model utilised here is a data-oriented weighting method since it helps in getting the non-negative “optimal” policy weights. These weights can be used to design a potent policy structure for improving bank governance and augmenting bank soundness levels. The entire calculation process involves the generation of endogenous weights that are dimension-specific and vary across banks. Simply, in the absence of any a priori weights, the BoD model provides a weighting and aggregation scheme based on available raw data on distinct dimensions of governance and soundness. The main idea behind the constrained BoD modeling framework is to select the weights that maximise the overall index value for each bank under investigation and allows the weights generated to be strictly positive. Witte and Rogge (2011) also recommend the use of the BoD modeling framework in a situation like ours where true weights are unknown a priori for the underlined dimensions and indicators. Based on the basic features of our BoD model, idiosyncratic and endogenous weights provide the best value for the composite governance and soundness indexes for banks. 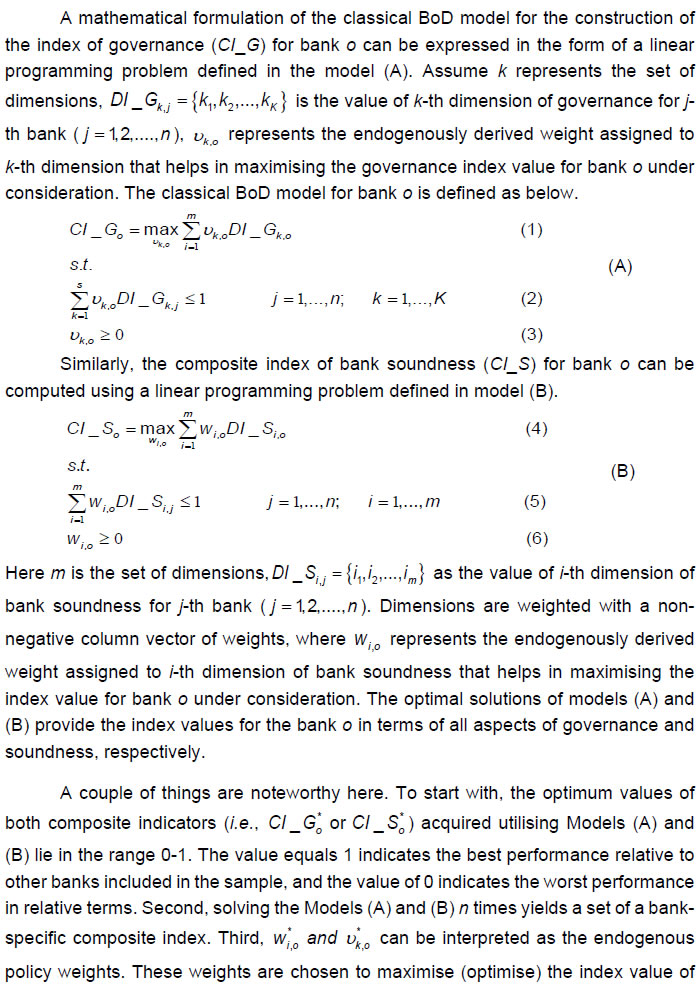  Cherchye et al. (2004) observed that because the BoD modeling framework retrieves that optimal weights from the observed data, it is possible that one or a couple of dimensions may get exceptionally higher weights (i.e., over-emphasised) or zero weights (i.e., completely ignored). As per Charles and Díaz (2017), in the generic BoD model, this situation emerges because all entities are assessed in the best possible scenario, and a particular entity may get exceptionally higher weight for a particular dimension where the entity plays out the best in relative term or get even a zero weight where the entity performs worst relative to its peers. This downside of the generic BoD model seems a severe concern in light of the fact that all the underlined dimensions are theoretically important. To overcome this downside, the use of weight restriction is recommended in the extant literature. The use of restrictions on weights can be found in Allen et al. (1997) and Athanassoglou (2016). Adding constraint (7) in Model A and (8) in Model B, in the classic BoD models (A) and (B), respectively, transform them into the constrained BoD models: 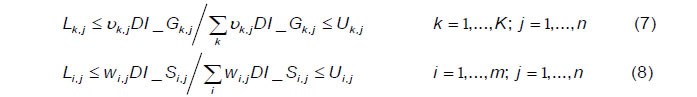 where U and L denote the upper and lower bounds on the allocated endogenous weight. Badasyan et al. (2011) and Giambona and Vassallo (2013) adapted similar weight restriction methods in their empirical studies. In the current investigation, the lower limit for a specific dimension is set to be 10 per cent, while the upper bound is determined as needs be. For example, in the case of construction of a bank governance index, if the lower bound of a dimension is set as 10 per cent, the upper bound will be at 40 per cent (i.e., 100-(6×10)=40). The strategy of combining weight restrictions with the generic BoD model not only overcomes a major shortcoming of this model but also effectively handles the issue of the impact of outliers on overall index values since no dimension is overlooked in the process of aggregation. All calculations for obtaining the values of the underlined composite indices are done using the “Compind” package in R. 4.4 Estimation of Profit Efficiency Instead of relying on commonly used financial ratios (like returns-on-asset (ROA), returns-on-equity (ROE), and Tobin’s Q), this study uses the DEA-based risk-adjusted profit efficiency measure, which is no doubt a holistic measure of bank performance. Contingent upon whether market power is considered, the extant literature distinguishes standard and alternative profit efficiency measures. While computing the standard profit efficiency measure for a bank, it is assumed that i) the bank operates in a perfectly competitive market, ii) prices of inputs (p) and outputs (q) are exogenously determined, and iii) the bank maximises its profit (π) by adjusting quantities of inputs and outputs. A standard profit efficiency measure is based on the profit function π=f(p,q) and gauges how close a bank is to produce the level of maximum potential profits given a specific level of input and output prices. However, in practice, the notion of standard profit efficiency is of little relevance in the real-world cases because the key assumptions of perfect competition and exogenous output prices are not generally meet with the prevailing reality of the banking markets. Alternatively, these assumptions indicate the non-existence of market power in the hand of banking firms in setting the price of their outputs. Since banking firms enjoy market power in determining their output prices, the standard profit efficiency measure seems improper. In contrast, Humphrey and Pulley (1997) developed the alternative profit efficiency measure based on the realistic assumption that banks operate in imperfect market conditions and can exercise market power in setting output prices. Notwithstanding, this market power is confined to output markets, and banks stay competitive buyers of inputs. An alternative profit efficiency measure is based on the profit function π=f(p,y), and thus measures how close a bank is operating to earn maximum potential profits given its output levels (Berger & Mester, 1997). While maximising their profits, banks adjust output prices and input quantities. Both standard and alternative profit efficiency measures are considered superior by Berger and Mester (1997) since “they are derived from economic optimisation based on relative prices rather than optimisation only based on the technology”. Further, they lauded the alternative profit efficiency as a more adequate and informative measure of profit efficiency, especially when some of the assumptions of the standard measure are not met in the banking industry. Assuming that banking firms operating in India face imperfect competition, the present study follows Maudos and Pastor (2003) and Gulati and Kumar (2016) and computes the alternative profit efficiency scores for sampled banks. Our inclination for alternative profit efficiency measure is also spurred by potential inaccuracies in the data for output prices. DEA Model for Risk-adjusted Profit Efficiency Score Selection of Input-output Variables for Risk-adjusted Profit Efficiency For the choice of input and output variables, we modified the bank production specification utilised by Gulati and Kumar (2016) to calculate the alternative profit efficiency score. More specifically, we implemented the suggestions of Simper et al. (2017) and incorporated two key internal risk control variables. The first risk control measure is bank equity, which is taken as a quasi-fixed input, and an explicit constraint is added in the optimisation model for this variable. The second risk control variable is non-performing advances. The non-performing loans are deducted from total advances to obtain the figures of performing loans. The performing advances generate the interest revenues, and their inclusion adequately represents the true production technology of a typical commercial bank. For the purpose of adequately specifying the production technology, three variable inputs, one quasi-fixed input, and three outputs are chosen. The variable input vector includes physical capital (x1) (estimated as the value of fixed assets), ii) labour (x2) (estimated by total manpower strength), iii) loanable funds (x3) (measured as the sum of deposits & borrowings). The prices of these inputs are not directly available and, therefore, are approximated from the available information in the dataset used. The price of physical capital (p1) is approximated by the ratio of total operating expenses (net of personnel expenses) to fixed assets. The price of labour (p2) is computed from the ratio of personnel expenses to the number of employees. The price of loanable funds (p3) is estimated by the ratio of total interest paid on deposits and borrowings to total loanable funds. The bank equity capital is considered as a quasi-fixed input without any associated price. The recent bank efficiency literature favours the explicit inclusion of bank equity in the bank’s production technology specification since it adequately controls for bank’s insolvency risk and risk-return trade-off (see, for example, Färe et al., 2004; Simper et al., 2017). As mentioned above, the output vector includes three variables. The first output is performing loans (y1) measured as total advances minus gross non-performing loans advances). The price of this output variable is approximated by the ratio of Interest/discount on advances/bills to the total value of performing advances. The second output variable is investments (y2). The price of this output variable is computed from the ratio of income of investments to total investments. The final output variable is non-interest income (y3). The price of non-interest income is taken as 1 since Indian banks have an almost uniform pricing structure with negligible variations for their fee-based activities. The extant literature on bank efficiency emphasises the inclusion of non-interest income in bank production technology specification since it accounts for income from fee-generating and off-balance sheet activities. In this context, Gulati and Kumar (2011) point out that while measuring bank efficiency, one should focus on incomes originating from both traditional financial intermediation and non-traditional off-balance sheet and fee income business activities. Thus, it is highly incongruous if the output vector includes only earning assets from traditional business activities and excludes off-balance sheet activities. Under such a scenario, the bank’s output is misspecified, and the efficiency estimates are not adequate and present a distorted picture. Note that except labour input, all variables are in rupees lakhs. 5. Data, Econometric Methodology, and Hypotheses 5.1 Database In this study, the analysis appears to be restricted to domestic commercial banks, which account for more than 90 per cent of total bank assets in the Indian banking industry. During the period from 2009 to 2018, we compiled information on 48 governance codes for individual banks. The publicly available “Corporate Governance Reports” of the sample banks provide required data and information. These reports were collected by researching the websites of each bank we sampled10. In cases where the reports weren't available on the banks' websites, we accessed them from the SANSCO database. Thereafter, to acquire the required data information, we systematically analysed all annual reports conscientiously to get insights on the issues pertaining to regulatory governance by banks in India. Any missing information on governance norms was sought and completed from the “Corporate Governance” section of the National Stock Exchange (NSE) website. In addition, the data on the total cash remuneration paid to executives, including salary, performance-linked pay, perquisites, and other long term benefits like pension funds, superannuation funds, etc., were jointly collected from the “Indian Boards”. The data on 14 financial ratios used to construct bank-level soundness index were culled from the “Statistical Table Relating to Banks in India,'; an annual publication of RBI. To estimate profit efficiency for sampled banks, one needs the data on inputs, outputs, and prices. In this regard, we collected the required data from the bank’s financial statements and the “Statistical Table Relating to Banks in India.” To mitigate the impact of inflation on profit efficiency estimates, we used the figures of input and output variables (except labour) at constant prices. These figures were derived using the implicit GDP deflator (with base 2011-12=100). With the purpose to minimise the impact of random noise emanating from measurement errors in data and to throw out the effect of heterogeneity across banks to size variations, all input and output variables for a bank are normalised by the number of branches. This normalisation is consistent with the lines suggested by Gulati and Kumar (2016). Further, all banks with a single branch are removed to reduce the possibility of outliers in the sample. The entire study period (2009-2018) can be divided into two sub-periods: i) 2009-2013, and ii) 2014-2018. Because of the erosion of asset quality of Indian banks, as well as the emergence of many large-scale frauds since 2013 and the severe economic downturn, we treat this period as a ';turbulent period';. In the post-2013 years, with an aim to deal with the rising NPAs problems and accelerate insolvency proceedings, the regulatory authorities have introduced a number of new provisions and/or amended the existing governance norms (the most important being the CA of 2013 and new Clause 49 of the LODR 2015) together with RBI (2014) recommendations. The empirical analysis covering the underlined sub-periods, we believe, will help us measure banks' reaction to new regulatory changes and governance requirements. 5.2 Econometric Methods 5.2.1 Empirical Design of the Model and Panel Econometric Methods Dynamic Panel Econometric Model The study examines the relationship between governance, profit efficiency, and soundness of the Indian banking sector using the following dynamic panel regression models. Generalised Method of Moments (GMM) and Endogeneity Concerns In studies exploring the relationship between bank performance, risk-taking, and financial soundness, serious endogeneity concerns have been raised. There are two possible sources of endogeneity: unobserved heterogeneity caused by bank-specific effects or reverse causality, where risk-taking behaviour or performance determine governance (Wintoki et al., 2012). Therefore, in the present study, we rely on the two-step system GMM method for the estimation of models (13)-(15) because we believe that the traditional panel estimators would not be robust to the potential endogenous relation between three aspects. Nickell (1981) showed that for finite T, the OLS as well as within estimators are severely biased; however, as T increases, the within estimator shows consistent results. But, as in our case where T The system GMM, an advancement of difference GMM, combines the equation in level as well as in the first-difference form and performs better in case of highly endogenous and persistence data (see Blundell & Bond, 1998). Blundell and Bond (1998) allowed for using additional instruments for equations in levels through the condition E(ΔCI_Sj,t-1,εj,t) = 0 for j=1,...,N and t=3,4...,T to improve the precision of estimates. Also, Blundell et al. (2001) showed that the system GMM reduces the finite sample bias and enhances the precision of estimates. We viewed the governance index, its distinct dimensions, and profit efficiency estimates as endogenous variables in our estimates, whereas other control variables are seen as instruments for themselves. The econometric models are estimated using Roodman’s (2009) command of “xtabond2” in Stata 15.0, with Windmeijer corrected standard errors12. The reliability of estimates is then checked using the difference-in-Hansen and Hansen tests for instrument validity and Arellano and Bond’s (1991) test for serially uncorrelated errors of first- and second-order autocorrelation. For instrument validity, the study relies on Hansen-J statistics instead of Sargan statistics since the latter over rejects the null hypothesis of valid instruments in the presence of non-spherical errors (Roodman, 2009). In addition, the study utilises alternative panel regression estimates like pooled OLS, fixed-effects, and panel quantile estimates to check the robustness across estimation methods and to validate our two-step system GMM estimates. 5.3 Development of Key Testable Hypotheses To develop key testable hypotheses, a discussion on the possible impacts of overall governance structure, individual dimensions of governance, and most significant governance standards/norms on bank soundness seems warranted here and is given below. Bank soundness and governance structure: It is believed that when a banking firm has a sound governance structure and managers who are committed to protecting shareholders’ and debt holders' interests, resources can be allocated more efficiently, and borrowers can be more effectively monitored. Therefore, it decreases the likelihood of failure and improves soundness (Levine, 2004; Heremans, 2007). In cross-country environments, Das et al. (2004) showed that the effectiveness of regulatory governance for achieving financial stability. We, therefore, postulate that adequate governance practices positively drive bank soundness. Consequently, we propose our first primary testable hypothesis, which is as follows: H1: A sound governance structure leads to a stable banking system Board effectiveness and bank soundness: A well-functioning board oversees management and functions as a link between shareholders and managers (BCBS, 2015). The Financial Stability Board (2017) recommends that banks should have an optimum board size with a good mix of within and outside directors. As a result, we can evaluate the board's effectiveness using metrics, such as the composition of directors (executive and non-executive), the structure (board-level committees), diversity (presence of women directors), and independence (presence of women directors) (certified independent directors). Based on the above, we calculate a dimensional index for board effectiveness centered on 14 governance norms. The study argues that board effectiveness and bank soundness are positively linked since a successful board resolves the agency issues and leads to a more stable and efficient bank. Based on the argument above, we build our second hypothesis as below. H2: Board effectiveness is positively linked with bank soundness On the one hand, the theoretical literature claims that large boards are ineffective because of communication and coordination problems and that decision-making is slow (Jensen, 1993). Agency theory also supports this viewpoint. On the other hand, resource dependence theory posits that having a large number of directors increases the likelihood of having active, intellectually opulent, and highly skilled directors, as well as improving external connections (Dalton et al., 1999). The mixed findings on board size and performance indicator(s) have piqued interest, although the direction of the relationship is still unknown13. Empirically, it is not known how board size affects bank soundness empirically. This leads us to develop a secondary hypothesis. H2a: Larger boards undermines bank soundness beyond a certain level Furthermore, it is argued that executive directors (insiders) are trustworthy stewards, and thus, contribute more to the maximisation of bank's profits and minimisation of risk (Donaldson & Davis, 1991). While non-executive independent (outsiders) directors are more effective at monitoring management's actions and mitigating risks as they do not have any association with the management (Hermalin & Weisbach, 2003), and they have reputational concerns in the market (Fama, 1980; Fama & Jensen, 1983). The empirical evidence is mixed regarding the effect of board independence on bank soundness. However, in this study, we hypothesise a positive impact of independent directors on bank soundness. Gulamhussen and Santa (2015) conclude that female director(s) on the board tends to be more committed to their duties and have better decision-making capability and communication skills, which enhance profitability. We expect a positive impact of gender diversity on bank soundness. Against this background, we frame the following two secondary testable hypotheses. H2b: Board independence exerts a positive influence on bank soundness H2c: Gender diversity on boards has a positive impact on bank soundness Regarding CEO duality, the corporate governance literature argues that duality increases the possibility of the CEO scheming the information flow and making biased decisions, which decreases board monitoring (Jensen,1993). This may increase the likelihood of bank failure. An alternative view suggests that duality leads to quick response to events and efficient decision-making. Sarkar and Sarkar (2018) supported the agency theoretic perspective and concluded a negative association between CEO duality and profitability, especially for state-owned banks in India. Mamatzakis and Bermpei (2015) validated the stewardship theory by reflecting a positive association between the CEO duality and performance of US banks. However, we anticipate a negative impact of CEO duality on bank soundness in the Indian context. Finally, the formation of sub-committees and frequent board meetings would assist in the effective discharge of board responsibilities and enhance board monitoring and overall soundness. We predict a positive impact of enhanced board activity on bank soundness. The related secondary testable hypotheses associated with the above arguments are given below. H2d: The CEO duality adversely affects bank soundness H2e: Formation of sub-committees and frequent board meetings exert a positive influence on bank soundness Audit function and bank soundness: It is essential to have an independent audit committee in order to maintain a sound accounting process, oversee statutory and internal audits, and to ensure the independence of the auditor. It is, in fact, the audit committee allows the board of directors to have better oversight over financial and accounting operations. The key responsibility of the audit committee is to serve as a line of communication between bank management and auditors. This study looks at governance compliance on this dimension through six norms related to audit and auditor functions (refer to Table IV.2 in Annexure-IV). As greater audit compliance implies tighter bank audits and auditors' controls, we hypothesise that tight audit controls will reduce failure risks and enhance soundness. So, we propose the following third primary hypothesis. H3: Tight audit controls improve the bank soundness Risk function and bank soundness: Only banks that have built an effective risk-controlling system to detect, portion, and control potential risks are deemed well-governed. Through an efficient risk management structure, the bank's board can effectively manage risks and reduce the negative impact of different risks on the bank's profitability. Based on the recommendations of the ';Consultative Group of Directors of Banks/Financial Institutions 2002';, Indian banks established an independent risk management committee. This study utilises four risk governance principles to construct a risk management index (Table IV.2 in Annexure-IV). Those banks with higher dimensional scores have better risk management practices. Consequently, one may expect a positive correlation between bank soundness and better risk management. We develop a fourth hypothesis as follows. H4: Sound internal risk management and bank soundness are positively correlated Remuneration and bank soundness: The impact of a bank's remuneration strategy on risk-taking and profitability is apparent. According to agency theory, efficient governance on this aspect is achieved when the remuneration committee plans and administers a compensation scheme in close collaboration with bank management. As a result, the approach ensures that executive compensation (which is supposed to counteract managers' inherent aversion to risk) does not induce managers to take unnecessary risks (Main & Johnston, 1993; Conyon et al., 1995; Marques & Oppers, 2014). Furthermore, when a bank is in jeopardy, or the government bails it out, the board is widely criticised for greater executive compensation packages for top management. To discourage bank managers from taking excessive risks, new provisions have been added to SEBI 2015 and the amended CA 2013. These clauses mandate listing companies to constitute a pay committee that includes all non-executive directors. To create a remuneration index (see Table IV.2 in Annexure-IV for additional details), we took into account three governance principles addressing remuneration and developed the fifth primary hypothesis. H5: Effective remuneration system translates to improved bank soundness Since, as noted above, the higher executive compensation leads to excessive risk-taking, we also formulate a secondary testable hypothesis, which is given below. H5a: Excessively higher executive remuneration lowers bank soundness Shareholders’ rights and bank soundness: Studies of corporate governance have shown that there are often severe agency disputes between controlling and minority shareholders, with stockholders having a significant influence on executive decisions and structuring and dissolving the corporation (Alchian & Demsetz, 1972)14. To protect interests of minority shareholders and investors, the listing regulator has directed all companies to set up a stakeholder relationship committee (SRC) with a non-executive director as chairperson. The SRC should handle investor grievances, share transfer transparency, shareholding patterns, and dividend distributions. This study creates a dimension index based on 11 governance principles to quantify shareholders’ rights and information (for more details, see Table IV.2 in Annexure-IV). The typical choice of norms in this dimension is based on Uday's Kotak committee recommendations. Based on La Porta et al. (1998), we expect that protecting shareholders' rights and giving adequate data will benefit investors, reduce market volatility, and eventually enhance financial soundness. This aspect of governance, we believe, has a positive association with bank soundness. Our sixth primary hypothesis is as follows. H6: The connection between shareholders’ rights’ and bank soundness is positive. Disclosure and bank soundness: Banks will be able to decrease their agency costs, assure management responsibility, and improve market discipline by releasing sufficient corporate disclosures to the public. Tadesse (2006) indicated that countries with more transparent banking systems are less likely to have systemic crises. He claims that increased disclosure enhances market discipline, financial soundness, and has positive externalities (Kohn, 2011)15. The transparency-fragility approach, on the other hand, claims that disclosure could lead to a sense of complacency and panicked inefficient bank runs, as well as reputational contagion and prohibitions on interbank risk-sharing arrangements (Farvaque et al., 2009; Bushman, 2016). All of this raises the possibility of bank being unstable. Given the foregoing viewpoints, we do not anticipate any specific association between transparency and soundness. We use a set of ten governance norms to determine the governance on this dimension (see Table IV.2 in Annexure-IV for more details). As a result, we formulate our seventh basic testable hypothesis as follows. H7: Bank soundness and disclosure policies are intertwined ambiguously. 6. Empirical Results and Discussion 6.1 Bank Governance in India This sub-section presents the empirical findings on corporate governance in the Indian banking system. In particular, the study focuses on i) the evolution of governance at the aggregate level of the banking industry and the disaggregate level of individual ownership groups, and ii) analysis of optimal policy weights on governance dimensions and underlined policy priorities of sampled banks. The empirical analysis presented below provides important insights to those seeking to examine the neglected and grey areas of the existing governance structure where Indian banks need to pay more attention because of the presence of some degree of under-compliance. 6.1.1 Evolution of Governance in the Indian Banking Industry We begin with a discussion on the inter-temporal behaviour of bank governance in India. Table 3 shows the relevant descriptive statistics of the composite index of governance (CI_G) that can be used for drawing inferences about its trajectories at industry and distinct ownership levels across the sample period and two distinct sub-periods. As discussed above, recent developments in India like underperforming banks, large-ticket frauds and money laundering, as well as a sharp recession, have dubbed the period after these repercussions as a “turbulent” period. The legislative and regulatory authorities responded to these developments by introducing new financial reforms and amending existing governance standards. As a result, we divide the entire sample period from 2009-2018 into two distinct sub-periods to determine banks’ response to the new regulatory reforms, i.e., 2008-09 to 2012-13 and 2013-14 to 2017-18. The key research question addressed in this sub-section is: To what extent do Indian banks comply with the governance standards? Note that compliance with most governance norms/standards set by the relevant jurisdictions is mandatory. Banks are required to provide a sound explanation to the regulators in case of any under-compliance or non-compliance16. Table 3 presents the estimates of year-wise mean values of governance index (CI_G) for the Indian banking industry as a whole and distinct ownership groups. As discussed, the constrained BoD model is used to derive endogenous weights, which aggregates normalised dimensional indices to obtain the CI_G. Thus, the procedure is unique and generates bank-wise optimal policy weights corresponding to each governance dimension based on actual data. The governance index for a bank is expected to lie between 0 (the worst governed) and 1 (the best governed). A bank can take a maximum score of 1 (a full governance), though a minimum value of 0 (with no governance) is unlikely. We can see that the grand mean of CI_G over banks and years is 0.946. This number means that a sample bank needs to put in 5.4 percent more effort on average to achieve the coveted position of a fully governed bank. Technically speaking, this figure shows that banks in the sample operate slightly away from the governance frontier, but they still have a long way to go when it comes to achieving regulatory compliance with governance standards/norms. Although there is a lack of full compliance with governance by all sample banks, this figure demonstrates an exceptionally high level of compliance regardless of the measure. High governance compliance in the Indian banking sector may be due to the fact that most governance standards are mandated rather than discretionary. Therefore banks have little room to show slack in adhering to the rules17. In terms of how governance compliance has evolved, we observe that mean CI_G significantly improved between 2010-11 and 2012-13 before plunging to its lowest level with a fall of 2.4 percentage points in 2014-15 and then it revealed a turnaround. When we compare the governance levels of banks over sub-periods, we find that the first sub-period was relatively better governed than the second sub-period. In the underlined sub-periods, the difference in governance levels is (-)1.3 percentage points. This difference, as observed by the Simar-Zelenyuk-adapted-Li (SZL) test results, is statistically significant18. Among bank groups, we note PBs showed relatively better performance in adhering to governance norms during the sample period as a whole and distinct sub-periods. These banks are benchmarked very close to the governance frontier relative to their public counterparts. Prominent reasons that can be cited for lower compliance by PSBs could be dual regulation, board complexities, slackness on internal controls, and externally imposed constraints through central vigilance agencies on PSBs. The observed differences are statistically validated with the rejection of the null hypothesis of no difference in the probability distributions of CI_G between bank groups in the most of years (see the last column of Table 3). Further, a unimodal and left-skewed density curve of CI_G for the PSB group compared to the rightward density of the PB group also corroborates the above findings (see Figure 9). The observed trends in mean CI_G divulge that, on average, PSBs showed non-compliance of 4.1 percentage points between 2012-13 to 2014-15 before it improved and gained momentum on regulatory compliance in 2015-16. This regulatory laxity on account of dual regulation of PSBs has led them to put 3 per cent additional effort to attain the status of a fully governed bank in the second sub-period. However, the findings suggest no significant difference in the governance behaviour of PBs during the distinct sub-periods, as confirmed from the SZL test results reported in Panel C of Table 3. Overall, the findings confirm that ownership matters in the Indian banking industry as far as regulatory compliance on governance norms is concerned19. | Table 3: Evolution of Bank Governance Index in the Indian Banking Industry and across distinct Ownership Groups | Bank Groups→
Year↓ | All banks | PSBs | PBs | SZL test statistic (p-value)
H0 : pdf (CI_GPSB)t = pdf (CI_GPB)t | | Panel A: Yearly mean estimates | | 2008-09 | 0.946 | 0.938 | 0.957 | -0.261(0.293) | | 2009-10 | 0.949 | 0.937 | 0.964 | 1.495(0.021)** | | 2010-11 | 0.954 | 0.950 | 0.959 | -0.363(0.102) | | 2011-12 | 0.957 | 0.953 | 0.963 | 0.194(0.046)** | | 2012-13 | 0.957 | 0.955 | 0.959 | 0.375(0.482) | | 2013-14 | 0.954 | 0.948 | 0.963 | 2.141(0.124) | | 2014-15 | 0.930 | 0.914 | 0.952 | 9.273(0.000)*** | | 2015-16 | 0.936 | 0.920 | 0.958 | 4.890(0.000)*** | | 2016-17 | 0.937 | 0.926 | 0.952 | 2.144(0.008)*** | | 2017-18 | 0.943 | 0.928 | 0.961 | 5.160(0.000)*** | | Panel B: Grand mean | | 2008-09 to 2017-18 | 0.946 | 0.937 | 0.959 | 17.303(0.000)*** | | 2008-09 to 2012-13 | 0.953 | 0.947 | 0.961 | 4.794(0.002)*** | | 2013-14 to 2017-18 | 0.940 | 0.927 | 0.957 | 19.298(0.000)*** | | Panel C: SZL test across sub-periods H0 : pdf (CI_G2008/09-2012/13) = pdf (CI_G2013/14-2017/18) | | Test statistic (p-value) | 6.248***
(0.000) | 13.169***
(0.000) | -1.745
(0.386) | | Note: *, **, and *** indicates significance at 10%, 5% and 1% levels, respectively.
Source: Authors’ calculations. |
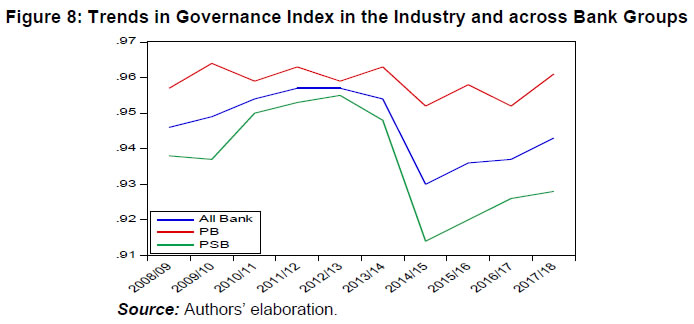
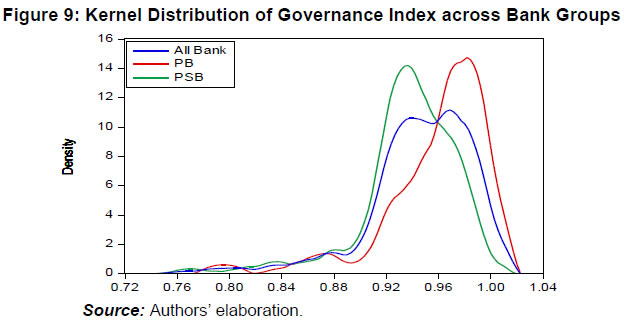 The main raison d'être for the observed trends might be the following. First, in the initial years, banks showed herd behaviour and put a relentless focus on complying with the traditional shareholders’ protection norms and maintained better disclosure and transparency levels. In 2014-15, when new policies for board independence, internal control, and compensation practices were adopted, the banks, especially PSBs, showed marginalised compliance due to weak regulatory stringency. This situation has also exacerbated a trade-off in maintaining both the equity and debt governance compliance by banks in India, and resulted in increased debt agency problems in the Indian banking system. Second, PSBs might have overlooked the governance guidelines because of dual ownership, implicit risk guarantees, and financial safety net by the government in case of trouble. Finally, having said that, after the year 2014-15, most banks, irrespective of their ownership type, have demonstrated significant progress in complying with governance provisions (see Figure 8 & the last two columns of Table IV.2 in Annexure-IV). The progress has mostly been caused by persistent regulatory coercion, which has compelled banks to circumvent penalties and restrictions on bank activities by the regulatory authority. 6.1.2 Sources of Governance Non-compliance For identifying the sources of governance non-compliance, we deeply investigate the level of compliance on each dimension of governance by banks in the industry and across distinct ownership groups. Dimensional indices are summarised in Tables 4 and 5, and the yearly trends are depicted in Figure 10 (refer to Section 4.1 for the computational process of dimensional indices). The results show that banks in India appear to be more compliant on shareholders’ rights and information, and disclosure and transparency. Further, PSBs have shown marginally better compliance on these dimensions than PBs. This suggests that while developing an influential corporate governance culture, Indian banks remained conservative since they put greater emphasis on traditional equity governance and focused primarily on protecting investors’ rights and maintaining better disclosures. Regarding other dimensions of governance, there still exist ample weaknesses. First, although PSBs have improved governance across all dimensions, they reported a far lower mean value of audit index during the study period. Also, no statistical difference in adhering to audit norms is observed across distinct sub-periods on the basis of the SZL test. Such lapses in audit functions and auditor’s compliance might be one of the root causes of recent bank frauds and overall weak governance. Second, even though PSBs demonstrate an upturn of 11.9 percentage points on the board index in 2017-18, the board quality in this banking group remains egregious and below par. Further, PBs observed a fall in the board index by (-)10.1 percentage points in the last year of the study period. Third, the governance on risk management has declined in PBs during the last two years of the study period, while the same has improved in PSBs. Interestingly, PSBs were found to be lagging in compliance with risk management standards by about 20 per cent relative to PBs during the entire study period. | Table 4: Dimensional Indices of Bank Governance: Board Effectiveness, Audit Function and Risk Management Function | | Governance Dimension→ | Board Effectiveness Index | Audit Function Index | Risk Management Function Index | Bank Groups→
Year↓ | All banks | PSBs | PBs | All banks | PSBs | PBs | All banks | PSBs | PBs | | Panel A: Yearly mean estimates | | 2008-09 | 0.614 | 0.587 | 0.651 | 0.804 | 0.717 | 0.922 | 0.750 | 0.685 | 0.838 | | 2009-10 | 0.615 | 0.565 | 0.685 | 0.789 | 0.694 | 0.922 | 0.768 | 0.708 | 0.853 | | 2010-11 | 0.624 | 0.577 | 0.689 | 0.789 | 0.708 | 0.902 | 0.774 | 0.729 | 0.838 | | 2011-12 | 0.632 | 0.577 | 0.710 | 0.805 | 0.715 | 0.931 | 0.768 | 0.729 | 0.824 | | 2012-13 | 0.631 | 0.580 | 0.698 | 0.825 | 0.722 | 0.963 | 0.780 | 0.740 | 0.833 | | 2013-14 | 0.650 | 0.592 | 0.726 | 0.813 | 0.701 | 0.963 | 0.821 | 0.760 | 0.903 | | 2014-15 | 0.707 | 0.607 | 0.849 | 0.797 | 0.694 | 0.941 | 0.829 | 0.760 | 0.926 | | 2015-16 | 0.709 | 0.619 | 0.836 | 0.797 | 0.681 | 0.961 | 0.854 | 0.802 | 0.926 | | 2016-17 | 0.707 | 0.616 | 0.819 | 0.803 | 0.683 | 0.951 | 0.855 | 0.833 | 0.882 | | 2017-18 | 0.727 | 0.735 | 0.718 | 0.798 | 0.675 | 0.951 | 0.882 | 0.869 | 0.897 | | Panel B: Grand mean | | 2008-09 to 2017-18 | 0.661 | 0.604 | 0.738 | 0.802 | 0.700 | 0.941 | 0.807 | 0.760 | 0.872 | | 2008-09 to 2012-13 | 0.623 | 0.577 | 0.687 | 0.802 | 0.711 | 0.928 | 0.768 | 0.718 | 0.837 | | 2013-14 to 2017-18 | 0.699 | 0.632 | 0.789 | 0.802 | 0.687 | 0.953 | 0.848 | 0.803 | 0.907 | | Panel C: Hypothesis testing | | SZL test across sub-periods | H0 : pdf (DI_G2008/09-2012/13) =
pdf (DI_G2013/14-2017/18) | -0.437***
(0.000) | -17.316***
(0.002) | 8.915***
(0.000) | -52.915
(0.935) | 1.064***
(0.006) | 5.976*
(0.054) | 28.965**
(0.032) | 65.42
(0.887) | 43.806*
(0.090) | | SZL test across bank groups | H0 : pdf (DI_GPSB2008/09-2017/18) =
pdf (DI_GPB2008/09-2017/18) | 51.137
(0.234) | 91.263***
(0.000) | 37.945***
(0.000) | H0 : pdf (DI_GPSB2008/09-2012/13) =
pdf (DI_GPB2008/09-2012/13) | 24.514***
(0.000) | 43.081
(0.000)*** | 37.945***
(0.000) | H0 : pdf (DI_GPSB2013/14-2017/18) =
pdf (DI_GPB2013/14-2017/18) | 26.210***
(0.004) | 48.083***
(0.000) | 19.681***
(0.000) | Note: *, **, and *** indicates significance at 10%, 5% and 1% levels, respectively.
Source: Authors’ calculations. | Despite the observed increase in adherence to all the dimensions in the most recent years, there is still enough scope for reinforcing the governance standards on board, audit, and risk management functions for banks. We feel that consistent efforts are required to be made by banks to remove governance gaps and to achieve the status of a fully governed bank. Importantly, a few recent initiatives by regulators for improving bank governance are based on the recommendations of the Committee to Review Governance of Boards of Banks in India (Chairman: P. J. Nayak) in 2014. For example, to improve the board quality, the GoI constituted the Banks Board Bureau (BBB) as an autonomous body for the independent appointments of the chiefs of PSBs. In addition, the approbation of listed banks is subject to the condition that these banks will comply with the SEBI Clause 49 regulations. In practice, since 2015, Indian banks (especially PBs) have responded promptly to both new and amended governance standards. This promptness might be due to the pro-active role of relevant jurisdictions that relentlessly pushed the PBs to strictly adhere to new and existing governance codes. However, PSBs are stumbling in achieving greater compliance with the dimensions of board effectiveness, risk management, and audit functions. | Table 5: Dimensional Indices of Bank Governance: Remuneration, Shareholders’ Rights and Information and Disclosure and Transparency | | Governance Dimension→ | Remuneration Index | Shareholders’ Rights and Information Index | Disclosure and Transparency Index | Bank Groups→
Year↓ | All banks | PSBs | PBs | All banks | PSBs | PBs | All banks | PSBs | PBs | | Panel A: Yearly mean estimates | | 2008-09 | 0.783 | 0.870 | 0.667 | 0.850 | 0.838 | 0.866 | 0.818 | 0.835 | 0.794 | | 2009-10 | 0.870 | 0.903 | 0.824 | 0.851 | 0.841 | 0.866 | 0.841 | 0.850 | 0.829 | | 2010-11 | 0.862 | 0.889 | 0.824 | 0.885 | 0.894 | 0.872 | 0.861 | 0.900 | 0.806 | | 2011-12 | 0.862 | 0.875 | 0.843 | 0.889 | 0.905 | 0.866 | 0.871 | 0.904 | 0.824 | | 2012-13 | 0.889 | 0.917 | 0.852 | 0.883 | 0.909 | 0.848 | 0.874 | 0.929 | 0.800 | | 2013-14 | 0.913 | 0.917 | 0.907 | 0.883 | 0.905 | 0.854 | 0.883 | 0.933 | 0.817 | | 2014-15 | 0.919 | 0.917 | 0.922 | 0.902 | 0.917 | 0.882 | 0.915 | 0.942 | 0.876 | | 2015-16 | 0.976 | 0.958 | 1.000 | 0.916 | 0.939 | 0.882 | 0.912 | 0.942 | 0.871 | | 2016-17 | 0.982 | 0.968 | 1.000 | 0.938 | 0.957 | 0.914 | 0.924 | 0.952 | 0.888 | | 2017-18 | 0.833 | 0.714 | 0.980 | 0.909 | 0.892 | 0.930 | 0.971 | 0.976 | 0.965 | | Panel B: Grand mean | | 2008-09 to 2017-18 | 0.889 | 0.894 | 0.882 | 0.890 | 0.899 | 0.878 | 0.886 | 0.915 | 0.847 | | 2008-09 to 2012-13 | 0.854 | 0.891 | 0.802 | 0.872 | 0.878 | 0.864 | 0.853 | 0.884 | 0.810 | | 2013-14 to 2017-18 | 0.925 | 0.898 | 0.961 | 0.909 | 0.922 | 0.892 | 0.920 | 0.948 | 0.883 | | Panel C: Hypothesis testing | | SZL test across sub-periods | H0 : pdf (DI_G2008/09-2012/13) =
pdf (DI_G2013/14-2017/18) | 27.088***
(0.005) | 3.526
(0.811) | 53.805***
(0.000) | 87.275*
(0.077) | 49.213**
(0.017) | 8.699*
(0.055) | 27.556***
(0.000) | -0.088***
(0.000) | 3.483***
(0.004) | | SZL test across bank groups | H0 : pdf (DI_GPSB2008/09-2017/18) =
pdf (DI_GPB2008/09-2017/18) | -64.041
(0.356) | 28.097***
(0.000) | 69.159**
(0.047) | H0 : pdf (DI_GPSB2008/09-2012/13) =
pdf (DI_GPB2008/09-2012/13) | -23.028***
(0.007) | 28.973***
(0.001) | 35.552**
(0.040) | H0 : pdf (DI_GPSB2013/14-2017/18) =
pdf (DI_GPB2013/14-2017/18) | 16.848***
(0.005) | -26.630
(0.559) | 35.128
(0.749) | Note: *, **, and *** indicates significance at 10%, 5% and 1% levels, respectively.
Source: Authors’ calculations. | 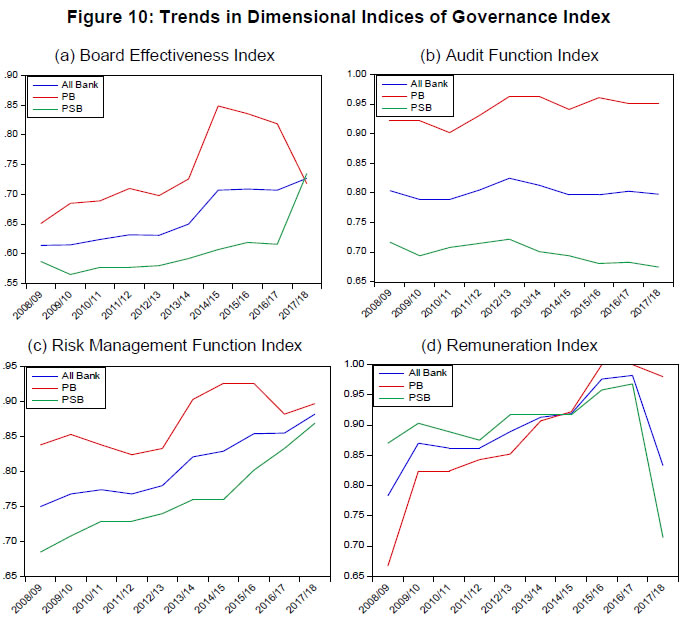 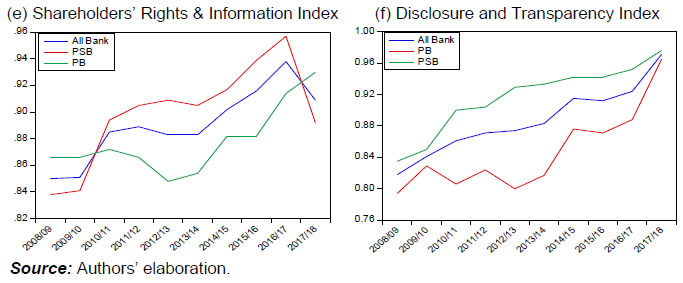 6.1.3 Optimal Policy Weights on Governance Dimensions From a policy perspective, a pertinent research question is: On what aspect should an inadequate governance-compliant bank focus? The non-zero optimal policy weights obtained by the model (A) (i.e., υ*k,o) can be effectively employed to answer this question20. It is noteworthy here that these weights reflect the sampled banks’ policy priorities concerning specified dimensions of corporate governance. These values illuminate policy areas that are currently regarded as the most important by the bank and provide adequate information about aspects that are not sufficiently focused. A change in policy priorities is inevitable for banks with inadequate governance. Based on these weights, it is possible for a bank to decide how to restructure the policy priorities on governance dimensions. Thus, the weighting scheme of poorly governed banks directs their policy interventions in ways conducive to their transition to fully governed status. In Table 6, we provide a yearly mean weighting scheme that corresponds to the different dimensions of bank governance. We note that the weighting structure varies significantly between bank groups and years. An average PSB gives higher priority to disclosure (25.5 per cent), then remuneration (22.1 per cent), and shareholders' rights and information (17.3 per cent). However, the dimensions of risk management, board, and audit function are less prioritised among PSBs. In contrast, PBs placed a greater emphasis on audit function (28.2 per cent), followed by risk management (17.8 per cent) and board quality (16.2 per cent) during the study period. These differences clearly indicate significant asymmetries in bank policy priorities across ownership groups. Strikingly, even though both PSBs and PBs need to focus on risk mitigation, PBs have performed slightly better when it comes to stressing internal risk and audit controls. Following the introduction of new regulations, this weighting scheme has clearly changed. We conclude that the weighting scheme of less governed banks requires rebalancing by focusing on less prioritised areas so as to strengthen the overall governance structure in the banking system. | Table 6: Policy Priorities assigned to Dimensions of Bank Governance | Governance Dimensions→
Year↓ | Board Effectiveness Index | Audit Function Index | Risk Management Function Index | Remuneration Index | Shareholders’ Rights and Information Index | Disclosure and Transparency Index | | Panel A: Public Sector Banks | | | 2008-09 | 0.100 | 0.100 | 0.117 | 0.291 | 0.204 | 0.187 | | 2009-10 | 0.117 | 0.117 | 0.100 | 0.281 | 0.174 | 0.212 | | 2010-11 | 0.100 | 0.113 | 0.117 | 0.268 | 0.160 | 0.242 | | 2011-12 | 0.100 | 0.100 | 0.100 | 0.164 | 0.196 | 0.340 | | 2012-13 | 0.100 | 0.100 | 0.100 | 0.167 | 0.183 | 0.350 | | 2013-14 | 0.100 | 0.117 | 0.100 | 0.166 | 0.167 | 0.351 | | 2014-15 | 0.100 | 0.100 | 0.100 | 0.333 | 0.150 | 0.217 | | 2015-16 | 0.100 | 0.100 | 0.167 | 0.133 | 0.300 | 0.200 | | 2016-17 | 0.100 | 0.100 | 0.214 | 0.252 | 0.100 | 0.233 | | 2017-18 | 0.214 | 0.100 | 0.214 | 0.157 | 0.100 | 0.214 | | Mean weight | 0.113 | 0.105 | 0.133 | 0.221 | 0.173 | 0.255 | | Panel B: Private Banks | | | 2008-09 | 0.218 | 0.100 | 0.194 | 0.171 | 0.218 | 0.100 | | 2009-10 | 0.100 | 0.347 | 0.171 | 0.147 | 0.131 | 0.105 | | 2010-11 | 0.288 | 0.124 | 0.227 | 0.147 | 0.114 | 0.100 | | 2011-12 | 0.175 | 0.339 | 0.108 | 0.110 | 0.122 | 0.146 | | 2012-13 | 0.117 | 0.316 | 0.162 | 0.142 | 0.135 | 0.127 | | 2013-14 | 0.155 | 0.324 | 0.118 | 0.165 | 0.103 | 0.135 | | 2014-15 | 0.171 | 0.124 | 0.382 | 0.124 | 0.100 | 0.100 | | 2015-16 | 0.100 | 0.406 | 0.147 | 0.147 | 0.100 | 0.100 | | 2016-17 | 0.100 | 0.406 | 0.124 | 0.171 | 0.100 | 0.100 | | 2017-18 | 0.194 | 0.335 | 0.147 | 0.124 | 0.100 | 0.100 | | Mean weight | 0.162 | 0.282 | 0.178 | 0.145 | 0.122 | 0.111 | | Source: Authors’ calculations. | 6.2 Bank Soundness in India 6.2.1 Evolution of Soundness Level in the Indian Banking Industry To begin with, we focus on the discussion on evolutionary trends in bank soundness in India. Table 7 presents empirical estimates of the soundness index over banks and years. We note that this figure is high by any standard, at 0.930. It is clear that on average, Indian banks operate below the frontier and that they can reach the status of a ';fully sound bank'; by enhancing their soundness level by just 7 per cent across all dimensions21. We also notice considerable yearly changes in bank soundness levels in India. The banking industry remained relatively stable from 2008-09 to 2012-13, but signs of a decline in bank soundness emerged in 2013-14. When compared to the first sub-period, the results suggest that bank soundness declined by about 2.2 percentage points in the second sub-period. Furthermore, the adapted-Li test results show that the observed fall in soundness levels is statistically significant. The following factors could explain why the initial sample years had a higher level of soundness. First, positive spillovers from the second phase of the reforms process resulted in two-digit growth in bank balance sheets, as well as improved lending operations, lower credit risk, and higher margins comparable to the global benchmark level, enabled the Indian banking system to avoid the initial ill-effects of the GFC of 2007-09 due to its sound position on the soundness/stability front which lasted till 2013-14 when a severe endogenous NPAs crisis knocked the banking system. Second, between the period October 2008 and April 2009, RBI took a series of prompt aggressive countercyclical measures like maintaining enough liquidity in the system, so liquidity stress did not trigger solvency cascades, and sharply relaxing monetary policy through the reduction in repo rate, reverse repo rate, CRR, and SLR kept the credit delivery on track. These measures gave less space for information asymmetries to surface and prevented the banks from taking higher risks. Consequently, banks successfully withheld their desired soundness levels during the crisis years and maintained these levels in the post-crisis years until 2013-14. Third, effective monetary transmission, mainly through the lending channel, could be the other reason. However, the disruption and its subsequent consequences were devastating. During the local NPAs crisis of 2013-14, Indian banks experienced a drop in profitability and increased liquidity stress, owing to a decline in credit worthiness, low margins due to massive bad advances, a reduction in the exposure to off-balance-sheet activities and the income from non-traditional sources, and increased loan loss provisioning (RBI 2014, 2017). Overall, during the most recent years, the above-mentioned adverse developments put the banking system in its most severe period of stress and significantly endangered its overall soundness. The results of hypotheses testing for equality of CI_S distributions across sub-periods, as reported in Panel B of Table 7, confirm the validity of our findings. | Table 7: Evolution of Bank Soundness and across Distinct Ownership Groups | Bank Groups→
Year↓ | All banks | PSBs | PBs | SZL test statistic (p-value)
H0 : pdf (CI_SPSB)t = pdf (CI_SPB)t
Test Statistic (p-value) | | Panel A: Yearly mean | | 2008-09 | 0.936 | 0.940 | 0.932 | 0.364 (0.051)* | | 2009-10 | 0.937 | 0.938 | 0.936 | 1.369 (0.009)*** | | 2010-11 | 0.941 | 0.939 | 0.944 | 1.373 (0.070)* | | 2011-12 | 0.944 | 0.940 | 0.948 | 1.967 (0.036)** | | 2012-13 | 0.945 | 0.940 | 0.950 | 2.955 (0.002)*** | | 2013-14 | 0.928 | 0.921 | 0.939 | 3.332 (0.000)*** | | 2014-15 | 0.917 | 0.910 | 0.927 | 3.301 (0.002)*** | | 2015-16 | 0.915 | 0.903 | 0.933 | 6.170 (0.000)*** | | 2016-17 | 0.920 | 0.906 | 0.938 | 8.200 (0.000)*** | | 2017-18 | 0.915 | 0.896 | 0.938 | 6.483 (0.000)*** | | Panel B: Grand mean | | 2008-09 to 2017-18 | 0.930 | 0.924 | 0.939 | 10.535 (0.000)*** | | 2008-09 to 2012-13 | 0.941 | 0.939 | 0.942 | 8.949 (0.000)*** | | 2013-14 to 2017-18 | 0.919 | 0.907 | 0.935 | 25.079 (0.000)*** | | Panel C: SZL test across sub-periods H0 : pdf (CI_S2008/09-2012/13) = pdf (CI_S2013/14-2017/18) | | Test Statistic (p-value) | 27.731***
(0.000) | 42.889***
(0.000) | -0.308
(0.332) | | Note: *, **, and *** indicates significance at 10%, 5% and 1% levels, respectively.
Source: Authors’ calculations. | 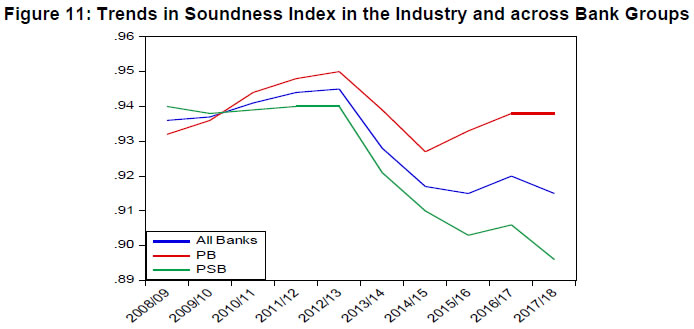
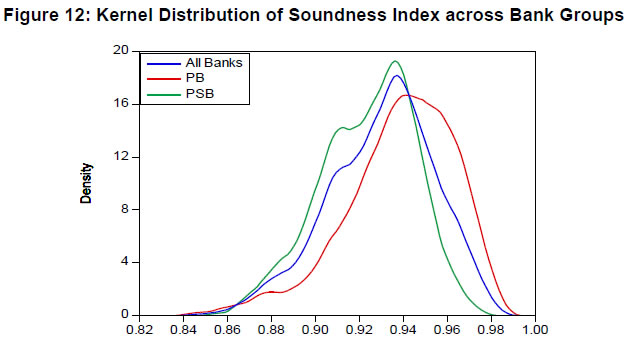 A comparative analysis of public and private banks is done to investigate if banks with different ownership types maintained similar soundness. The relevant results are reported in Table 8, and yearly variations in the soundness index are shown in Figure 11. Looking at the estimated index values, we note some important findings. First, PBs relatively outperformed PSBs in terms of sustaining soundness position during the study period. However, the story was a bit different in distinct sub-periods. Second, the PSB group maintained reasonable soundness until the year 2012-13 due to less provisioning on account of low NPA risk, better profitability, and more customer confidence in the light of implicit government guarantee and reasonable support from RBI that these banks enjoyed. At the same time, the PB group observed relatively low soundness because the asset quality of some well-known private banks deteriorated significantly during the global financial crisis period. Third, the banking industry experienced a jerk in 2012-13 due to endogenous shocks coupled with an economic downturn, which reversed the up-turn trend in soundness and widened the gap between bank groups. This enlargement in the soundness/stability gap is evident from the fact that in the second sub-period, state-owned banks observed a significant drop of (-)3.4 per cent against (-)0.7 per cent fall in the soundness levels of their private counterparts (see Panel B of Table 7). The rejection of the null hypothesis of no difference in the probability distribution of CI_S levels statistically validates this finding. The analysis of kernel density distributions for ownership groups, as exhibited in Figure 12, reflects that the density curve for the PSB group is slightly bimodal and more peaked in terms of soundness. However, for the PB group, it appears to the right of the density curve for the PSB group, with slightly lower modal value and higher dispersion. The comparative analysis of the shape of kernel density distributions corroborates our finding mentioned above that the PB group performed relatively better in terms of bank soundness. Overall, the empirical findings send a clear message that banks have scope to enhance their soundness performance and operate on the soundness frontier irrespective of the ownership type. Further, recently, private banks have shown signs of recovery in soundness position, but relatively low soundness remained a challenge for PSBs. However, the ongoing regulatory initiatives towards cleaning up the balance sheets of banks (especially those of PSBs), restructuring, and recapitalisation would assist with enhancing the overall soundness of the banking system in the years to come. 6.2.2 Dimensions of Bank Soundness To see what undermines the soundness, we rely on an analysis of the mean values of dimensional indices. The estimated mean values of dimensional indices of bank soundness are reported in Panel A of Table 8 (refer to Section 4.2 for the construction of dimensional indices). The disaggregated analysis suggests that PSBs have witnessed a notable deterioration in two important dimensions of bank soundness. These dimensions are asset quality and profitability. In particular, a statistically significant decline, which is more than 5 per cent, has been noted in the values of dimensional indices of asset quality and profitability in the second sub-period relative to the first sub-period. This finding offers a clear explanation of why the Indian banking industry in general and its most significant segment of public sector banking, in particular, became somewhat less sound during the “turbulent” period. Based on our findings, we can safely infer that a decline in profitability and asset quality caused an increase in the fragility and vulnerability of the banking system in the turbulent period. The main reason for profitability and asset quality fall lies in the fact that in the years immediately following the global financial crisis of 2007-09, an internal crisis of non-performing loans has started brewing due to pro-cyclicality in the lending behaviour of Indian banks. Indian banks, especially PSBs, overstretched their lending and lent heavily to infrastructure and industrial projects in the period before the global financial crisis. The bad loans of banks rose steadily over the initial three years of the post-global financial crisis. The initial impact of the rise of NPAs was quickly absorbed by the improved past profitability (Mishra et al., 2013). However, after the year 2013, the NPAs front situation worsened, which resulted in a significant decline in the asset quality and profitability levels of the Indian banks. Furthermore, this behaviour was more pervasive in the public sector banking group. Strikingly, PSBs did well in terms of management efficiency, but their performance on the capital adequacy dimension was relatively dismal. The analysis also highlights a decline in the average values of the dimensional indices pertaining to management efficiency for both ownership groups in the second sub-period. Nevertheless, banks in both groups performed almost alike as far as the liquidity front is concerned (see Figure 13). 6.2.3 Optimal Policy Weights on Bank Soundness Dimensions The constrained BoD provides optimal weights (i.e., w*i,o) obtained by solving the model (B)22. In the BoD modeling framework, these weights serve as policy weights for underlined dimensions and can be used to identify the dimension(s) that an unstable bank should focus on while making efforts to achieve a higher level of soundness. Table 9 lists out those weights. It is noteworthy here that higher values of weights provide sufficient information on bank soundness dimensions that were accorded higher priorities and vice-versa. The structure of weights reported in Table 9 clearly reflects the differences in policy priorities across public and private banks. We note that an average PSB entrusted higher priority to management efficiency (55.7 per cent) while paid more or less the same importance to the remaining dimensions of soundness. In contrast, an average PB put more focus on management efficiency (39.3 per cent), followed by asset quality (22 per cent) and profitability (18.5 per cent). The liquidity and capital adequacy dimensions were less prioritised by PBs. It is important to note that with the changing market dynamics, the policy priorities of PBs on soundness dimensions have also changed. In 2015-16 and 2016-17, PBs have shifted their focus towards asset quality and profitability dimensions due to the NPAs crisis. | Table 8: Dimensional Indices of Bank Soundness | | Soundness Dimensions→ | Asset Quality | Management Efficiency | Capital Adequacy | Profitability | Liquidity | | Bank Groups Year↓ | All banks | PSBs | PBs | All banks | PSBs | PBs | All banks | PSBs | PBs | All banks | PSBs | PBs | All banks | PSBs | PBs | | Panel A: Yearly mean | | 2008-09 | 0.808 | 0.840 | 0.764 | 0.849 | 0.862 | 0.831 | 0.038 | 0.019 | 0.064 | 0.446 | 0.442 | 0.451 | 0.206 | 0.200 | 0.214 | | 2009-10 | 0.877 | 0.886 | 0.865 | 0.914 | 0.921 | 0.906 | 0.038 | 0.018 | 0.065 | 0.426 | 0.430 | 0.422 | 0.213 | 0.205 | 0.226 | | 2010-11 | 0.756 | 0.720 | 0.807 | 0.899 | 0.904 | 0.892 | 0.018 | 0.010 | 0.031 | 0.403 | 0.403 | 0.403 | 0.190 | 0.183 | 0.199 | | 2011-12 | 0.623 | 0.521 | 0.766 | 0.901 | 0.912 | 0.885 | 0.015 | 0.008 | 0.025 | 0.299 | 0.284 | 0.321 | 0.123 | 0.126 | 0.119 | | 2012-13 | 0.746 | 0.673 | 0.844 | 0.905 | 0.920 | 0.885 | 0.028 | 0.019 | 0.039 | 0.242 | 0.210 | 0.285 | 0.161 | 0.159 | 0.164 | | 2013-14 | 0.804 | 0.742 | 0.888 | 0.883 | 0.900 | 0.861 | 0.022 | 0.010 | 0.038 | 0.343 | 0.304 | 0.396 | 0.160 | 0.154 | 0.169 | | 2014-15 | 0.783 | 0.718 | 0.874 | 0.866 | 0.890 | 0.832 | 0.026 | 0.010 | 0.049 | 0.329 | 0.284 | 0.393 | 0.161 | 0.156 | 0.168 | | 2015-16 | 0.796 | 0.711 | 0.916 | 0.876 | 0.892 | 0.853 | 0.026 | 0.013 | 0.044 | 0.348 | 0.279 | 0.445 | 0.158 | 0.156 | 0.162 | | 2016-17 | 0.827 | 0.743 | 0.932 | 0.870 | 0.886 | 0.850 | 0.024 | 0.011 | 0.040 | 0.417 | 0.354 | 0.495 | 0.217 | 0.210 | 0.226 | | 2017-18 | 0.630 | 0.451 | 0.851 | 0.844 | 0.867 | 0.815 | 0.019 | 0.009 | 0.030 | 0.366 | 0.266 | 0.490 | 0.180 | 0.175 | 0.186 | | Panel B: Grand mean | | 2008-09 to 2017-18 | 0.765 | 0.702 | 0.851 | 0.881 | 0.896 | 0.861 | 0.025 | 0.013 | 0.042 | 0.361 | 0.325 | 0.409 | 0.177 | 0.172 | 0.183 | | 2008-09 to 2012-13 | 0.762 | 0.727 | 0.810 | 0.894 | 0.904 | 0.880 | 0.027 | 0.015 | 0.045 | 0.362 | 0.353 | 0.375 | 0.178 | 0.174 | 0.184 | | 2013-14 to 2017-18 | 0.769 | 0.677 | 0.892 | 0.868 | 0.887 | 0.842 | 0.023 | 0.011 | 0.040 | 0.360 | 0.297 | 0.443 | 0.175 | 0.169 | 0.182 | | Panel C: Hypothesis testing | | SZL test across sub-periods | H0 : pdf (DI_S2008/09-2012/13) =
pdf (DI_S2013/14-2017/18) | 5.377***
(0.000) | 6.612***
(0.000) | 8.404***
(0.000) | 7.500***
(0.000) | 0.011
(0.178) | 10.408***
(0.000) | 18.996
(0.000)*** | 6.676
(0.000)*** | 1.800
(0.905) | 2.557**
(0.012) | 7.753***
(0.000) | 2.943***
(0.004) | 4.645***
(0.003) | 7.753***
(0.000) | 2.943***
(0.004) | | SZL test across bank groups | H0 : pdf (DI_SPSB2008/09-2017/18) =
pdf (DI_SPB2008/09-2017/18) | 29.095***
(0.000) | 3.752***
(0.000) | 38.448***
(0.000) | 13.837***
(0.000) | 7.387***
(0.000) | H0 : pdf (DI_SPSB2008/09-2012/13) =
pdf (DI_SPB2008/09-2012/13) | 4.649***
(0.000) | 0.773**
(0.026) | 14.960***
(0.000) | 0.072
(0.161) | 3.007***
(0.001) | H0 : pdf (DI_SPSB2013/14-2017/18) =
pdf (DI_SPB2013/14-2017/18) | 28.011***
(0.000) | 5.073***
(0.000) | 30.771***
(0.000) | 20.028***
(0.000) | 3.991***
(0.001) | Note: *, **, and *** indicates significance at 10%, 5% and 1% levels, respectively.
Source: Authors’ calculations. | 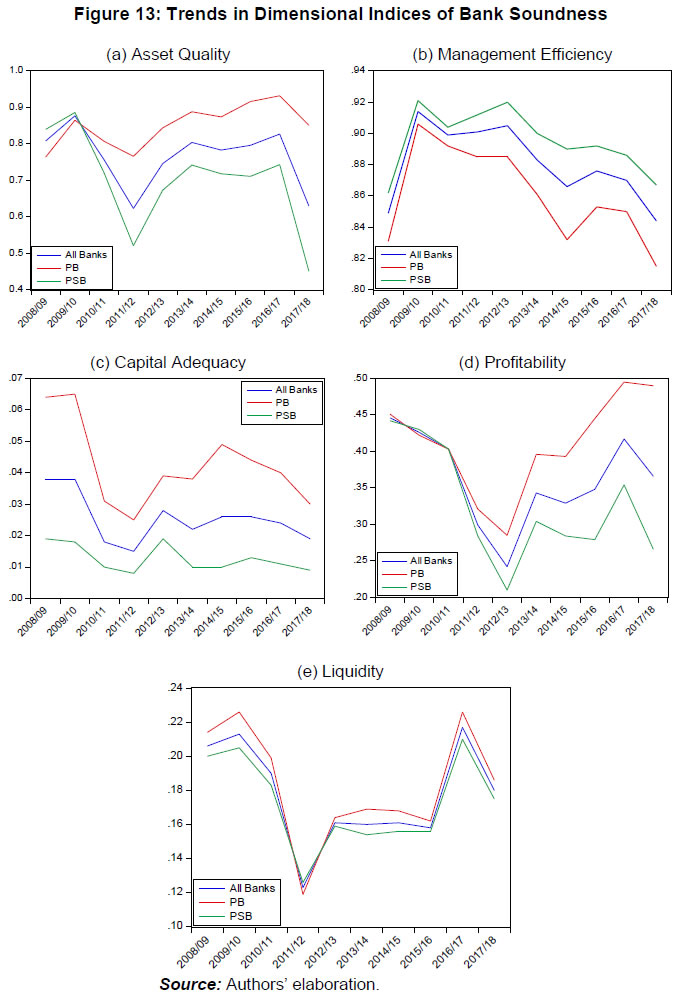 Overall, PSBs assigned higher priority to managerial efficiency. At the same time, PB placed substantial importance (about 80 per cent) on the management efficiency, asset quality, and profitability dimensions and paid little emphasis on the remaining dimensions of soundness. Thus, the distribution of the weighting scheme of each dimension of bank soundness across bank groups is lop-sided. | Table 9: Policy Priorities assigned to Dimensions of Bank Soundness | Soundness
Dimensions→
Year↓ | Asset Quality | Management Efficiency | Capital Adequacy | Profitability | Liquidity | | Panel A: Public Sector Banks | | 2008-09 | 0.147 | 0.508 | 0.100 | 0.145 | 0.100 | | 2009-10 | 0.122 | 0.565 | 0.100 | 0.114 | 0.100 | | 2010-11 | 0.100 | 0.562 | 0.100 | 0.138 | 0.100 | | 2011-12 | 0.100 | 0.600 | 0.100 | 0.100 | 0.100 | | 2012-13 | 0.100 | 0.589 | 0.100 | 0.111 | 0.100 | | 2013-14 | 0.100 | 0.588 | 0.100 | 0.112 | 0.100 | | 2014-15 | 0.100 | 0.600 | 0.100 | 0.100 | 0.100 | | 2015-16 | 0.100 | 0.574 | 0.100 | 0.126 | 0.100 | | 2016-17 | 0.152 | 0.507 | 0.118 | 0.123 | 0.100 | | 2017-18 | 0.100 | 0.481 | 0.186 | 0.133 | 0.100 | | Mean weight | 0.112 | 0.557 | 0.110 | 0.120 | 0.100 | | Panel B: Private Banks | | 2008-09 | 0.150 | 0.500 | 0.100 | 0.150 | 0.100 | | 2009-10 | 0.160 | 0.500 | 0.100 | 0.140 | 0.100 | | 2010-11 | 0.162 | 0.501 | 0.100 | 0.138 | 0.100 | | 2011-12 | 0.148 | 0.545 | 0.100 | 0.106 | 0.100 | | 2012-13 | 0.141 | 0.529 | 0.100 | 0.131 | 0.100 | | 2013-14 | 0.176 | 0.381 | 0.100 | 0.243 | 0.100 | | 2014-15 | 0.260 | 0.294 | 0.106 | 0.240 | 0.100 | | 2015-16 | 0.331 | 0.258 | 0.100 | 0.211 | 0.100 | | 2016-17 | 0.423 | 0.171 | 0.100 | 0.206 | 0.100 | | 2017-18 | 0.252 | 0.242 | 0.122 | 0.283 | 0.100 | | Mean weight | 0.220 | 0.392 | 0.103 | 0.185 | 0.100 | | Source: Authors’ calculations. | 6.3 Profit Efficiency in the Indian Banking Industry 6.3.1 Evolution of Profit Efficiency in the Indian Banking Industry Table 10 presents the estimated yearly profit efficiency scores for Indian banks. From the grand mean figures, we note that the average profit efficiency level of sampled banks is 64.3 per cent. Thus, the average profit inefficiency level is 35.7 per cent, which is very high by any standard. This finding suggests that there is considerable scope for improvements in the potential profits of Indian banks. The straightforward implication of this finding is that Indian banks should devote enormous efforts to learn the use of factor inputs in both a technically and allocatively efficient manner and choose an optimal mix of their loan and investment portfolio. Further, PSBs significantly outperformed PBs in most of the sampled years, distinct sub-periods, and the entire sampled period. One potent reason behind this finding may be a significant flight of low-cost deposits from PBs to PSBs during the post-crisis years due to implicit government guarantees. Regarding the evolution of profit efficiency, we find i) significant variations in the yearly performance of bank groups on the profit efficiency front, ii) a sudden dip in the profit efficiency of both public and private banks in the year 2013 and an immediate bounce back (see Figure 14). The results based on the SZL test are clearly indicating that an increase in profit efficiency across sub-periods is only significant in the public sector banking segment. Hence, we find notable heterogeneity in profit efficiency between ownership groups in the Indian banking industry. Figure 15 clearly indicates that the profit efficiency distributions of PSBs is distinctively different than that of PBs in terms of average, dispersion, skewness, and peakedness. | Table 10: Evolution of Profit Efficiency in the Indian Banking Industry and across distinct Ownership Groups | Bank Groups→
Year↓ | All Banks | PSBs | PBs | SZL test statistic (p-value)
H0 : pdf (PROFEFFPSB)t = pdf (PROFEFFPB)t
Test Statistic (p-value) | | Panel A: Yearly mean estimates | | 2009 | 0.567 | 0.617 | 0.501 | -0.847(0.675) | | 2010 | 0.694 | 0.762 | 0.599 | -0.075(0.102) | | 2011 | 0.722 | 0.782 | 0.638 | 0.647(0.027)** | | 2012 | 0.704 | 0.759 | 0.627 | -0.031(0.265) | | 2013 | 0.424 | 0.456 | 0.382 | 0.565(0.041)** | | 2014 | 0.681 | 0.752 | 0.586 | 2.700(0.004)*** | | 2015 | 0.658 | 0.748 | 0.530 | 2.155(0.007)*** | | 2016 | 0.704 | 0.737 | 0.657 | -1.114(0.381) | | 2017 | 0.638 | 0.627 | 0.653 | -2.048(0.530) | | 2018 | 0.636 | 0.688 | 0.572 | 1.446(0.042)** | | Panel B: Grand mean | | 2009-2018 | 0.643 | 0.693 | 0.574 | 10.171(0.003)*** | | 2009-2013 | 0.622 | 0.675 | 0.549 | 3.107(0.052)* | | 2014-2018 | 0.663 | 0.710 | 0.600 | 4.692(0.000)*** | | Panel C: SZL test across sub-periods H0 : pdf (PROFEFF2008/09-2012/13) = pdf (PROFEFF2013/14-2017/18) | | Test Statistic (p-value) | -2.282
(0.123) | 10.692**
(0.012) | -0.142
(0.498) | | Notes: *, **, and *** indicates significance at 10%, 5% and 1% levels, respectively.
Source: Authors’ calculations. | 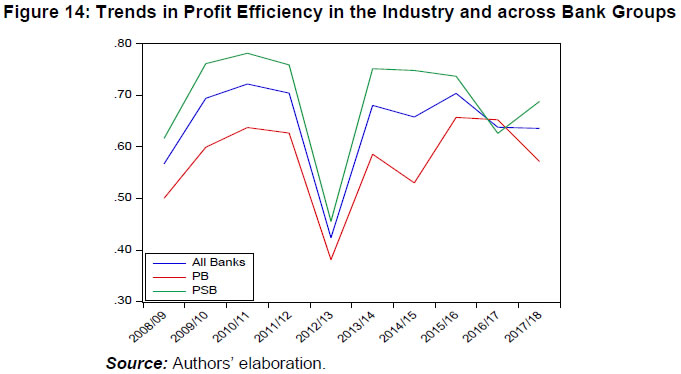
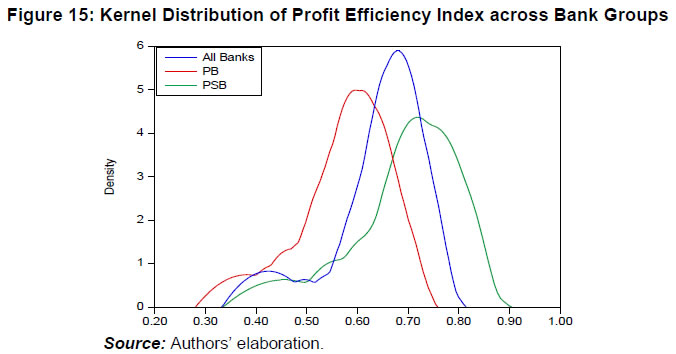 6.4 Exploring a Relationship between Governance, Efficiency and Soundness This sub-section aims to answer our key research question: Do governance and efficiency explain bank soundness in India? We adopt a two-step system GMM technique to infer more reliable conclusions about the association between corporate governance, efficiency, and bank soundness in India. The estimated results are outlined as below. 6.4.1 Results of Overall Governance and Bank Soundness We begin the discussion by developing the linkage between overall governance structure and bank soundness. For this, we obtain the coefficient estimates for the econometric model (9), as deliberated in Section 5.2.1. The results for different variants of model specification (9) are reported in Tables 11 and 12. In all the model specifications (i)-(viii), governance and efficiency are considered as endogenous, while other control variables are viewed as instruments to themselves. Reiterating here, we make this arrangement to deal with the potential endogeneity in the relationship between governance and performance indicators. The model diagnostic tests reveal that all the specifications are well fitted with the significant coefficient of first-order autocorrelation and a statistically insignificant coefficient of second-order autocorrelation. Further, the insignificant coefficients of the Hansen J test and Difference-in-Hansen test of over-identification infers that our model specifications are free from the problem of instrumentation23. And, finally, the overall reliability of the dynamic models is checked by a statistically significant Wald X2 test, which indicates the joint significance of the model estimates. We see the persistence effect of bank soundness using the estimated coefficient of lagged dependent variable (δˆ0) in the estimated model specifications. A coefficient value between 0 and 1 signifies the persistence in soundness levels. The persistence coefficient (δˆ0) is positive and statistically significant for all of the model specifications, as shown in Tables 11 and 12. This demonstrates the persistence in bank behaviour to remain sound and stable over time. The magnitude of the δˆ0 in different model specifications suggests that if the banking system experiences a jerk to stability in the current year, then about 39 to 58 per cent of its impetus will persist in the following year. Overall, the results indicate that retrieving erstwhile soundness in the Indian banking industry is not instantaneous but rather partial. The lack of observed instantaneous recovery in bank soundness may be due to the presence of damaging effects of many potential exogenous and endogenous shocks to the banking system. Some of the prominent factors that can emanate a shock in the banking system include increased risk provisioning and write-offs due to an enormous volume of NPAs, low profitability, liquidity stress, and decline in capital buffers to the level mandated by the regulators. Any shock originating from the aforementioned factors may impact the degree of persistence in bank soundness. The estimates reported in Tables 11 and 12 reveal that the relationship between overall governance structure and soundness of banks is positive and statistically significant. Thus, we get a response to the first primary hypothesis (H1) of this study. Based on the results, we can infer that governance structure predicts bank soundness in India. From the tables, we also establish the impact of risk-adjusted profit efficiency and bank-specific variables and draw the following interesting observations. First, based on the specifications (iv), (vii), and (viii) in these tables, as expected, the findings report a positive and significant relationship between PROFEFF and bank soundness. This suggests that Indian banks that are more profit efficient are sound enough to hold the capability of absorbing shocks through dynamic loss provisioning and generating substantial capital buffers, which may reduce the destabilisation effects. Second, the model estimates in the specifications (i), (ii), and (iii) reveal that bank soundness is adversely linked with ownership concentration. This finding seems to have the direct implication that the government’s inordinate ownership shareholdings in a bank (in the majority of PSBs) may entice these banks to take a disproportionate risk and possibly embrace less prudent conduct, which may not be in the depositors' best interests (Shleifer & Vishny, 1986). This conclusion is consistent with previous studies by La Porta et al. (2002) and Beck et al. (2009). This study thus contributes to the theoretical discussion concerning the role of state ownership in bank soundness. The study results favour those who contend that involvement by the government will ensure the implicit guarantee, but only to a point, because it will not necessarily improve banking system soundness beyond that. Third, as far as bank size is concerned, we confirm that asset concentration has a destabilising effect on Indian banks (see specifications (iii) & (v)). These findings are completely contrary to those of Ben et al. (2015). Fourth, our analysis shows that the coefficient of the dummy variable DREFORM in model specifications (ii) and (vi) has a negative sign. This finding indicates that an array of re-regulation and new reform measures introduced as a response to hostile events have slowly begun to push and restore the erstwhile soundness level in the industry. Moreover, banks with larger government ownership concentration are far more affected by this burden of greater regulatory compliance, as can be seen from the negative and significant coefficient of DREFORM×OWNSHARE in the specifications (ii) and (iv) in Table 1124. Fifth, to determine the ownership effects, we use the model specifications (v)-(viii) in Table 12. We include PUBLIC as a dummy taking value 1 for the PSB and 0 otherwise in these specifications. The results clarify that PSBs with higher government ownership control are less stable relative to private banks. The low asset quality and lower profitability of PSBs in conjunction with dual regulation by the GoI and RBI weaken supervisory controls and induce relaxed stringency on compliance with governance standards by these banks. All of this reduces their likelihood of being more stable. Sixth, from model specification (iii) in Table 11, a negative and statistically significant coefficient of CRISIS econometrically validates the lower soundness performance of the Indian banks during the turbulent period. We reiterate our earlier finding presented in the sub-section 6.2.1 that the endogenous shock to the system in the form of the NPAs crisis has moved the soundness below the level observed in the years before the crisis. Interestingly, the study reports a significant and positive coefficient of the interaction dummy CRISIS×PUBLIC, suggesting that the re-regulation process and other reforms that were kicked off in response to the NPAs crisis have slightly moderated the ill-effects of the crisis as far as the soundness of PSBs is concerned. This finding helps us to substantiate that the regulators took a series of potent and effective policy stances during the crisis period, which to some extent, steps in the right direction to manage the impact of the crisis on PSBs within tolerable limits (see specification (viii) in Table 12). Finally, by including the FORBRANCH as a control variable, we can see from model specifications (vi), (vii), and (viii) that bank expansion through branch internationalisation has a strong positive impact on bank soundness. | Table 11: Overall Governance Structure and Bank Soundness: Two-step System GMM results at an Aggregate Level | | [Dependent variable: Bank soundness index (CI_S)] | | Model specifications | (i) | (ii) | (iii) | (iv) | | Constant | 0.073
(0.103) | 0.353***
(0.079) | 0.223**
(0.090) | 0.306***
(0.072) | | CI_Sj,t-1 | 0.565***
(0.206) | 0.482***
(0.107) | 0.585***
(0.132) | 0.493***
(0.121) | | CI_Gj,t | 0.340*
(0.204) | 0.135*
(0.076) | 0.184**
(0.094) | 0.169
(0.107) | | SIZEj,t | -0.001
(0.0006) | 0.0001
(0.0004) | -0.001**
(0.0007) | -0.0004
(0.0004) | | FORBRANCHj,t | 0.0001
(0.0001) | 0.00003
(0.00004) | 0.00007
(0.00005) | 0.00006
(0.00004) | | OWNSHAREj,t | -0.0001**
(0.00003) | -0.00003*
(0.00002) | -0.00008***
(0.00002) | -0.00001
(0.00002) | | PROFEFFj,t | 0.027*
(0.015) | 0.0084
(0.0081) | 0.010
(0.013) | 0.019**
(0.007) | | DREFORMt | - | -0.007***
(0.001) | - | - | | DREFORMt × OWNSHAREj,t | - | -0.0001***
(0.00004) | - | -0.0002***
(0.00003) | | CRISISt | - | - | -0.006**
(0.002) | - | | CRISISt × OWNSHAREj,t | - | - | -0.000016
(0.00001) | - | | Model diagnostics | Wald X2
(p-value) | 37685***
(0.000) | 914.65***
(0.000) | 604.62***
(0.000) | 932.80***
(0.000) | AR(1)
(p-value) | -3.53***
(0.000) | -3.56***
(0.000) | -3.67***
(0.000) | -3.67***
(0.000) | AR(2)
(p-value) | -0.61
(0.540) | -1.39
(0.163) | -0.70
(0.484) | -1.11
(0.268) | | Sargan test (p-value) | 14.23*
(0.076) | 3.84
(0.427) | 7.08
(0.529) | 8.27
(0.407) | | Hansen test (p-value) | 12.79
(0.119) | 3.22
(0.522) | 8.53
(0.383) | 5.56
(0.696) | | Difference-in-Hansen test (p-value) | 1.33
(0.721) | 1.87
(0.601) | 3.10
(0.376) | 0.92
(0.820) | | N (No. of observations) | 363 | 363 | 363 | 363 | | k (No. of bank groups) | 42 | 42 | 42 | 42 | | IV (No. of instruments) | 15 | 13 | 17 | 16 | Notes: i) For definition of variables, refer to Table V.1 of Annexure-V, ii) Robust standard errors are reported in parentheses and are based on Windmeijer’s (2005) correction method; and iii) *, **, and *** indicates significance at 10%, 5% and 1% levels, respectively.
Source: Authors’ calculations. |
| Table 12: Overall Governance Structure and Bank Soundness: Two-step System GMM results at an Aggregate Level (by ownership) | | [Dependent variable: Bank soundness index(CI_S)] | | Model specifications | (v) | (vi) | (vii) | (viii) | | Constant | 0.095
(0.103) | 0.381***
(0.092) | 0.282***
(0.083) | 0.346***
(0.093) | | CI_Sj,t-1 | 0.391
(0.239) | 0.505***
(0.104) | 0.468***
(0.112) | 0.416***
(0.127) | | CI_Gj,t | 0.509*
(0.269) | 0.087
(0.102) | 0.217***
(0.077) | 0.200**
(0.082) | | SIZEj,t | -0.001**
(0.0007) | -0.00008
(0.0005) | -0.0006
(0.0006) | -0.0002
(0.0006) | | FORBRANCHj,t | 0.0001
(0.0001) | 0.00009*
(0.00004) | 0.0001***
(0.00004) | 0.0001***
(0.00003) | | PUBLICj | -0.001
(0.006) | -0.006**
(0.002) | -0.001
(0.002) | -0.005*
(0.003) | | PROFEFFj,t | - | 0.009
(0.006) | 0.023**
(0.010) | 0.024**
(0.011) | | DREFORMt | - | -0.008***
(0.002) | - | - | | DREFORMt×PUBLICj | - | -0.009***
(0.002) | -0.016***
(0.003) | -0.021***
(0.004) | | CRISISt | - | - | 0.0008
(0.002) | -0.001
(0.002) | | CRISISt×PUBLICj | - | - | - | 0.008***
(0.002) | | Model diagnostics | Wald X2
(p-value) | 122.86***
(0.000) | 1016.42***
(0.000) | 935.20***
(0.000) | 1040.10***
(0.000) | AR(1)
(p-value) | -2.97***
(0.003) | -3.56***
(0.000) | -3.53***
(0.000) | -3.33***
(0.001) | AR(2)
(p-value) | -1.43
(0.153) | -1.14
(0.254) | -1.21
(0.225) | -1.89*
(0.059) | Sargan test
(p-value) | 2.76
(0.251) | 6.49
(0.371) | 4.24
(0.645) | 7.61
(0.473) | | Hansen test (p-value) | 2.90
(0.234) | 5.36
(0.499) | 2.48
(0.871) | 7.53
(0.481) | | Difference-in-Hansen test (p-value) | 2.90
(0.234) | 3.69
(0.297) | 1.43
(0.698) | 5.44
(0.142) | | N (No. of observations) | 363 | 363 | 363 | 363 | | k (No. of bank groups) | 42 | 42 | 42 | 42 | | IV (No. of instruments) | 8 | 15 | 15 | 18 | Notes: i) For definition of variables, refer to Table V.1 of Annexure-V, ii) Robust standard errors are reported in parentheses and are based on Windmeijer’s (2005) correction method; and iii) *, **, and *** indicates significance at 10%, 5% and 1% levels, respectively.
Source: Authors’ calculations. | 6.4.2 Dimensions of Governance and Bank Soundness Individual dimensions of governance may have a unique impact on bank soundness due to differences in adherence. We again use dynamic panel regression analysis to explore differential effects of various governance dimensions and statistically validate our primary testable hypotheses H2-H7. The outcome of this regression analysis helps us to explore the effects of six individual dimensions of governance on bank soundness. The regression coefficient estimates corresponding to different variants of the econometric model (10) are provided in Tables 13 and 14. In particular, we capture the impact of BOARD, AUDIT, RISK, REMUNERATION, SHAREHOLDER, and DISCLOSURE on bank soundness level. The key findings are elaborated below. Once again, we find the positive and statistically significant coefficient of lagged dependent variable (δˆ0), inferring the persistence in soundness level in the Indian banking industry. This outcome is consistent across all the model specifications. Concerning the board effectiveness, the associated sign of the estimated coefficient is negative and significant, as evident from the specification (i) in Table 13, and (v) and (viii) in Table 14. This sign is completely contrary to our a priori expectations but in line with Andrieș et al. (2018). This finding provides evidence that a prominent emphasis only on stringent compliance with board attributes and putting a meagre focus on other important dimensions of governance may be costly and has an impeding effect on bank soundness. In terms of the audit function, we find no indication that compliance with this aspect substantially impacts bank soundness. However, a positive coefficient of interaction dummy AUDIT×DREFORM is found in the model (iv) of Table 13. The analysis convincingly confirms that better compliance with the audit function as a result of proactive regulatory reform in the post-2014 period has had a good influence on bank soundness. This finding has a lot of practical implications because any significant efforts by the management to enhance audit function compliance will have a positive externality in the form of enhanced bank soundness. Regarding the impact of the risk function, the econometric estimates do not empirically affirm the validity of the fourth primary hypothesis that better governance on internal risk assurance function enhances the bank’s soundness level. The results reveal a negative but insignificant relationship between the risk function and bank soundness in the Indian banking industry. The direct implication of this outcome is that compliance with regulatory norms about risk management principles is not adequate to make a bank sound. Rather, other policy interventions, especially in the form of greater supervisory power to resolution authorities, along with better compliance on risk governance, may improve soundness. All the model specifications show that better remuneration practices help the board decide compensation packages for executives linked to their performance, which lowers agency conflicts and enhance bank soundness. However, the recent escalation in the compensation packages and other benefits to executives and key managerial personnel of PSBs have exposed these banks to excessive risk and bigger precariousness. This fact is conveyed by the negative coefficient of REMUNERATION×PUBLIC in the model (viii) of Table 13. It is imperative to take note that, by and large, an executive of a PSB received a nominal remuneration of INR 32.75 lakhs in 2009 and 83.92 lakhs in 2018. The study, therefore, suggests that the design of a remuneration policy must ensure that bank executives avoid excessive risk-taking and shielding the bank soundness. Tables 13 and 14 show significant results in a statistical sense about the relationship between shareholders’ rights compliance and bank soundness. The findings are entirely consistent with those made by Caprio et al. (2007) and Laeven & Levine (2009). By showing this connection, we might be able to explain why the Indian banks have remained relatively safe from the adverse effects of the GFC of 2007-09. According to Erkens et al. (2012), the financial crisis triggered in 2007 in developed nations stemmed from boards taking excess risks without protecting shareholders' rights. However, in India, a combination of aggressive countercyclical measures by the central bank during crisis periods and the boards’ attention on preserving shareholder and investor rights has enabled the banking sector to avert shareholder losses and maintain the bank's resilience to turmoil during both global financial and local NPAs crises. In view of the estimated coefficients of model specifications, we can infer that more disclosure increase the probability of being unsound, and the “transparency-fragility” hypothesis validates for the Indian banking industry. This hypothesis states that disclosures (voluntary & mandatory) must be sound and decisive enough to protect the stakeholders’ interest, and dissuade the “illusion of knowledge” and panic of inefficient bank runs. The study thus alludes that superfluous disclosure may increase the risk of a bank being unsound and thus need rationalisation on this front. Once again, our findings affirm that i) greater government ownership warrants the implicit guarantee, only to a certain level, and ii) a stringent regulatory environment obligates the banks to focus more on compliance to governance standards and other regulatory norms. With respect to the effect of size, we don't find any steady relationship. At the disaggregated level, we see that a larger bank size enhances the probability of a bank being designated a stable bank. This may be because of the fact that they are entrenched and well-established. | Table 13: Governance Dimensions and Bank Soundness: Two-step System GMM results at Disaggregate Level | | [Dependent variable: Bank soundness index (CI_S)] | | Model specifications | (i) | (ii) | (iii) | (iv) | | Constant | 0.501***
(0.120) | 0.456***
(0.070) | 0.423***
(0.090) | 0.441***
(0.085) | | CI_Sj,t-1 | 0.597***
(0.105) | 0.545***
(0.083) | 0.602***
(0.097) | 0.551***
(0.082) | | BOARDj,t | -0.073**
(0.031) | -0.023
(0.022) | -0.038
(0.040) | -0.007
(0.051) | | AUDITj,t | 0.005
(0.034) | 0.012
(0.028) | 0.027
(0.035) | -0.031
(0.028) | | RISKj,t | -0.024
(0.036) | -0.019
(0.022) | -0.023
(0.028) | -0.00009
(0.016) | | REMUNERATIONj,t | 0.045**
(0.019) | 0.024*
(0.013) | 0.034**
(0.014) | 0.024*
(0.012) | | SHAREHOLDERj,t | 0.046
(0.028) | 0.057***
(0.016) | 0.051*
(0.027) | 0.063**
(0.031) | | DISCLOSUREj,t | -0.190***
(0.048) | -0.108***
(0.038) | -0.126***
(0.046) | -0.075
(0.053) | | SIZEj,t | 0.003***
(0.001) | 0.002***
(0.0007) | 0.001
(0.001) | 0.0005
(0.0006) | | FORBRANCHj,t | -0.0001
(0.0002) | -0.00004
(0.0001) | -0.00005
(0.0001) | -0.00005
(0.00006) | | OWNSHAREj,t | -0.00008
(0.00006) | -0.00002
(0.00004) | -0.00003
(0.00004) | -0.00008**
(0.00004) | | PROFEFFj,t | - | -0.0002
(0.009) | - | 0.0005
(0.010) | | DREFORMt | - | -0.003
(0.004) | - | -0.075**
(0.038) | | DREFORMt×OWNSHAREj,t | - | -0.0001***
(0.00005) | - | - | | CRISISt | - | - | -0.004
(0.004) | - | | CRISISt× OWNSHAREj,t | - | - | -0.00002
(0.00004) | - | | BOARDj,t ×DREFORMt | - | - | - | 0.011
(0.054) | | AUDITj,t × DREFORMt | - | - | - | 0.053*
(0.031) | | RISKj,t× DREFORMt | - | - | - | 0.003
(0.021) | | REMUNERATIONj,t× DREFORMt | - | - | - | -0.017
(0.012) | | SHAREHOLDERj,t × DREFORMt | - | - | - | -0.021
(0.028) | | DISCLOSUREj,t × DREFORMt | - | - | - | 0.052
(0.051) | | Model diagnostics | Wald X2
(p-value) | 365.93***
(0.000) | 1701.29***
(0.000) | 668.08***
(0.000) | 653.80***
(0.000) | AR(1)
(p-value) | -3.86***
(0.000) | -3.76***
(0.000) | -3.46***
(0.001) | -3.52***
(0.000) | AR(2)
(p-value) | -0.75
(0.455) | -1.05
(0.295) | -0.64
(0.520) | -0.95
(0.341) | Sargan test
(p-value) | 17.78
(0.602) | 10.67
(0.986) | 16.67
(0.674) | 19.49
(0.672) | Hansen test
(p-value) | 12.49
(0.898) | 12.77
(0.957) | 16.99
(0.654) | 27.71
(0.227) | Difference-in-Hansen test
(p-value) | 1.12
(0.993) | 3.26
(0.917) | 5.01
(0.658) | 7.96
(0.437) | | N (No. of observations) | 363 | 363 | 363 | 363 | | k (No. of bank groups) | 42 | 42 | 42 | 42 | | IV (No. of instruments) | 31 | 37 | 33 | 42 | Notes: i) For definition of variables, refer to Table V.1 of Annexure-V, ii) Robust standard errors are reported in parentheses and are based on Windmeijer’s (2005) correction method; and iii) *, **, and *** indicates significance at 10%, 5% and 1% levels, respectively.
Source: Authors’ calculations. |
| Table 14: Governance Dimensions and Bank Soundness: Two-step System GMM results at Disaggregate Level (by ownership) | | [Dependent variable: Bank soundness index (CI_S)] | | Model specifications | (v) | (vi) | (vii) | (viii) | | Constant | 0.464***
(0.109) | 0.457***
(0.114) | 0.387***
(0.111) | 0.361***
(0.083) | | CI_Sj,t-1 | 0.648***
(0.093) | 0.583***
(0.097) | 0.637***
(0.128) | 0.800***
(0.080) | | BOARDj,t | -0.075**
(0.031) | -0.041
(0.040) | -0.032
(0.048) | -0.088*
(0.046) | | AUDITj,t | -0.006
(0.048) | -0.017
(0.046) | 0.016
(0.046) | -0.118
(0.132) | | RISKj,t | -0.022
(0.036) | -0.013
(0.029) | -0.022
(0.029) | -0.030
(0.061) | | REMUNERATIONj,t | 0.039**
(0.019) | 0.032*
(0.018) | 0.031**
(0.012) | 0.057*
(0.031) | | SHAREHOLDERj,t | 0.048
(0.031) | 0.065**
(0.025) | 0.055*
(0.031) | 0.028
(0.062) | | DISCLOSUREj,t | -0.175***
(0.042) | -0.124**
(0.051) | -0.113***
(0.043) | -0.051
(0.039) | | SIZEj,t | 0.003***
(0.0009) | 0.002**
(0.001) | 0.0008
(0.001) | -0.0004
(0.001) | | FORBRANCHj,t | -0.00004
(0.0002) | -0.00005
(0.0001) | 0.00001
(0.0001) | - | | PUBLICj,t | -0.017
(0.012) | -0.013
(0.010) | -0.006
(0.007) | -0.159
(0.104) | | PROFEFFi,t | - | - | - | 0.005
(0.011) | | DREFORMt | - | -0.002
(0.004) | - | - | | DREFORMt×PUBLICj | - | -0.010**
(0.004) | - | - | | CRISISt | - | - | -0.004
(0.004) | - | | CRISISt×PUBLICj | - | - | -0.003
(0.005) | - | | BOARDj,t ×PUBLICj | - | - | - | 0.072
(0.050) | | AUDITj,t ×PUBLICj | - | - | - | 0.122
(0.139) | | RISKj,t×PUBLICj | - | - | - | 0.028
(0.059) | | REMUNERATIONj,t×PUBLICj | - | - | - | -0.053*
(0.031) | | SHAREHOLDERj,t ×PUBLICj | - | - | - | -0.018
(0.064) | | DISCLOSUREj,t ×PUBLICj | - | - | - | 0.022
(0.040) | | Model diagnostics | | | | | Wald X2
(p-value) | 293.27***
(0.000) | 1337.65***
(0.000) | 538.09***
(0.000) | 560.23***
(0.000) | AR(1)
(p-value) | -3.75***
(0.000) | -3.36***
(0.001) | -3.39***
(0.001) | -3.09***
(0.002) | AR(2)
(p-value) | -0.69
(0.490) | -1.00
(0.317) | -0.50
(0.618) | -0.14
(0.891) | Sargan test
(p-value) | 19.12
(0.514) | 8.81
(0.985) | 16.21
(0.704) | 29.89
(0.153) | Hansen test
(p-value) | 15.28
(0.760) | 13.11
(0.873) | 17.88
(0.595) | 22.67
(0.480) | Difference-in-Hansen test
(p-value) | 3.47
(0.839) | 4.26
(0.750) | 6.00
(0.540) | 4.45
(0.815) | | N (No. of observations) | 363 | 363 | 363 | 363 | | k (No. of bank groups) | 42 | 42 | 42 | 42 | | IV (No. of instruments) | 31 | 33 | 33 | 40 | Notes: i) For definition of variables, refer to Table V.1 of Annexure-V, ii) Robust standard errors are reported in parentheses and are based on Windmeijer’s (2005) correction method; and iii) *, **, and *** indicates significance at 10%, 5% and 1% levels, respectively.
Source: Authors’ calculations. | 6.4.3. Selected Governance Indicators and Bank Soundness Subsequent to examining the effect of overall governance structure and individual dimensions of governance on bank soundness, we move our attention on an inside and out evaluation of the impact of selected governance norms on bank soundness and attempt to test our secondary testable hypotheses. More precisely, we explore the relationship between bank soundness and selected governance norms relating to board, audit, risk, and remuneration dimensions. Once again, we utilise the two-step system GMM approach to obtain the coefficient estimates corresponding to the model specification (11a)–(11d), as discussed in Section 5.2.1. The econometric results corresponding to the banking industry as a whole and across distinct ownership groups are presented in Tables 15-18. Board characteristics and bank soundness: The model specification (11a) is estimated to build up the connection between individual board characteristics and bank soundness, and results are reported in Table 15. We note that the results do not unveil any evidence in favour of secondary hypothesis H2a, suggesting there exists no statistically significant relationship between board size (BOARDSIZE) and bank soundness in India. This inference intently follows the finding of Sarkar and Sarkar (2018), who revealed an immaterial effect of board size on profitability levels of Indian banks. In light of our econometric estimates, we do not find any significant impact of CEO duality (CEOD) and the presence of women directors (WOMENP) on bank soundness in India. Consequently, the secondary hypotheses H2c and H2d do not uphold in the Indian banking industry. As to the effect of board independence (BINDEP) on bank soundness, the impact is observed to be uneven across ownership groups. In the public sector banking segment, we find that board independence and soundness are decidedly related and share a positive relationship. This finding of ours backs the agency theory and claims that non-executive independent directors in PSBs reduce the agency conflicts, bring down the cost of debt financing, optimise the executive compensation and upgrade the soundness status of these banks. In light of this finding, we feel that recommendations of the recently constituted Banks Board Bureau (BBB) on top-level appointments like full-time directors, non-executive chairman in PSBs, will definitely improve the overall board quality of PSBs and make their board more independent. This will help PSBs with lessening the destabilisation effect of shocks. In contrast, we find that greater board independence has risked the soundness of private banks. We also see the significant impact of board activities on bank soundness. In particular, we observe that the board meetings (BMEET) exert a positive influence on soundness, while the formation of too many committees (BCOMM) brings down the soundness level. The empirical findings thus reveal that frequent board meetings offers an opportunity for quality and thorough discussion, and assist in effective discharging of board responsibilities, which is key for improving governance standards. However, the delegation of board responsibilities to a supra-optimal number of committees misgoverns the board functioning, and escalates the communication and establishment costs after a specific point, and subsequently increases the probability of bank shakiness. | Table 15: Board Characteristics and Bank Soundness | | [Dependent variable: Bank soundness index (CI_S)] | Bank Groups→
Model Coefficients↓ | All Banks | PSBs | PBs | | Constant | 0.295***
(0.079) | 0.449*
(0.254) | -0.064
(0.210) | | CI_Sj,t-1 | 0.707***
(0.089) | 0.538*
(0.308) | 1.156***
(0.209) | | BOARDSIZEj,t | -0.001
(0.001) | -0.004
(0.002) | 0.002
(0.002) | | BINDEPj,t | -0.013
(0.018) | 0.051*
(0.030) | -0.103***
(0.033) | | BMEETj,t | 0.002***
(0.0006) | 0.002
(0.001) | 0.002
(0.002) | | CEODj,t | 0.004
(0.006) | 0.009
(0.006) | 0.108
(0.087) | | BCOMMj,t | -0.001**
(0.0007) | -0.001
(0.001) | -0.004***
(0.001) | | WOMENPj,t | 0.016
(0.031) | 0.062
(0.097) | -0.025
(0.073) | | SIZEj,t | -0.0003
(0.0006) | 0.0006
(0.001) | -0.002
(0.001) | | PROFEFFj,t | - | -0.003
(0.009) | 0.003
(0.007) | | OWNSHAREj,t | -0.0001**
(0.00005) | -0.0002***
(0.00006) | -0.001
(0.002) | | Diagnostic tests | Wald X2
(p-value) | 411.87***
(0.000) | 264.39***
(0.000) | 433.79***
(0.000) | AR(1)
(p-value) | -3.47***
(0.001) | -1.58
(0.115) | -1.46
(0.144) | AR(2)
(p-value) | -1.11
(0.267) | -1.11
(0.266) | -0.07
(0.944) | Sargan test
(p-value) | 9.52
(0.849) | 13.89
(0.790) | 3.52
(0.995) | Hansen test
(p-value) | 9.10
(0.872) | 14.03
(0.782) | 5.24
(0.970) | | N (No. of observations) | 350 | 209 | 154 | | k (No. of bank groups) | 42 | 24 | 18 | Notes: i) For definition of variables, refer to Table V.1 of Annexure-V, ii) Robust standard errors are reported in parentheses and are based on Windmeijer’s (2005) correction method; and iii) *, **, and *** indicates significance at 10%, 5% and 1% levels, respectively.
Source: Authors’ calculations. | Audit and internal risk controls, and bank soundness: An investigation of the effect of the governance norms relating to audit and risk management structure on bank soundness is done econometrically by estimating the model specifications (11b) and (11c), respectively. Tables 16 and 17 report the estimated results. The negative coefficient of the size of audit and risk committees with bank soundness, implies the importance of having an optimum size of these committees. The connotation of this finding is that an appointment of additional directors on audit and risk committees should be so that it will not increase the complexity, and rather ensure reasonable diversity and expertise in various areas, assuring the effective flow of information and proper risk mitigation. This eventually averts instability. The results thus hint towards the benefits of having the optimum number of directors on these committees. Among ownership groups, the relation between the size of the audit committee (AUDITSIZE) and soundness gives off an impression of being significant just for PSBs. | Table 16: Audit Function and Bank Soundness | | [Dependent variable: Bank soundness index (CI_S)] | Bank Groups→
Model Coefficients↓ | All Banks | PSBs | PBs | | Constant | 0.190**
(0.088) | -0.009
(0.219) | 0.459***
(0.151) | | CI_Sj,t-1 | 0.795***
(0.103) | 0.967***
(0.125) | 0.520***
(0.166) | | AUDITSIZEj,t | 0.0001
(0.002) | -0.005**
(0.002) | -0.002
(0.004) | | AUDITINDPj,t | 0.026*
(0.015) | 0.017
(0.016) | -0.0008
(0.015) | | AUDITMEETj,t | -0.002
(0.001) | -0.002
(0.002) | -0.00002
(0.001) | | AUDITCOMPj,t | 0.004
(0.011) | 0.083
(0.166) | 0.001
(0.009) | | PROFEFFj,t | 0.001
(0.005) | 0.003
(0.006) | 0.008*
(0.005) | | Diagnostic tests | Wald X2
(p-value) | 165.01***
(0.000) | 214.45***
(0.000) | 51.40***
(0.000) | AR(1)
(p-value) | -3.48***
(0.000) | -2.09**
(0.036) | -1.98**
(0.048) | AR(2)
(p-value) | -1.23
(0.219) | -0.47
(0.635) | -1.25
(0.210) | Sargan test
(p-value) | 99.53***
(0.000) | 26.39*
(0.068) | 21.92*
(0.080) | Hansen test
(p-value) | 38.52
(0.137) | 21.33
(0.212) | 9.94
(0.766) | | N (No. of observations) | 350 | 209 | 154 | | k (No. of bank groups) | 42 | 24 | 18 | Notes: i) For definition of variables, refer to Table V.1 of Annexure-V, ii) Robust standard errors are reported in parentheses and are based on Windmeijer’s (2005) correction method; and iii) *, **, and *** indicates significance at 10%, 5% and 1% levels, respectively.
Source: Authors’ calculations. | Other than the size, the audit committee’s independence (AUDITINDP) from management is the other important aspect. The independence of the audit committee necessitates that the committee appoints two-third of members as independent directors. What’s more, a bank needs to get a certificate from the statutory auditors or practicing company secretaries regarding compliance with this governance standard and unveil this information in its annual report. Table 16 also finds that while higher compliance in terms of procuring an auditor’s compliance certificate does not significantly impact the soundness level. In any case, having a majority of independent directors on the audit committee assists in exercising better controls over bank accounts and finance, and accordingly, more tight audit functions bring down the danger of bank failure. At last, the negative and significant coefficient of RISKNEX in Table 17 indicates that mere compliance on the appointment of the non-executive chairman of the risk committee without concentrating on independent monitoring of the risk policy and strategy for a bank has destabilising effects. Therefore, the study suggests that there is a need to have better coordination between the risk committee of the board and management to fortify the monitoring role in moderating risks and maintaining soundness in the banking system. | Table 17: Risk Management Function and Bank Soundness | | [Dependent variable: Bank soundness index(CI_S)] | Bank Groups→
Model Coefficients↓ | All Banks | PSBs | PBs | | Constant | 0.332***
(0.092) | -0.085
(0.115) | 0.276**
(0.106) | | CI_Sj,t-1 | 0.677***
(0.094) | 1.078***
(0.121) | 0.726***
(0.111) | | RISKSIZEj,t | -0.004***
(0.001) | 0.001
(0.002) | - | | RISKNEXj,t | -0.013*
(0.007) | 0.008
(0.007) | -0.004
(0.009) | | RISKMEETj,t | 0.001
(0.001) | -0.0004
(0.003) | -0.006**
(0.003) | | PROFEFFj,t | -0.017*
(0.010) | 0.003
(0.016) | 0.020**
(0.009) | | Diagnostic tests | Wald X2
(p-value) | 122.62***
(0.000) | 500.59***
(0.000) | 94.94***
(0.000) | AR(1)
(p-value) | -3.69***
(0.000) | -2.98***
(0.003) | -2.34**
(0.019) | AR(2)
(p-value) | -1.64
(0.101) | -0.23
(0.815) | -1.90*
(0.057) | Sargan test
(p-value) | 70.15***
(0.000) | 32.38***
(0.004) | 1.64
(0.977) | Hansen test
(p-value) | 37.83
(0.186) | 16.71
(0.272) | 1.09
(0.993) | | N (No. of observations) | 350 | 209 | 154 | | k (No. of bank groups) | 42 | 24 | 18 | Notes: i) For definition of variables, refer to Table V.1 of Annexure-V, ii) Robust standard errors are reported in parentheses and are based on Windmeijer’s (2005) correction method; and iii) *, **, and *** indicates significance at 10%, 5% and 1% levels, respectively.
Source: Authors’ calculations. | Remuneration and bank soundness: So as to comprehend the role of remuneration practices on bank soundness in India, we estimate the model specification (11d). The model coefficients are given in Table 18. In the case of PB group, we find a negative and significant coefficient of the presence of the remuneration committee (REMCOMM). This finding validates the agency theory view of compensation holds in the private banking segment. This view links the executive compensation with the performance and explains how the underlined link resolves the moral hazard issues between the agent and the principal. Under the validity of this view, one can infer that in a typical private bank, the remuneration committee designs a better pay structure and contracts for executives that motivate them to make decisions aimed at averting shocks and improving the soundness level of the bank. Furthermore, while validating our secondary hypothesis (H5a), we note a negative and statistically significant relationship between executive remuneration (Ln(EXREM)) and bank soundness in the banking industry as a whole and its public sector banking segment. The recent jump in bank frauds and problem loans, which exposed the system to unsound practices, poses a big question mark on the justification for increased remuneration packages of executives in Indian banks, especially of those belonging to PSBs. Thus, the observed bank unsoundness in recent years also allows critics to raise their eyebrows to express their doubt on the overall quality of the existing corporate governance practices in the Indian banking industry. | Table 18: Remuneration and Bank Soundness | | [Dependent variable: Bank soundness index(CI_S)] | Bank Groups→
Model Coefficients↓ | All Banks | PSBs | PBs | | Constant | 0.084
(0.091) | 0.263**
(0.130) | 0.291***
(0.110) | | CI_Sj,t-1 | 0.911***
(0.095) | 0.760***
(0.111) | 0.695***
(0.116) | | REMCOMMj,t | 0.001
(0.004) | 0.001
(0.007) | -0.021***
(0.007) | | REMMEETj,t | -0.001
(0.001) | -0.002
(0.001) | 0.002
(0.001) | | Ln(EXREM) j,t | -0.006**
(0.002) | -0.014**
(0.006) | -0.001
(0.003) | | PROFEFFj,t | 0.037***
(0.010) | 0.022**
(0.010) | 0.018
(0.015) | | Diagnostic tests | Wald X2
(p-value) | 145.41***
(0.000) | 206.37***
(0.000) | 65.57***
(0.000) | AR(1)
(p-value) | -3.99***
(0.000) | -3.25***
(0.001) | -2.32**
(0.021) | AR(2)
(p-value) | -0.08
(0.936) | -0.07
(0.941) | -1.49
(0.137) | Sargan test
(p-value) | 25.00
(0.161) | 24.37
(0.182) | 2.70
(0.846) | Hansen test
(p-value) | 22.44
(0.263) | 19.68
(0.414) | 3.27
(0.774) | | N (No. of observations) | 346 | 209 | 150 | | k (No. of bank groups) | 42 | 24 | 18 | Notes: i) For definition of variables, refer to Table V.1 of Annexure-V, ii) Robust standard errors are reported in parentheses and are based on Windmeijer’s (2005) correction method; and iii) *, **, and *** indicates significance at 10%, 5% and 1% levels, respectively.
Source: Authors’ calculations. | 6.5 Robustness Check using Alternate Econometric Methods In order to ascertain the robustness of aforementioned results using the two-step system GMM approach, the econometric models have been re-estimated by applying pooled OLS (POLS) and fixed-effects (FE) methods. Tables 19-21 report the results. In addition, Tables 22-23 provide a comparison of the results across distinct panel estimation methods and validation of underlined hypotheses of the study. The econometric estimates derived from POLS and FE are found to be consistent with those obtained from the two-step system GMM approach and facilitate us to draw the robust inferences. Nonetheless, the estimated POLS and FE coefficients limit the explanation to the average effect between governance and bank soundness. It doesn’t give a complete picture of the effect of overall governance structure and its dimensions on bank soundness at different points in the conditional distribution of the soundness. Therefore, along with capturing the mean effects using POLS and FE methods, we also used the panel quantile regression with non-additive fixed-effects, as developed by Powell (2016)25, to explore varying effects along with the distribution (quantiles) of the bank soundness. The coefficient estimates for model specifications (9) and (10) are obtained corresponding to five quantiles, viz., 10th, 25th, 50th, 75th, and 95th quantiles, which are reported in Tables 25 and 27. The quantile estimates of the coefficient of governance are significant up to the 50th quantile. We find that bank governance has a highly significant and positive effect on soundness from the 10th to 50th quantiles. However, the relationship weakens at the upper quantiles, representing the banks with high soundness. To doubly check the robustness of our results, we re-estimated our econometric specification (13) to substantiate the underlined nexus between governance and soundness corresponding to 19 quantiles ranging from 0.05-0.95 with an increment of 0.05. Table 26 reports the relevant results. We find that consistent evidence of governance effects vanishes from the 75th quantile, implying that sound governance enhances bank soundness only up to the 70th quantile. Thus, the relationship between governance and soundness is significant and more pronounced in the bottom quantiles relative to top quantiles. Thus, we can safely infer that in the Indian banking industry, governance predicts bank soundness, albeit the stronger impact is felt at lower quantiles, as evident from the higher value of the βˆCI_G coefficient of 0.271 at Q0.10 relative to 0.025 at Q0.70 (see Figure 16). | Table 19: Overall Governance Structure and Bank Soundness: Robustness Check using Alternative Methods | | [Dependent variable: Bank soundness index(CI_S)] | | Variables→ | CI_Sj,t-1 | CI_Gj,t | PROFEFFj,t | SIZEj,t | OWNSHAREj,t | FORBRANCHi,t | | Estimation Methods↓ | Quantiles | | | | | | | | Pooled OLS | Mean | 0.801***
(0.031) | 0.061***
(0.018) | -0.001
(0.002) | -0.0007*
(0.0004) | -0.00006***
(0.00001) | 0.00002
(0.00002) | | Fixed-effects | Within estimation | 0.581***
(0.038) | 0.107***
(0.028) | 0.0005
(0.003) | -0.0008*
(0.0004) | -0.0001***
(0.00002) | -0.0006
(0.0008) | | Panel Quantile | Q0.10 | 0.710***
(0.014) | 0.278***
(0.028) | 0.002*
(0.001) | -0.010***
(0.0009) | -0.0002***
(0.00003) | -0.0006***
(0.0001) | | Q0.25 | 0.355***
(0.002) | 0.215***
(0.0008) | 0.007***
(0.0001) | -0.014***
(0.00001) | -0.0003***
(0.000) | -0.00004***
(0.000) | | Q0.50 | 0.643***
(0.044) | 0.072***
(0.015) | 0.0009
(0.001) | 0.003**
(0.001) | -0.0001***
(0.00002) | -0.0006***
(0.00002) | | Q0.75 | 0.578***
(0.039) | 0.017
(0.014) | 0.003
(0.002) | 0.001
(0.003) | -0.00008***
(0.00001) | -0.0004
(0.0002) | | Q0.95 | 0.564***
(0.012) | 0.005
(0.006) | 0.0008
(0.001) | -0.0007**
(0.0002) | -0.0001***
(0.00) | -0.00009***
(0.00002) | Notes: i) For definition of variables refer to Table V.1 of Annexure-V, ii) Figure in parentheses are robust standard errors in case of Pooled OLS & Fixed-effects, and bootstrap errors in the case Panel Quantile regression; and iii) *, **, & *** indicates significance at 10%, 5% & 1% levels, respectively.
Source: Authors’ calculations. |
| Table 20: The Relationship between Overall Governance and Soundness at different Quantiles | | [Dependent variable: Bank soundness index(CI_S)] | | Quantiles | βˆCI_G | Quantiles | βˆCI_G | | OLS(Mean) | 0.061*** | Q0.50 | 0.072*** | | Q0.05 | 0.271*** | Q0.55 | 0.085*** | | Q0.10 | 0.278*** | Q0.60 | 0.066*** | | Q0.15 | 0.199*** | Q0.65 | 0.091*** | | Q0.20 | 0.206*** | Q0.70 | 0.025*** | | Q0.25 | 0.215*** | Q0.75 | 0.017 | | Q0.30 | 0.126*** | Q0.80 | 0.022* | | Q0.35 | 0.127*** | Q0.85 | 0.023** | | Q0.40 | 0.099*** | Q0.90 | -0.015* | | Q0.45 | 0.079*** | Q0.95 | 0.006 | Note: *, **, and *** indicates significance at 10%, 5% and 1% levels, respectively.
Source: Authors’ calculations. |
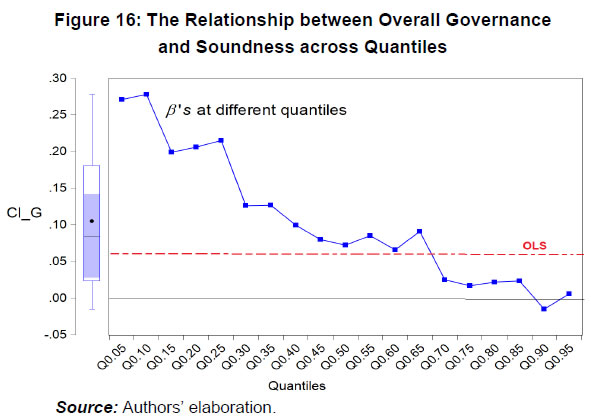 At the disaggregated level, once again, we find that more tight audit controls tend to boost soundness across all the quantiles. Further, strict regulatory controls on risk management function increase the regulatory burden for the banks with low soundness, as reflected from the negative and significant coefficient of RISK for 10th and 25th quantiles. However, among moderately stable banks, greater compliance with the RISK dimension exerts a positive and significant impact on bank soundness since the coefficients are found to be significant for 50th and 70th quantiles. The consistently positive relation holds for all the quantiles for the remuneration and shareholders’ rights and information dimensions. Except for Q0.95, profit efficiency shows a positive impact on soundness for all other quantiles. Interestingly, this effect appears to be stronger for low to moderate stable banks. Regarding compliance on disclosure practices, the quantile estimates reveal that greater transparency lowers banks’ risk of instability. This relationship holds only for Q0.50 to Q0.75. For control variables, across all five quantiles, the estimates re-emphasise that i) more prominent government ownership increases the likelihood of being unsound, and ii) a stringent regulatory environment obligates the banks to concentrate more on compliance to governance standards and other regulatory norms. | Table 21: Dimensions of Governance and Bank Soundness: Robustness Check using Alternative Methods | | [Dependent variable: Bank soundness index(CI_S)] | | Estimation Methods | Pooled OLS | Fixed-effects | Panel Quantile | | | | | | | Q0.10 | Q0.25 | Q0.5 | Q0.75 | Q0.95 | | Model specifications | (1) | (2) | (3) | (4) | (5) | (6) | (7) | (8) | (9) | | CI_Sj,t-1 | 0.803***
(0.028) | 0.718***
(0.037) | 0.603***
(0.043) | 0.471***
(0.051) | 0.852***
(0.010) | 0.829***
(0.005) | 0.814***
(0.012) | 0.758***
(0.025) | 0.751***
(0.022) | | BOARDj,t | -0.006
(0.005) | 0.007
(0.005) | -0.016**
(0.007) | -0.002
(0.007) | -0.009***
(0.001) | -0.021***
(0.002) | -0.012***
(0.0009) | -0.004
(0.002) | -0.001
(0.005) | | AUDITj,t | 0.016***
(0.005) | 0.013**
(0.005) | 0.019
(0.014) | 0.012
(0.012) | 0.028***
(0.0009) | 0.029***
(0.001) | 0.024***
(0.001) | 0.015***
(0.004) | 0.019***
(0.004) | | RISKj,t | -0.006
(0.005) | -0.002
(0.004) | -0.005
(0.004) | 0.003
(0.004) | -0.003***
(0.001) | -0.006***
(0.001) | 0.004***
(0.0006) | 0.003**
(0.001) | -0.007
(0.004) | | REMUNERATIONj,t | 0.003
(0.003) | 0.005
(0.003) | 0.004
(0.004) | 0.007*
(0.004) | 0.018***
(0.0009) | 0.015***
(0.001) | 0.014***
(0.0004) | 0.010***
(0.002) | 0.010***
(0.002) | | SHAREHOLDERj,t | 0.012
(0.007) | 0.015*
(0.009) | 0.011
(0.010) | 0.017**
(0.008) | 0.021***
(0.0008) | 0.023***
(0.001) | 0.017***
(0.001) | 0.018***
(0.001) | 0.015***
(0.005) | | DISCLOSUREj,t | -0.011
(0.006) | -0.005
(0.007) | -0.020*
(0.012) | -0.011
(0.008) | 0.0002
(0.0007) | 0.0001
(0.001) | 0.005***
(0.001) | 0.004***
(0.001) | -0.002
(0.008) | | PROFEFFj,t | -0.001
(0.002) | 0.001
(0.002) | -0.0002
(0.004) | 0.004
(0.002) | 0.002***
(0.0002) | 0.004***
(0.0004) | 0.006***
(0.0003) | 0.004***
(0.0008) | 0.00007
(0.003) | | SIZEj,t | -0.0005
(0.0004) | 0.0003
(0.0004) | -0.0002
(0.0005) | 0.00007
(0.0004) | 0.001***
(0.00006) | 0.001***
(0.0002) | 0.0005***
(0.00006) | -0.0004
(0.0003) | -0.0004
(0.0004) | | FORBRANCHj,t | 0.00001
(0.00003) | 0.00004
(0.00003) | -0.0007
(0.0008) | 0.0009
(0.0005) | 0.00009
(0.00004) | -0.00007
(0.0003) | -0.00002***
(0.000) | 0.0001**
(0.00006) | 0.0001**
(0.00008) | | OWNSHAREj,t | -0.00005***
(0.00001) | -0.00001
(0.00001) | -0.0001***
(0.00003) | -0.00002
(0.00004) | -0.00006***
(0.000) | -0.00004***
(0.000) | -0.00006***
(0.000) | -0.00004***
(0.000) | 0.00001
(0.0002) | | DREFORMt | - | -0.009***
(0.001) | - | -0.009***
(0.002) | -0.016***
(0.0009) | -0.010***
(0.0009) | -0.011***
(0.0003) | -0.010***
(0.001) | -0.005*
(0.003) | | DREFORMt× OWNSHAREj,t | - | -0.00009***
(0.00002) | - | -0.0001***
(0.00003) | 0.00003***
(0.000) | -0.00007***
(0.00001) | -0.00003***
(0.00001) | -0.00008***
(0.00002) | -0.0001***
(0.00003) | | Constant | 0.180***
(0.029) | 0.235***
(0.036) | 0.385***
(0.042) | 0.468***
(0.047) | | | | | | | Model diagnostics | F-statistics
(p-value) | 200.09***
(0.000) | 161.66***
(0.000) | 66.01***
(0.000) | 76.04***
(0.000) | | | R2 | 0.746 | 0.799 | 0.572 | 0.704 | Notes: i) For definition of variables, refer to Table V.1 of Annexure-V, ii) Figure in parentheses are robust standard errors in the case of Pooled OLS and Fixed-effects, and bootstrap errors in the case Panel Quantile regression; and iii) *, **, and *** indicates significance at 10%, 5% and 1% levels, respectively.
Source: Authors’ calculations. |
| Table 22: Validation of Primary Hypotheses across Different Estimation Methods | | Variables | Hypothesis validated | Expected Sign | Actual Sign | System GMM | POLS | Fixed-effects | Panel Quantile | | CI_Sj,t-1 | Persistence effect | + | + | ✓ | ✓ | ✓ | ✓
(Positive for all quantiles) | | CI_Gj,t | H1
H2
H3
H4
H5
H6
H7 | Effects of overall governance and its individual dimensions | + | + | ✓
“Governance matters” | ✓ | ✓ | ✓
(Positive only for Q0.10-Q0.50) | | BOARDj,t | + | - | ×
(Negative significant effect) | × | × | ✓
(Positive only for Q0.10-Q0.50) | | AUDITj,t | + | No significant effect | ×
(Positive effect for AUDIT×DREFORM) | ✓ | × | ✓
(Positive for all quantiles) | | RISKj,t | + | No significant effect | × | × | × | ✓
(Positive for Q0.50-Q0.75 & Negative for Q0.10-Q0.25) | | REMUNERATIONj,t | + | + | ✓
(Negative effect for REMUNERATION×PUBLIC) | × | ✓ | ✓
(Positive for all quantiles) | | SHAREHOLDERj,t | + | + | ✓
“Agency hypothesis” | ✓ | ✓ | ✓
(Positive for all quantiles) | | DISCLOSUREj,t | +/- | - | ✓
“Transparency-fragility hypothesis” | × | ✓ | ✓
(Positive only for Q0.50-Q0.75) | | PROFEFFj,t | Performance effect | + | + | ✓ | × | × | ✓
(Positive only for Q0.10-Q0.25) | Notes: A tick mark (✓) indicates that the primary hypothesis is supported, while a cross mark (×) indicates that the primary hypothesis is not supported.
Source: Authors’ compilation based on econometric results. |
| Table 23: Validation of the impact of Governance Indicators and Secondary Hypotheses across Bank Groups | | Governance Dimension | Indicators | Actual Sign and Hypothesis validated | | All Banks | PSBs | PBs | | BOARD | BOARDSIZEj,t | × | × | × | | BINDEPj,t | × | ✓ (Positive “H2b”) | ✓ (Negative) | | WOMENPj,t | × | × | × | | CEODj,t | × | × | × | | BCOMMj,t | ✓ (Negative) | × | ✓ (Negative) | | BMEETj,t | ✓ (Positive, “H2e”) | × | × | | AUDIT | AUDITSIZEj,t | × | ✓ (Negative) | × | | AUDITINDPj,t | ✓ (Positive) | × | × | | AUDITMEETj,t | × | × | × | | AUDITCOMPj,t | × | × | × | | RISK | RISKSIZEj,t | ✓ (Negative) | × | × | | RISKNEXj,t | ✓ (Negative) | × | × | | RISKMEETj,t | × | × | ✓ (Negative) | | REMUNERATION | REMCOMMj,t | × | × | ✓ (Negative) | | REMMEETj,t | × | × | × | | Ln(EXREM)j,t | ✓ (Negative ”H5a”) | ✓ (Negative ”H5a”) | × | Notes: ‘✓’ indicates that a significant effect of the governance variable is observed on bank soundness level, while ‘×’ indicates that no relationship with bank soundness is perceived.
Source: Authors’ compilation based on econometric results. | 7. Conclusions and Policy Implications There is no refuting that bank governance failures may endanger the soundness of the whole banking sector and have a negative impact on the economy’s growth trajectory. The subject of whether governance affects bank soundness in a developing economy like India is a significant and yet little-investigated research territory. The present research study digs deep into this research territory. In particular, by employing the two-step system GMM method, this study adopts a granular research approach and empirically explores the link between governance, efficiency and bank soundness in India at various disaggregation levels. The entire empirical analysis has been completed utilising the data set for the period 2009-2018. The governance and bank soundness indexes have been computed utilising the state-of-the-art constrained Benefit-of-the-doubt (BoD) model, which has several intrinsic advantages over the traditional approaches of constructing a composite index. The estimates of the risk-adjusted profit efficiency for banks are obtained using a data envelopment analysis model. Analysis of inter-temporal behaviour of governance compliance uncovers that, albeit Indian banks have made significant progress in complying with the governance standards over the most recent couple of years, yet the current level of compliance is not adequate to mark the existing governance structure as a “socially efficient” structure. Private banks generally demonstrated better performance in adhering to governance norms, while PSBs faltered in accomplishing greater compliance with the dimensions of board effectiveness, risk management and audit functions. Unmistakable reasons that can be referred for lower governance by PSBs could be dual regulation, board complexities, slackness on internal controls, and externally imposed constraints through central vigilance agencies on PSBs. In terms of soundness, the Indian banking industry was relatively stable from 2008-09 to 2012-13, but early symptoms of a fall in bank soundness began to surface in 2013-14. A significant drop in profitability and asset quality caused an increase in the fragility and vulnerability of the banking system in the turbulent period that marked its beginning in 2013-14. The examination of endogenously generated weights by the BoD model reveals that, by and large, a typical PSB assigned higher priority to disclosure, which is followed by the remuneration and shareholders’ rights and information. Conversely, a typical private bank attributed a more prominent spotlight on audit function, followed by risk management and board quality. On dimensions of bank soundness, PSBs entrusted higher priority to management efficiency. At the same time, private banks prioritised management efficiency, asset quality, and profitability. The finding shows asymmetries in the policy priorities of banks on governance and soundness dimensions across ownership groups. We arrive at the following inferences while econometrically modeling the relationship between governance and bank soundness. To begin with, the degree of governance significantly explains bank soundness level, and inadequacies in regulatory compliance on selected governance principles would be exorbitant and may have a destabilising sway on the banking system. Further, there exists a time-persistence in bank soundness and the absence of an instantaneous recovery mechanism. The lack of instant recovery might be a direct result of the presence of damaging effects of many potential exogenous and endogenous shocks to the banking system. Besides, profit efficient banks are sufficiently sound to keep up capital buffers and absorb shocks, which may diminish destabilising effects. Therefore, to avoid the risk of bank failure in the long-run, business practices that assure sustainable profits with proportionate risk need to be encouraged. This study also suggests that government involvement offers the implied guarantee only up to a level, and beyond that, it does not necessarily translate into higher bank soundness. Additionally, a pervasive shift in the policy stance of regulators from deregulation to re-regulation since 2014 has compelled the banks to concentrate more on adherence to governance standards and other regulatory norms. Concerning bank size, no stable relationship with soundness is observed. At the disaggregated level, an assessment of the effects of individual governance dimensions/standards on bank soundness causes us to notice the following. First, the focus on stringent compliance with board attributes, and putting a less focus on other important governance dimensions might be costly and impedingly affect bank soundness. Second, in the post-2014 period, improved audit function compliance as an outcome of proactive regulatory amendments had a significantly positive impact on bank soundness. Third, compliance with regulatory norms about risk management principles is not sufficient to make a bank sound. Other policy interventions, particularly in the form of greater supervisory power to resolution authorities, along with better compliance on risk governance, improve soundness. Fourth, better remuneration practices help the board in choosing compensation packages for executives that are connected to their performance, which lowers agency conflicts and enhance bank soundness. Fifth, higher compliance on shareholders’ rights enhances the soundness of banks. At the same time, only reasonable and rational disclosures can protect the interest of the minority investors along with depositors, and circumvent precipitating the risk of being unsound. At last, board meetings, independent directors on the audit committee, and the remuneration committee assists in exercising better controls, deflecting shocks, and improving the soundness level of the bank. Regarding the effect of board independence on bank soundness, the effect is observed to be uneven across ownership groups. The empirical results are found to be robust for different panel data estimation models. On an end note, the findings of this research work are unique and feature some significant aspects of governance and bank soundness in India, which might be useful for regulators. Our findings uncover that better governance compliance has strong predicting power for explaining bank soundness. Further, bank soundness in India is not just determined by traditional equity governance principles, compliance with debt governance standards also assumes an important role in this regard, particularly as shown by the evidence for the post-2014 NPAs crisis period. In light of this, we suggest that less governed and less sound banks should re-adjust their focus on less prioritised areas. For this, the BoD-based weights can be used as a potent diagnostic tool. Although private banks have given indications of recuperation in soundness position in the most recent years, it remained a challenge for PSBs. In this context, the experts believe that the system of dual regulation debilitates the regulatory discipline prompting feeble corporate governance in PSBs. Along these lines, we feel that PSBs need greater autonomy and more controlling powers to respond quickly against frauds or irregularities and to manage the effects of any internal and external shocks. Even the success of the recent consolidation wave in the public sector banking segment hinges upon how well newly emerged mega PSBs improve their governance structures, which is a great challenge. Altogether, we foresee that the persistent regulatory efforts by the policymakers toward cleaning banks’ balance sheets (especially those of PSBs), restructuring, recapitalisation, and recent consolidation through mega merger would help to boost the overall soundness of the banking system in the years ahead.
References Adams, R.B. & Mehran, H. (2003). Is corporate governance different for bank holding companies? Economic Policy Review, 9(1), 123-142. Adams, R.B. & Mehran, H. (2012). Bank board structure and performance: Evidence for large bank holding companies. Journal of Financial Intermediation, 21(2), 243-267. Agarwal, S., Kamath, S., Subramanian, K. & Tantri, P. (2015). Do bank boards focus adequately on risk? Available at: https://www.nseindia.com/research/content/NSE-IGIDR-WP5-14-15.pdf Agoraki, M.E.K, Delis, M.D & Staikouras, P.K. (2010). The effect of board size and composition on bank efficiency. International Journal of Banking and Finance, 2(4), 357-386. Ahamed, M.M. & Mallick, S. (2017). Does regulatory forbearance matter for bank stability? Evidence from creditors’ perspective. Journal of Financial Stability, 28(C), 163-180. Aiello, F. & Bonanno, G. (2017). On the sources of heterogeneity in banking efficiency literature. Journal of Economic Surveys, 32(1), 194-225. Alchian, A.A. & Demsetz, H. (1972). Production, information costs, and economic organisation. The American Economic Review, 62(5), 777-795. Allen, R., Athanassopoulos, A.D., Dyson, R.G. & Thanassoulis, E. (1997). Weight restrictions and value judgements in DEA: Evolution, development and future directions. Annals of Operations Research, 73(0), 13-34. Andrieș, A.M., Căpraru, B. & Nistor, S. (2018). Corporate governance and efficiency in banking: Evidence from emerging economies. Applied Economics, 50(34-35), 3812-3832. Anginer, D., Demirgüç-Kunt, A., Huizinga, H. & Ma, K. (2016). Corporate governance and bank capitalisation strategies. Journal of Financial Intermediation, 26,1–27. Ard, L. & Berg, A. (2010). Bank governance- lessons from financial crisis. International Finance Corporation, The World Bank. Available at: http://siteresources.worldbank.org/EXTFINANCIALSECTOR/Resources/Note13_Bank_Governance.pdf Arellano, M., Bond, S. (1991). Some tests of specification for panel data: Monte Carlo evidence and an application to employment equations. The Review of Economic Studies, 58 (2), 277–297. Ariff, M. & Can, L. (2008). Cost and profit efficiency of Chinese banks: A non-parametric analysis. China Economic Review, 19(2), 260–273. Arun, T.G. & Turner, J.D. (2004). Corporate governance of banks in developing economies: concepts and issues. Corporate Governance: An International Review, 12(3), 371-377. Athanassoglou, S. (2016). Revisiting worst-case DEA for composite indicators. Social Indicators Research, 128(3), 1259-1272. Badasyan, N., Shideler, D. & Silva, S. (2011). Broadband achievement index: Moving beyond availability. Telecommunications Policy, 35(11), 933-950. Basel Committee on Banking Supervision (BCBS). (2015). Corporate governance principles for banks, July 2015, Available at: http://www.bis.org/bcbs/publ/d328.htm Bebchuk, L.A. & Neeman, Z. (2010). Investor protection and interest group politics. Review of Financial Studies, 23(3), 1089-1119. Becht, M., Bolton, P. & Röell, A. (2011). Why bank governance is different. Oxford Review of Economic Policy, 27(3), 437-63. Beck, T., Hesse, H., Kick, T. & von Westernhagen, N. (2009). Bank ownership and stability: Evidence from Germany. Available at: https://voxeu.org/article/bank-ownership-and-stability-evidence-germany. Ben, A.M.S., Intissar, T. & Zeitun, R. (2015). Banking concentration and financial stability: Evidence from developed and developing countries. Economics Discussion Papers, No. 2015-22, Kiel Institute for the World Economy. Available at: https://www.econstor.eu/bitstream/10419/109217/1/822199831.pdf Berger, A. & Mester, L. (1997). Inside the black box: What explains differences in the efficiency of financial institutions? Journal of Banking and Finance, 21(7), 895-947. Berger, A.N., Imbierowicz, B. & Rauch, C. (2016). The roles of corporate governance in bank failures during the recent financial crisis. Journal of Money, Credit and Banking, 48(4), 729-770. Besstremyannaya, G., (2012). The impact of Japanese hospital financing reform on hospital efficiency: A difference-in-difference approach. The Japanese Economic Review, 54(3), 337-362. Bhatia, M. & Gulati, R. (2020). Does board effectiveness matter for bank performance? Evidence from India. International Journal of Comparative Management, 3(1/2), 9-52. Bhattacharya, B. & Roy, T. N. S. (2012). Indicators of banking fragility in India: An empirical test. South Asia Economic Journal, 13(2), 265-290. Blundell, R. & Bond, R. (1998). Initial conditions and moment restrictions in dynamic panel data models. Journal of Econometrics, 87(1), 115-143. Blundell, R., Bond, S. & Windmeijer, F. (2001). Estimation in dynamic panel data models: Improving on the performance of the standard GMM estimator. Advances in Econometrics, 15, 53-91. Boyd, J. H., Nicolò, G. D. & Jalal, A.M. (2006). Bank risk-taking and competition revisited: New theory and new evidence, IMF Working Paper No. 06297, Available at: https://www.imf.org/external/pubs/ft/wp/2006/wp06297.pdf Brown, L. D. & Caylor, M. L. (2006). Corporate governance and firm valuation. Journal of Accounting and Public Policy, 25. Bukhari, K.S., Awan, H.M. & Ahmed, F. (2013). An evaluation of corporate governance practices of Islamic banks versus Islamic bank windows of conventional banks- A case of Pakistan. Management Research Review, 36(4), 400–416. Bushman, R.M. (2016). Transparency, accounting discretion, and bank stability. FRBNY Economic Policy Review, August 2016. Available at: https://www.newyorkfed.org/medialibrary/media/research/epr/2016/epr_2016-transparency-accounting_bushman.pdf?la=en Caprio, G. & Levine, R. (2002). Corporate governance of banks: Concepts and international observations. Paper presented at the Global Corporate Governance Forum Research Network Meeting, 5 April. Caprio, G., Laeven, L. & Levine, R. (2007). Governance and bank valuation. Journal of Financial Intermediation, 16(4), 584–617. Casu, B. & Molyneux, P. (2003). A comparative study of efficiency in European banking. Applied Economics, 35(17), 1865–1876. Central Bank of the Republic of Turkey. (2008). Financial Stability Report. Central Bank of the Republic of Turkey, Ankara. Chakrabarti, R. (2005). Corporate governance in India – Evolution and challenges. (January 17, 2005). Available at SSRN: http://dx.doi.org/10.2139/ssrn.649857 Charles, V. & Díaz, G. (2017). A non-radial DEA index for Peruvian regional competitiveness. Social Indicators Research, 134(2), 747-770. Charnes, A., Cooper, W.W. & Rhodes, E. (1978). Measuring the efficiency of decision making units. European Journal of Operational Research, 2(6), 429-444. Cherchye, L., Moesen, W. & Van Puyenbroeck, T. (2004). Legitimately diverse, yet comparable: On synthesising social inclusion performance in the EU. Journal of Common Market Studies, 42(5), 919-955. Cherchye, L., Moesen, W., Rogge, N. & Van Puyenbroeck, T. (2007). An introduction to ‘benefit of the doubt’ composite indicators. Social Indicators Research, 82(1), 111-145. Conyon, M., Gregg, P. & Machin, S. (1995). Taking care of business: Executive compensation in the United Kingdom. The Economic Journal, 105(430), 704-714. Dafny, L. & D. Dranove (2006). Regulatory exploitation and the market for corporate control. NBER Working Paper 12438. Available from URL: http://www.nber.org/papers/w12438 Dalton, D.R., Daily, C.M., Johnson, J.L. & Ellstrand, A.E. (1999). No. of directors and financial performance: A meta-analysis. Academy of Management Journal, 42(6), 674–686. Das, U. S., Quintyn, M. G. & Chenard, K. (2004). Does regulatory governance matter for financial system stability? An empirical analysis. IMF Working Paper No. 04/89. Available at: https://www.imf.org/en/Publications/WP/Issues/2016/12/30/Does-Regulatory-Governance-Matter-for-Financial-System-Stability-An-Empirical-Analysis-17410#:~:text=Regression%20results%20indicate%20that%20regulatory,institutions%20and%20public%20sector%20governance. Das, A. & Ghosh, S. (2009). Financial deregulation and profit efficiency: A nonparametric analysis of Indian banks, Journal of Economics and Business, 61(6), 509-528. De Haan, J. & Vlahu, R. (2016). Corporate governance of banks: A survey. Journal of Economic Surveys, 30(6), 228-277. Dell’Ariccia, G., Detragiache, E. & Rajan, R. (2008). The real effect of banking crises. Journal of Financial Intermediation, 17, 89-112. Demirgüç-Kunt, A. & Detragiache, E. (2011). Basel core principles and bank soundness: Does compliance matter?. Journal of Financial Stability, 7(4), 179-190. Demirgüç-Kunt, A., Detragiache, E. (1998). The determinants of banking crises in developing and developed countries. IMF Economic Review, 45, 81–109. Dhal, S., Kumar, P. & Ansari, J. (2011). Financial stability, economic growth, inflation and monetary policy linkages in India: An empirical reflection. RBI Occasional Papers, 32(3), Winter 2011. Donaldson, L., & Davis, J. H. (1991). Stewardship theory or agency theory: CEO governance and shareholder returns. Australian Journal of Management, 16(1), 49–64. Dong, Y., Girardone, C. & Kuo, J-M. (2017). Governance, efficiency and risk-taking in Chinese banking. The British Accounting Review, 49(2), 211-229. Eichengreen, B. & Gupta, P. (2013). The financial crisis and Indian banks: Survival of the fit-test? Journal of International Money and Finance, 39 (C), 138–152. Ellul, A. & Yerramilli, V. (2013). Stronger risk controls, lower risk: Evidence from U.S. bank holding companies. The Journal of Finance, 68(5), 1757-1803. Erkens, D.H., Hung, M. & Matos, P. (2012). Corporate governance in the 2007–2008 financial crisis: Evidence from financial institutions worldwide. Journal of Corporate Finance, 18(2), 389–411 Fama, EF & Jensen, M. (1983). Separation of ownership and control. Journal of Law and Economics, 26, 301–25. Fama, EF. (1980). Agency problems and the theory of the firm. Journal of Political Economy, 88, 288–307. Färe, R., Grosskopf, S. & Weber, W. (2004). The effect of risk-based capital requirements on profit efficiency in banking. Applied Economics, 36(15), 1731-1743. Farvaque, E., Gainet, C., Refait-Alexandre, C. & Saïdane, D. (2009). Is corporate disclosure necessarily desirable? A survey. Paris Finance International Meeting AFFI – EUROFIDAI (December 2009). Available at SSRN: https://ssrn.com/abstract=1494238 Fernández-Sánchez, J.L., Zamanillo, M.D.O. & Luna, M. (2020). How corporate governance mechanisms of banks have changed after the 2007–08 financial crisis. Global Policy, 11(S1), 52-61. Fernández, A. I., González, F. & Suárez, N. (2016). Banking stability, competition, and economic volatility. Journal of Financial Stability, 22(C), 101-120. Financial Services Authority Board. (2011). The failure of the Royal Bank of Scotland. December, London, United Kingdom, Available at: http://www.fsa.gov.uk/static/pubs/other/rbs.pdf Financial Stability Board. (2017). Thematic Review on Corporate Governance. Available at: http://www.fsb.org/wp-content/uploads/Thematic-Review-on-Corporate-Governance.pdf Fiordelisi, F. & Mare, D. S. (2014). Competition and financial stability in European cooperative banks. Journal of International Money and Finance, 45(C), 1-16. Fujii, H., Managi, S., & Matousek, R. (2014). Indian bank efficiency and productivity changes with undesirable outputs: A disaggregated approach. Journal of Banking and Finance, 38, 41–50. García-Meca, E., García-Sánchez, I-M. & Martínez-Ferrero, J. (2015). Board diversity and its effects on bank performance: An international analysis. Journal of Banking & Finance, 53, 202-214. Geršl, A. & Heřmánek, J. (2006). Financial stability indicators: Advantages and disadvantages of their use in the assessment of financial system stability. CNB Financial Stability Report 2006, Czech National Bank, Research Department, pp. 69-79. Available at: https://www.cnb.cz/export/sites/cnb/en/financial-stability/.galleries/fs_reports/fsr_2006/FSR_2006_article_2.pdf Ghosh, S. (2011). A simple index of banking fragility: Application to Indian data. The Journal of Risk Finance, 12(2), 112-120. Giambona, F. & Vassallo, E. (2013). Composite indicator of financial development in a benefit-of-doubt approach. Economic Notes, 42(2), 171-202. Global Financial Stability Report. (2014). Risk taking, liquidity, and shadow banking: Curbing excess while promoting growth. IMF. Available at: https://www.imf.org/en/Publications/GFSR/Issues/2016/12/31/Risk-Taking-Liquidity-and-Shadow-Banking-Curbing-Excess-While-Promoting-Growth Gompers, P., Ishii, J.L. & Metrick, A. (2003). Corporate governance and equity prices. The Quarterly Journal of Economics, 118(1), 107-55. Greco, S., Ishizaka, A., Tasiou, M. & Torrisi, G. (2019). On the methodological framework of composite indices: A review of the issues of weighting, aggregation, and robustness. Social Indicators Research, 141(C), 61-94. Grove, H., Patelli, L., Victoravich, L. M. & Xu, P.T. (2011). Corporate governance and performance in the wake of the financial crisis: Evidence from US commercial banks. Corporate Governance: An International Review, 19(5), 418–436. Gulamhussen, M. A. & Santa, S. F. (2015). Female directors in bank boardrooms and their influence on performance and risk-taking. Global Finance Journal, 28, 10-23. Gulati, R. & Kumar, S. (2011). Impact of non-traditional activities on the efficiency of Indian banks: a non-parametric approach. Macroeconomics and Finance in Emerging Market Economies, 4 (1), 125-166. Gulati, R. & Kumar, S. (2016). Assessing the impact of the global financial crisis on the profit efficiency of Indian banks. Economic Modelling, 58(C), 167–181. Gulati, R. & Singh, N. (2019). Analysing bank stability in India: Evidence from 2007/08-2016/17. Journal of Applied Finance and Banking, 9(6), 101-125. Gulati, R., Kattumuri, R. & Kumar, S. (2020). A non-parametric index of corporate governance for banking firms: An application to India data. Socio-Economic Planning and Sciences, 70, Available at: https://doi.org/10.1016/j.seps.2019.03.008. Heremans, D. (2007). Corporate governance issues for banks: A financial stability perspective (February 2007). Available at SSRN: https://ssrn.com/abstract=1024693. Hermalin, B. & Weisbach, M. (2003). Board of directors as an endogeneity determined institution. Federal Reserve Bank of New York Economic Policy Review, 9, 1-20. Hopt, K.J. (2013). Better governance of financial institutions. ECGI Working Paper Series in Law, Working Paper No. 207/2013. Huljak, I. (2015). Market power and stability of CEE banks. Business Systems Research, 6(2), 74-90. Humphrey, D.B. & Pulley, L.B. (1997). Banks’ responses to deregulation: Profits, technology, and efficiency. Journal of Money, Credit and Banking, 29, 73–93. Jain, M.K. (2021). Governance and prudential supervision of financial institutions: Recent initiatives. RBI Bulletin, November 2021. Available at: https://www.rbi.org.in/Scripts/BS_SpeechesView.aspx?Id=1138 Jayaraman, A.R. & Bhuyan, P. (2020). Impact of NPA and loan write-offs on the profit efficiency of Indian banks. Decision, 47, 35-48. Jayaraman, A.R. & Srinivasan, M.R. (2014). Analysing profit efficiency of banks in India with undesirable output - Nerlovian profit indicator approach, IIMB Management Review, 26(4), 222-233. Jensen, MC. (1993). The modern industrial revolution, exit, and the failure of internal control systems. The Journal of Finance, 48, 831–80. Jiménez-Hernandez, I., Palazzo, G. & Sáez-Fernández, F.J. (2019). Determinants of bank efficiency: Evidence from the Latin American banking industry. Applied Economic Analysis, 27(81),184-206. Jokippi, T. & Monnin, P. (2013). The impact of banking sector stability on the real economy. Journal of International Money and Finance, 32(C), 1-16. Kaminsky, G. L. & Reinhart, C. M. (1999). The twin crises: The causes of banking and balance-of-payments problems. American Economic Review, 89(3), 473-500. Kočišová, K. & Stavárek, D. (2018). The evaluation of banking stability in the European Union countries. International Journal of Monetary Economics and Finance, 11(2), 36-55. Koenker, R.W. & Bassett, G.(1978). Regression quantiles. Econometrica, 46(1), 33-50. Kohn, D. (2011). Enhancing financial stability: The role of transparency. Address in the Financial Markets Group at the London School of Economics by an external member of the Bank of England’s Interim Financial Policy Committee. Tuesday, September 6, 2011. Available at: https://www.brookings.edu/on-the-record/enhancing-financial-stability-the-role-of-transparency/ Kumar, M., Charles, V. & Mishra, C.S. (2016). Evaluating the performance of Indian banking sector using DEA during post-reform and global financial crisis. Journal of Business and Management, 17(1), 156–172. Kumar, S. & Gulati, R. (2014). Deregulation and Efficiency of Indian Banks. India Studies in Business and Economics Series. Springer. Available at: Deregulation and Efficiency of Indian Banks | SpringerLink La Porta, R., Lopez-de-Silanes, F. & Shleifer, A. (2002). Government ownership of commercial banks. Journal of Finance, 57(1), 265-301. La Porta, R., Lopez-de-Silanes, F., Shleifer, A. & Vishny, R.W. (1998). Law and finance. Journal of Political Economy, 106(6), 1113–1155. Laeven, L. & Levine, R. (2009). Bank governance, regulation and risk taking. Journal of Financial Economics, 93(2), 259-275. Lavigne, C., Jaeger, S.D. & Rogge, N. (2019). Identifying the most relevant peers for benchmarking waste management performance: A conditional directional distance Benefit-of-the-Doubt approach. Waste Management, 89(C), 418-429. Levine, R. (2004). The corporate governance of banks: A concise discussion of concepts and evidence. World Bank Policy Research Working Paper No. 3404, Available at: https://ssrn.com/abstract=625281 Li, Q. (1996). Non-parametric testing of closeness between two unknown distribution functions. Econometric Reviews, 15(3), 261-274. Liang, Q. Pisun X., & Jiraporn, P. (2013). Board characteristics and Chinese bank performance. Journal of Banking and Finance, 37(8), 2953-2968. Love, I. & Rachinsky, A. (2015). Corporate governance and bank performance in emerging markets: Evidence from Russia and Ukraine. Emerging Markets Finance and Trade, 51(2), S101–S121. Lovell, C.A.K., Pastor, J.T. & Turner, J.A. (1995). Measuring macroeconomic performance in the OECD: A comparison of European and non-European countries. European Journal of Operational Research, 87(3), 507-518. Main, B. G. M. & Johnston, J. (1993). Remuneration committees and corporate governance. Accounting and Business Research, 23 (S1), 351-362. Mamatzakis, E. & Bermpei, T. (2015). The effect of corporate governance on the performance of US investment banks. Financial Markets, Institutions and Instruments, 24(2-3), 191-239. Marques, L.B. & Oppers, S.E. (2014). Risk taking by banks: the role of governance and executive pay, In: Global Financial Stability Report: Risk Taking, Liquidity, and Shadow Banking—Curbing Excess while Promoting Growth. International Monetary Fund, October 2014, 105-142. Maudos, J. & Pastor, J.M. (2003). Cost and profit efficiency in the Spanish banking sector (1985–1996): A non-parametric approach. Applied Financial Economics, 13 (1), 1-12. Maxfield, S., Wang, L. & Magaldi de Sousa, M. (2018). The effectiveness of bank governance reforms in the wake of the financial crisis: A stakeholder approach. Journal of Business Ethics, 150 (2), pp. 485– 503. Melyn, W. & Moesen, W. (1991). Towards a synthetic indicator of macroeconomic performance: Unequal weighting when limited information is available. Public Economics Research Paper- Leuven, ZDB-ID 26175691, No. 17, CES, KU Leuven. Mester, L. J. (1996). A study of bank efficiency taking into account risk-preferences. Journal of Banking and Finance, 20(6), 1025-1045. Ministry of Corporate Affairs. (2013). The Companies Act 2013. Government of India, New Delhi, India, Available at: http://www.mca.gov.in/Ministry/pdf/CompaniesAct2013.pdf Mishra, R.N., Majumdar, S. & Bhandia, D. (2013). Banking stability - A precursor to financial stability. RBI Working Paper Series WPS (DEPR): 01 / 2013. Misra, R. & Das, A. (2019). Corporate governance in banks in India. Economic and Political Weekly, 54(28), 96-105. Mohan, R. 2004. Ownership and governance in private sector banks in India. RBI Bulletin, October 2004. Mülbert, P.O. (2010). Corporate governance of banks after the financial crisis - Theory, evidence, reforms. ECGI Working Paper Series in Law. Working Paper No.151/2010. Mullineux, A. (2006). The corporate governance of banks. Journal of Financial Regulation and Compliance, 14(4), 375-382. Nickell, S. (1981). Biases in dynamic models with fixed effects. Econometrica, 49(6),1417-1426. Nyamongo, M. E. & Temesgen, K. (2013). The effect of governance on performance of commercial banks in Kenya: a panel study. Corporate Governance, 13(3), 236-248. OECD. (2008). Handbook on constructing composite indicators: Methodology and users guide. JRC European Commission. Available at: http://www.oecd.org/sdd/42495745.pdf OECD. (2014). Risk management and corporate governance. OECD Publishing. Available at: http://www.oecd.org/daf/ca/risk-management-corporate-governance.pdf Peni, E. & Vähämaa, S. (2012). Did good corporate governance improve bank performance during the financial crisis? Journal of Financial Services Research, 41(1-2), 19–35. Powell, D. (2016). Quantile regression with nonadditive fixed effects. Quantile Treatment Effects. Rand Corporation. Available at: http://works.bepress.com/david_powell/1/ Puyenbroeck, T. (2018). On the output orientation of the benefit-of-the-doubt-model. Social Indicators Research, 139(2): 415-431. Reddy, Y.V. (2002). Public sector banks and the governance challenge: Indian experience. Lecture delivered at the World Bank. International Monetary Fund and Brookings Institution Conference, New York, April 2002. Available at: https://www.bis.org/review/r020422d.pdf Reserve Bank of India. (2001). Report of the Standing Committee on International Financial Standards and Codes: Advisory Group on Corporate Governance (Chairman: R.H.Patil). Mumbai, India. Reserve Bank of India. (2002). Report of Consultative Group of Directors of Banks/ Financial Institutions, 2002 (Chairman: A.S. Ganguly). https://www.rbi.org.in/scripts/PublicationReportDetails.aspx?ID=279. Reserve Bank of India. (2010). Financial Stability Report. December 2010. Mumbai, India. Reserve Bank of India. (2014). Report of the Committee to Review Governance of Boards of Banks in India (Chairman: P.J.Nayak). Mumbai, India, Available at: https://rbidocs.rbi.org.in/rdocs/PublicationReport/Pdfs/BCF090514FR.pdf Reserve Bank of India. (2019a). Financial Stability Report. December 2019. Mumbai, India. Reserve Bank of India (2019b). Revised Guidelines on Compensation of Whole Time Directors/ Chief Executive Officers/ Material Risk Takers and Control Function staff, Mumbai, India. Available at: https://www.rbi.org.in/Scripts/NotificationUser.aspx?Id=11720&Mode=0 Reserve Bank of India. (2020). Discussion Paper on Governance in Commercial Banks in India. Mumbai, India. Rogge, N. & Puyenbroeck, T.V. (2007). An introduction to ‘benefit-of-the-doubt’ composite indicators. Social Indicators Research, 82(1), 111-145. Roodman, D. (2009). How to do xtabond2: An introduction to difference and system GMM in Stata. The Stata Journal, 9(1), 86–136. Sarkar, J. & Sarkar, S. (2018). Bank ownership, board characteristics and performance: evidence from commercial banks in India. International Journal of Financial Studies, 6(1), 1-30. Securities and Exchange Board of India. (2015). Clause 49 [Listing Obligation and Disclosure Requirements] Regulations 2015. Circular No. CIR/CFD/POLICY CELL/2/2014. Available at https://www.sebi.gov.in/sebi_data/attachdocs/1441284401427.pdf. Schaeck, K., & Cihák, M. (2014). Competition, efficiency, and stability in banking. Financial Management, 43(1), 215-241. Segoviano, M.A. & Goodhart, C. (2009). Banking stability measures. IMF Working Paper WP/09/4. Available at: https://www.imf.org/external/pubs/ft/wp/2009/wp0904.pdf Shaddady, A. & Moore, T. (2019). Investigation of the effects of financial regulation and supervision on bank stability: The application of CAMELS-DEA to quantile regressions. Journal of International Financial Markets, Institutions and Money, 58(C), 96-116. Shleifer, A. & Vishny, R.W. (1986). Large shareholders and corporate control. Journal of Political Economy, 94(3), 461-488. Simar, L. and Zelenyuk, V. (2006). On testing equality of distributions of technical efficiency scores. Econometric Reviews, 25 (4), 497-522. Simper, R., Hall, M.J.B, Liu, W., Zelenyuk, V. & Zhou, Z. (2017). How relevant is the choice of risk management control variable to non-parametric bank profit efficiency analysis? The case of South Korean banks. Annals of Operations Research, 250, 105-127. Song, F.M. & Li, L. (2012). Bank Governance: Concepts and Measurements. In: Barth, J.R., Lin, C. & Wihlborg, C. (Eds.), Research Handbook on International Banking and Governance, 17-41, Edward Elgar Publishing. Subbarao, D. (2011). Corporate governance of banks in India. An inaugural address by Governor, RBI at the FICCI-IBA (Federation of Indian Chambers of Commerce and Industry – Indian Banks’ Association) Conference on “Global Banking: Paradigm Shift”, Mumbai, August 2011. Tadesse, S. (2006). The economic value of regulated disclosure: Evidence from the banking sector. William Davidson Institute Working Paper No. 875, Available at: https://pdfs.semanticscholar.org/ce3c/5fed257bdaaf8dc1eb832b5c07d5c2c9a306.pdf Vidoli, F. & Fusco, E. (2018). Compind: Composite indicators functions based on frontiers in R (Compind package version 2.0). Available at: https://cran.r-project.org/web/packages/Compind/vignettes/Compind_vignette.pdf Windmeijer, F. (2005). A finite sample correction for the variance of linear efficient two-step GMM estimators. Journal of Econometrics, 126 (1), 25-51. Wintoki, M.B., Linck, J.S. & Netter, J.M. (2012). Endogeneity and the dynamics of internal corporate governance. Journal of Financial Economics, 105(3), 581-606. Witte, K.D. & Rogge, N. (2011). Accounting for exogenous influences in performance evaluations of teachers. Economics of Education Review, 30(4), 41–653. Whitehead, C.K. (2011). Creditors and Debt Governance. Research Handbook on the Economics of Corporate Law, Claire Hill & Brett McDonnell, eds., Edward Elgar Publishing, 2012, Cornell Legal Studies Research Paper No. 011-04.
Annexure-I Governance Models across Countries: An International comparison | Table I.1: Comparison of Governance Models across the World | | Country | US1 | UK2 | Japan3 | China4 | India5 | | Corporate governance model | Anglo-Saxon Shareholder model | Shareholder | Hybrid model of stakeholder and shareholder | Mix of stakeholder & shareholder | Shareholder | | Separation of Chairman & CEO | Recommended | Same person can hold 2 positions | No separation required | Yes | Not mandatory (for listed companies)
Yes (for banks) | | Board structure | One-tier
(executive and non-executive board) | One-tier
(executive and non-executive board) | Board of directors, office of representative directors, office of auditors, de-facto one-tier board | Two-tier board | One-tier (executive and non-executive board) | | Ownership structure | Widely dispersed ownership | Widely dispersed small shareholding structure | Concentrated ownership | Concentrated ownership shareholding among state- owned banks; Dispersed for other bank groups | Concentrated ownership | | Internal controls/committees | Audit, risk, remuneration and nomination committees with all independent, outside directors for the audit committee | Audit, risk, remuneration and nomination committees with audit committee consisting entirely of non-executive directors including the chairman as independent; in nomination & remuneration committees, directors must not perform any executive function | Audit, remuneration and nomination committees with no mandatory requirement of independent directors for committees | Audit (mandatory), risk, remuneration and nomination committees (non-mandatory) with audit committee consist of all non-executive and proper portion of independent directors; No such requirement for other committees | Audit, risk, nomination committees, and stakeholder’s relationship committees, remuneration committee (non-mandatory), with two-thirds of the members of the audit committee shall be independent directors; and nomination and remuneration committees require all non-executive with majority independent; stakeholder’s relationship committee to be chaired by non-executive director | | Board composition | Minimum 5 and maximum 25 members, optimal board size with majority groups may have | Optimal combination of executive and outside non-executive directors | Appropriate board size with diversity with outside directors does not always mean independent | Minimum 3 and maximum 19, one-third of the board be independent | Minimum 3 and maximum 15, optimal combination of executive and non-executive directors with a limit on board size; different for public and private Companies | Notes: 1Guiding Principles for Enhancing U.S. Banking Organisation Corporate Governance 2015; 2Sir David Walker UK Governance Code - A Review of Corporate Governance in UK Banks and Other Financial Industry Entities 2010; 3Japan’s Corporate Governance Code (by the Financial Services Agency and Tokyo Stock Exchange) 2015; 4Guidance on Corporate Governance of Joint Stock Commercial Banks, People’s Bank of China 2002 & Chinese Banking Regulatory Commission Guidelines on Corporate Governance of Commercial Banks 2011; 5SEBI Clause 49 [LODR] 2015 (amended 2017) and Companies Act (CA) 1956 (amended in 2009 and 2013); and 1,2,3,4,5Thematic Review on Corporate Governance, Financial Stability Board 2017.
Source: Authors’ compilation from corporate governance reports by national and international jurisdictions. |
Annexure-II Comparison of Governance Guidelines by Legislative Authorities in India | Table II.1: Governance Reforms in India | | Parameter | Provisions by various Committees of Reserve Bank of India | SEBI Clause 49 [Listing Obligation and Disclosure Requirements] Regulations, 2000 (amended 2005, 2009, 2015) | Companies Act, 1956
(amended 2009, 2013) | | Applicability | All commercial banks, public sector as well as private banks | Companies listed on the BSE and NSE, including listed banks | All public and private limited companies, including private banks and other PSBs (IDBI Ltd.) | | Board of Directors# | • An optimum mix of executive and non-executive directors with a strong representation of non-executive directors and minimum board size of 10 for banking companies with net-worth of INR 15 crore or more; • A non-executive Chairman (nominated by Bank Investment Company) and a CEO (nominated by the board) should be separate positions • Should not exceed two (one by GoI and one by RBI), and RBI/GoI nominees should not be considered as independent directors | • The board should have an optimum combination of executive and non-executive directors, with at least 50 per cent of the board comprise of non-executive directors • Chairman of the board should be non-executive (non-mandatory), and Chairman and Managing Director/CEO should be separate positions (non-mandatory) • Nominee directors should not be treated as independent directors • Board must have at least one woman director | • A minimum no. of three directors, in the case of a public company, two directors, in the case of a private company, and one director in the case of a One Person Company, and a maxi. of 15 directors • A strong representation of non-executive directors • The chairperson of the company may be executive or non-executive. But as per the Ministry of Finance, Department of Financial 11 Services, Circular F. No. 4/4/2015-BO.I (pt.) dated 18 Aug. 2015, Chairman of the Board shall be Non-Executive (mandatory). • Nominee directors should not be treated as independent • Board must have at least one woman director | | Board Independence | • In strict compliance with Clause 49 of SEBI’s Listing Guidelines, at least one-third (33%) of the board, in case of the non-executive chairperson; and at least half (50%), in case of executive chairperson • Directorship on not more than three listed companies in case of executive director, and not more than six (seven) listed companies for PSBs (private banks), respectively, for a non-executive independent director • As per Patil Committee recommendations, the listed company shall provide suitable training to independent directors and disclosed in the annual report | • An independent director in relation to a company means a director other than a managing director, a whole-time director, or a nominee director. • At least one-third (33%) of the board, in case of non-executive chairperson and at least half (50%) of the board, in case of executive chairperson • Chairmanship/Directorship on not more than three listed companies for executive directors and not more than seven listed companies for independent directors • Suitable training to independent directors and details disclosed in the annual report or website of the company | • At least one-third of the total no. of directors as independent directors • No person shall hold office as a director in more than 20 companies at the same time, and the maximum number of public companies in which a person can be appointed as a director shall not exceed ten | | Board meetings, tenure and diversity | • A minimum no. of 4 meetings in a year • A chairman should have a minimum of 5-year tenure, executive directors to have a minimum of 3 years tenure, and the maximum term for other directors restricted to 7 years | • The board should meet at least 4 times a year • The chairperson should have a minimum of 5-year tenure, executive directors to have a minimum of 3 years tenure, and independent director to have a minimum of 5 years tenure, reappointed for 5 years with a cooling period of 3 years | • A minimum no. of four meetings of its Board of Directors every year • Independent director shall hold office for a term up to 5 consecutive years, for more than two consecutive terms | | Board conduct | • Committee recommended the strict compliance to SEBI Clause 49 under the listing agreement • Separate corporate governance report by banks as a part of the annual report • Information on related party holdings • Senior management of the bank shall submit their affirmation on compliance with the Code of Conduct • A company should follow the whistle blower mechanism and allow employees’ direct access to the Chairperson of the Audit Committee in exceptional cases | • The listed company shall establish a Whistle Blower Policy (i.e., vigil mechanism) for directors and employees. The company shall disclose the details of the establishment of such a vigil mechanism on the company’s website or annual report • The Board shall lay down a code of conduct for all Board members and senior management of the company • Disclosures on related party transactions shall be made to the audit committee | • The company shall establish a vigil mechanism for directors and employees • Independent director shall report the concerns about the code of conduct or ethic’s policy • Disclosures on related party transactions shall be made | | Internal controls (Appointments, Audit, Remuneration and Risk) | • The board should have a risk, audit and remuneration and nomination committee and in addition to, stakeholder’s grievance committee • Minimum of 3 members in each committee with all as non-executive and independent directors • Committees should meet at least 3 or 4 times a year • Committees should have majority independent directors, with the audit committee having all independent directors, and justifiable reason for the inclusion of non-independent director shall be reported • Chairperson of audit, nomination and remuneration committee shall be an independent non-executive director • A bank should have an executive director as chief risk officer | • The board should have at least three committees, which includes risk, audit and remuneration and nomination committee • Minimum three members with all non-executive and at least two-thirds of the members as independent directors. • Committees should have an independent director as it chairman • There must be an appointed external auditor • Chief risk officer for top 100 listed companies | • The board should have at least 3 committees, which includes audit and remuneration and nomination committees • A minimum of 3 directors with independent directors forming a majority • There must be an appointed external auditor for statutory audits • A company should have a risk management policy taken care off by the audit committee • The chairperson of the company (whether executive or non-executive) shall not chair the remuneration committee | | Disclosure and Transparency | • Banks are required to maintain transparency and disclosures in accordance with the SEBI (Listing Obligation and Disclosure Requirement) Regulations-2015 (‘Listing Regulations’) • Banks are required to make disclosures on accounting standards AS 18-Related Party Disclosures; accounting standards AS 17- all applicable Accounting Standards; details on need-based training programmes organised for directors; certificate for proof of the independence of the audit firm be attached with the report as per M/o. Corporate Affairs; penalties if any imposed, should be disclosed in the report. | • The company shall disclose the policy on dealing with Related Party Transactions in the annual report • Financial accounting standards followed by bank shall be disclosed in the annual report • All pecuniary relationship or transactions of the non-executive directors vis-à-vis the bank shall be disclosed in the Annual Report • A Management Discussion and Analysis report should form part of the annual report to the shareholders. • The details of training imparted to Independent Directors shall be disclosed in the Annual Report • CEO/CFO shall certify that the board has complied with accounting standards & code of conduct set by the bank • The company shall obtain a certificate from either the auditors or practicing company secretaries regarding the compliance of conditions of corporate governance and disclose it in the annual report. • Details of non-compliance by the company, penalties, and strictures imposed on the company by Stock Exchange or SEBI or any statutory authority, on any matter related to capital markets, during the last 3 years shall be disclosed in the annual report | • Disclosures on related party transactions; accounting policies to shareholders; details on remuneration or sitting fees paid to directors, criteria of making payments, etc.; separate section on Management Discussion and Analysis in the report; disclosures on the training imparted to directors of the company; a secretarial audit and compliance report, by a company secretary in practice; etc. • If a company makes any default in complying with the legal provisions, the company and director of the company who is in default shall be liable to a penalty. | | Ownership pattern and Shareholder’s rights and information | • In the case of listed banks, there is ‘market oversight’ by the listing agency, which subjects them to post-listing disclosures. • The bank should have a stakeholder’s grievance committee • Presence of company secretary as a compliance officer • The committee shall look into the matters relating to investor complaints | • A company should have a stakeholder’s relationship committee to consider and resolve the grievances of the stakeholder’s holders of the company with a non-executive director as the chairman of the committee • A company should have a company secretary as the compliance officer • The company shall disclose the details on annual general meetings, mode of means of communication of information to the shareholders, changes in the board (appointments & resignations) of directors, listing details on the stock exchange, Details on the no. of investor’s complaints; dividend policy and details of interim and final dividend paid, if any; information on market price data of shares; procedure of share transfer and shareholding pattern, the proportion of dematerialised shares held, etc. in the annual report | • Company shall constitute stakeholder’s relationship committee with the non-executive director as chairperson • Company Secretary shall be the compliance officer • Removal or resignation or cessation of directors, and profiles of directors newly appointed or re-appointed directors shall be disclosed in the report • The company shall disclose the details of annual general meetings held during the year • The company shall provide the details in respect of shares held, shareholding pattern, etc., in the annual report | | Source: Authors’ elaboration from various legal and regulatory acts on corporate governance standards in India. |
Annexure-III | List of Banks | | Public Sector Banks | | 1 | Allahabad Bank | | 2 | Andhra Bank | | 3 | Bank of Baroda | | 4 | Bank of India | | 5 | Bank of Maharashtra | | 6 | Canara Bank | | 7 | Central Bank of India | | 8 | Corporation Bank | | 9 | Dena Bank | | 10 | IDBI Bank | | 11 | Indian Bank | | 12 | Indian Overseas Bank | | 13 | Oriental Bank of Commerce | | 14 | Punjab National Bank | | 15 | Punjab & Sind Bank | | 16 | State Bank of Jaipur & Bikaner | | 17 | State Bank of India | | 18 | State Bank of Mysore | | 19 | State Bank of Travancore | | 20 | Syndicate Bank | | 21 | UCO Bank | | 22 | Union Bank of India | | 23 | United Bank of India | | 24 | Vijaya Bank | | Private Banks | | 25 | Axis Bank | | 26 | Catholic Syrian Bank | | 27 | City Union Bank | | 28 | DCB Bank | | 29 | Dhan Laxmi Bank | | 30 | Federal Bank | | 31 | HDFC Bank | | 32 | ICICI Bank | | 33 | Indusind Bank | | 34 | Vysya Bank | | 35 | Jammu & Kashmir Bank | | 36 | Karnataka Bank | | 37 | Karur Vysya Bank | | 38 | Kotak Mahindra Bank | | 39 | Lakshmi Vilas Bank | | 40 | RBL Bank | | 41 | South Indian Bank | | 42 | Yes Bank |
Annexure-IV Indicators, Norms and Dimensions of Bank Soundness and Governance Indicators and Dimensions of Bank Soundness Tables IV.1 provides the list of indicators and dimensions used in the construction of the bank soundness index. Broadly, the study follows the framework of RBI (2010) in constructing the composite index of bank soundness. We use 14 ratio indicators that are combined to compute 5 dimensional indices, namely “capital adequacy”, “asset quality”, “profitability”, “liquidity”, and “management efficiency”, which are mutually distinct from each other. The asset quality dimension is based on two ratios- net non-performing loans to total advances and gross non-performing loans to total advances. Deterioration in asset quality increases credit risk and instability. The management efficiency indicates a situation where a bank with a low operating cost is expected to boost soundness, whereas capital adequacy and profitability capture bank buffers. The higher capital buffer ensures the bank’s ability to withstand the shocks, implying lower leverage and an improvement in soundness. Higher profitability is expected to improve bank soundness. The last dimension of liquidity reflects the bank’s capability to absorb liquidity risk. | Table IV.1: Summary Statistics of the Non-normalised Ratio Indicators of Bank Soundness - 2009-2018 | | Aspect | Ratio Indicators
(relation with soundness) | Normalisation Method | All Banks | PBs | PSBs | | Asset Quality* | Net non-performing assets to total advances (-) | Min-Max# | 1.979
(3.479) | 1.190
(1.195) | 3.513
(3.530) | | Gross non-performing assts to total advances (-) | Min-Max# | 4.204
(6.063) | 2.655
(1.995) | 6.248
(6.252) | | Management Efficiency* | Intermediation cost to total assets (-) | Min-Max# | 2.562
(2.117) | 2.223
(0.518) | 1.590
(0.252) | | Ratio of wage bill to total expense(-) | Min-Max# | 17.936
(9.867) | 13.869
(3.728) | 13.429
(2.924) | | Capital Adequacy* | Capital to risky asset ratio (CRAR) (+) | Max-Min | 27.301
(32.195) | 14.827
(2.798) | 12.182
(1.249) | | Tier I capital to Tier II capital (+) | Max-Min | 38.341
(82.418) | 11.549
(10.496) | 2.729
(1.032) | | Leverage ratio (Total assets to equity capital) (-) | Min-Max# | 0.187
(0.196) | 0.088
(0.027) | 0.055
(0.008) | | Profitability* | Non-interest income to total assets (+) | Max-Min | 1.809
(2.458) | 1.320
(0.481) | 0.937
(0.223) | | Return on Assets(+) | Max-Min | 0.983
(1.505) | 1.105
(0.625) | 0.383
(0.813) | | Return on Equity (+) | Max-Min | 7.469
(10.430) | 12.112
(7.378) | 6.783
(14.854) | | Net Interest Margin(+) | Max-Min | 2.974
(1.209) | 2.780
(0.586) | 2.230
(0.386) | | Liquidity* | Total demand deposits to total assets(+) | Max-Min | 8.038
(8.763) | 7.119
(3.948) | 5.525
(2.442) | | Liquid assets to total assets(+) | Max-Min | 11.523
(13.688) | 7.332
(3.639) | 6.837
(2.636) | | Demand and saving bank deposits to total deposits(+) | Max-Min | 32.384
(20.326) | 29.287
(9.920) | 31.226
(6.241) | Notes: i) All ratio indicators are winsorised at 10% to mitigate the effect of the outliers in the data series;
ii) ‘#’ indicates that min-max normalisation criterion is adopted for ratios that seem to have a negative polarity with bank soundness;
iii) ‘*’ indicates that each dimensional index is normalised at mean 100 and standard deviation 10 to account for zero and one values (see Vidoli and Fusco, 2018 for more details); and
iv) The reported values in last three columns are mean (standard deviation) of the ratio indicators for the period 2009-2018.
Source: Authors’ elaboration. | Norms and Dimensions of Bank Governance Table IV.2 provides a list of norms and dimensions used in the construction of the governance index. In particular, we adopted the self-structured framework of Gulati et al. (2020) to create the bank governance index. In order to represent the homogeneity in defining the 48 governance norms, we coded each governance norm as a dummy variable, with a value of ‘1’, signifying that a bank adheres to the governance regulation and ‘0’ otherwise. The percentage compliance by banks on individual norms in each dimension of governance for the years 2009 and 2018 is provided in the last two columns of the table. We find that of a total of 48 provisions under consideration, the sampled banks reportedly complied with twenty provisions in 2018, which shows improvement over that of compliance on only seven provisions in 2009. All banks include a separate corporate governance report as part of their annual report in 2018, which is an essential requirement, especially for listed banks. About 13.2 per cent of sampled banks in 2018 showed non-compliance with the norm of having at least one woman director on the board. Further, there was reportedly 100 per cent compliance in adherence to the norm on adopting a “whistle-blower policy” in 2018 when this norm was made mandatory from formerly being voluntary to comply. Overall, persistent and effective oversight by listing agencies and banking regulators, preventing penalties or strictures or restrictions for non-compliant business practices, have compelled banks in India to adhere to the governance regulations during the sampled years. One example which deserves mention in the present context of stringency in adherence to governance norms is the imposition of a penalty of INR 1,42,000 for the non-appointment of a woman director on the board by the Bank of Maharashtra during the financial year 2016-17. Although the level of governance compliance has reportedly improved over the years, shreds of evidence suggest that under compliance to bank governance norms is still prevalent in India. In 2018, about 40 per cent of the banks did not have non-busy outside directors on the board, only 44.74 per cent of banks held separate meetings of independent directors in the financial year, and appointed independent non-executive chairman for the audit committee. | Table IV.2: Norms, Dimensions, and Sub-dimensions of Corporate Governance Index | | Dimensions/ Indicators | Banks adhere to each norms of governance (%) | | 2009 | 2018 | | 1. Board effectiveness (Impact on CI_G: + ; Adjustment: Normalisation#) | | Size of board | 97.50 | 100.00 | | Proportion of non-executive directors | 97.50 | 97.37 | | Number of nominee directors | 100.00 | 100.00 | | Female director | 57.50 | 86.80 | | No busy executive directors | 77.50 | 81.58 | | No busy non-executive/ independent directors | 45.00 | 60.53 | | Number of board meetings | 100.00 | 100.00 | | Chairman of the board | 35.00 | 65.79 | | No CEO duality | 45.00 | 86.84 | | Number of board committee | 95.00 | 100.00 | | Proportion of independent directors | 80.00 | 52.63 | | Training to independent directors* | 30.00 | 81.58 | | Declaration by independent director** | - | 47.37 | | A separate meeting of independent directors** | - | 44.74 | | 2. Audit function (Impact on CI_G: + ; Adjustment: Normalisation#) | | Presence of Audit Committee | 100.00 | 100.00 | | Size of the audit committee | 100.00 | 100.00 | | Independence of audit committee | 42.50 | 36.84 | | Chairman of the audit committee | 47.50 | 44.74 | | Number of meetings held by the audit committee | 100.00 | 100.00 | | Auditor’s compliance certificate | 92.50 | 97.37 | | 3. Risk management (Impact on CI_G: + ; Adjustment: Normalisation#) | | Presence of the RMC | 92.5 | 97.37 | | Presence of a non-executive chair | 22.5 | 57.89 | | Size of the RMC | 92.5 | 100 | | Meetings of the RMC | 92.5 | 97.37 | | 4. Remuneration (Impact on CI_G: + ; Adjustment: Normalisation#) | | Presence of Remuneration Committee | 80.00 | 94.74 | | Remuneration to directors | 75.00 | 100.00 | | All non-executive directors | 80.00 | 55.26 | | 5. Shareholders’ rights and information (Impact on CI_G: + ; Adjustment: Normalisation#) | | Presence of stakeholder’s grievance committee | 97.50 | 100.00 | | Chairman of the stakeholder’s grievance committee | 92.50 | 94.74 | | Presence of a compliance officer | 67.50 | 92.11 | | No. of investors’ complaints | 92.50 | 89.47 | | Annual General Meeting | 90.00 | 100.00 | | Listing on the stock exchange | 95.00 | 97.37 | | Dividend policy | 97.50 | 39.47 | | Market Price Data | 95.00 | 97.37 | | Share transfer agent and system | 20.00 | 89.47 | | Shareholding pattern | 95.00 | 100.00 | | Dematerialised shares | 95.00 | 100.00 | | 6. Disclosure and transparency (Impact on CI_G: + ; Adjustment: Normalisation#) | | | | Related party transactions | 97.50 | 100.00 | | Certificate of Code of conduct by senior management | 72.50 | 100.00 | | Accounting treatment | 100.00 | 100.00 | | Whistleblower policy* | 57.50 | 100.00 | | Management discussion and analysis report | 95.00 | 94.74 | | New appointments on the board | 75.00 | 78.95 | | Resignation or cessation of directors | 100.00 | 100.00 | | CEO/CFO certification | 27.50 | 97.37 | | Details about penalties/ punishments imposed by regulators in the last three years | 97.50 | 100.00 | | Means of communication of information to shareholders | 95.00 | 100.00 | Notes: i) Interested readers are directed to refer Gulati et al. (2020) for a definition of the selected governance indicator, ii) * indicates voluntary provision under revised clause 49, 2009; ** indicates provision introduced as per new clause 49, 2015; *** indicates voluntary provision under new clause 49, 2015; and iii) # indicates that normalisation is done at mean 100 and standard deviation 10 to account for zero and one values of the dimensional index (see Vidoli and Fusco, 2018 for more details).
Source: Authors’ compilation from Gulati et al. (2020) and norms/standards set by RBI (2001, 2002, 2014), Ministry of Corporate Affairs (2013), and SEBI (2015, 2017). |
Annexure-V | Table V.1: Description of Variables | | Notation | Variable and Group | Description | | CI_Sj,t-1 | Bank soundness index | BoD-based bank soundness index | | CI_Gj,t-s | Governance index | BoD-based bank governance index | | BOARDj,t-s | kth dimensional index of governance where k=1,2,…,6 under the six-dimensional framework of governance for a bank | Board effectiveness | | AUDITj,t-s | Audit Function | | RISKj,t-s | Risk Management Function | | REMUNERATIONj,t-s | Remuneration | | SHAREHOLDERj,t-s | Shareholders’ Rights and Information | | DISCLOSUREj,t-s | Disclosure and Transparency | | PROFEFFj,t-s | Risk-adjusted alternative profit efficiency | Risk-adjusted profit efficiency score | | FORBRANCHj,t-s | Bank-specific control variables | Bank’s international branches | | SIZEj,t-s | Natural logarithm of total assets of the bank | | OWNSHAREj,t-s | Ownership shareholdings of a bank with the government in percent | | CRISISt | Dummy variables and its interaction | Dummy for local banking crisis taking value 1 for the period from 2013-2017, and 0 otherwise | | DREFORMj,t-s | Dummy for new governance regulatory reforms taking value 1 for the period 2014-2018, and 0 otherwise | | CRISIS×PUBLICj,t-s | Joint effect of the local banking crisis and being a PSB | | DREFORM×OWNSHAREj,t-s | Joint effect of the DREFORM and ownership shareholding | | CRISIS×OWNSHAREj,t-s | Joint effect of local banking crisis and ownership shareholding | | PUBLICj,t-s | Dummy taking value 1 for PSBs | | DREFORM×PUBLICj,t-s | Joint effect of regulatory reforms and being PSB | | BOARDSIZEj,t-s | Selected governance norm corresponding to the dimensional index of BOARD | Total no. of directors in the boardroom | | BINDPj,t-s | Proportion of independent non-executive (outside) directors to the total board size | | BMEETj,t-s | Total no. of board meetings conducted | | CEODj,t-s | A dummy variable that takes the value 1 if the same person holds two positions of chairperson and CEO, and 0 otherwise | | BCOMMj,t-s | Total no. of board-level committees | | WOMENPj,t-s | The proportion of female directors to the total no. of directors in the boardroom | | AUDITSIZEj,t-s | Selected governance norm corresponding to the dimensional index of AUDIT | Total no. of directors on the audit committee | | AUDITINDPj,t-s | Proportion of independent non-executive (outside) directors on the audit committee | | AUDITMEETj,t-s | Total no. of meetings conducted by the audit committee | | AUDITCOMPj,t-s | Dummy taking value 1 if an auditor compliance certificate is disclosed as a part of corporate governance report | | RISKSIZEj,t-s | Selected governance norm corresponding to the dimensional index of RISK | Total no. of directors on the risk committee | | RISKNEXj,t-s | Dummy taking the value of 1 if the chairman of risk committee is a non-executive director | | RISKMEETj,t-s | Total no. of meetings conducted by the risk committee | | REMCOMMj,t-s | Selected governance norm corresponding to the dimensional index of REMUNERATION | Dummy taking the value of 1 if board constitute remuneration committee | | REMMEETj,t-s | Total no. of meetings conducted by the remuneration committee | | Ln(EXREM) j,t-s | Natural logarithm of the sum of cash remuneration to executives | | Source: Authors’ elaboration. |
| Table V.2: Panel Stationary Test for Key Bank Governance, Soundness and Efficiency Variables | | Variables↓ | Fisher-type-Phillips and Perron test | | H0: There is a unit root | | Intercept | Intercept & Trend | | CI_Sj,t | 80.514 | 123.904*** | | CI_Gj,t | 108.216** | 147.046*** | | BOARDj,t | 102.58* | 83.51* | | AUDITj,t | 59.42* | 106.39*** | | RISKj,t | 63.93** | 65.10** | | REMUNERATIONj,t | 129.82*** | 84.35*** | | SHAREHOLDERj,t | 108.00*** | 125.47*** | | DISCLOSUREj,t | 102.665*** | 115.68*** | | PROFEFFj,t | 188.92*** | 191.01*** | Note: *, **, and *** indicates significance at 10%, 5% and 1% levels, respectively.
Source: Authors’ elaboration. |
Annexure-VI Testing for the Significance of the differences in Governance, Efficiency, and Soundness across distinct Bank Groups Sub-sections 6.1.1, 6.2.1 and 6.3.1 previously offered a lucid discussion on the levels of governance compliance, soundness, and profit efficiency in public and private banking groups in the Indian banking industry. In what follows here, we extend the analysis to investigate the sub-periods differences in distributions of governance, efficiency and soundness levels across i) generational private banks categorised based on new and old generation, and ii) the banks of distinct size classes defined on the basis of total assets. We again applied the SZL test and reported the relevant test statistics in Table VI.1. The test statistics confirm significant differences in regulatory adherence to governance norms and soundness levels across new private and old private banks. We note that new private banks fared better regarding bank governance and soundness in India. However, the observed profit efficiency differences are not statistically significant between new and old private banks. In addition, we cannot safely conclude that large banks are better governed (or more stable) than small banks since we find no statistically significant differences in distributions of governance and soundness indices across large and small banks. However, efficiency differences in banks across distinct size classes hold in the distinct sub-periods. In particular, we find that small banks are more profit efficient than large banks. | Table VI.1: SZL Test across distinct Bank Groups | | Bank Groups↓ | Variables↓ | H0 : pdf (G12008/09-2017/18) =
pdf (G22008/09-2017/18) | H0 : pdf (G12008/09-2012/13) =
pdf (G22008/09-2012/13) | H0 : pdf (G12013/14-2017/18) =
pdf (G22013/14-2017/18) | | Public vs Private | CI_G | 17.303(0.000)*** | 4.794(0.002)*** | 19.298(0.000)*** | | CI_S | 10.535 (0.000)*** | 8.949 (0.000)*** | 25.079 (0.000)*** | | PROEFF | 10.171(0.003)*** | 3.107(0.052)* | 4.692(0.000)*** | | New private vs Old private | CI_G | 4.897(0.047)** | 3.561(0.003)*** | 2.055(0.002)*** | | CI_S | 7.025(0.000)*** | 0.566(0.342) | 8.200(0.000)*** | | PROFEFF | 2.968(0.733) | -0.131(0.582) | -0.289(0.41) | | Large vs Small banks | CI_G | -0.393(0.224) | -0.443(0.261) | -0.355(0.642) | | CI_S | 0.618(0.31) | 1.180(0.141) | 0.203(0.244) | | PROFEFF | 40.350(0.077)* | 15.396(0.071)* | 9.881(0.077)* | Note: i) G1 and G2 indicate first versus second bank groups; ii) banks that came into existence after 1993 are new generation banks, and banks with mean total assets in the t-th year falls in the category of large banks; and iii) *, **, & *** indicates significance at 10%, 5% & 1% levels, respectively.
Source: Authors’ calculations. |
Annexure-VII Results of mean unconditional regressions | Table VII.1: Coefficients of the Reform Effect | | CI_S | D1 | D2 | D3 | D4 | D5 | | All Banks | -0.0115***
(0.0022) | -0.0168***
(0.0025) | -0.0193***
(0.0027) | -0.0194***
(0.0027) | -0.0204***
(0.0030) | | PSBs | -0.0187***
(0.0019) | -0.0240***
(0.0018) | -0.0282***
(0.0017) | -0.0293***
(0.0015) | -0.0317***
(0.0018) | | PBs | -0.0019
(0.0036) | -0.0072
(0.0045) | -0.0074
(0.0045) | -0.0061
(0.0044) | -0.0054
(0.0046) | Note: *, **, and *** indicates significance at 10%, 5% and 1% levels, respectively.
Source: Authors’ calculations. |
Abbreviations | AFC | Asian Financial Crisis | | AQR | Asset Quality Review | | BCBS | Basel Committee on Banking Supervision | | BBB | Banks Board Bureau | | BoD | Benefit-of-the-doubt | | BSE | Bombay Stock Exchange | | CBI | Central Bureau of Investigation | | CBS | Core Banking System | | CEO | Chief Executive Officer | | CA | Companies Act | | CI_S | Composite Index of Bank Soundness | | CI_G | Composite Index of Bank Governance | | DEA | Data Envelopment Analysis | | FSB | Financial Stability Board | | GFC | Global Financial Crisis | | GMM | Generalised Methods of Moments | | GoI | Government of India | | GDP | Gross Domestic Product | | LLP | Loan-Loss Provisions | | LODR | Listing Obligation and Disclosure Requirements | | LoU | Letter of Understanding | | MD | Managing Director | | NPA | Non-Performing Assets | | NSE | National Stock Exchange | | OECD | Organisation for Economic Co-operation and Development | | PSB | Public Sector Bank | | PB | Private Bank | | PCA | Principal Component Analysis | | RoA | Return on Assets | | RBI | Reserve Bank of India | | RBS | Royal Bank of Scotland | | SEBI | Securities and Exchange Board of India | | SBI | State Bank of India | | SRC | Stakeholders’ Relationship Committee | | SZL | Simar-Zelenyuk-adapted-Li | | VAR | Vector Auto-Regression |
|