1. Introduction 2.1 As brought out in Chapter I, analysis of the fiscal situation of local bodies is constrained by the non-availability of consolidated data. This chapter endeavours to redress this imbalance in respect of municipal corporations (MCs) across all States for the years 2017-18 (actuals), 2018-19 (revised estimates) and 2019-20 (budget estimates). The rest of this chapter is structured into three sections. Section 2 examines fiscal outcomes for the period of reference. Section 3 deals with financing of MCs. Section 4 summarises the findings. A historical overview of the evolution of municipal finances is given in the Annex. 2. The State of Municipal Finances Municipal Receipts 2.2 Based on our sample1, the revenue receipts of MCs - consisting of own tax revenue, own non-tax revenue and transfers - are estimated at 0.61 per cent of GDP in 2017-18 and were budgeted to increase to 0.72 per cent of GDP in 2019-20 (Table II.1).2 2.3 Own tax revenue, comprising property tax, water tax, toll tax and other local taxes, accounted for 31-34 per cent of total revenue during the period under study. Large variations are observed, with MCs in Delhi, Gujarat, Maharashtra, Chandigarh, and Chhattisgarh collecting higher taxes relative to others (Chart II.1). | Table II.1: Revenue Receipts | | (Per cent of GDP) | | | 2017-18
(A) | 2018-19
(RE) | 2019-20
(BE) | | Revenue Receipts | 0.61 | 0.67 | 0.72 | | Own Tax Revenue | 0.21 | 0.21 | 0.22 | | Of which: Property Tax | 0.09 | 0.10 | 0.11 | | Own Non-Tax Revenue | 0.18 | 0.19 | 0.23 | | Transfer | 0.21 | 0.26 | 0.26 | A: Accounts; RE: Revised Estimates; BE: Budget Estimates
Source: Municipal Corporations. | 2.4 Property tax has gained prominence among the own tax revenue sources as taxes such as octroi/local body tax were subsumed in the Goods and Services Tax (GST)3. There is, however, a wide variation in the collection of property tax across MCs (Chart II.2).
2.5 Despite its dominance over other municipal taxes, property tax collection in India is much lower compared to the OECD countries due to several factors, viz., property undervaluation, incomplete registers, policy inadequacy and ineffective administration (Awasthi and Nagarajan, 2020). Moreover, the collection system is marred by challenges of pending litigations and inadequate staffing pattern in MCs (Mankikar, 2018). Thus, there is a need for large-scale reform of property taxation practices in India (Box II.1). 2.6 Non-tax revenue, which accounted for around 30 per cent of total revenue receipts of MCs, is dominated by fees and user charges followed by income from investment, mainly in the form of interest earned and dividends, rental income from municipal properties, and sale and hire charges (Table II.2). 2.7 Transfers from Central and State governments also account for a sizeable portion of the revenue receipts of the MCs (Table II.3). Transfers from the State governments in the form of assigned revenues, compensation, State Finance Commission grants and other State government grants constitute the dominant component with a share of 30-35 per cent of revenue receipts. Transfers from the Central government, on the other hand, account for less than 5 per cent. Box II.1:
Scope and Opportunities for Property Taxes in India Property tax, which accounts for around half of the total tax collections of MCs, amounts to less than 0.5 per cent of GDP with significant inter-state variations (Chart 1a). Many of the larger cities, however, were able to increase property tax collections over 2017-20 (Chart 1b). Poor enforcement mechanisms, coupled with multiple outdated exemptions, dated property rolls and databases, sub-optimal tax rates, property undervaluation and weak tax administration have resulted in significant under-recoveries in the majority of the Indian cities (Awasthi and Nagarajan, 2020). While the level of urbanisation and the urban population density bear a positive correlation with the amount of property tax mobilised, there are several corporations which have been able to generate relatively higher revenue at much lower levels of urbanisation (Chart 1c). The potential of property tax needs to be fully leveraged by extending coverage, regular revision of tax rates, improving the assessment system and raising efficiency in tax administration. For the smaller MCs, lack of institutional capacity to undertake these reforms constitute the main challenge and assistance from the State governments in this regard may be helpful. For the larger corporations, it is vital that the expansion of tax base and increase in efficiency of tax collection are achieved through the use of technologies such as satellite photography and geo-coding of data. References: Awasthi, R. and Nagarajan, M. (2020). “Property Taxation in India: Issues Impacting Revenue Performance and Suggestions for Reform”. Governance Global Practice, Discussion Paper No. 5, World Bank Group. |
| Table II.2: MCs' Non-Tax Revenue | | (Per cent of GDP) | | | 2017-18
(A) | 2018-19
(RE) | 2019-20
(BE) | | Own Non-Tax Revenue | 0.18 | 0.19 | 0.23 | | 1. Rental Income from Municipal Properties | 0.01 | 0.02 | 0.03 | | 2. Fees and User Charges | 0.11 | 0.10 | 0.12 | | 3. Sale and Hire Charges | 0.00 | 0.00 | 0.01 | | 4. Income from Investment | 0.03 | 0.03 | 0.03 | | 5. Other Income | 0.03 | 0.03 | 0.04 | Note: A: Accounts; RE: Revised Estimates; BE: Budget Estimates
Source: Municipal Corporations. | Municipal Expenditure 2.8 Municipal expenditure declined between 2012-13 and 2017-18 while the share of revenue expenditure to total expenditure remained constant (Ahluwalia et. al., 2019). The share of revenue expenditure, however, declined steadily from 70 per cent of total expenditure in 2017-18 to 58 per cent in 2019-20 (BE) (Table II.4). | Table II.3: Municipal Corporations' Finances - Key Ratios for 2017-2020 | | (Per cent) | | | 2017-18
(A) | 2018-19
(RE) | 2019-20
(BE) | | Ratio of Own Revenue to Total Revenue Receipts | 64.5 | 60.5 | 64.0 | | Ratio of Own Tax Revenue to Total Revenue Receipts | 34.0 | 31.3 | 31.0 | | Ratio of Property Tax Collection to Total Revenue Receipts | 14.0 | 15.4 | 15.5 | | Ratio of States’ Transfer to Total Revenue Receipts | 31.2 | 34.7 | 32.0 | | Ratio of Central Government's Transfer to Total Revenue Receipts | 3.6 | 4.4 | 3.7 | | Ratio of Combined (Centre plus States) Transfer to Total Revenue Receipts | 34.8 | 39.1 | 35.7 | A: Accounts; RE: Revised Estimates; BE: Budget Estimates.
Note: Please see footnote 2.
Sources: Municipal Corporations; and RBI staff estimates. |
| Table II.4: Expenditure of Municipal Corporations | | (Per cent of GDP) | | | 2017-18
(A) | 2018-19
(RE) | 2019-20
(BE) | | Total Expenditure (I+II) | 0.68 | 0.90 | 1.05 | | I Revenue Expenditure (A to G) | 0.48 | 0.58 | 0.61 | | A Establishment Expenses | 0.25 | 0.28 | 0.29 | | Of which: | | | | | (i) Salary, Wages and Bonus | 0.17 | 0.20 | 0.20 | | (ii) Pension | 0.05 | 0.05 | 0.05 | | B Administrative Expenses | 0.03 | 0.04 | 0.04 | | C Operational & Maintenance Expenses | 0.11 | 0.14 | 0.15 | | D Interest and Finance Charges | 0.01 | 0.01 | 0.01 | | E Programme Expenses | 0.01 | 0.01 | 0.01 | | F Revenue Grants, Contributions and Subsidies | 0.03 | 0.04 | 0.05 | | G Miscellaneous Expenses | 0.06 | 0.07 | 0.06 | | II Capital Expenditure | 0.20 | 0.32 | 0.44 | A: Accounts; RE: Revised Estimates; BE: Budget Estimates.
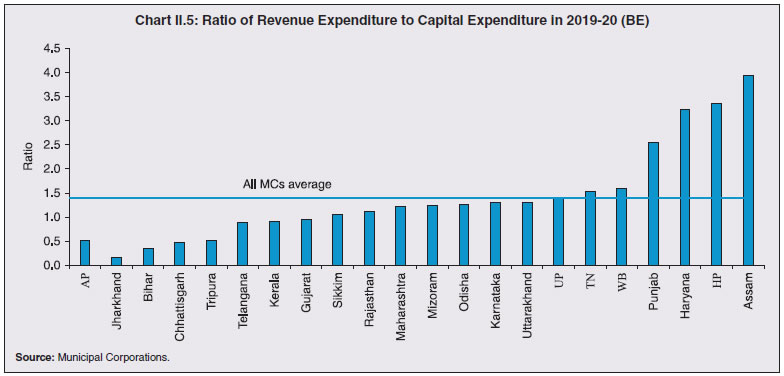
Source: Municipal Corporations. | 2.9 Establishment expense consisting of salaries, wages and pensions was the largest component of revenue expenditure, followed by operational and maintenance expenses, which are directed towards general services and maintenance of capital assets. Committed expenditure comprising establishment expenses, administrative expenses and interest and finance charges was estimated at 0.32 per cent of GDP during 2017-20. 2.10 Establishment and operational and maintenance expenses have been on the rise with wide variations, while interest and finance charges remained unchanged (Chart II.3). 2.11 The share of MCs’ capital expenditure increased sharply from around 30 per cent of total expenditure (0.20 per cent of GDP) in 2017-18 to 42 per cent in 2019-20 (0.44 per cent of GDP), with large inter-state variations (Chart II.4). 2.12 The ratio of revenue expenditure to capital expenditure of MCs was at 2.4 as against 7.1 for the Centre and 5.9 for the States in 2017-18 (Chart II.5). Various factors, viz., size of the MC, population density, transfer dependency and nature of expenditure of the parent State government have impacted the quality of expenditure of municipal corporations in India (Box II.2). Box II.2:
Determinants of Expenditure Quality of Municipal Corporations India has the second largest urban population in the world after China, and it is projected to add another 416 million urban dwellers between 2018 and 2050 (UN, 2018). By the Government of India’s Municipal Performance Index, Indore emerged as the highest-ranked municipal corporation in 2020, followed by Surat and Bhopal (GoI, 2021). The New Delhi Municipal Council has emerged as the leader in the less than million population category, followed by Tirupati and Gandhinagar. Efficiency and quality of expenditure were important performance parameters. Three key indicators of expenditure quality - ratios of capital outlay4 to total expenditure (COTE); revenue expenditure to total expenditure (RETE); and revenue expenditure to capital outlay (RECO) - have been used for analysing the determinants of expenditure quality of the MCs. Lower RECO and RETE and higher COTE imply improvement of expenditure quality and vice versa. MC level fixed effect regressions with State-level clustering, controlling for relative MC size (total expenditure of MC as a per cent of total expenditure of the respective State), transfer dependency (share of transfers in total revenue receipt of MC), State expenditure quality (respective State’s COTE, RETE, and RECO), and district population density, were estimated using the following model:  In equation (1), i stands for individual MC, d stands for corresponding district, s stands for corresponding State and t stands for year. The estimation results suggest that quality of expenditure improves with higher transfer dependency (Model 1 and Model 2) (Table 1). In addition, municipal expenditure quality also improves with the increase in relative financial size of the MC and the State’s expenditure quality (Model 3). On the other hand, high population density of district has an adverse impact on expenditure quality in all the three models. | Table 1: Fixed-Effect Results | | | Model 1 | Model 2 | Model 3 | | Dependent Variable | COTE | RETE | RECO | | MC Size | 1.34
(1.10) | -1.36
(-1.05) | -2.81**
(-2.39) | | Transfer Dependency | 1.06**
(2.44) | -0.79*
(-1.72) | -0.49
(-1.15) | | State COTE | -0.28
(-0.93) | | | | State RETE | | -0.09
(-0.49) | | | State RECO | | | 0.61**
(2.25) | | District Population Density | -0.06*
(-1.73) | 0.08**
(2.08) | 0.08**
(2.50) | | Constant | 36.64***
(8.54) | 65.69***
(4.40) | 3.23
(1.42) | | MC Fixed Effect | Yes | Yes | Yes | | State-level Clustering | Yes | Yes | Yes | | Observations | 609 | 609 | 589 | | Adjusted R-squared | 0.31 | 0.34 | 0.26 | | Note: t statistics in parentheses; * p<0.05, ** p<0.01, *** p<0.001. | References: GoI (2021). “Municipal Performance Index: Assessment Framework, 2019”. Ministry of Housing and Urban Affairs. UN (2018). “World Urbanization Prospects 2018”. |
 3. Borrowings 2.13 The level of gross municipal borrowings in India is minuscule and constitutes less than 0.05 per cent of GDP cumulatively for all MCs. There is, however, perceptible inter-State variation in municipal borrowings (Chart II.6a). As a proportion to total receipts of MCs, borrowings account for only around 6 per cent, though MCs in Telangana, Bihar and Kerala report relatively higher shares (Chart II.6b). The bulk of the borrowings are raised by a few large metropolitan corporations. For example, Greater Hyderabad Municipal Corporation alone accounts for more than 90 per cent of the total municipal borrowings in the State of Telangana. Per capita gross borrowing is the highest for Telangana, followed by Bihar and Maharashtra (Chart II.6c). 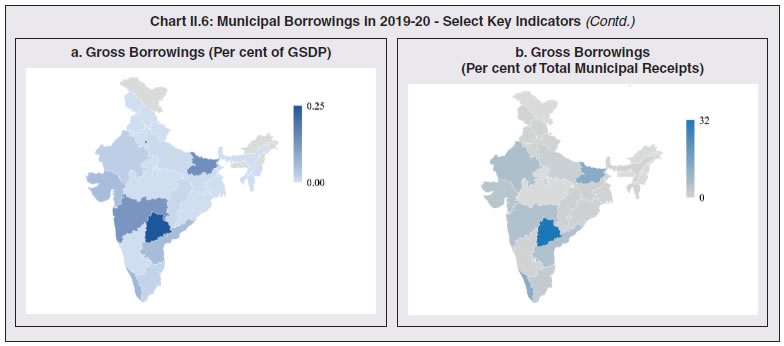
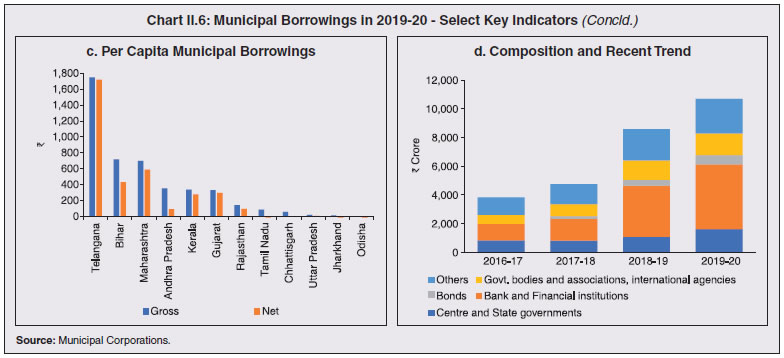 2.14 Composition-wise, borrowings from banks and financial institutions, and loans from Centre/State governments account for more than half of the total loans raised by MCs (Chart II.6d). Funds raised from capital markets through bond issuances at less than a tenth of the total borrowings remain an underutilised source of financing. 4. Conclusion 2.15 The analysis of municipal finances for the period 2017-18 to 2019-20 reveals certain noteworthy features. To start with, the combined budget size of the MCs in India is found to be much smaller than that of the Central and State governments. Second, despite getting constitutional recognition in 1992, there was no distinct rise in overall municipal revenue in India which remained broadly unchanged from 1946-47. Third, the composition of municipal revenue in India has changed considerably over time, with increased reliance on transfers. Fourth, despite lesser financial autonomy, the ratio of revenue expenditure to capital expenditure is lower than the Centre and the States. The higher share of capital expenditure of the MCs is largely on account of Central and State grants. Fifth, the overall borrowing by the MCs is miniscule and their market borrowings through bond issuances is negligible, dominated by a few large MCs. Going forward, property tax reform and development of a vibrant municipal bond market may provide a boost to the municipal finances in India. Annex
Evolution of Municipal Finances: A Historical Perspective The presence of municipal governments can be traced back to ancient India, but the first municipal government in the sense it is perceived today was established in the town of Madras during the rule of the East India Company (Tinker, 1951). In 1687, the Court of Directors was formed, and the power of local tax collection was delegated to it by King James II (Report of the Local Finance Enquiry, 1951). The beginning of a formal system of local finance can be found in Lord Mayo’s Resolution of 1870: “Local interest, supervision, and care are necessary to success in the management of funds devoted to education, sanitation, medical relief, and local public works. The operation of this Resolution in its full meaning and integrity will afford opportunities for the development of self-government, for strengthening municipal institutions, and for association of Natives and Europeans to a greater extent than heretofore in the administration of affairs.” At the time of independence, the total income of 807 urban local bodies (ULBs) stood at ₹43.09 crore, out of which the share of taxation was around 57 per cent (Table 1). The total municipal revenue amounted to 0.51 per cent of the national income of India in 1946-47, of which own tax revenue was 0.29 per cent (of national income). In terms of composition, octroi constituted the most prominent source of tax revenue, followed by taxes on houses and lands. The Zakaria Committee on ‘Augmentation of Financial Resources of Urban Local Bodies’, which submitted its report in 1963, made the following remark: “It is a matter of historical fact that over a long period of years, the cost of Local Government has continued to rise and the ability of Local Government to meet this cost within the resources at its disposal, has continued to diminish. It will be unrealistic to look forward either to a reduction of Local Government expenditure or to a readiness to put a greater proportion of this expenditure upon property taxes and other existing sources of revenue. What we have to conceive, therefore, is a better way of distributing the financial burden which will have to be met in any case and the system of Local Finance has to become an integral part of the system of National Finance.” As per the Zakaria Committee Report (1963)5, revenue from taxes in 1960-61 constituted around 72 per cent of the total revenue of the MCs (Table 2). Property tax emerged as one of the major sources of tax revenue of the MCs, followed by the tax on services and octroi. | Table 1: Number, Population and Total Income of Urban Local Bodies in 1946-47 | | ULB | Number | Population
(crore) | Total Income from all Sources
(₹ crore) | Income from Taxation | Amount
(₹ crore) | Percentage of Total Income | | 1 City Municipal Corporations | 3 | 0.48 | 12.35 | 8.92 | 72.24 | | 2 Municipalities | 628 | 2.19 | 15.18 | 10.41 | 68.56 | | 3 District Boards | 176 | 20.45 | 15.55 | 5.22 | 33.58 | | Total | 807 | 23.13 | 43.09 | 24.56 | 56.99 | | Source: Report of the Local Finance Enquiry (Wattal, 1951). |
| Table 2: Income of ULBs in 1960-61 | | (₹ Crore) | | Nature of Revenue | Municipal Corporations | Municipalities | Notified/ Town Area Committees | Total (all Urban Local Bodies) | State Governments | | 1 Tax Revenues | 40.02 | 38.31 | 1.07 | 79.39 | 627.48 | | | (72.7) | (60.9) | (51.9) | (66.0) | (71.7) | | 2 Non-tax Revenues Excluding Grants-in-aid | 9.08 | 15.03 | 0.50 | 24.61 | 265.40 | | | (16.4) | (23.9) | (24.3) | (20.5) | (26.2) | | 3 Grants-in-aid | 6.17 | 9.55 | 0.49 | 16.20 | 121.62 | | | (10.9) | (15.2) | (23.8) | (13.5) | (12.1) | | 4 Total Ordinary Income 4 = (1+2+3) | 55.26 | 62.88 | 2.06 | 120.20 | 1011.81 | | | (100.0) | (100.0) | (100.0) | (100.0) | (100.0) | Note: Figures in parenthesis indicate per cent of total income.
Source: Report of the Local Finance Enquiry (Wattal, 1951). | The composition of municipal revenue in India has changed considerably over time with increased reliance on transfers. The share of own sources of revenue of the MCs came down from 89.1 per cent of the total revenues in 1960-61 to around 65 per cent in 2012-13. The share of own sources of revenues of municipalities also declined sharply (Table 3). During the entire period, most MCs generated revenue surpluses and the overall resource gaps were not significant. MCs’ spending, however, was lower than that required for providing a minimum level of civic amenities. The apparent contradiction of sound fiscal health and a high level of under-spending was due to statutory obligations. ULBs are generally bound to restrict their expenditure to the resources available and are not granted liberal permission by the respective State governments to incur debt (Mohanty et al., 2007). | Table 3: Municipal Revenues by Categories (1960-61, 2007-08 and 2012-13) | | (Per cent) | | | | Municipal Corporations | Municipalities | | 1960-61 | 2007-08 | 2012-13 | 1960-61 | 2007-08 | 2012-13 | | A. Own Sources | Total Taxes | 72.7 | 45.5 | 40.9 | 60.9 | 18.6 | 14.7 | | | Non-taxes | 16.4 | 22.2 | 23.9 | 23.9 | 9.3 | 10.5 | | | Total Own Sources | 89.1 | 67.6 | 64.8 | 84.8 | 27.9 | 25.2 | | B. Other Sources | GoI Transfers | | 7.0 | 4.6 | | 8.4 | 7.3 | | | Central Finance Commission Transfers | | 0.8 | 2.1 | | 5.3 | 8.8 | | | State Assignment/Devolution | | 11.4 | 12.6 | | 31.2 | 29 | | | State Grant-in-aid | 10.9 | 10.4 | 12.2 | 15.2 | 24.2 | 23.8 | | | Others | | 2.7 | 3.8 | | 3.0 | 5.8 | | | Total Other Sources | | 32.4 | 35.2 | | 72.1 | 74.8 | | C. Total (A+B) | | 100.0 | 100.0 | 100.0 | 100.0 | 100.0 | 100.0 | | Sources: Zakaria Committee Report (1963) and Mohanty (2016). | |
|