Today, the Reserve Bank released the results of its Consumer Confidence Survey (CCS)1 for the November 2022 round. The survey obtains current perceptions (vis-à-vis a year ago) and one year ahead expectations on general economic situation, employment scenario, overall price situation and own income and spending across 19 major cities. The latest round of the survey was conducted during November 02 to 11, 2022, covering 6,089 responses. Highlights: -
Consumer confidence for the current period has continued on its recovery path after the second wave of the COVID-19 pandemic, though it remained in the pessimistic zone; the current situation index (CSI)2 improved further on account of better perceptions on general economic situation, employment and household income (Chart 1 and Tables 1, 2 and 5). -
One year ahead outlook, as measured by the future expectations index (FEI), also improved, after remaining steady in the previous three survey rounds (Chart 1). -
Households displayed lower pessimism on the prevailing employment conditions vis-à-vis the previous survey round; they were more optimistic on employment outlook (Table 2). -
The current sentiment on overall spending remained close to its level in the previous survey round, though year-ahead outlook improved marginally (Tables 6). -
The outlook on discretionary spending moved to positive terrain for the first time since the onset of the pandemic (Table 8). 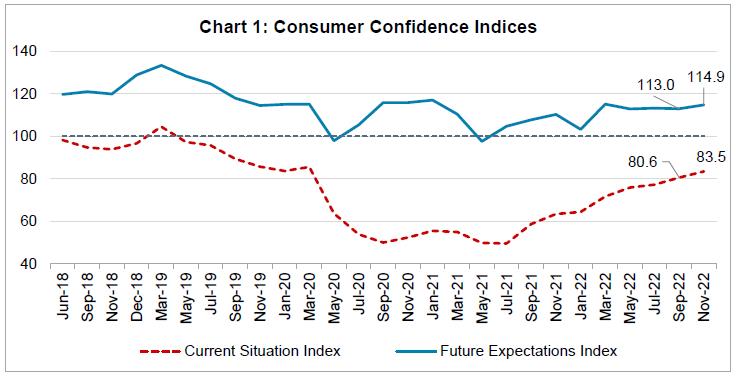 Note: Please see the excel file for time series data.3
| Table 1: Perceptions and Expectations on the General Economic Situation | | (Percentage responses) | | Survey Round | Current Perception | One year ahead Expectation | | Improved | Remained Same | Worsened | Net Response | Will Improve | Will Remain Same | Will Worsen | Net Response | | Nov-21 | 17.4 | 12.6 | 70.1 | -52.7 | 44.6 | 17.3 | 38.1 | 6.4 | | Jan-22 | 17.8 | 15.6 | 66.7 | -48.9 | 40.8 | 16.7 | 42.5 | -1.7 | | Mar-22 | 21.7 | 16.2 | 62.2 | -40.5 | 49.2 | 15.2 | 35.7 | 13.5 | | May-22 | 22.5 | 14.9 | 62.7 | -40.2 | 45.4 | 15.3 | 39.4 | 6.0 | | Jul-22 | 21.6 | 15.4 | 63.0 | -41.5 | 46.4 | 14.9 | 38.8 | 7.6 | | Sep-22 | 26.2 | 14.6 | 59.2 | -33.0 | 46.5 | 15.4 | 38.1 | 8.4 | | Nov-22 | 28.0 | 16.3 | 55.7 | -27.8 | 48.0 | 15.6 | 36.4 | 11.6 |
| Table 2: Perceptions and Expectations on Employment | | (Percentage responses) | | Survey Round | Current Perception | One year ahead Expectation | | Improved | Remained Same | Worsened | Net Response | Will Improve | Will Remain Same | Will Worsen | Net Response | | Nov-21 | 19.6 | 16.5 | 64.0 | -44.4 | 48.9 | 18.1 | 33.0 | 16.0 | | Jan-22 | 17.4 | 17.2 | 65.4 | -48.0 | 41.4 | 19.3 | 39.3 | 2.2 | | Mar-22 | 23.6 | 17.0 | 59.5 | -35.9 | 52.9 | 17.0 | 30.2 | 22.7 | | May-22 | 27.3 | 17.8 | 54.9 | -27.6 | 51.3 | 16.7 | 32.1 | 19.2 | | Jul-22 | 28.1 | 17.3 | 54.6 | -26.5 | 50.7 | 17.2 | 32.0 | 18.7 | | Sep-22 | 28.4 | 17.6 | 54.0 | -25.7 | 49.4 | 17.3 | 33.3 | 16.1 | | Nov-22 | 31.8 | 18.6 | 49.6 | -17.8 | 51.5 | 18.3 | 30.3 | 21.2 |
| Table 3: Perceptions and Expectations on Price Level | | (Percentage responses) | | Survey Round | Current Perception | One year ahead Expectation | | Increased | Remained Same | Decreased | Net Response | Will Increase | Will Remain Same | Will Decrease | Net Response | | Nov-21 | 95.1 | 3.9 | 1.0 | -94.2 | 76.6 | 12.6 | 10.9 | -65.7 | | Jan-22 | 93.4 | 5.4 | 1.2 | -92.3 | 78.1 | 12.4 | 9.5 | -68.6 | | Mar-22 | 93.3 | 5.6 | 1.2 | -92.1 | 79.1 | 10.4 | 10.5 | -68.6 | | May-22 | 95.4 | 4.1 | 0.5 | -94.9 | 80.0 | 11.1 | 8.9 | -71.1 | | Jul-22 | 95.2 | 4.0 | 0.9 | -94.3 | 80.4 | 10.9 | 8.8 | -71.6 | | Sep-22 | 94.6 | 4.3 | 1.1 | -93.6 | 79.9 | 11.0 | 9.1 | -70.8 | | Nov-22 | 94.9 | 4.1 | 1.0 | -93.9 | 82.2 | 9.3 | 8.6 | -73.6 |
| Table 4: Perceptions and Expectations on Rate of Change in Price Level (Inflation)* | | (Percentage responses) | | Survey Round | Current Perception | One year ahead Expectation | | Increased | Remained Same | Decreased | Net Response | Will Increase | Will Remain Same | Will Decrease | Net Response | | Nov-21 | 90.6 | 7.1 | 2.3 | -88.4 | 82.4 | 13.2 | 4.4 | -78.0 | | Jan-22 | 88.1 | 8.7 | 3.2 | -84.9 | 81.7 | 13.5 | 4.7 | -77.0 | | Mar-22 | 88.5 | 9.3 | 2.2 | -86.2 | 83.9 | 12.4 | 3.7 | -80.2 | | May-22 | 91.3 | 7.0 | 1.7 | -89.7 | 81.7 | 14.2 | 4.1 | -77.6 | | Jul-22 | 88.5 | 8.9 | 2.6 | -85.9 | 81.8 | 13.6 | 4.6 | -77.3 | | Sep-22 | 89.6 | 7.8 | 2.6 | -87.0 | 80.6 | 14.5 | 4.9 | -75.7 | | Nov-22 | 87.5 | 9.2 | 3.3 | -84.2 | 82.9 | 13.2 | 3.9 | -79.1 | | *Applicable only for those respondents who felt price has increased/price will increase. |
| Table 5: Perceptions and Expectations on Income | | (Percentage responses) | | Survey Round | Current Perception | One year ahead Expectation | | Increased | Remained Same | Decreased | Net Response | Will Increase | Will Remain Same | Will Decrease | Net Response | | Nov-21 | 13.0 | 36.0 | 51.0 | -38.1 | 47.9 | 40.8 | 11.3 | 36.6 | | Jan-22 | 12.3 | 38.0 | 49.7 | -37.4 | 43.2 | 42.5 | 14.3 | 29.0 | | Mar-22 | 16.0 | 42.1 | 42.0 | -26.0 | 52.9 | 38.5 | 8.6 | 44.3 | | May-22 | 17.6 | 46.0 | 36.4 | -18.9 | 52.4 | 39.2 | 8.4 | 44.0 | | Jul-22 | 18.2 | 46.0 | 35.9 | -17.7 | 51.6 | 40.0 | 8.4 | 43.3 | | Sep-22 | 20.2 | 45.5 | 34.4 | -14.2 | 51.3 | 39.8 | 8.9 | 42.4 | | Nov-22 | 20.9 | 46.1 | 32.9 | -12.0 | 52.5 | 39.9 | 7.6 | 44.9 |
| Table 6: Perceptions and Expectations on Spending | | (Percentage responses) | | Survey Round | Current Perception | One year ahead Expectation | | Increased | Remained Same | Decreased | Net Response | Will Increase | Will Remain Same | Will Decrease | Net Response | | Nov-21 | 62.2 | 22.1 | 15.8 | 46.4 | 66.4 | 25.7 | 8.0 | 58.4 | | Jan-22 | 61.7 | 24.9 | 13.3 | 48.4 | 64.4 | 26.9 | 8.7 | 55.8 | | Mar-22 | 64.1 | 24.8 | 11.1 | 53.0 | 70.4 | 23.2 | 6.4 | 64.1 | | May-22 | 69.4 | 22.1 | 8.5 | 60.9 | 72.5 | 21.7 | 5.8 | 66.7 | | Jul-22 | 72.6 | 21.1 | 6.3 | 66.3 | 73.0 | 22.4 | 4.6 | 68.3 | | Sep-22 | 75.9 | 17.5 | 6.6 | 69.2 | 74.2 | 20.7 | 5.2 | 69.0 | | Nov-22 | 74.9 | 19.2 | 5.9 | 69.0 | 75.0 | 20.3 | 4.7 | 70.2 |
| Table 7: Perceptions and Expectations on Spending- Essential Items | | (Percentage responses) | | Survey Round | Current Perception | One year ahead Expectation | | Increased | Remained Same | Decreased | Net Response | Will Increase | Will Remain Same | Will Decrease | Net Response | | Nov-21 | 75.4 | 14.5 | 10.1 | 65.4 | 74.1 | 20.1 | 5.8 | 68.4 | | Jan-22 | 75.7 | 15.6 | 8.7 | 67.1 | 73.5 | 20.1 | 6.4 | 67.0 | | Mar-22 | 76.6 | 15.7 | 7.7 | 68.9 | 78.6 | 16.2 | 5.2 | 73.5 | | May-22 | 81.7 | 12.8 | 5.5 | 76.2 | 79.9 | 15.7 | 4.4 | 75.4 | | Jul-22 | 82.0 | 13.7 | 4.3 | 77.7 | 80.0 | 16.5 | 3.6 | 76.4 | | Sep-22 | 85.2 | 10.7 | 4.1 | 81.1 | 80.9 | 15.4 | 3.7 | 77.3 | | Nov-22 | 84.7 | 11.6 | 3.7 | 81.0 | 81.1 | 15.4 | 3.5 | 77.7 |
| Table 8: Perceptions and Expectations on Spending- Non-Essential Items | | (Percentage responses) | | Survey Round | Current Perception | One year ahead Expectation | | Increased | Remained Same | Decreased | Net Response | Will Increase | Will Remain Same | Will Decrease | Net Response | | Nov-21 | 12.9 | 26.8 | 60.4 | -47.5 | 25.0 | 36.3 | 38.7 | -13.7 | | Jan-22 | 14.3 | 31.1 | 54.5 | -40.2 | 23.6 | 38.6 | 37.8 | -14.2 | | Mar-22 | 16.1 | 31.6 | 52.2 | -36.1 | 28.9 | 36.7 | 34.4 | -5.5 | | May-22 | 16.6 | 34.1 | 49.3 | -32.7 | 27.5 | 38.4 | 34.1 | -6.6 | | Jul-22 | 18.7 | 35.9 | 45.5 | -26.8 | 29.3 | 38.5 | 32.2 | -2.9 | | Sep-22 | 20.9 | 32.5 | 46.7 | -25.8 | 29.5 | 37.6 | 33.0 | -3.6 | | Nov-22 | 22.4 | 33.8 | 43.8 | -21.4 | 32.8 | 35.1 | 32.2 | 0.6 |
|