The financial performance of urban co-operative banks (UCBs) improved in 2021-22 characterised by augmented capital buffers, lower gross non-performing assets (GNPA) ratio and higher profitability. Among the short-term rural co-operatives, balance sheets of both, state co-operative banks (StCBs) and district central co-operative banks (DCCBs) accelerated in 2020-21 after a slowdown in the previous year. Notably, the profitability of the latter improved. 1. Introduction V.1 Co-operative banks function as intermediaries for last mile credit delivery and promote financial inclusion. In the recent period, however, this sector has faced challenges emanating from ownership structure, deficient corporate governance practices, and rising incidence of frauds besides issues arising from dual regulation of the Reserve Bank and government. Mobilisation of additional capital is constrained by shareholding patterns and constitutional provisions. Legal impediments and idiosyncratic factors tend to hinder their expeditious resolution. V.2 Over the years, the Reserve Bank has been initiating reforms to strengthen the co-operative banking structure. Its two-pronged strategy consists of statutory reforms and regulatory support. The amendment to the Banking Regulation Act, 2020 has eased capital raising constraints of urban co-operative banks (UCBs). The Reserve Bank has been empowered to reconstruct or amalgamate them. The Reserve Bank also revised the regulatory framework governing UCBs on July 19, 2022. The vision guiding the framework is to consolidate their position as friendly neighborhood banks by catering to the heterogeneity in the customer base, while offering more operational flexibility to strong UCBs in order to enhance their contribution to credit intermediation. V.3 Against this backdrop, the rest of the chapter focuses on the performance of urban and rural co-operative banks during the period under review. Section 2 sets out the structure of the co-operative banking sector and its regulation, followed by evaluation of financial viability of UCBs in terms of profitability, asset quality and capital adequacy in section 3. Section 4 examines the financial performance of short-term rural co-operatives and long-term rural co-operatives. This is followed by an overall assessment insection 51. 2. Structure of the Co-operative Banking Sector V.4 The co-operative banking structure in India was developed to complement and supplement the commercial banking structure, with a specific focus on serving the requirements of marginalised borrowers and meeting the development needs of rural as well as urban areas. UCBs are classified as scheduled and non-scheduled, based on their inclusion or otherwise in the second schedule of the Reserve Bank ofIndia Act, 19342, and their geographical outreach (single-state or multi-state). Rural co-operatives are segregated by activity, i.e., into short term vis-à-vis long-term lending. At end-March 2022, the sector consisted of 1,514 UCBs and 1,03,560rural co-operatives3 (Chart V.1). V.5 In terms of number of banks as well as asset size, short-term rural co-operatives dominate the sector (Chart V.2). V.6 Increasingly, the distinction between scheduled commercial banks (SCBs), rural co-operatives and urban co-operatives is getting blurred, with all of them competing to serve the same set of clients. Even short-term credit co-operatives like the State Co-operative Banks (StCBs) are diversifying their portfolios, with long term lending to housing and education. Apart from traditional brick-and-mortar models, SCBs have been relying on business correspondents and harnessing benefits of FinTech to solve the problem of last mile connectivity. With growing penetration of commercial banks in the hinterland, the relative size and influence of co-operatives is shrinking. At end-March 2021, the aggregate balance sheet size of the co-operative banking sector at ₹20 lakh crore was 10.3 per cent of the SCBs’ consolidated balance sheet, down from 19.4 per cent at end-March 2005. 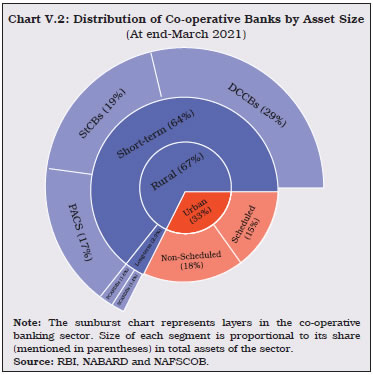
| Table V.1 Share in Credit Flow to Agriculture | | (per cent) | | | Co-operative Banks | Regional Rural Banks | Commercial Banks | | 1 | 2 | 3 | 4 | | 2015-16 | 16.7 | 13.0 | 70.2 | | 2016-17 | 13.4 | 11.6 | 75.0 | | 2017-18 | 12.9 | 12.1 | 74.9 | | 2018-19 | 12.1 | 11.9 | 76.0 | | 2019-20 | 11.3 | 11.9 | 76.8 | | 2020-21 | 12.1 | 12.1 | 75.8 | | 2021-22 | 13.0 | 11.0 | 76.0 | | Source: Data submitted by Banks on ENSURE portal of NABARD. | V.7 Although the rural co-operatives were established with the objective of lending to agriculture, their share in total lending to the sector declined since 2015-16 until 2019-20, but improved marginally thereafter (Table V.1). 3. Urban Co-operative Banks V.8 The liberal licensing policy adopted in the 1990s led to a surge in the number of UCBs. Over the years the inherent fragility in their structures coupled with financial weaknesses, resulted in nearly one-third of the newly licensed UCBs becoming unsound. Since 2004-05, the Reserve Bank initiated a process of consolidation in the sector, including amalgamation of unviable UCBs with their viable counterparts, closure of non-viable entities and suspension of issuance of new licenses. As a result, the number of UCBs progressively declined (Chart V.3). 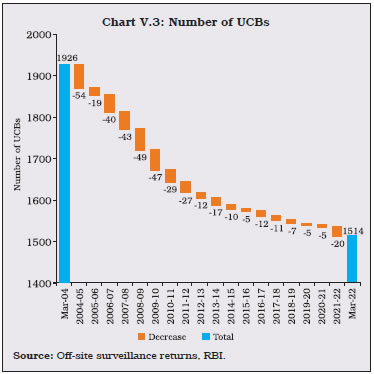 V.9 Nine non-scheduled UCBs (NSUCBs) were voluntarily merged with financially stronger banks during 2021-22. Since 2004-05, the sector has witnessed 145 mergers, with the majority in Maharashtra, followed by Gujarat and Andhra Pradesh. During 2021-22, licenses of 10 UCBs were cancelled, raising the cumulative tally since 2015-16 to 54. Except one amalgamation relating to a scheduled UCB (SUCB), other mergers and cancellation of licenses took place in case of NSUCBs, leading to a fall in their number from 1,481 in 2020-21 to 1,462 in 2021-22 (Chart V.4).  V.10 Based mainly on deposit size, UCBs aresegregated into Tier I and Tier II categories4,5. Tier II banks remain the dominant players in the segment, with their share in total assets increasing from 86.2 per cent in 2016-17 to 93.3 per cent in 2020-21, before dipping marginally in 2021-22 (Table V.2). Nonetheless, the asset size of Tier II UCBs, on an average, is 13 times larger than their Tier I counterparts. Their lending ticket size is also larger by around 14 times. | Table V.2: Tier-wise Distribution of Urban Co-operative Banks | | (At end-March 2022) | | (Amount in ₹ Crore) | | Tier Type | Number of Banks | Deposits | Advances | Total Assets | | Number | % to Total | Amount | % to Total | Amount | % to Total | Amount | % to Total | | 1 | 2 | 3 | 4 | 5 | 6 | 7 | 8 | 9 | | Tier I | 813 | 53.7 | 40,019 | 7.6 | 23,174 | 7.4 | 53,551 | 8.0 | | Tier II | 701 | 46.3 | 4,86,001 | 92.4 | 2,91,566 | 92.6 | 6,12,935 | 92.0 | | All UCBs | 1,514 | 100.0 | 5,26,021 | 100.0 | 3,14,741 | 100.0 | 6,66,486 | 100.0 | Note: Data are provisional.
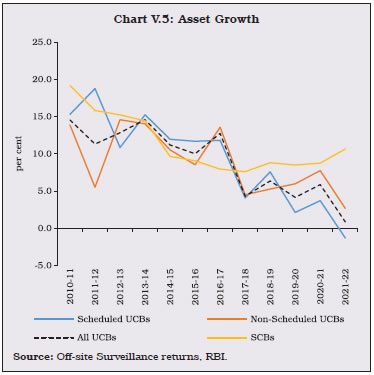
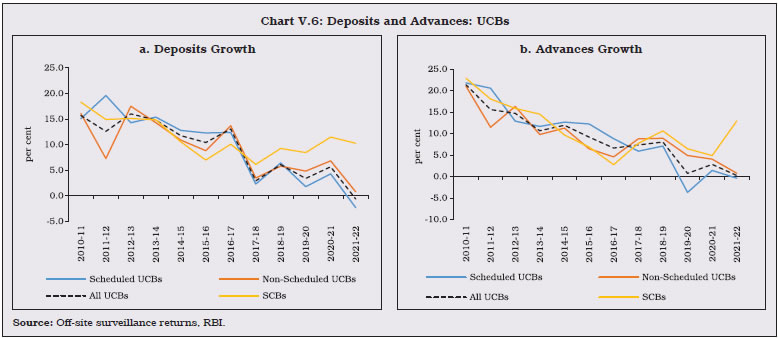
Source: Off-site surveillance returns, RBI. | 3.1 Balance Sheet V.11 The consolidation of the UCB sector since 2004-05 initially resulted in large gains. Their combined balance sheet size grew by a compound annual growth rate (CAGR) of 11.4 per cent during the decade following the drive, as compared with 15.9 per cent for SCBs. Subsequently, however, the balance sheet growth of both segments moderated; while UCBs grew by a CAGR of 4.8 per cent during 2015-16 to 2021-22, SCBs grew by 7.4 per cent (Chart V.5). Apart from the cyclical downturn during the period, this deceleration in balance sheet growth can be ascribed to competition from other niche players like FinTech, small finance banks (SFBs) and non-banking financial companies (NBFCs). V.12 In contrast with the acceleration in SCBs’ balance sheet, the asset size of UCBs decelerated during 2021-22, led by contraction in the balance sheet of SUCBs (Table V.3). V.13 Deposits contracted during 2021-22 for the first time in nearly two decades, leading to a deceleration in UCBs’ balance sheet. The high deposits base of 2020-21 was a reflection of pandemic-driven precautionary savings, which normalised during 2021-22. On the asset side, both loans and advances and investments decelerated (Chart V.6). | Table V.3: Balance Sheet of Urban Co-operative Banks | | (At end-March) | | (Amount in ₹ Crore) | | Items | Scheduled UCBs | Non-Scheduled UCBs | All UCBs | Rate of Growth (%) All UCBs | | 2021 | 2022 | 2021 | 2022 | 2021 | 2022 | 2020-21 | 2021-22 | | 1 | 2 | 3 | 4 | 5 | 6 | 7 | 8 | 9 | | Liabilities | | | | | | | | | | 1) Capital | 4,467 | 4,193 | 9,844 | 10,065 | 14,311 | 14,258 | 1.4 | -0.4 | | | (1.5) | (1.4) | (2.7) | (2.7) | (2.2) | (2.1) | | | | 2) Reserves and Surplus | 15,536 | 19,405 | 22,848 | 22,947 | 38,384 | 42,352 | 15.2 | 10.3 | | | (5.1) | (6.5) | (6.4) | (6.2) | (5.8) | (6.4) | | | | 3) Deposits | 2,39,579 | 2,34,080 | 2,89,650 | 2,91,940 | 5,29,229 | 5,26,021 | 5.7 | -0.6 | | | (79.4) | (78.6) | (80.7) | (79.2) | (80.1) | (78.9) | | | | 4) Borrowings | 4,755 | 5,418 | 333 | 242 | 5,089 | 5,660 | -4.7 | 11.2 | | | (1.6) | (1.8) | (0.1) | (0.1) | (0.8) | (0.8) | | | | 5) Other Liabilities and Provisions | 37,455 | 34,810 | 36,280 | 43,385 | 73,736 | 78,196 | 4.6 | 6.0 | | | (12.4) | (11.7) | (10.1) | (11.8) | (11.2) | (11.7) | | | | Assets | | | | | | | | | | 1) Cash in Hand | 1,676 | 1,855 | 4,230 | 4,426 | 5,906 | 6,281 | 1.2 | 6.3 | | | (0.6) | (0.6) | (1.2) | (1.2) | (0.9) | (0.9) | | | | 2) Balances with RBI | 11,131 | 12,404 | 3,382 | 4,039 | 14,514 | 16,443 | 15.2 | 13.3 | | | (3.7) | (4.2) | (0.9) | (1.1) | (2.2) | (2.5) | | | | 3) Balances with Banks | 21,888 | 23,176 | 48,189 | 47,330 | 70,077 | 70,506 | 5.8 | 0.6 | | | (7.3) | (7.8) | (13.4) | (12.8) | (10.6) | (10.6) | | | | 4) Money at Call and Short Notice | 5,087 | 3,505 | 1,910 | 1,488 | 6,998 | 4,993 | -16.6 | -28.6 | | | (1.7) | (1.2) | (0.5) | (0.4) | (1.1) | (0.7) | | | | 5) Investments | 80,297 | 81,128 | 1,00,728 | 1,06,574 | 1,81,025 | 1,87,702 | 12.1 | 3.7 | | | (26.6) | (27.2) | (28.1) | (28.9) | (27.4) | (28.2) | | | | 6) Loans and Advances | 1,43,175 | 1,42,627 | 1,70,786 | 1,72,114 | 3,13,961 | 3,14,741 | 2.8 | 0.2 | | | (47.4) | (47.9) | (47.6) | (46.7) | (47.5) | (47.2) | | | | 7) Other Assets | 38,538 | 33,211 | 29,729 | 32,608 | 68,267 | 65,819 | 6.3 | -3.6 | | | (12.8) | (11.1) | (8.3) | (8.8) | (10.3) | (9.9) | | | | Total Liabilities/ Assets | 3,01,793 | 2,97,906 | 3,58,955 | 3,68,580 | 6,60,748 | 6,66,486 | 5.9 | 0.9 | | | (100.0) | (100.0) | (100.0) | (100.0) | (100.0) | (100.0) | | | Notes: 1. Data for March 2022 are provisional.
2. Figures in parentheses are proportion to total liabilities / assets (in per cent).
3. Components may not add up to the whole due to rounding off.
Source: Off-Site surveillance returns, RBI. |
 V.14 In comparison to SCBs, the credit-deposit (C-D) ratio of UCBs has always been significantly lower, particularly NSUCBs, due to higher reliance on deposits and lower credit disbursal. After declining for three consecutive years, however, the C-D ratio of UCBs rose in 2021-22. This was mainly on account of contraction in deposits of SUCBs (Chart V.7). V.15 Before the consolidation drive was initiated, in terms of number of UCBs, the asset size was bimodal: ₹25 crore to ₹50 crore and ₹100 crore to ₹250 crore. Since then, however, the distribution has shifted rightward, indicating asset concentration at higher levels (Chart V.8).
V.16 In terms of number of UCBs, the modal class for deposits in 2015-16 was ₹25 crore to ₹50 crore. Over the years, it has shifted upwards to reach ₹100 crore to ₹250 crore at end-March 2022 (Chart V.9a). V.17 For advances, the modal class in 2016-17 was ₹10 crore to ₹25 crore, which has evolved to become bi-modal, with ₹10 crore to ₹25 crore and ₹25 crore to ₹50 crore classes registering the highest shares at end-March 2022 (Table V.4 and Chart V.9b). | Table V.4: Distribution of UCBs by size of Deposits and Advances | | (At end-March 2022) | | (Amount in ₹ crore) | | Deposits | No. of UCBs | Amount of Deposits | Advances | No. of UCBs | Amount of Advances | | Number | % Share | Amount | % Share | Number | % Share | Amount | % Share | | 1 | 2 | 3 | 4 | 5 | 6 | 7 | 8 | 9 | 10 | | 0.00 ≤ D < 10 | 87 | 5.7 | 532 | 0.1 | 0.00 ≤ Ad < 10 | 216 | 14.3 | 1,241 | 0.4 | | 10 ≤ D < 25 | 188 | 12.4 | 3,257 | 0.6 | 10 ≤ Ad < 25 | 286 | 18.9 | 4,895 | 1.6 | | 25 ≤ D < 50 | 263 | 17.4 | 9,793 | 1.9 | 25 ≤ Ad < 50 | 284 | 18.8 | 10,081 | 3.2 | | 50 ≤ D < 100 | 291 | 19.2 | 20,799 | 4.0 | 50 ≤ Ad < 100 | 261 | 17.2 | 18,892 | 6.0 | | 100 ≤ D < 250 | 321 | 21.2 | 51,128 | 9.7 | 100 ≤ Ad < 250 | 238 | 15.7 | 37,807 | 12.0 | | 250 ≤ D < 500 | 169 | 11.2 | 59,480 | 11.3 | 250 ≤ Ad < 500 | 117 | 7.7 | 40,226 | 12.8 | | 500 ≤ D < 1000 | 105 | 6.9 | 72,351 | 13.8 | 500 ≤ Ad < 1000 | 65 | 4.3 | 44,863 | 14.3 | | 1000 ≤ D | 90 | 5.9 | 3,08,681 | 58.7 | 1000 ≤ Ad | 47 | 3.1 | 1,56,736 | 49.8 | | Total | 1,514 | 100.0 | 5,26,021 | 100.0 | Total | 1,514 | 100.0 | 3,14,741 | 100.0 | Notes: 1. Data are provisional.
2. ‘D’ and ‘Ad’ indicates amount of deposits and advances respectively.
3. Components may not add up to the whole due to rounding off.
Source: Off- Site surveillance returns, RBI. |
| Table V.5: Investments by Urban Co-operative Banks | | (Amount in ₹ Crore) | | Item | Amount outstanding (At end-March) | Variation (%) | | 2020 | 2021 | 2022 | 2020-21 | 2021-22 | | 1 | 2 | 3 | 4 | 5 | 6 | | Total Investments (A + B) | 1,61,696 | 1,81,025 | 1,87,702 | 12.0 | 3.7 | | | (100.0) | (100.0) | (100.0) | | | | A. SLR Investments (i to iii) | 1,42,093 | 1,61,477 | 1,67,893 | 13.6 | 4.0 | | | (87.9) | (89.2) | (89.4) | | | | (i) Central Govt. Securities | 96,471 | 1,02,033 | 1,04,728 | 5.8 | 2.6 | | | (59.7) | (56.4) | (55.8) | | | | (ii) State Govt. Securities | 44,428 | 58,951 | 62,643 | 32.7 | 6.3 | | | (27.5) | (32.6) | (33.4) | | | | (iii) Other approved Securities | 1,194 | 492 | 522 | -58.7 | 6.0 | | | (0.7) | (0.3) | (0.3) | | | | B. Non-SLR Investments | 19,603 | 19,549 | 19,809 | -0.3 | 1.3 | | | (12.1) | (10.8) | (10.6) | | | Notes: 1. Data for 2022 are provisional.
2. Figures in parentheses are proportion to total investments (in per cent).
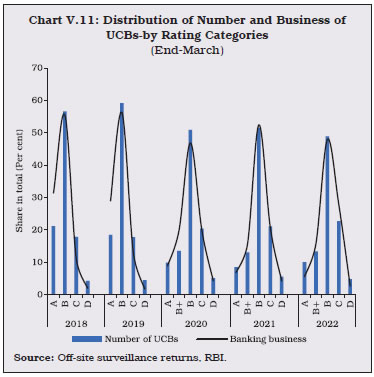
Source: Off-site surveillance returns, RBI. | V.18 The moderation in investments of UCBs was on account of SLR investments, especially those in state government securities (Table V.5). Relative to NSUCBs, the sharper moderation in investments of SUCBs was reflective of contraction in the latter’s deposit base (Chart V.10). 3.2 Soundness V.19 The penalty imposition instances for UCBs increased to 145 during 2021-22 from 43 in the previous year. Correspondingly, the penalty amount increased by 211 per cent as compared with a decline in the previous year (Refer to Table IV.15). Claims settled by the Deposit Insurance and Credit Guarantee Corporation (DICGC) during 2021-22 pertained entirely to co-operative banks and increased by over eight times as compared with the previous year. This mainly reflects the amendment to DICGC Act 1961, which facilitated time bound disbursal of depositors’ insured money (Refer to Para IV.86). V.20 The CAMELS-based rating system6 was revised in 2019, under which ratings of A/B+/B/C/D (in decreasing order of performance) have been assigned to UCBs. At end-March 2022, the ‘B’ category was the modal class in terms of number as well as business (sum of deposits and advances). As compared to the previous year, however, its share in total decreased (Table V.6). Over the years, the distribution has shifted rightwards with higher share of ‘C’ category in total business (Chart V.11). | Table V.6: Rating-wise Distribution of UCBs | | (End-March 2022) | | (Amount in ₹ crore) | | Ratings | Number | Deposits | Advances | | Banks | % share in Total | Amount | % share in Total | Amount | % share in Total | | 1 | 2 | 3 | 4 | 5 | 6 | 7 | | A | 153 | 10.1 | 30,240 | 5.7 | 17,190 | 5.5 | | B+ | 203 | 13.4 | 83,152 | 15.8 | 49,642 | 15.8 | | B | 740 | 48.9 | 2,50,292 | 47.6 | 1,52,571 | 48.5 | | C | 345 | 22.8 | 1,48,925 | 28.3 | 85,794 | 27.3 | | D | 73 | 4.8 | 13,411 | 2.5 | 9,545 | 3.0 | | Total | 1,514 | 100.0 | 5,26,021 | 100.0 | 3,14,741 | 100.0 | Notes: 1. Data is provisional.
2. Components may not add up to the whole due to rounding off.
3. Ratings are based on the latest available data reported in offsite returns and collected from UCBs.
4. Percentage variation could be slightly different because absolute numbers have been rounded off to rupees Crores.
Source: Off-site surveillance returns, RBI. |
| Table V.7: CRAR-wise Distribution of UCBs | | (End-March 2022) | | (Number of banks) | | CRAR (in Per cent) | Scheduled UCBs | Non- Scheduled UCBs | All UCBs | | 1 | 2 | 3 | 4 | | CRAR < 3 | 4 | 58 | 62 | | 3 <= CRAR < 6 | 0 | 12 | 12 | | 6 <= CRAR < 9 | 0 | 16 | 16 | | 9 <= CRAR < 12 | 7 | 115 | 122 | | 12 <= CRAR | 41 | 1,261 | 1,302 | | Total | 52 | 1,462 | 1,514 | Note: Data are provisional.
Source: Off-site surveillance returns, RBI. | 3.3 Capital Adequacy V.21 At end-March 2022, 94 per cent of UCBs maintained capital to risk-weighted assets ratio (CRAR) above the regulatory minimum of 9 per cent (Table V.7). Over the last decade, the capital buffers of UCBs have improved, with fewer banks defaulting on regulatory requirements (Chart V.12).
| Table V.8: Component-wise Capital Adequacy of UCBs | | (At end-March) | | (Amount in ₹ crore) | | | Scheduled UCBs | Non-Scheduled UCBs | All UCBs | | 2021 | 2022 | 2021 | 2022 | 2021 | 2022 | | 1 Capital Funds | 13,520 | 20,955 | 25,543 | 27,916 | 39,063 | 48,871 | | i) Tier I Capital | 7,758 | 15,019 | 22,010 | 24,006 | 29,768 | 39,025 | | ii) Tier II Capital | 5,762 | 5,935 | 3,533 | 3,910 | 9,295 | 9,845 | | 2 Risk-Weighted Assets | 1,45,352 | 1,46,925 | 1,67,243 | 1,65,940 | 3,12,594 | 3,12,865 | | 3 CRAR (1 as % of 2) | 9.3 | 14.3 | 15.3 | 16.8 | 12.5 | 15.6 | | Of which: | | | | | | | | Tier I | 5.3 | 10.2 | 13.2 | 14.5 | 9.5 | 12.5 | | Tier II | 4.0 | 4.0 | 2.1 | 2.4 | 3.0 | 3.1 | Note: Data for 2022 are provisional.
Source: Off-site returns, RBI. | V.22 SUCBs improved their capital positions substantially during the year ended March 2022 with additions to Tier I capital. Although the CRAR of the UCB sector still remains lower than SCBs, the sector is poised to meet the revised regulatory requirements of higher CRAR for Tier II to Tier IV banks7 (Table V.8). 3.4 Asset Quality V.23 Asset quality of UCBs, measured by the gross non-performing assets (GNPA) ratio, continuously deteriorated during 2015-16 to 2020-21 before improving in 2021-22 when a decline in the amount of gross non-performing assets occurred for the first time since 2012-13. Provisioning requirements have also reduced for both SUCBs and NSUCBs. UCBs, however, showed prudence and their provision coverage ratio increased year-on-year, although it still remains below that of SCBs (Table V.9). | Table V.9: Non-Performing Assets of UCBs | | (At end-March) | | Sr. No. | Items | Scheduled UCBs | Non-Scheduled UCBs | All UCBs | | 2020-21 | 2021-22 | 2020-21 | 2021-22 | 2020-21 | 2021-22 | | 1 | 2 | 3 | 4 | 5 | 6 | 7 | 8 | | 1 | Gross NPAs (₹ crore) | 15,047 | 10,678 | 22,950 | 19,794 | 37,996 | 30,473 | | 2 | Gross NPA Ratio (%) | 10.5 | 7.5 | 13.4 | 11.6 | 12.1 | 9.7 | | 3 | Net NPAs (₹ crore) | 5,746 | 4,116 | 11,037 | 8,798 | 16,783 | 12,914 | | 4 | Net NPA Ratio (%) | 4.3 | 3.0 | 7.0 | 5.6 | 5.8 | 4.4 | | 5 | Provisioning (₹ crore) | 9,537 | 6,983 | 12,848 | 12,179 | 22,385 | 19,162 | | 6 | Provisioning Coverage Ratio (%) | 63.4 | 65.4 | 56.0 | 61.5 | 58.9 | 62.9 | Note: Data for 2021-22 are provisional.
Source: Off- site surveillance returns, RBI. | V.24 At end-March 2022, 26 per cent of UCBs’ total funded loans and 32 per cent of their NPAs originated from large borrowal accounts i.e., exposure of ₹5 crore and above. NSUCBs’ exposure to these borrowers was less than 10 per cent of their total loans at end-March 2022 as compared with 47 per cent share for SUCBs. The GNPA ratio of UCBs emanating from large borrowal accounts declined, mainly on the back of decline for SUCBs. In the case of NSUCBs, however, the ratio has remained high and has deteriorated further recently (Chart V.13). 3.5 Financial Performance and Profitability V.25 Anaemic credit growth in a low interest rate regime, pulled down the interest income of UCBs in 2021-22. The contraction in interest expenditure was, however, even sharper leading to improvement in their profitability. Amalgamation of a large debt-ridden and stressed SUCB with a small finance bank also helped in improving profitability. On the other hand, the increase in non-interest expenditure, especially staff costs, coupled with a sharp reduction in non-interest income, had a moderating influence (Table V.10). 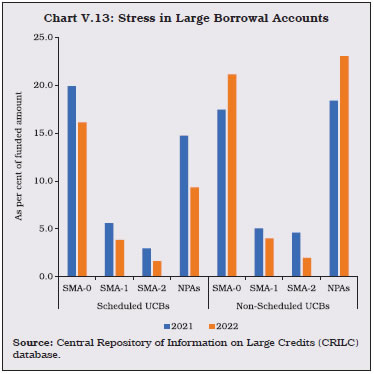
| Table V.10: Financial Performance of Scheduled and Non-scheduled Urban Co-operative Banks | | (Amount in ₹ crore) | | Item | Scheduled UCBs | Non-scheduled UCBs | All UCBs | All UCBs Variation (%) | | 2020-21 | 2021-22 | 2020-21 | 2021-22 | 2020-21 | 2021-22 | 2021-22 | | 1 | 2 | 3 | 4 | 5 | 6 | 7 | 8 | | A. Total Income [i+ii] | 22,301 | 20,743 | 30,148 | 29,879 | 52,449 | 50,622 | -3.5 | | | (100.0) | (100.0) | (100.0) | (100.0) | (100.0) | (100.0) | | | i. Interest Income | 19,463 | 18,551 | 27,837 | 28,022 | 47,300 | 46,573 | -1.5 | | | (87.3) | (89.4) | (92.3) | (93.8) | (90.2) | (92.0) | | | ii. Non-interest Income | 2,838 | 2,192 | 2,311 | 1,857 | 5,149 | 4,049 | -21.4 | | | (12.7) | (10.6) | (7.7) | (6.2) | (9.8) | (8.0) | | | B. Total Expenditure [i+ii] | 18,884 | 17,017 | 25,773 | 24,875 | 44,657 | 41,892 | -6.2 | | | (100.0) | (100.0) | (100.0) | (100.0) | (100.0) | (100.0) | | | i. Interest Expenditure | 13,503 | 11,398 | 18,613 | 17,311 | 32,116 | 28,709 | -10.6 | | | (71.5) | (67.0) | (72.2) | (69.6) | (71.9) | (68.5) | | | ii. Non-interest Expenditure | 5,381 | 5,619 | 7,160 | 7,565 | 12,541 | 13,183 | 5.1 | | | (28.5) | (33.0) | (27.8) | (30.4) | (28.1) | (31.5) | | | of which: Staff Expenses | 2,745 | 2,876 | 3,923 | 4,144 | 6,668 | 7,020 | 5.3 | | C. Profits | | | | | | | | | i. Amount of Operating Profits | 3,417 | 3,727 | 4,375 | 5,004 | 7,792 | 8,730 | 12.0 | | ii. Provision, Contingencies | 2,242 | 1,921 | 2,584 | 2,805 | 4,826 | 4,726 | -2.1 | | iii. Provision for taxes | 597 | 306 | 811 | 817 | 1,408 | 1,124 | -20.2 | | iv. Amount of Net Profit before Taxes | 1,175 | 1,805 | 1,791 | 2,199 | 2,966 | 4,004 | 35.0 | | v. Amount of Net Profit after Taxes | 578 | 1,499 | 980 | 1,382 | 1,558 | 2,881 | 85.0 | Notes: 1. Data for 2021-22 are provisional.
2. Components may not add up to the total due to rounding off.
3. Percentage variation could be slightly different because absolute numbers have been rounded off to ₹ crore.
4. Figures in parentheses are proportion to total income/expenditure (in per cent).
Source: Off-site surveillance returns, RBI. |
| Table V.11: Select Profitability Indicators of UCBs | | (Per cent) | | Indicators | Scheduled UCBs | Non-Scheduled UCBs | All UCBs | | 2020-21 | 2021-22 | 2020-21 | 2021-22 | 2020-21 | 2021-22 | | 1 | 2 | 3 | 4 | 5 | 6 | 7 | | Return on Assets | 0.19 | 0.50 | 0.28 | 0.38 | 0.24 | 0.43 | | Return on Equity | 2.94 | 6.88 | 3.22 | 4.21 | 3.11 | 5.27 | | Net Interest Margin | 2.01 | 2.39 | 2.67 | 2.94 | 2.36 | 2.69 | Note: Data for 2021-22 are provisional.
Source: Off-site surveillance returns, RBI. | V.26 Key measures of UCBs’ profitability — return on assets (RoA) and net return on equity (RoE) — improved for the second consecutive year (Table V.11 and Chart V.14). The fall in average cost of deposits, coupled with hardening of average return on advances, led to improvement in profitability of SUCBs (Appendix Table V.1). 3.6 Priority sector lending V.27 The strong grassroot level presence of co-operative banks facilitates their pivotal role in furthering financial inclusion. The priority sector lending norms for UCBs were revised on March 13, 2020 — requiring them to meet the target of 45 per cent, 50 per cent, 60 per cent and 75 per cent of adjusted net bank credit by end-March 2021, 2022, 2023 and 2024, respectively. V.28 Priority sector lending of UCBs has always exceeded the stipulated target over the last decade. This trend continued even with the higher regulatory target, 55 per cent of UCBs’ lending during 2021-22 was directed towards the sector. MSMEs received a lion’s share in lending (Table V.12). In June 2022, the Reserve Bank increased individual housing loan limits for UCBs, StCBs and DCCBs. Going forward, this may give a fillip to their credit to the housing sector. | Table V.12: Composition of Credit to Priority Sectors by UCBs | | (As at end-March) | | (Amount in ₹ Crore) | | Item | 2021 | 2022 | | Amount | Share in Total Advances (%) | Amount | Share in Total Advances (%) | | 1. Agriculture [(i)+(ii)+(iii)] | 12,245 | 3.9 | 13,213 | 4.2 | | (i) Farm Credit | 8,913 | 2.8 | 9,841 | 3.1 | | (ii) Agriculture Infrastructure | 676 | 0.2 | 915 | 0.3 | | (iii) Ancillary Activities | 2,701 | 0.9 | 2,457 | 0.8 | | 2. Micro and Small Enterprises [(i) + (ii) +(iii) + (iv)] | 1,01,340 | 32.3 | 1,07,847 | 34.3 | | (i) Micro Enterprises | 34,301 | 10.9 | 37,681 | 12.0 | | (ii) Small Enterprises | 46,128 | 14.7 | 46,733 | 14.8 | | (iii) Medium Enterprises | 20,547 | 6.5 | 22,894 | 7.3 | | (iv) Advances to KVI (Including ‘Other Finance to MSMEs’) | 365 | 0.1 | 539 | 0.2 | | 3. Export Credit | 368 | 0.1 | 284 | 0.1 | | 4. Education | 2,374 | 0.8 | 2,629 | 0.8 | | 5. Housing | 25,211 | 8.0 | 26,803 | 8.5 | | 6. Social Infrastructure | 1,185 | 0.4 | 1,114 | 0.4 | | 7. Renewable Energy | 1,291 | 0.4 | 1,380 | 0.4 | | 8. ‘Others’ category under Priority Sector | 17,694 | 5.6 | 20,012 | 6.4 | | 9. Total (1 to 8) | 1,61,708 | 51.5 | 1,73,282 | 55.1 | | of which, Loans to Weaker Sections under Priority Sector | 33,590 | 10.7 | 34,844 | 11.1 | Notes: 1. Data for 2022 are provisional.
2. Percentage share are with respect to the total credit of UCBs.
3. Components may not add up to total due to rounding off.
Source: Off-site surveillance returns, RBI. |
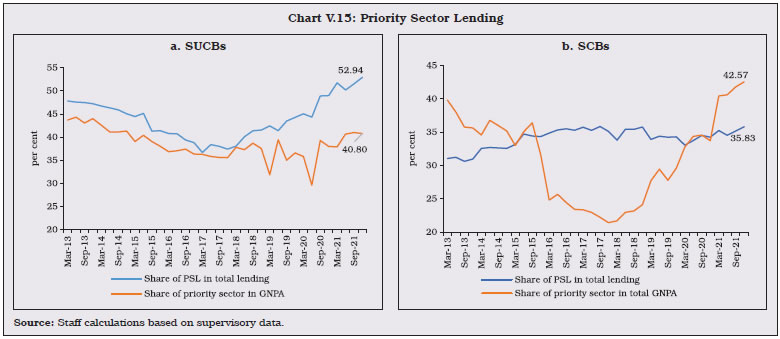 V.29 Despite the increasing share of the priority sector in total lending of SUCBs, their GNPAs have remained low, especially when compared with the SCBs (Chart V.15a and 15b). V.30 Empirical evidence suggests that while asset quality and capital buffers are significant determinants of SUCBs’ profitability, priority sector lending does not weaken it (Box V.1). Box V.1: Determinants of Profitability of Scheduled Urban Co-operative Banks For scheduled urban co-operative banks (SUCBs), quarterly panel data of 54 entities for the period March 2013 to December 2021 were used in a fixed effects panel regression framework. The dependent variable viz. profitability of banks is proxied by return on assets (RoA) and alternately by net interest margin (NIM). Explanatory variables include bank specific factors such as ratio of priority sector lending to total lending (PSL ratio) of SUCBs, gross non-performing assets (GNPA) ratio, total assets, CRAR and GNPA of priority sector in Model I. The same relationship is examined by controlling for macroeconomic variables like real GDP growth and inflation in Model II. | Table 1a: Impact of Priority Sector Lending on Profitability of SUCBs | | Model I: Bank Specific Factors | | VARIABLES | (1) | (2) | (3) | (4) | | Return on Assets | NIM | Return on Assets | NIM | | PSL | -0.00331 | 0.000879 | -0.00466 | 0.000587 | | | (0.00453) | (0.00208) | (0.00473) | (0.00210) | | TOTAL GNPA | -0.0284*** | -0.0220*** | | | | | (0.00586) | (0.00389) | | | | Total Assets | -0.0501 | -0.587** | 0.0330 | -0.466 | | | (0.367) | (0.275) | (0.351) | (0.302) | | CRAR | 0.0256*** | -0.00455 | 0.0298*** | -0.000873 | | | (0.00515) | (0.00348) | (0.00730) | (0.00582) | | Priority GNPA | | | -0.0209*** | -0.0139** | | | | | (0.00687) | (0.00557) | | Constant | 1.466 | 12.19** | 0.0164 | 10.06* | | | (6.221) | (4.655) | (5.878) | (5.066) | | Bank Fixed Effects | Yes | Yes | Yes | Yes | | Time Fixed Effects | Yes | Yes | Yes | Yes | | Observations | 1,938 | 1,938 | 1,938 | 1,938 | | R-squared | 0.254 | 0.764 | 0.206 | 0.740 | | Number of Banks | 55 | 55 | 55 | 55 | Robust standard errors in parentheses
*** p<0.01, ** p<0.05, * p<0.1 | The findings suggest that asset quality, measured by total GNPA ratio and GNPA ratio of priority sector lending, is inversely related to profitability of SUCBs, while capital buffers have a positive impact. Priority sector lending is not a significant determinant of profitability. The results are consistent across different specifications of the model (Table 1a). The results remain consistent even after controlling for macroeconomic variables viz. real GDP growth and inflation (Table 1b), suggesting pro-cyclicality of bank profitability, while high inflation seems to erode profit margins. The ratio of non-interest income to operating income, representing income diversification, has a significant and positive impact on RoA. | Table 1b: Impact of Priority Sector Lending on Profitability of SUCBs | | Model II: Bank Specific Factors and Macroeconomic Controls | | Variables | (1) | (2) | | Return on Assets | Return on Assets | | PSL | -0.00302 | -0.00317 | | | (0.00452) | (0.00427) | | TOTAL GNPA | -0.0278*** | -0.0281*** | | | (0.00600) | (0.00577) | | CRAR | 0.0254*** | 0.0258*** | | | (0.00481) | (0.00506) | | Non-Interest Income to Operating Income | | 1.165** | | | | (0.498) | | Total Assets | -0.0535 | -0.00229 | | | (0.339) | (0.340) | | Real GDP | 0.00555** | | | | (0.00245) | | | Inflation | -0.0138 | | | | (0.0106) | | | WALR | 0.0478 | | | | (0.0621) | | | Constant | 1.017 | 0.526 | | | (6.560) | (5.733) | | Bank Fixed Effects | Yes | Yes | | Time Fixed Effects | No | Yes | | Observations | 1,938 | 1,937 | | R-squared | 0.209 | 0.265 | | Number of Banks | 55 | 55 | Robust standard errors in parentheses
*** p<0.01, ** p<0.05, * p<0.1 | | 4. Rural Co-operatives V.31 Rural credit co-operatives came into existence as an institutional mechanism to dispense credit to marginalised areas and activities at affordable cost to address the twin problem of rural indebtedness and poverty. The share of rural co-operatives has been growing — their share in total assets increased from 66.9 per cent at end March 2020 to 67.3 per cent at end March 2021. V.32 Rural co-operative banks’ network of short and long-term institutions has nurtured a distinctive place in the rural credit delivery system due to outreach and volume of business. Deposits are the major sources of funds for short-term credit co-operatives while long-term credit co-operatives rely heavily on borrowings. The financial performance of short-term rural co-operatives is relatively better, with a proportionally higher share in net profits, a lower share in NPAs and higher recovery of loans to demand ratio. (Table V.13 and Chart V.16). V.33 At the same time, the sector is also riddled with both structural and transient challenges. While a broad depositor base enables UCBs to raise funds at relatively low cost, rural co-operatives are heavily dependent on borrowings for their operations. At end-March 2021, borrowings constituted around 1 per cent of UCBs’ liabilities, as against as high as 29 per cent for rural co-operatives. Despite recent moderation, the number of loss-making rural co-operatives has remained high, largely reflecting asset quality concerns. Adequacy of capital is also a weak spot for many institutions. | Table V.13: A Profile of Rural Co-operatives | | (At end-March 2021) | | (Amount in ₹ Crore) | | Item | Short-term | Long-term | | StCBs | DCCBs | PACS | SCARDBs (P) | PCARDBs (P) | | 1 | 2 | 3 | 4 | 5 | 6 | | A. Number of Co-operatives | 34* | 351 | 102,559 | 13 | 603 | | B. Balance Sheet Indicators | | | | | | | i. Owned Funds (Capital + Reserves) | 24,425 | 46,773 | 42,311 | 6,142 | 4,227 | | ii. Deposits | 2,23,057 | 3,81,825 | 1,70,922 | 2,546 | 1,551 | | iii. Borrowings | 1,07,207 | 1,08,077 | 1,43,044 | 13,293 | 16,144 | | iv. Loans and Advances | 2,11,794 | 3,04,990 | 2,29,443 | 20,918 | 15,325 | | v. Total Liabilities/Assets | 3,77,338 | 5,88,914 | 3,34,718 | 27,275 | 31,677 | | C. Financial Performance | | | | | | | i. Institutions in Profits | | | | | | | a. No. | 32 | 308 | 47,297 | 10 | 311 | | b. Amount of Profit | 1,669 | 2,091 | 5,298 | 180 | 193 | | ii. Institutions in Loss | | | | | | | a. No. | 2 | 43 | 37,419 | 3 | 292 | | b. Amount of Loss | 268 | 669 | 4,320 | 17 | 665 | | iii. Overall Profits (+)/Loss (-) | 1,402 | 1,422 | 978 | 163 | -473 | | D. Non-performing Assets | | | | | | | i. Amount | 14,113 | 34,761 | 72,550 | 6,942 | 6,818 | | ii. As percentage of Loans Outstanding | 6.7 | 11.4 | 33.5 | 33.2 | 44.5 | | E. Recovery of Loans to Demand Ratio** (Per cent) | 90.5 | 74.9 | 71.1 | 46.5 | 41.8 | Notes: 1. StCBs: State Co-operative Banks; DCCBs: District Central Co-operative Banks; PACS: Primary Agricultural Credit Societies; SCARDBs: State Co-operative Agriculture and Rural Development Banks; PCARDBs: Primary Co-operative Agriculture and Rural Development Banks
2. (P)- Data are provisional.
3. *: Till FY 2019-20, data of Daman & Diu StCB was reported as a part of Goa StCB. Audit of Goa StCB and Daman & Diu StCB was undertaken separately for the position as on 31 Mar 2021.
4.** : This ratio captures the share of outstanding non-performing loan amounts that have been recovered and is as on 30 June of FY
Source: NABARD & NAFCOB (PACS Data). | 4.1 Short-term Rural Co-operatives V.34 Short-term credit co-operatives, viz. state co-operative banks (StCBs), district central co-operative banks (DCCBs) and Primary Agricultural Credit Societies (PACS) that operate at the grass root level, cater to the credit requirements of the members through provision of crop loans / working capital. They also provide several non-financial services like input supply, storage and marketing of produce as well as supply of consumer goods. V.35 A major part of profits earned by StCBs in 2021 was sourced from the southern and western regions (Appendix table V.3). DCCBs, which have a stronger presence in the central region, earn the highest share of their profits from the western region (Appendix Table V.4). On the other hand, although PACS are more concentrated in the Western region, they depend heavily on the northern region for profits (Appendix Table V.6). V.36 A comparison of financial performance suggests that PACS are the weakest link in the short-term rural co-operative segment. Their high dependency on borrowings, coupled with higher NPA ratios and low recovery ratios point to underlying vulnerabilities (Chart V.17). 4.1.1 State Co-operative Banks V.37 State co-operative banks (StCBs) are the apex institutions in the rural co-operative structure, providing liquidity and technical assistance to the Tier II and Tier III institutions, apart from customer lending on their own. At end-March 2021, they had 2,078 branches across 35 states and UTs8, providing credit for a range of agricultural and non-agricultural purposes. Agricultural loans constituted 43 per cent of the total loan portfolio of StCBs. Balance Sheet Operations V.38 State co-operative banks’ (StCBs) balance sheet grew by over 7 per cent for the third consecutive year in 2020-21. Like in previous years, deposits remain the mainstay of their liabilities. The sharp increase in borrowing also highlights their dynamic resource mobilisation strategy — taking advantage of lower cost of borrowing available in 2020-21. However, the higher incremental resources mobilised could not be utilised for extending loans and advances in the face of anaemic credit demand that prevailed then. Instead, these resources were deployed as investments and cash holdings (Table V.14). V.39 Supervisory data available for 2021-22 show a reversal, with robust credit pick-up and corresponding slowdown in SLR investments (Table V.15). Profitability V.40 During 2019-20, both interest income and interest expended had contracted, but the latter more than compensated for the former. As a result, it turned out to be a profitable year for StCBs. This was reversed in 2020-21 and as the increase in interest expenditure outpaced that of interest earnings, the sector witnessed erosion in profitability. Increase in operating expenditure, mainly on account of wage bills, further accentuated the contraction in profits (Table V.16). | Table V.14: Liabilities and Assets of State Co-operative Banks | | (Amount in ₹ Crore) | | Item | At end-March | Variation (%) | | 2020 | 2021 | 2019-20 | 2020-21 | | 1 | 2 | 3 | 4 | 5 | | Liabilities | | | | | | 1. Capital | 7,459 | 8,577 | 0.4 | 15.0 | | | (2.2) | (2.3) | | | | 2. Reserves | 14,441 | 15,848 | 4.7 | 9.7 | | | (4.2) | (4.2) | | | | 3. Deposits | 2,10,342 | 2,23,057 | 9.2 | 6.0 | | | (61.8) | (59.1) | | | | 4. Borrowings | 85,723 | 1,07,207 | 2.0 | 25.1 | | | (25.2) | (28.4) | | | | 5. Other Liabilities | 22,301 | 22,648 | 16.9 | 1.6 | | | (6.6) | (6.0) | | | | Assets | | | | | | 1. Cash and Bank Balances | 10,229 | 14,360 | -32.6 | 40.4 | | | (3.0) | (3.8) | | | | 2. Investments | 1,12,828 | 1,29,329 | 9.4 | 14.6 | | | (33.2) | (34.3) | | | | 3. Loans and Advances | 1,99,943 | 2,11,794 | 8.9 | 5.9 | | | (58.8) | (56.1) | | | | 4. Accumulated Losses | 1,232 | 1,405 | 25.0 | 14.0 | | | (0.4) | (0.4) | | | | 5. Other Assets | 16,035 | 20,451 | 13.3 | 27.5 | | | (4.7) | (5.4) | | | | Total Liabilities/Assets | 3,40,267 | 3,77,338 | 7.3 | 10.9 | | | (100.0) | (100.0) | | | Notes: 1. Figures in parentheses are proportion to total liabilities/assets (in per cent).
2. Y-o-Y variations could be slightly different because absolute numbers have been rounded off to ₹1 Crore.
3. Components may not add up to the total due to rounding off.
4. During 2019-20, 13 DCCBs (except Mallapuram DCCB) in Kerala were amalgamated with Kerala StCB. The data of 13 DCCBs have been added to the StCB totals for previous years to facilitate comparison and compute growth rates.
Source: NABARD. |
| Table V.15: Select Balance Sheet Indicators of Scheduled State Co-operative Banks | | (Amount in ₹ crore) | | Item | 2016-17 | 2017-18 | 2018-19 | 2019-20* | 2020-21 | 2021-22 | | 1 | 2 | 3 | 4 | 5 | 6 | 7 | | Deposits | 90,277 | 98,768 | 1,10,559 | 1,87,456 | 1,97,751 | 2,11,784 | | | (13.5) | (9.4) | (11.9) | (69.6) | (5.5) | (7.1) | | Credit | 1,10,934 | 1,17,989 | 1,31,399 | 1,94,310 | 2,06,322 | 2,28,194 | | | (3.3) | (6.4) | (11.4) | (47.9) | (6.2) | (10.6) | | SLR Investments | 26,225 | 33,411 | 33,130 | 54,181 | 67,788 | 77,677 | | | (8.3) | (27.4) | -(0.8) | (63.5) | (25.1) | (14.6) | | Credit plus SLR Investments | 1,37,159 | 1,51,400 | 1,64,529 | 2,48,492 | 2,74,110 | 3,05,871 | | | (4.2) | (10.4) | (8.7) | (51.0) | (10.3) | (11.6) | Notes: 1. Data pertains to last reporting Friday of March of the corresponding year.
2. Figures in brackets are growth rates in per cent over previous year.
3. *: The high growth is mainly due to amalgamation of 13 District Central Co-operative Banks with Kerala State Co-operative Bank.
Source: Form B under Section 42 of RBI Act. | V.41 The contraction in profits was sharpest in the northern region, mainly contributed by the StCB in Jammu and Kashmir, which reported a loss of ₹24,751 lakhs. Combined with profit deceleration in the southern region, this dragged down gains registered across the country (Appendix Table V.3). Asset Quality V.42 After a deterioration in 2019-20, the NPA accretion of StCBs slowed down in 2020-21. A sharp increase in doubtful and loss accounts acted as a countervailing force to improvement in sub-standard assets, resulting in the NPAs to loan ratio remaining unchanged at 6.7 per cent, as in the previous year. The improvement in the NPA ratio in the eastern, central and southern regions was counterbalanced by deterioration in the other regions (Appendix Table V.3). A decline in the recovery ratio highlights the underlying weakness in the sector (Table V.17). 4.1.2 District Central Co-operative Banks V.43 District central co-operative banks (DCCBs), which constitute the second tier in the short-term rural co-operative structure, are operating in 20 states/ UTs with a network of 13,610 branches that are largely concentrated in the central region. They mobilise funds through public deposits, borrowing from StCBs and refinance from NABARD to lend to individual borrowers and third tier institutions, viz. PACS. Almost 60 per cent of the lending of DCCBs is through PACS. Being able to leverage their extensive branch network to garner deposits, DCCBs are less dependent on borrowings in comparison with StCBs. This also translates to lower C-D ratios than StCBs, although the outstanding credit of DCCBs is larger. | Table V.16: Financial Performance of State Co-operative Banks | | (Amount in ₹ Crore) | | Item | As during | Percentage Variation | | 2019-20 | 2020-21 | 2019-20 | 2020-21 | | 1 | 2 | 3 | 4 | 5 | | A. Income (i+ii) | 21,922 | 24,318 | -1.6 | 10.9 | | | (100.0) | (100.0) | | | | i. Interest Income | 20,014 | 23,177 | -6.4 | 15.8 | | | (91.3) | (95.3) | | | | ii. Other Income | 1,908 | 1,141 | 111.9 | -40.2 | | | (8.7) | (4.7) | | | | B. Expenditure (i+ii+iii) | 20,198 | 22,916 | -4.1 | 13.5 | | | (100.0) | (100.0) | | | | i. Interest Expended | 14,871 | 17,318 | -8.6 | 16.5 | | | (73.6) | (75.6) | | | | ii. Provisions and Contingencies | 2,646 | 2,181 | 67.6 | -17.6 | | | (13.1) | (9.5) | | | | iii. Operating Expenses | 2,681 | 3,418 | -16.4 | 27.5 | | | (13.3) | (14.9) | | | | Of which, Wage Bill | 1,491 | 1,926 | -14.3 | 29.1 | | | (7.4) | (8.4) | | | | C. Profits | | | | | | i. Operating Profits | 2,974 | 2,947 | 26.0 | -0.9 | | ii. Net Profits | 1,724 | 1,402 | 41.3 | -18.7 | Notes: 1. Figures in parentheses are proportion to total income/expenditure (in per cent).
2. Y-o-Y variations could be slightly different because absolute numbers have been rounded off to ₹1 Crore in the table.
3. Components may not add up to the total due to rounding off.
4. During 2019-20, 13 DCCBs (except Mallapuram DCCB) in Kerala were amalgamated with Kerala StCB. The data of 13 DCCBs have been added to the StCB totals for previous years to Facilitate comparison and compute growth rates.
Source: NABARD. |
| Table V.17: Soundness Indicators of State Co-operative Banks | | (Amount in ₹ Crore) | | Item | At end-March | Percentage Variation | | 2020 | 2021 | 2019-20 | 2020-21 | | 1 | 2 | 3 | 4 | 5 | | A. Total NPAs (i+ii+iii) | 13,477 | 14,113 | 35.2 | 4.7 | | i. Sub-standard | 7,883 | 7,379 | 67.3 | -6.4 | | | (58.5) | (52.3) | | | | ii. Doubtful | 4,400 | 5,294 | 9.7 | 20.3 | | | (32.6) | (37.5) | | | | iii. Loss | 1,195 | 1,440 | -4.1 | 20.5 | | | (8.9) | (10.2) | | | | B. NPAs to Loans Ratio (%) | 6.7 | 6.7 | - | - | | C. Recovery to Demand Ratio (%) | 94.4 | 90.5 | - | - | Notes: 1. Figures in parentheses are shares in total NPA (%).
2. Absolute numbers have been rounded off, leading to slight variations in per cent.
3. Components may not add up to the total due to rounding off.
4. During 2019-20, 13 DCCBs (except Mallapuram DCCB) in Kerala were amalgamated with Kerala StCB. The data of 13 DCCBs have been added to the StCB totals for previous years to facilitate comparison and compute growth rates.
5. Recovery position as on 30th June of the financial year.
Source: NABARD. | Balance Sheet Operations V.44 After a deceleration in 2019-20, the revival in the consolidated balance sheet growth of DCCBs in 2020-21 was led by deposits and borrowings on the liabilities side. This was matched by acceleration in loans and advances and investments on the asset side. The deceleration in accumulated losses for the second consecutive year is a sign of a strengthening balance sheet (Table V.18). Profitability V.45 Although both income and expenditure of DCCBs decelerated, the growth slowdown in the former was less severe than in the latter, resulting in higher profit growth (Table V.19). In particular, interest income growth outweighed interest expenses growth, boosting net interest income. | Table V.18: Liabilities and Assets of District Central Co-operative Banks | | (Amount in ₹ Crore) | | Item | At end-March | Percentage Variation | | 2020 | 2021 | 2019-20 | 2020-21 | | 1 | 2 | 3 | 4 | 5 | | Liabilities | | | | | | 1. Capital | 20,913 | 22,391 | 3.9 | 7.1 | | | (3.9) | (3.8) | | | | 2. Reserves | 22,332 | 24,381 | 7.5 | 9.2 | | | (4.2) | (4.1) | | | | 3. Deposits | 3,45,682 | 3,81,825 | 7.7 | 10.5 | | | (64.5) | (64.8) | | | | 4. Borrowings | 97,448 | 1,08,077 | 4.8 | 10.9 | | | (18.2) | (18.4) | | | | 5. Other Liabilities | 49,602 | 52,239 | 6.1 | 5.3 | | | (9.3) | (8.9) | | | | Assets | | | | | | 1. Cash and Bank Balances | 23,409 | 26,973 | -8.7 | 15.2 | | | (4.4) | (4.6) | | | | 2. Investments | 1,86,745 | 2,11,380 | 10.1 | 13.2 | | | (34.8) | (35.9) | | | | 3. Loans and Advances | 2,79,272 | 3,04,990 | 5.4 | 9.2 | | | (52.1) | (51.8) | | | | 4. Accumulated Losses | 6,721 | 7,046 | 9.5 | 4.8 | | | (1.3) | (1.2) | | | | 5. Other Assets | 39,830 | 38,525 | 13.1 | -3.3 | | | (7.4) | (6.5) | | | | Total Liabilities/Assets | 5,35,977 | 5,88,914 | 6.9 | 9.9 | | | (100.0) | (100.0) | | | Notes: 1. Figures in parentheses are proportion to total liabilities/assets (in per cent).
2. Y-o-Y variations could be slightly different because absolute numbers have been rounded off to ₹1 Crore in the table.
3. Components may not add up to the total due to rounding off.
4. During 2019-20, 13 DCCBs (except Mallapuram DCCB) in Kerala were amalgamated with Kerala StCB. The data of 13 DCCBs have been deducted from the DCCB totals for previous years to facilitate comparison and compute growth rates.
Source: NABARD. | V.46 The share of profit making entities increased across all regions. DCCBs in the southern and western regions contributed the lion’s share of all-India net profits. The acceleration in profits during 2020-21 within the western region was mainly contributed by Maharashtra, while in the southern region, Andhra Pradesh was the biggest contributor. (Appendix Table V.4). Asset Quality V.47 The asset quality of DCCBs has been worsening since 2016-17, when a number of states announced farm debt waiver schemes. In 2020-21, asset quality improved on the back of a fall in sub-standard assets and deceleration in doubtful assets. Concomitantly, their recovery to demand ratio was at its highest since 2016-17. The improvement in asset quality and recovery ratio was contributed by all the regions, except for the northern region. The southern region has the lowest NPA ratio and the highest recovery ratio (Table V.20 and Appendix Table V.4). | Table V.19: Financial Performance of District Central Co-operative Banks | | (Amount in ₹ Crore) | | Item | As during | Percentage Variation | | 2019-20 | 2020-21 | 2019-20 | 2020-21 | | 1 | 2 | 3 | 4 | 5 | | A. Income (i+ii) | 38,398 | 39,982 | 7.3 | 4.1 | | | (100.0) | (100.0) | | | | i. Interest Income | 36,473 | 38,089 | 7.3 | 4.4 | | | (95) | (95.3) | | | | ii. Other Income | 1,924 | 1,893 | 8.0 | -1.6 | | | (5) | (4.7) | | | | B. Expenditure (i+ii+iii) | 37,552 | 38,560 | 6.9 | 2.7 | | | (100.0) | (100.0) | | | | i. Interest Expended | 24,830 | 25,480 | 7.9 | 2.6 | | | (66.1) | (66.1) | | | | ii. Provisions and Contingencies | 3,886 | 3,720 | 8.0 | -4.3 | | | (10.3) | (9.6) | | | | iii. Operating Expenses | 8,836 | 9,361 | 3.9 | 5.9 | | | (23.5) | (24.3) | | | | Of which, Wage Bill | 5,663 | 5,864 | 5.4 | 3.6 | | | (15.1) | (15.2) | | | | C. Profits | | | | | | i. Operating Profits | 4,229 | 4,723 | 11.8 | 11.7 | | ii. Net Profits | 846 | 1,422 | 28.4 | 68.1 | Notes: 1. Figures in parentheses are in proportion to total income/ expenditure (in per cent).
2. Y-o-Y variations could be slightly different because absolute numbers have been rounded off to ₹1 Crore in the table.
3. Components may not add up to the total due to rounding off.
4. During 2019-20, 13 DCCBs (except Mallapuram DCCB) in Kerala were amalgamated with Kerala StCB. The data of 13 DCCBs have been deducted from the DCCB totals for previous years to facilitate comparison and compute growth rates.
Source: NABARD. | 4.1.3 Primary Agricultural Credit Societies V.48 Primary Agricultural Credit Societies (PACS) are the grass root level institutions in the short-term rural co-operative structure. Historically, they have raised resources through both borrowings and deposits for providing short-term and medium-term agricultural credit, especially to marginal farmers. They also undertake a gamut of other activities, including supply of agricultural inputs, distribution of consumer articles and marketing of produce for their members. | Table V.20: Soundness Indicators of District Central Co-operative Banks | | (Amount in ₹ Crore) | | Item | At end-March | Percentage Variation | | 2020 | 2021 | 2019-20 | 2020-21 | | 1 | 2 | 3 | 4 | 5 | | A. Total NPAs (i+ ii + iii) | 35,298 | 34,761 | 10.3 | -1.5 | | i) Sub- standard | 15,885 | 13,940 | 1.6 | -12.2 | | | (45) | (40.1) | | | | ii) Doubtful | 16,990 | 18,367 | 22.1 | 8.1 | | | (48.1) | (52.8) | | | | iii) Loss | 2,423 | 2,455 | -0.6 | 1.3 | | | (6.9) | (7.1) | | | | B. NPAs to Loans Ratio (%) | 12.6 | 11.4 | - | - | | C. Recovery to Demand Ratio (%) | 70.2 | 74.9 | - | - | Notes: 1. Figures in parentheses are proportion to total NPAs (in per cent).
2. Y-o-y variations could be slightly different because absolute numbers have been rounded off to ₹1 Crore in the table.
3. Components may not add up to the total due to rounding off.
4. During 2019-20, 13 DCCBs (except Mallapuram DCCB) in Kerala were amalgamated with Kerala StCB. The data of 13 DCCBs have been deducted from the DCCB totals for previous years to facilitate comparison and compute growth rates.
5. Recovery Position as on 30th June of corresponding FY.
Source: NABARD. | V.49 At end-March 2021, PACS served 13.7 crore members and 5.4 crore borrowers. They have a dominant presence in the western region (mainly Maharashtra), followed by the eastern region. The borrower-to-member ratio — a metric to gauge credit penetration of PACS — was progressively declining from 39.6 per cent in 2016-17 to 38 per cent in 2019-20. During 2020-2021 however, the ratio increased to 39.1 per cent, mainly reflecting a fall in total membership and a rise in total number of borrowers9. Rural artisans’ and ‘other and marginal farmers’ share rose in the membership (Appendix Table V.7). V.50 The asset quality measured in terms of the NPA ratio of StCBs and DCCBs has historically been better than PACS. Additionally their recovery ratio has also remained at its lowest level for two consecutive years (Table V.13 and Chart V.18). V.51 The total resources of PACS decelerated during 2020-21. Notwithstanding significant increase in the government’s contribution, owned funds contracted in 2020-21, reflective of erosion in membership base, and leading to a negative growth in paid up capital (Appendix Table V.5). In line with their mandate, PACS extend proportionately more short-term loans than medium-term loans. During the year under review, both short-and medium-term loans grew at around 2 per cent, thus maintaining the share of short-term loans in the total at 88 per cent. V.52 The business model of PACS is largely tilted towards lending to agriculture. At end-March 2021, its share in total lending was high at 80 per cent. On y-o-y growth basis, however, their agriculture lending decelerated to 3.9 per cent as compared with 6.8 per cent in the preceding year. V.53 More than half of the PACS were profitable during the year, outweighing the losses incurred by the other half. Region-wise aggregation reveals that only the northern region was profitable with more than 70 per cent societies in profit, contributed mainly by Haryana and Rajasthan. The losses were the highest in the southern region, mainly contributed by Kerala and Tamil Nadu (Appendix Table V.6). 4.2 Long-term Rural Co-operatives V.54 Long-term rural co-operatives were established for providing funds for investment in agriculture — including land development, farm mechanisation and minor irrigation — rural industries and housing. This structure consists of 13 state co-operative agriculture and rural development banks (SCARDBs) operating at the state level and 603 primary co-operative agriculture and rural development banks (PCARDBs) operating at the district/block level. The structure of long-term rural co-operatives differs across states. States like Jammu and Kashmir, Tripura, Uttar Pradesh, Gujarat and Puducherry follow a unitary structure i.e., SCARDBs operate through their own branches with no separate PCARDBs. On the other hand, states like Haryana, Punjab, Rajasthan, Karnataka, Kerala, and Tamil Nadu follow a federal structure wherein SCARDBs lend through PCARDBs. In two states viz. Himachal Pradesh and West Bengal, SCARDBs operate through PCARDBs as well as through their own branches. V.55 The business model of SCARDBs and PCARDBs depends heavily on borrowings; the former borrow from institutions such as NABARD for direct lending as well as lending through PCARDBs. The financial health of PCARDBs is, however, more fragile than SCARDBs, given the high share of accumulated losses on their balance sheets (Chart V.19). 4.2.1 State Co-operative Agriculture and Rural Development Banks (SCARDBs) V.56 SCARDBs are operating in 13 states, with 794 branches of which the maximum number of branches are in Uttar Pradesh. The consolidated balance sheet of SCARDBs expanded in 2020-21, albeit marginally, after witnessing contraction for three consecutive years. The expansion was led by a turnaround in deposits on liabilities side and continuing acceleration in loans and advances on the assets side (Appendix V.8). V.57 Although both income — interest as well as non-interest — and expenditure contracted as compared with the previous year, the fall in the former outweighed that of the latter, leading to a deterioration in profitability (Appendix Table V.9). V.58 NPAs of SCARDBs decelerated in 2020-21 on account of a contraction in sub-standard assets. The recovery to demand ratio improved in 2020-21 in comparison to 2019-20, largely contributed by Himachal Pradesh, West Bengal, Karnataka, and Kerala (Appendix Table V.10 and V.11). 4.2.2 Primary Co-operative Agriculture and Rural Development Banks (PCARDBs) V.59 The consolidated balance sheet of PCARDBs decelerated during 2020-21 on the back of a contraction in loans and advances on the asset side as well as borrowings on the liabilities side (Appendix Table V.12). V.60 The operating profit of PCARDBs accelerated as their income growth surpassed growth in expenditure. However, as their provision requirements remained high, the historical trend of net losses continued (Appendix Table V.13). On the positive side, NPA accretion has slowed down in 2020-21 on a fall in sub-standard assets (Appendix Table V.14). The recovery to demand ratio has fallen for all states, except Himachal Pradesh and West Bengal (Appendix Table V.15). 5. Overall Assessment V.61 During 2021-22, the performance of UCBs improved on all parameters — capital buffers, asset quality and profitability. The amalgamation of a large stressed UCB helped in shoring up the performance of the sector, however, a close monitoring is needed to ensure viability of other stressed and weak UCBs. The performance of some segments of the rural co-operatives also needs improvement. Recent legal and regulatory measures initiated by the Reserve Bank are likely to bolster the financial health of the sector, enabling it to perform the role as conduit of financial inclusion more effectively.
|