1. Introduction 2.1 The fiscal health of the States bounced back in 2021-22 from a sharp pandemic-induced deterioration in the preceding year. Prudent fiscal management has continued into 2022-23 as reflected in budget estimates (BE). 2.2 This chapter analyses the fiscal performance of States in 2020-21 and 2021-22 as a backdrop to an evaluation of their BE for 2022-23. The rest of this chapter is divided into seven sections. Section 2 presents key fiscal indicators of the State governments. Section 3 and Section 4 analyse revenue and expenditure patterns, respectively. Section 5 throws light on actual fiscal outcomes during 2022-23 so far and the outlook for the remaining part of the year. Section 6 describes the financing pattern of the consolidated fiscal deficit of the States. Section 7 profiles their debt position, including contingent liabilities. Section 8 sets out some concluding observations. 2. Key Fiscal Indicators 2.3 In 2020-21, States’ consolidated gross fiscal deficit (GFD) rose to 4.1 per cent of gross domestic product (GDP), the highest level since 2004-05 (Chart II.1). The spike, however, was short-lived and a reversion to consolidation was crafted in 2021-22 (PA)1 taking the GFD down to 2.8 per cent of GDP, as against the BE of 3.5 per cent and RE of 3.7 per cent for that year. This correction was brought about by higher-than-expected growth in both tax and non-tax revenues. 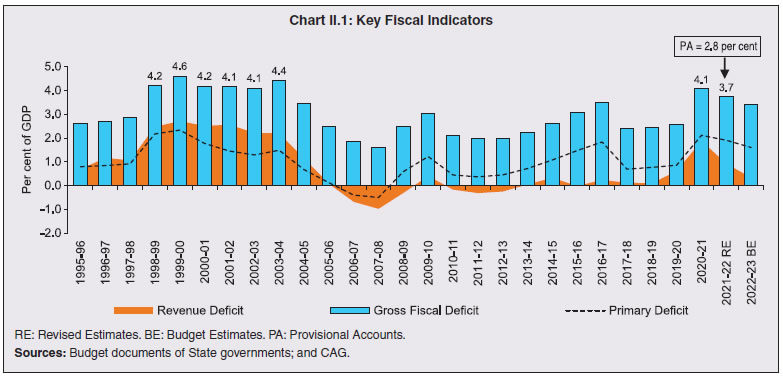
| Table II.1: Major Deficit Indicators - All States and Union Territories with Legislature | | (₹ lakh crore) | | Item | 2007-12 (Average) | 2012-17 (Average) | 2018-19 | 2019-20 | 2020-21 | 2021-22 (BE) | 2021-22 (RE) | 2021-22 (PA) | 2022-23 (BE) | | 1 | 2 | 3 | 4 | 5 | 6 | 7 | 8 | 9 | 10 | | Gross Fiscal Deficit | 1.48 | 3.47 | 4.63 | 5.25 | 8.05 | 8.29 | 8.83 | 6.67 | 8.83 | | (Per cent of GDP) | (2.2) | (2.7) | (2.5) | (2.6) | (4.1) | (3.5) | (3.7) | (2.8) | (3.4) | | Revenue Deficit | -0.16 | 0.10 | 0.18 | 1.21 | 3.71 | 1.28 | 2.16 | 1.01 | 0.84 | | (Per cent of GDP) | (-0.3) | (0.1) | (0.1) | (0.6) | (1.9) | (0.5) | (0.9) | (0.4) | (0.3) | | Primary Deficit | 0.30 | 1.48 | 1.44 | 1.73 | 4.18 | 3.90 | 4.50 | 2.53 | 4.12 | | (Per cent of GDP) | (0.4) | (1.1) | (0.8) | (0.9) | (2.1) | (1.6) | (1.9) | (1.1) | (1.6) | BE: Budget Estimates. RE: Revised Estimates. PA: Provisional Accounts.
Notes: 1. Negative (-) sign indicates surplus.
2. GDP at current market prices is based on the National Statistical Office (NSO)’s National Accounts 2011-12 series.
Source: Budget documents of State governments. | 2.4 A similar improvement was recorded in their revenue and primary deficits (Table II.1; Annex I). 2.5 For 2022-23, the States have budgeted a consolidated GFD of 3.4 per cent of GDP, which is within the indicative target of 4 per cent2 set by the Centre, albeit, with substantial inter-State variations3 (Table II.2). 3. Receipts 2.6 States’ revenue collections declined in 2020-21 on account of the pandemic-induced slump in own tax revenue, non-tax revenue and tax devolution from the Centre (Table II.3). Within own tax revenue, the decline was prominent in the case of States’ goods and services tax (SGST) and vehicle tax. In contrast, their excise collections increased due to an increase in duties on alcohol. Non-tax revenue plummeted in 2020-21, mainly reflecting lower earnings from general services4. Under central transfers, lower tax devolution was broad-based, except for income tax. This was, however, more than offset by a 49 per cent jump in Finance Commission grants5 during the year. 2.7 For 2021-22, States budgeted a sharp rise in revenue receipts led by own tax and non-tax revenues and grants from the Centre. In the RE, however, revenues outperformed BE, with a broad-based recovery in own tax and non-tax revenue, supported by higher tax devolution and grants from the Centre. Yet, unaudited data released by the CAG indicate lower revenue collections than in the revised estimates. In terms of these provisional accounts, the grant component declined in 2021-22. Increasingly over recent years, RE often provide ambiguous signals about the health of State finances (Box II.1). | Table II.2: Deficit Indicators - State-wise | | (Per cent of GSDP) | | State | 2020-21 | 2021-22 (RE) | 2022-23 (BE) | | RD | GFD | PD | RD | GFD | PD | RD | GFD | PD | | 1 | 2 | 3 | 4 | 5 | 6 | 7 | 8 | 9 | 10 | | 1 Andhra Pradesh | 3.5 | 5.4 | 3.5 | 1.6 | 3.2 | 1.4 | 1.3 | 3.6 | 2.0 | | 2 Arunachal Pradesh | -12.9 | 3.5 | 1.1 | -18.9 | 2.2 | -0.1 | -15.5 | 1.7 | -0.5 | | 3 Assam | -0.4 | 3.3 | 1.7 | 1.0 | 9.5 | 7.7 | -0.7 | 3.5 | 1.8 | | 4 Bihar | 1.9 | 5.1 | 3.0 | 5.5 | 11.4 | 9.2 | -0.6 | 3.5 | 1.3 | | 5 Chhattisgarh | 2.0 | 4.5 | 2.9 | 0.3 | 3.8 | 2.1 | -0.2 | 3.3 | 1.7 | | 6 Goa | 0.9 | 3.6 | 1.7 | 0.0 | 8.6 | 6.2 | -0.5 | 5.4 | 2.9 | | 7 Gujarat | 1.4 | 2.5 | 1.0 | 0.0 | 1.5 | 0.2 | 0.0 | 1.7 | 0.4 | | 8 Haryana | 3.0 | 3.8 | 1.5 | 1.4 | 3.0 | 0.8 | 1.0 | 3.0 | 0.9 | | 9 Himachal Pradesh | 0.1 | 3.6 | 0.8 | -0.2 | 4.0 | 1.3 | 2.0 | 5.0 | 2.3 | | 10 Jharkhand | 1.0 | 5.0 | 3.0 | -0.1 | 3.2 | 1.4 | -1.8 | 3.0 | 1.2 | | 11 Karnataka | 1.1 | 3.9 | 2.6 | 0.3 | 2.4 | 1.0 | 0.6 | 2.7 | 1.4 | | 12 Kerala | 3.2 | 5.1 | 2.5 | 3.5 | 5.1 | 2.7 | 2.3 | 3.9 | 1.3 | | 13 Madhya Pradesh | 1.9 | 5.1 | 3.5 | 0.5 | 3.7 | 1.9 | 0.3 | 4.0 | 2.3 | | 14 Maharashtra | 1.5 | 2.6 | 1.3 | 1.0 | 2.8 | 1.5 | 0.7 | 2.5 | 1.2 | | 15 Manipur | -1.6 | 5.5 | 3.1 | -10.8 | 10.0 | 7.7 | -15.7 | 6.6 | 4.3 | | 16 Meghalaya | 2.3 | 7.5 | 5.0 | -3.4 | 4.2 | 1.4 | -1.6 | 4.5 | 1.8 | | 17 Mizoram | 4.3 | 10.4 | 8.1 | 0.9 | 8.4 | 6.3 | -5.8 | 4.9 | 3.1 | | 18 Nagaland | -1.2 | 4.3 | 1.5 | -1.4 | 6.1 | 3.4 | -4.5 | 3.6 | 0.9 | | 19 Odisha | -1.7 | 1.8 | 0.6 | -3.3 | 0.4 | -0.6 | -2.5 | 3.0 | 1.8 | | 20 Punjab | 3.2 | 4.2 | 0.8 | 3.6 | 5.6 | 2.3 | 2.0 | 3.7 | 0.6 | | 21 Rajasthan | 4.3 | 5.9 | 3.4 | 3.0 | 5.2 | 2.8 | 1.8 | 4.4 | 2.2 | | 22 Sikkim | 2.4 | 7.1 | 5.4 | -2.1 | 4.7 | 2.9 | -0.2 | 3.6 | 1.9 | | 23 Tamil Nadu | 3.4 | 5.2 | 3.2 | 2.7 | 4.4 | 2.4 | 2.2 | 4.1 | 2.1 | | 24 Telangana | 2.3 | 5.1 | 3.3 | -0.4 | 3.9 | 2.4 | -0.3 | 4.0 | 2.6 | | 25 Tripura | 2.0 | 3.5 | 1.1 | 1.1 | 5.2 | 2.9 | 0.7 | 6.3 | 4.4 | | 26 Uttar Pradesh | 0.1 | 3.3 | 1.0 | -1.2 | 4.0 | 1.7 | -2.0 | 3.7 | 1.6 | | 27 Uttarakhand | -0.5 | 2.3 | 0.3 | -0.9 | 1.9 | -0.4 | -0.9 | 3.1 | 0.9 | | 28 West Bengal | 2.3 | 3.4 | 0.8 | 2.1 | 3.5 | 1.1 | 1.7 | 3.6 | 1.4 | | 29 Jammu and Kashmir | 0.1 | 6.3 | 2.5 | -9.1 | 6.8 | 3.2 | -10.4 | 7.6 | 4.0 | | 30 Delhi | -0.2 | 0.9 | 0.5 | 0.3 | 1.6 | 1.2 | -0.8 | 0.9 | 0.6 | | 31 Puducherry | 1.8 | 2.4 | 0.3 | 1.4 | 2.1 | -0.3 | -0.4 | 1.2 | -1.1 | | All States and UTs | 1.9 | 4.1 | 2.1 | 0.9 | 3.7 | 1.9 | 0.3 | 3.4 | 1.6 | RE: Revised Estimates. BE: Budget Estimates. RD: Revenue Deficit. GFD: Gross Fiscal Deficit. PD: Primary Deficit.
Note: Negative (-) sign in deficit indicators indicates surplus.
Source: Budget documents of State governments. |
| Table II.3: Aggregate Receipts of State Governments and UTs | | (₹ lakh crore) | | Item | 2017-18 | 2018-19 | 2019-20 | 2020-21 | 2021-22 (RE) | 2022-23 (BE) | | 1 | 2 | 3 | 4 | 5 | 6 | 7 | | 1. Revenue Receipts (a+b) | 23.21 | 26.20 | 26.70 | 25.87 | 33.53 | 38.57 | | | (13.6) | (13.9) | (13.3) | (13.1) | (14.2) | (14.9) | | a. States’ Own Revenue (i+ii) | 13.10 | 14.34 | 14.85 | 13.48 | 17.79 | 21.11 | | | (7.7) | (7.6) | (7.4) | (6.8) | (7.5) | (8.2) | | i. States’ Own Tax | 11.30 | 12.15 | 12.24 | 11.72 | 15.21 | 17.87 | | | (6.6) | (6.4) | (6.1) | (5.9) | (6.4) | (6.9) | | ii. States’ Own Non-Tax | 1.80 | 2.19 | 2.61 | 1.76 | 2.58 | 3.24 | | | (1.1) | (1.2) | (1.3) | (0.9) | (1.1) | (1.3) | | b. Central Transfers (i+ii) | 10.11 | 11.87 | 11.85 | 12.39 | 15.74 | 17.46 | | | (5.9) | (6.3) | (5.9) | (6.3) | (6.7) | (6.8) | | i. Shareable Taxes | 6.05 | 7.47 | 6.51 | 5.95 | 7.40 | 8.29 | | | (3.5) | (4.0) | (3.2) | (3.0) | (3.1) | (3.2) | | ii. Grants-in Aid | 4.06 | 4.40 | 5.35 | 6.44 | 8.34 | 9.16 | | | (2.4) | (2.3) | (2.7) | (3.3) | (3.5) | (3.6) | | 2. Non-Debt Capital Receipts (i+ii) | 0.40 | 0.42 | 0.57 | 0.23 | 0.27 | 0.20 | | | (0.2) | (0.2) | (0.3) | (0.1) | (0.1) | (0.1) | | i. Recovery of Loans and Advances | 0.40 | 0.41 | 0.57 | 0.13 | 0.20 | 0.14 | | | (0.2) | (0.2) | (0.3) | (0.1) | (0.1) | (0.1) | | ii. Miscellaneous Capital Receipts | 0.00 | 0.01 | 0.00 | 0.10 | 0.07 | 0.06 | | | (0.0) | (0.0) | (0.0) | (0.0) | (0.0) | (0.0) | RE: Revised Estimates. BE: Budget Estimates.
Note: Figures in parentheses are per cent of GDP.
Source: Budget documents of State governments. |
Box II.1:
States’ Fiscal Marksmanship Considerable uncertainty surrounds forecasts of State finances. Consequently, these data get revised at different points in time with the flow of new information. The discrepancies between BE, RE and actuals reflect errors in assumptions or the occurrence of unexpected events. This typically leads to supplementary demand for grants or advances from contingency funds. While it is fair to assume that RE should be closer to actuals than BE – RE contain actual data for the first half of a particular year – the empirical experience has been that RE are higher than BE and actuals, especially in recent years (Chart 1a). A formal evaluation of accuracy of forecast by examining forecast errors (actual GFD minus GFD in RE/BE) using methods like mean error (ME), Mean Absolute Error (MAE), Root Mean Square Error (RMSE) and U Theil statistics indicates that the error/deviation is higher in RE than BE (Table 1). Generally, final accounts turn out to be lower than the BE and substantially so with respect to RE. | Table 1: Forecast Errors | | | Mean Error | Mean Absolute Error | Root Mean Square Error | U Theil Statistics | | Budget Estimates | 0.04 | 0.29 | 0.34 | 0.07 | | Revised Estimates | -0.43 | 0.43 | 0.46 | 0.08 | | Sources: RBI staff estimates. | At a disaggregated level, the deviation of RE from BE arises mainly from the side of revenue receipts – tax revenue (Chart 1b). On the other hand, actual outcomes reveal a broad-based downward revision in most of the components relative to RE. The overestimation in RE vis-a-vis BE is most prominent for Bihar and Uttar Pradesh (Chart 2a). In the case of Bihar, budget provisions for spending are enhanced during the year through supplementary budgets. In the case of Uttar Pradesh, the deviation mainly reflects higher than budgeted allocation towards capital outlay. Actual expenditures are pulled down by surrender of unutilised allocated resources towards the end of the year (Chart 2b, c and d). As a consequence, market borrowings of States turn out to be much lower than their borrowing calendars but yields in bond markets are disproportionately pushed up by budgetary announcements. |
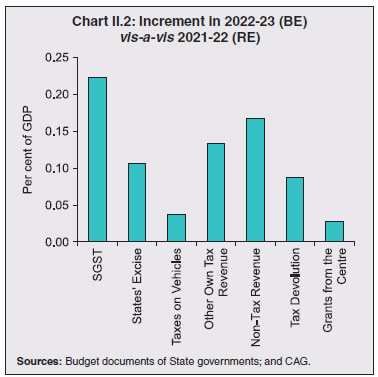 2.8 States have budgeted for higher revenue receipts in 2022-23, driven primarily by SGST, excise duties, and sales tax collections (Chart II.2). Non-tax revenue is also expected to increase, driven by industry and general services. Tax devolution is budgeted to increase on expectations of higher revenue collections by the Centre. 2.9 State governments have initiated various measures to augment their own revenue sources. For instance, Kerala and Rajasthan adopted an amnesty scheme6 in 2020-21 to provide relief to taxpayers as well as to improve their own revenue collections. The scheme, which encompasses various taxes like SGST, stamp and registration duties, motor vehicle tax and excise duties, has been extended to 2022-23. Maharashtra has also introduced the scheme in 2022-23. Punjab has proposed to set up a Tax Intelligence Unit to improve tax compliance under GST. Chhattisgarh is planning to constitute a ';Karai Vardhan Cell'; for the augmentation of revenue by analysis/ review of taxation acts/rules and tax rates on the basis of data available in the revenue collection departments. Other revenue-generating measures include Assam’s liquidation scheme for payment of arrears, Haryana’s one-time scheme for settlement of old VAT dues, and Assam and Kerala’s Green tax to discourage old vehicles. Additionally, Haryana has taken measures for phased monetization of assets. States have also undertaken specific fiscal reform measures, based on the fifteenth Finance Commission’s (FC-XV) suggestions aimed at improving revenue sources (Annex II). 4. Expenditure Revenue Expenditure 2.10 States’ revenue expenditure had increased sharply in 2020-21, reflecting the response to the COVID-19 pandemic (Table II.4). Under the developmental head, higher spending was made towards social services such as medical and public health, urban development, relief on account of natural calamities, social security and welfare. Under economic services, higher allocations were provided for rural development, crop husbandry, and transport and communication. Some States also adopted expenditure rationalisation measures like dearness allowance (DA) freeze, deferment of part or full salaries and wages, and deduction from salaries to create fiscal space for accommodating higher expenditure on medical and social services. | Table II.4: Expenditure Pattern of State Governments and UTs | | (₹ lakh crore) | | | 2017-18 | 2018-19 | 2019-20 | 2020-21 | 2021-22 (RE) | 2022-23 (BE) | | 1 | 2 | 3 | 4 | 5 | 6 | 7 | | Aggregate Expenditure (1+2 or 3+4+5) | 27.72 | 31.25 | 32.52 | 34.15 | 42.63 | 47.60 | | | (16.2) | (16.5) | (16.2) | (17.2) | (18.0) | (18.5) | | 1. Revenue Expenditure | 23.40 | 26.38 | 27.92 | 29.58 | 35.69 | 39.41 | | of which: | (13.7) | (14.0) | (13.9) | (14.9) | (15.1) | (15.3) | | Interest Payments | 2.93 | 3.19 | 3.51 | 3.87 | 4.34 | 4.71 | | | (1.7) | (1.7) | (1.8) | (2.0) | (1.8) | (1.8) | | 2. Capital Expenditure | 4.31 | 4.87 | 4.60 | 4.57 | 6.94 | 8.19 | | of which: | (2.5) | (2.6) | (2.3) | (2.3) | (2.9) | (3.2) | | Capital Outlay | 3.94 | 4.40 | 4.18 | 4.14 | 6.34 | 7.54 | | | (2.3) | (2.3) | (2.1) | (2.1) | (2.7) | (2.9) | | 3. Development Expenditure | 18.77 | 21.01 | 21.63 | 22.64 | 29.22 | 32.35 | | | (11.0) | (11.1) | (10.8) | (11.4) | (12.3) | (12.5) | | 4. Non-Development Expenditure | 8.26 | 9.44 | 10.05 | 10.63 | 12.41 | 14.19 | | | (4.8) | (5.0) | (5.0) | (5.4) | (5.2) | (5.5) | | 5. Others* | 0.68 | 0.80 | 0.83 | 0.88 | 1.00 | 1.06 | | | (0.4) | (0.4) | (0.4) | (0.4) | (0.5) | (0.5) | RE: Revised Estimates. BE: Budget Estimates.
*: Includes grants-in-aid and contributions including compensation and assignments to local bodies.
Notes: 1. Figures in parentheses are per cent of GDP.
2. Capital expenditure includes capital outlay, and loans and advances by the State governments.
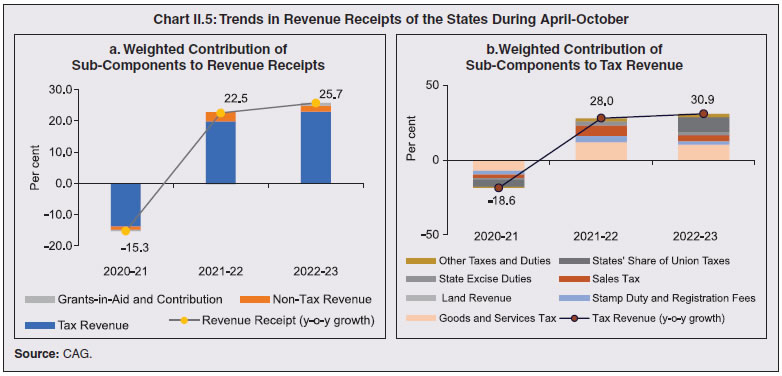
Source: Budget documents of State governments. | 2.11 The revenue expenditure of States increased by 20.7 per cent7 in 2021-22 (RE), mainly on account of increase in developmental spending on medical and public health, water supply and sanitation and social security and welfare. 2.12 For 2022-23, States have budgeted an increase in revenue spending, mainly led by non-developmental expenditure such as pension and administrative services. Budget allocations towards medical and public health and natural calamities have been lowered, while housing outlay has been increased. Committed expenditure, comprising interest payments, administrative services and pension, is expected to increase marginally from 2021-22 (RE) (Chart II.3). Social sector expenditure is also budgeted to increase slightly in 2022-23, led by the welfare spending for scheduled castes, scheduled tribes and other backward classes (Chart II.4). Capital Expenditure 2.13 Capital outlay of States recorded a robust growth of 31.7 per cent in 2021-22 (PA). Strong growth in tax and non-tax revenues, coupled with advancement of payment by the Centre of tax devolution and GST compensation, provided the required fiscal space to accelerate capex. The consolidated capital outlay8 of the States is budgeted to grow by 38.4 per cent in 2022-23 (over 2021-22 PA). Accordingly, the capital outlay-GDP ratio is expected to improve from 2.3 per cent in 2021-22 (PA) to 2.9 per cent in 2022-23 (BE). 5. Actual Outcome in 2022-23 So Far and Outlook 2.14 Fiscal parameters of States have remained robust during April-October 20229. GFD and RD declined both in absolute terms, and as a proportion to BE. This was enabled by growth in revenue collections, with SGST and States’ share in the Union taxes being the top contributors (Chart II.5). The upsurge in tax devolution to the States results from a stronger than expected tax mop-up by the Centre due to higher buoyancy in direct tax collections and strong GST, partly on account of rising formalization of the economy. The GST compensation cess ceased from July 2022, even though the GST Council extended the period for the levy of the GST compensation cess up to March 31, 2026, for repaying back-to-back loans taken during the pandemic to meet the shortfall in compensation cess collections. The consolidated GST revenue of the States, comprising SGST and devolution from CGST, however, is budgeted to be higher in 2022-23 (Box II.2). Non-tax revenue of the States continued to grow at a healthy rate albeit at a slower pace than the previous year. 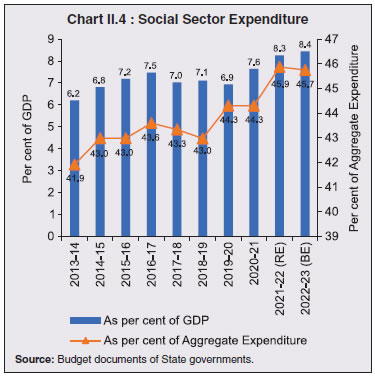
Box II.2:
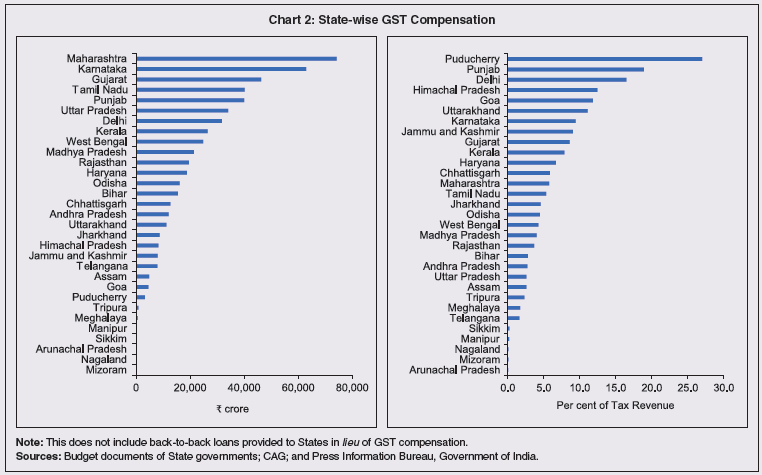
Goods and Services Tax (GST) – Performance So Far and the Road Ahead The Goods and Services Tax (GST) was introduced in India on July 1, 2017. June 30, 2022 marked the end of the transition period during which States were compensated for any loss in revenue due to implementation, calculated as the difference between the projected revenue based on 14 per cent annual growth with 2015-16 as the base year and the actual GST revenue10. Thus, States were effectively guaranteed a minimum annual increase in revenue of 14 per cent during the transition period. The compensation to States was being met through the levy of a GST compensation cess on specified goods and services. In the first two years of implementation of GST, the collections from the GST compensation cess were higher than the disbursement of compensation to States, but this reversed in 2019-20 (Chart 1). In the wake of the pandemic, GST collections nosedived, and the corpus available in the GST Compensation Cess Fund was insufficient to meet the compensation demand from States. The Union government resorted to market borrowings of ₹1.10 lakh crore and ₹1.59 lakh crore in 2020-21 and 2021-22, respectively, to provide back-to-back loans to States in lieu of the GST compensation shortfall11. However, both principal and interest on such borrowings are to be repaid by the Centre from the collections through the GST compensation cess, whose timeline has accordingly been extended to March 2026. The requirement for GST compensation has varied widely across States. During the five-year transition period (July 2017 to June 2022), the top five compensation receiving States were Maharashtra, Karnataka, Gujarat, Tamil Nadu and Punjab. However, the States which are likely to be most adversely affected by the end of the compensation regime are Puducherry, Punjab, Delhi, Himachal Pradesh, Goa and Uttarakhand for which the share of GST compensation in tax revenue has exceeded 10 per cent on an average (Chart 2). Overall, the north-eastern States have been the biggest beneficiaries in the GST regime, recording a compound annual GST revenue growth rate of 27.5 per cent since the implementation of the GST (2017-18 to 2022-23) as against 14.8 per cent for all States. 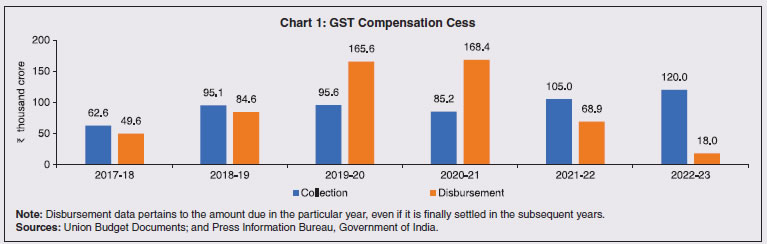
 The consolidated GST revenue of all States, comprising SGST and devolution from CGST is budgeted higher than revenue projected in 2022-23 with the guaranteed 14 per cent annual growth (Chart 3). Ten States are expected to fall short of 14 per cent GST growth, as per their budget estimates (Chart 4). Going forward, in the absence of GST compensation, the States need to augment their revenue by increasing compliance, plugging leakages and widening of tax bases.
|
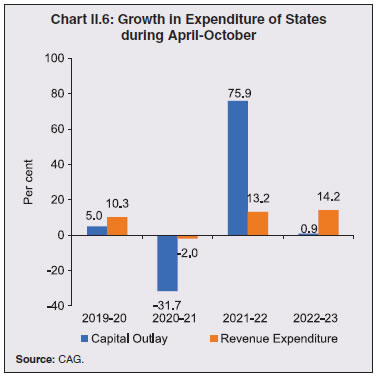 2.15 Revenue spending recorded a growth of 14.2 per cent during April-October 2022 (Chart II.6). The capital outlay of the States registered a y-o-y growth of 0.9 per cent in April-October 2022. This low capital outlay partly reflects the tendency to back-load expenditure in the latter half of the year. The expenditure pattern of States also reveals that they do not always expend the full amount of their budgeted expenditure by the year end, even with sufficient fiscal headroom. 2.16 Despite persisting headwinds, States’ fiscal outlook remains favourable on expectations of high growth in revenue receipts than initial estimates on account of strong GST collections and higher tax devolution. Additionally, capital outlay, which remained muted in initial months, is expected to pick up in H2:2022-23 as States make efforts to meet budgeted capex targets, supported by resource availability through relaxation in the norms for off-budget borrowings12, front-loading of post devolution revenue deficit grants, advance instalments of tax devolution and payment of GST compensation cess. The Centre has already made two advance instalments of tax devolution to the States in August and November. Additionally, the Centre sanctioned ₹77,110 crore13 to States under the Scheme for Special Assistance to States for Capital Investment14. 6. Financing of GFD and Market Borrowing by State Governments and UTs Financing of GFD 2.17 On average, market borrowings financed slightly more than half of the consolidated fiscal deficit of States till 2016-17. States’ dependence on market borrowing has increased significantly following the recommendation of the Fourteenth Finance Commission (FC-XIV) to exclude States from the National Small Savings Fund (NSSF) financing facility (barring Delhi, Madhya Pradesh, Kerala and Arunachal Pradesh). Since 2017-18, the share of market borrowings has increased rapidly and is budgeted to reach 78.1 per cent in 2022-23. Market Borrowings 2.18 The gross market borrowings of States/UTs contracted by 12.2 per cent to ₹7.02 lakh crore in 2021-22 from ₹7.99 lakh crore a year ago. The lower borrowing was partly on account of improved revenue collections by the States. During 2022-23 so far (April-December), the gross market borrowings at ₹4.57 lakh crore have been 1.89 per cent lower than the corresponding period of last year (Chart II.7). 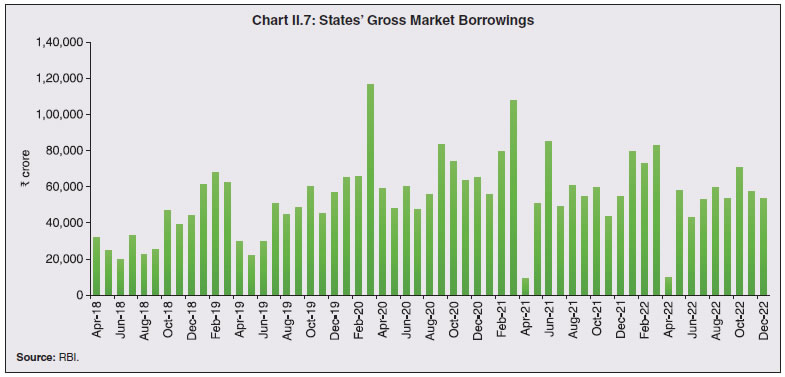 2.19 Similarly, net market borrowings (i.e., gross market borrowings net of repayments) of States and UTs contracted by 24.4 per cent to ₹4.92 lakh crore in 2021-22 from ₹6.52 lakh crore in 2020-21. Net market borrowing was mainly concentrated in a few States like Tamil Nadu, Karnataka, Uttar Pradesh, Maharashtra, Andhra Pradesh and West Bengal (Chart II.8). During 2022-23 so far (up to end-December, 2022), the net market borrowing by the States was ₹3.02 lakh crore. States are expected to raise ₹3.41 lakh crore (gross) during January - March 2023. During the first nine months of 2022-23, the actual market borrowings of the States were much lower than the indicative calendar. For the remaining part of the year, the quantum of issuance by the States is likely to be influenced by the size of monthly tax devolution, the release of the pending GST compensation, the disbursement of interest-free capex loans to States and actual capital spending. 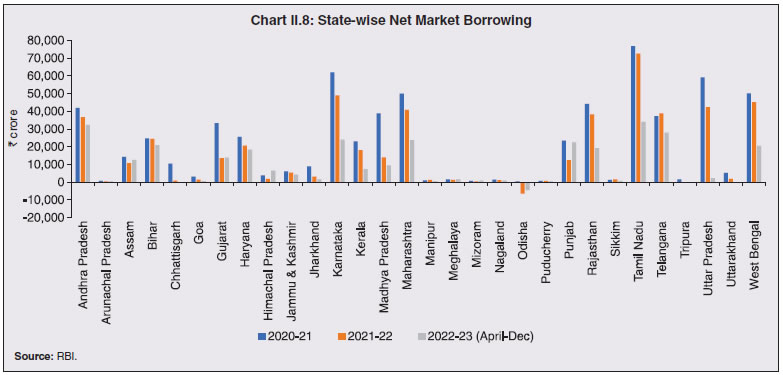 2.20 During 2021-22, the States undertook 608 issuances (of which 60 were re-issuances), compared with 742 issuances (of which 56 were re-issuances) in 2020-21. In line with the policy of passive consolidation15, Haryana, Madhya Pradesh, Maharashtra, Meghalaya, Punjab, Rajasthan and Tamil Nadu undertook re-issuances in 2021-22. During 2022-23 so far (up to end-December, 2022), out of 403 issuances undertaken by States, 37 were re-issuances (Table II.5). 2.21 The issuances in 10-year maturity amounted to 35.1 per cent of the total amount of issuances in 2021-22, lower from 36.3 per cent a year ago. The rest (64.9 per cent) was spread across other maturities. Twenty-one States and two UTs (Puducherry and Jammu and Kashmir) issued securities of various maturities, ranging between 2 and 35 years. Though 63.3 per cent of the outstanding State government securities is in the residual maturity bucket of five years and above (Table II.6), redemption pressure is expected to remain high till 2030-31 (Chart II.9a). 2.22 Yields on State government securities hardened during 2022-23, tracking movements in yields on Central government securities impacted by global spill overs (Chart II.9b). | Table II.5: Market Borrowings of State Governments | | (₹ crore) | | Item | 2018-19 | 2019-20 | 2020-21 | 2021-22 | 2022-23* | | 1 | 2 | 3 | 4 | 5 | 6 | | 1. Maturities during the year | 1,29,680 | 1,47,067 | 1,47,039 | 2,09,143 | 2,39,562# | | 2. Gross sanction under Article 293(3) | 5,50,071 | 7,12,744 | 9,69,525 | 8,95,166 | 6,42,808 | | 3. Gross amount raised during the year | 4,78,323 | 6,34,521 | 7,98,816 | 7,01,626 | 4,57,458* | | 4. Net amount raised during the year | 3,48,643 | 4,87,454 | 6,51,777 | 4,92,483 | 3,02,653* | | 5. Amount raised during the year to total sanctions (per cent) | 87 | 89 | 82 | 78 | 71 | | 6. Weighted average yield of SDLs/SGSs (per cent) | 8.32 | 7.24 | 6.55 | 6.98 | 7.73 | | 7. Weighted average spread over corresponding G-Sec (bps) | 65 | 55 | 53 | 41 | 31 | | 8. Average inter-State spread (bps) | 6 | 6 | 10 | 4 | 3 | *: As on end-December, 2022.
#: Data for maturity pertain to full year.
Source: RBI. |
Table II.6: Maturity Profile of Outstanding State Government Securities
(As at end-March 2022) | | (Per cent) | | State/UT | Per Cent of Total Amount Outstanding | | less than 1Y | 1- 5Y | 5-10Y | 10-20Y | Above 20Y | | 1 | 2 | 3 | 4 | 5 | 6 | | Andhra Pradesh | 4.2 | 26.3 | 28.2 | 41.3 | - | | Arunachal Pradesh | 2.8 | 18.6 | 78.6 | - | - | | Assam | 1.5 | 30.8 | 67.7 | - | - | | Bihar | 5.9 | 44.1 | 50.0 | - | - | | Chhattisgarh | 6.8 | 51.5 | 41.7 | - | - | | Goa | 4.9 | 26.3 | 68.8 | - | - | | Gujarat | 5.8 | 35.9 | 58.4 | - | - | | Haryana | 7.9 | 36.0 | 33.5 | 22.6 | - | | Himachal Pradesh | 5.6 | 31.7 | 47.1 | 15.5 | - | | Jammu and Kashmir | 4.8 | 18.9 | 52.1 | 24.3 | - | | Jharkhand | 6.9 | 34.1 | 32.0 | 27.0 | - | | Karnataka | 3.2 | 27.8 | 46.6 | 22.3 | - | | Kerala | 8.0 | 35.1 | 37.4 | 17.5 | 2.1 | | Madhya Pradesh | 7.1 | 32.4 | 37.6 | 22.4 | 0.5 | | Maharashtra | 7.7 | 35.3 | 44.0 | 13.0 | - | | Manipur | 3.3 | 24.5 | 72.2 | - | - | | Meghalaya | 4.0 | 30.3 | 58.8 | 7.0 | - | | Mizoram | 4.6 | 21.2 | 45.5 | 28.8 | - | | Nagaland | 6.4 | 30.9 | 62.7 | - | - | | Odisha | 26.3 | 40.8 | 17.2 | 14.0 | 1.8 | | Puducherry | 6.6 | 36.3 | 44.8 | 12.3 | - | | Punjab | 6.6 | 24.5 | 44.1 | 21.3 | 3.5 | | Rajasthan | 5.3 | 37.3 | 51.0 | 4.4 | 2.1 | | Sikkim | 1.2 | 24.4 | 74.4 | - | - | | Tamil Nadu | 4.5 | 32.4 | 45.3 | 7.0 | 10.8 | | Telangana | 3.7 | 24.0 | 14.9 | 28.4 | 29.0 | | Tripura | 6.0 | 21.1 | 58.8 | 14.1 | - | | Uttar Pradesh | 3.1 | 25.9 | 70.2 | 0.8 | - | | Uttarakhand | 4.0 | 32.8 | 63.2 | - | - | | West Bengal | 5.3 | 26.3 | 33.2 | 34.8 | 0.4 | | All States and UTs | 5.4 | 31.3 | 44.5 | 15.6 | 3.2 | -: Nil.
Source: RBI. | 2.23 In Q1:2021-22, the State Government Securities (SGSs)16 yields hardened, notwithstanding the G-sec acquisition programme (G-SAP) and special open market operations (OMOs) conducted by the Reserve Bank. The release of higher-than-expected CPI inflation figures for May 2021 and the increase in crude oil prices also contributed to the hardening of the SGS yields. Yields softened in Q2:2021-22 due to lower CPI inflation prints for June and July but started hardening again in Q3:2021-22, mainly tracking the unwinding of accommodative monetary policy measures by major central banks and the rise in crude oil prices. Hardening of yields continued during Q4:2021-22 reflecting geo-political risks driving up crude oil and commodity prices and the aggressive policy normalization measures by major central banks. 2.24 Overall, the weighted average (cut-off) yield (WAY) of SGSs issued during 2021-22 stood at 6.98 per cent as compared to 6.55 per cent in the previous year. The weighted average spread of SGS issuances over the corresponding tenor of Central government-dated securities narrowed to 41 bps in 2021-22 as compared to 53 bps in the previous year. The average inter-State spread for 10 years maturity during 2021-22 stood at 4 bps as against 10 bps a year ago. 2.25 During 2022-23 so far (up to December 31, 2022), the WAY of SGSs stood at 7.73 per cent, while the weighted average spread of SGS issuances over the corresponding tenor of Central government dated securities stood at 31 bps. Financial Accommodation to States 2.26 The Reserve Bank offers three short-term liquidity windows – special drawing facility (SDF); ways and means advances (WMA); and overdraft (OD) facilities – to States and two UTs to help them tide over temporary mismatches in cash flows. The aggregate WMA limit for States/UTs was fixed at ₹51,560 crore for the second consecutive year in 2021-22, which was 60 per cent higher than the earlier limit of ₹32,225 crore as on March 31, 2020. The Reserve Bank also relaxed the OD scheme to tide over mismatches in cash flows, increasing the number of days a State/UT can be in OD continuously to 21 working days from 14 working days, and in a quarter to 50 working days from 36 working days, valid till March 31, 2022. On a review of the limits and keeping in view the gradual lifting of COVID-19 restrictions, it was decided to fix the WMA limits and timelines for OD for States/UTs as recommended by the Advisory Committee on Ways and Means Advances to State Governments (Chairman: Shri Sudhir Shrivastava) effective from April 01, 2022. Accordingly, the WMA limit for State Governments/UTs was fixed at ₹47,010 crore. 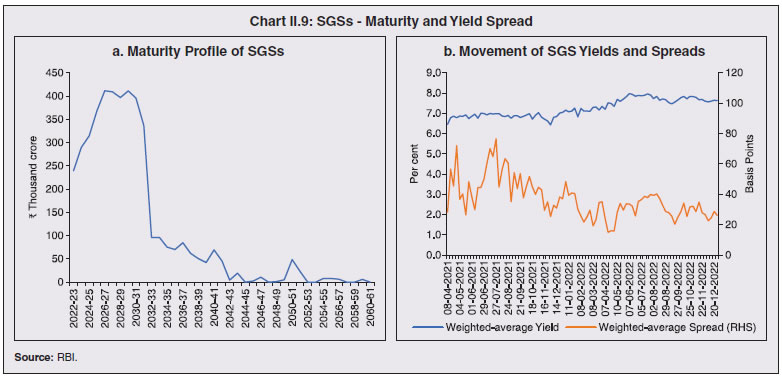 2.27 The State Governments/UTs can avail of overdraft for 14 consecutive days and be in OD for a maximum number of 36 days in a quarter. Seventeen States/UTs availed the SDF, fourteen States/UTs resorted to WMA, and nine States/UTs availed OD in 2021-22. During 2022-23 so far (April-December), seventeen States have availed SDF, eleven States/UTs resorted to WMA and ten States/UTs availed OD. Cash Management of State Governments 2.28 In recent years, States have been accumulating sizeable cash surpluses in intermediate treasury bills (ITBs) and auction treasury bills (ATBs). Although positive cash balances indicate low intra-year fiscal pressure, they involve a interest rate negative carry, warranting improvement in cash management practices. Outstanding investments of State governments in 14-day ITBs and ATBs stood at ₹2,16,272 crore and ₹87,400 crore, respectively, as on March 31, 2022 as against ₹2,05,230 crore and ₹41,293 crore, respectively, as on March 31, 2021. As on December 31, 2022, the outstanding investments of States in ITBs stood at ₹1,76,208 crore, while their outstanding investments in ATBs stood at ₹1,12,420 crore. States’ Reserve Funds 2.29 It is desirable for States to keep adequate buffers to minimise the fiscal stress arising from redemption pressures and unforeseen liabilities. For this purpose, the States maintain a Consolidated Sinking Fund (CSF) and a Guarantee Redemption Fund (GRF) with the Reserve Bank. The States can also avail SDF at a discounted rate from the Reserve Bank against incremental funds invested in CSF and GRF. So far, twenty-four States and one Union Territory, i.e., Puducherry, have set up CSF. Currently, nineteen States are members of the GRF (Table II.7). 7. Outstanding Liabilities 2.30 States’ debt to GDP ratio increased sharply at end-March 2021 to meet pandemic related expenditure (Table II.8). This ratio is estimated to decline slightly by end-March 2022 but is budgeted higher at 29.5 per cent by end-March 2023. At a disaggregated level, the ratio is expected to be higher than 25 per cent17 for 26 States and UTs at end-March 2023 (Statement 20). Table II.7: Investment in CSF/GRF by States and UTs
(As on March 31, 2022) | | (₹ crore) | | State | CSF | GRF | CSF as per cent of Outstanding Liabilities | | 1 | 2 | 3 | 4 | | Andhra Pradesh | 9,360 | 922 | 2.4 | | Arunachal Pradesh | 2,027 | 3 | 14.0 | | Assam | 2,886 | 71 | 2.8 | | Bihar | 6,299 | - | 2.4 | | Chhattisgarh | 5,578 | - | 5.2 | | Goa | 712 | 350 | 2.5 | | Gujarat | 7,033 | 539 | 1.8 | | Haryana | 1,363 | 1,364 | 0.5 | | Himachal Pradesh | - | - | - | | Jammu & Kashmir UT | - | - | - | | Jharkhand | 506 | - | 0.4 | | Karnataka | 10,393 | 0 | 2.2 | | Kerala | 2,425 | - | 0.7 | | Madhya Pradesh | - | 1,035 | - | | Maharashtra | 52,606 | 929 | 8.8 | | Manipur | 174 | 113 | 1.2 | | Meghalaya | 882 | 62 | 5.6 | | Mizoram | 440 | 53 | 3.8 | | Nagaland | 1,863 | 38 | 12.4 | | Odisha | 14,682 | 1,646 | 11.4 | | Puducherry | 381 | - | 3.4 | | Punjab | 3,027 | 0 | 1.1 | | Rajasthan | - | - | - | | Tamil Nadu | 7,492 | - | 1.1 | | Telangana | 6,389 | 1,397 | 2.0 | | Tripura | 684 | 15 | 3.0 | | Uttar Pradesh | 3,018 | - | 0.5 | | Uttarakhand | 3,889 | 154 | 4.9 | | West Bengal | 10,145 | 708 | 1.8 | | Total | 1,54,255 | 9,399 | 2.6 | ‘-’ : Indicates no fund is maintained.
Source: RBI. |
| Table II.8: Outstanding Liabilities of State Governments and UTs | | Year | Amount | Annual Growth | Debt /GDP | | (End-March) | (₹ lakh crore) | (Per cent) | | 1 | 2 | 3 | 4 | | 2014 | 25.10 | 11.8 | 22.3 | | 2015 | 27.43 | 9.3 | 22.0 | | 2016 | 32.59 | 18.8 | 23.7 | | 2017 | 38.59 | 18.4 | 25.1 | | 2018 | 42.92 | 11.2 | 25.1 | | 2019 | 47.87 | 11.5 | 25.3 | | 2020 | 53.51 | 11.8 | 26.7 | | 2021 | 61.55 | 15.0 | 31.1 | | 2022 (RE) | 67.94 | 10.4 | 28.7 | | 2023 (BE) | 76.10 | 12.0 | 29.5 | RE: Revised Estimates. BE: Budget Estimates.
Sources: 1. Budget documents of State governments.
2. Combined finance and revenue accounts of the Union and the State governments in India, Comptroller and Auditor General (CAG) of India.
3. Ministry of Finance, Government of India.
4. Reserve Bank records. | 2.31 The debt service ratio - measured in terms of interest payment to revenue receipts (IP-RR) ratio – which increased sharply in 2020-21, has moderated in 2021-22 and 2022-23, mainly on account of robust revenue receipts (Chart II.10). Composition of Debt 2.32 As stated earlier, rise in States’ debt levels was primarily led by higher market borrowings and higher borrowings from the Centre. On the other hand, the shares of special securities issued to National Small Saving Funds (NSSF), loans from banks and financial institutions and public accounts declined in 2020-21 (Table II.9). The share of market borrowings in total outstanding liabilities of the State governments is budgeted to increase in 2022-23. Similarly, loans from the Centre are also expected to increase in view of the 50-year interest-free loans being provided by the Centre under the scheme of Special Assistance to the States for Capital Investment. 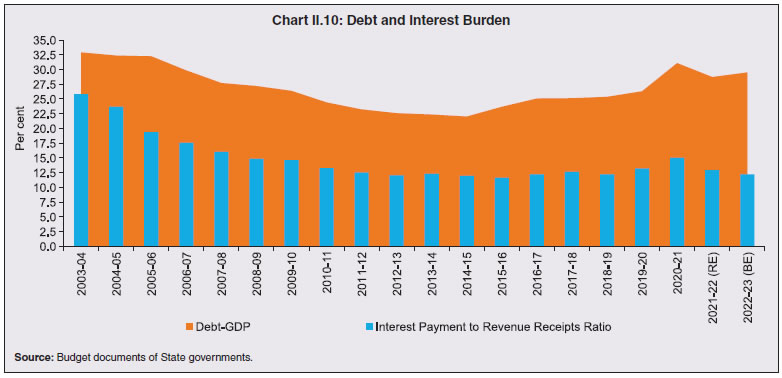
Table II.9: Composition of Outstanding Liabilities of State Governments and UTs
(As at end-March) | | (Per cent) | | Item | 2017 | 2018 | 2019 | 2020 | 2021 | 2022 RE | 2023 BE | | 1 | 2 | 3 | 4 | 5 | 6 | 7 | 8 | | Total Liabilities (1 to 4) | 100.0 | 100.0 | 100.0 | 100.0 | 100.0 | 100.0 | 100.0 | | 1. Internal Debt | 73.3 | 72.7 | 72.2 | 73.5 | 74.0 | 73.8 | 75.3 | | of which: | | | | | | | | | (i) Market Loans | 48.8 | 51.4 | 53.5 | 57.2 | 60.5 | 62.4 | 64.7 | | (ii) Special Securities Issued to NSSF | 13.3 | 11.1 | 9.2 | 7.7 | 6.1 | 5.1 | 4.1 | | (iii) Loans from Banks and Financial Institutions | 5.2 | 4.9 | 4.8 | 4.8 | 4.2 | 4.3 | 4.3 | | 2. Loans and Advances from the Centre | 4.0 | 3.8 | 3.6 | 3.0 | 5.1 | 6.7 | 6.9 | | 3. Public Account (i to iii) | 22.6 | 23.5 | 24.1 | 23.4 | 20.8 | 19.4 | 17.7 | | (i) State PF, etc. | 10.7 | 10.3 | 10.2 | 9.8 | 8.8 | 8.5 | 8.1 | | (ii) Reserve Funds | 3.2 | 4.1 | 4.2 | 3.8 | 3.4 | 3.0 | 2.6 | | (iii) Deposits & Advances | 8.7 | 9.1 | 9.7 | 9.7 | 8.6 | 7.9 | 7.0 | | 4. Contingency Fund | 0.1 | 0.1 | 0.1 | 0.1 | 0.1 | 0.1 | 0.1 | RE: Revised Estimates. BE: Budget Estimates.
Source: Budget documents of State governments. | Contingent Liabilities of States 2.33 State government guarantees increased sharply by end-March 2021, which has implications for their debt sustainability (Table II.10). | Table II.10: Guarantees issued by State Governments | | Year (End-March) | Guarantees Outstanding | | ₹ lakh crore | Per cent of GDP | | 1 | 2 | 3 | | 2014 | 3.79 | 3.4 | | 2015 | 4.28 | 3.4 | | 2016 | 3.64 | 2.6 | | 2017 | 3.12 | 2.0 | | 2018 | 4.30 | 2.5 | | 2019 | 5.38 | 2.8 | | 2020 | 5.94 | 2.9 | | 2021 | 7.40 | 3.7 | Note: Outstanding guarantees for 21 States and UTs was 2.1 per cent of GDP by end-March 2022 as against 2.0 per cent in the end- March 2021.
Source: State governments. | 8. Conclusion 2.34 While the first two waves of the pandemic posed a major fiscal management challenge for States following revenue shortfalls and the compelling need for higher spending, the subsequent waves had a relatively milder impact on their finances. Accordingly, the States could bring down their gross fiscal deficit below the Fiscal Responsibility Legislation (FRL) target of 3 per cent of GDP in 2021-22. In 2022-23, the budgeted GFD of 3.4 per cent of GDP is higher but within the target of 4 per cent set by the Centre. The budgeted debt-GDP ratio of States, however, continues to remain significantly higher than 20 per cent recommended by the FRBM Review Committee, 2018 (Chairman: N. K. Singh). 2.35 The fiscal outlook for States remains favourable for the rest of the year and capital expenditure is expected to gain momentum in the second half. 2.36 While the outstanding liabilities of States have moderated from their pandemic time peaks, debt consolidation at the individual State level warrants urgent attention and a glide path needs to be set, keeping in view the need for rebuilding fiscal space to deal with future shocks.
Annex I:
Fiscal Position of 31 States and UTs | | (₹ lakh crore) | | | 2019-20 | 2020-21 | 2021-22 (RE) | 2021-22 (PA) | 2022-23 (BE) | | I. Revenue Receipts | 26.70 | 25.87 | 33.53 | 32.24 | 38.57 | | | (13.3) | (13.1) | (14.2) | (13.6) | (15.0) | | a) Tax Revenue | 18.75 | 17.67 | 22.61 | 23.56 | 26.17 | | | (9.3) | (8.9) | (9.6) | (10.0) | (10.1) | | b) Non-Tax Revenue | 2.61 | 1.76 | 2.58 | 2.45 | 3.24 | | | (1.3) | (0.9) | (1.1) | (1.0) | (1.3) | | c) Grants from the Centre | 5.35 | 6.44 | 8.34 | 6.23 | 9.17 | | | (2.7) | (3.3) | (3.5) | (2.6) | (3.6) | | II. Capital Receipts (Non-debt) | 0.57 | 0.23 | 0.27 | 0.22 | 0.20 | | | (0.3) | (0.1) | (0.1) | (0.1) | (0.1) | | a) Recovery of Loans and Advances | 0.57 | 0.13 | 0.20 | 0.21 | 0.14 | | | (0.3) | (0.1) | (0.1) | (0.1) | (0.1) | | b) Other Receipts | 0.00 | 0.10 | 0.07 | 0.02 | 0.06 | | | (0.0) | (0.1) | (0.0) | (0.0) | (0.0) | | III. Revenue Expenditure | 27.92 | 29.58 | 35.69 | 33.26 | 39.41 | | | (13.9) | (14.9) | (15.1) | (14.1) | (15.3) | | Of which: Interest Payments | 3.51 | 3.87 | 4.34 | 4.14 | 4.71 | | | (1.8) | (2.0) | (1.8) | (1.7) | (1.8) | | IV. Capital Expenditure | 4.60 | 4.57 | 6.94 | 5.89 | 8.19 | | | (2.3) | (2.3) | (2.9) | (2.5) | (3.2) | | a) Capital Outlay | 4.18 | 4.14 | 6.34 | 5.45 | 7.54 | | | (2.1) | (2.1) | (2.7) | (2.3) | (2.9) | | b) Loans and Advances by States | 0.42 | 0.43 | 0.60 | 0.44 | 0.65 | | | (0.2) | (0.2) | (0.3) | (0.2) | (0.3) | | Key Deficit Indicators | | V. Revenue Deficit | 1.21 | 3.71 | 2.16 | 1.01 | 0.84 | | | (0.6) | (1.9) | (0.9) | (0.4) | (0.3) | | VI. Gross Fiscal Deficit | 5.25 | 8.05 | 8.83 | 6.67 | 8.82 | | | (2.6) | (4.1) | (3.7) | (2.8) | (3.4) | | VII. Primary Deficit | 1.73 | 4.18 | 4.50 | 2.53 | 4.12 | | | (0.9) | (2.1) | (1.9) | (1.1) | (1.6) | Notes: (1) Figures in parentheses are per cent of GDP.
(2) Data for 2021-22 Provisional Accounts (PA) are accounts figures of 28 States and UTs available with CAG and for the remaining 3 States/UTs 2021-22 Budget Estimates (BE) figures are used to arrive at all States and UTs.
Sources: Budget documents of State governments and CAG. |
Annex II:
Fiscal Reform by States The fifteenth Finance Commission (FC-XV) has assessed the fiscal challenges facing States through a survey of State-level macroeconomic, socioeconomic and fiscal indicators as well as the status of health infrastructure, power sector and local bodies’ finances. On this basis, specific reform signposts have been provided as guidance to enable States to chart a sustainable development path through fiscal policy actions. -
States’ high dependence on Union transfers, rising incidence of contingent liabilities due to PSUs, unsustainable debt and deteriorating trends in fiscal ratios warrant improvement in key fiscal ratios [viz., debt-GSDP, own tax revenue-GSDP, non-tax revenue-GSDP and revenue deficit-fiscal deficit (RD-FD)]; -
States need to ensure a sustainable stream of revenue from alternative sources such as electricity and mining; -
States with distorted expenditure patterns like low social sector spending, low capital expenditure and high committed expenditure relative to comparable cohorts should undertake corrections through rationalisation/rebalancing of expenditure; -
high dependency ratios due to rising old age population, sustained and widening gender disparity, and emerging issues like air pollution and water stress need to be addressed; -
sectors that require special attention like tourism, power projects, urban infrastructure and skilling of youth have been identified. Actions have been taken by various States in response to these recommendations (Table 1). | Table 1: FC-XV Suggestions – Action Taken by States | | Category | FC Reform Suggestions | Actions Reported/Taken by the State | | Fiscal Trends | Tamil Nadu needs to revert to its pre-2014 RD-FD ratio and invest the borrowings fully into capital expenditure. | The State has reduced RD-FD ratio from 71.0 per cent in 2020-2021 to 63.1 per cent in 2021-22. The ratio was below 20 per cent during 2010-11 to 2013-14. | | Revenue Trends | Karnataka’s tax revenue (post-GST) has not improved as much as the States in its class and post 2022 this could pose a challenge for Karnataka. | Karnataka government has taken steps to reform GST administration such as:
(a) redeployment of officers to areas where there is more scope to collect additional revenue;
(b) effective monitoring of enforcement activities by taking up data-based inspections and road vigilance to curb the revenue leakage;
(c) launch of E-Shodhane software to take up issue-based GST audit cases involving large revenues. | | | Himachal Pradesh has not done well in terms of GST collections. It needs to find innovative ways to increase both its own tax and non-tax revenues. | The State government is monitoring its top taxpayers and keeping a close watch on risky taxpayers. The Government has started Tax Haat Program, Himachal Pradesh (Legacy Cases Resolution) Scheme, Himachal Pradesh Swarn Jayanti (Legacy Case Resolution) Scheme and has set up Traders Facilitation Cell for enhancing revenue earning. | | Expenditure Trends | Bihar needs to spend more on social sector and with greater efficiency to ensure best outcomes in the shortest possible time. | The share of social sector expenditure in the total expenditure of Bihar has seen an impressive rise from 35.1 per cent in 2016-17 to 42.7 per cent in 2020-21. | | Demographic and Social Aspects | The age dependency ratio for Kerala (at 19.6 as per Census 2011) is the highest among Indian States. Kerala is ageing faster than the rest of the country. Therefore, the State needs to focus on systemic provisioning for welfare of the elderly. | Based on the Census 2011, total population in Kerala was 3.34 crore. Old age population in Kerala was 65.46 lakh. Out of this, 29.43 lakh, 3.88 lakh and 12.08 lakh elderly people are given Indira Gandhi National Old age Pension, Agriculture Labour Pension and Welfare Fund Board pension, respectively. Besides, around 4.45 lakh people are service pensioners (State, Central, Inter-State, International and family Pension). Thus, as a whole, 49.84 lakh people get pension from one way or other and this constitutes 76.13 per cent of the total old age people. This implies that 76.13 per cent of the total old age people in Kerala are covered under different pension schemes. | | Economic Aspects | Himachal Pradesh should speed up the execution of the ongoing hydel projects and improve infrastructure for tourism to increase scope for greater revenue earnings. | The Himachal government has notified the new “Swarn Urja Niti” 2021 and has also prepared Vision Document 2030. This includes generation of 10,000 MW of additional green energy by the year 2030. This will result in annual revenue of more than ₹4,000 crore from sale of electricity.
Regarding tourism Infrastructure, the State government has identified 15 sites to develop rural tourism in the State. The work of conservation and infrastructure upgradation of major temple complexes at Dharamshala and Mcleodganj, restoration and upgradation of Chamunda and Brajeshwari temple complexes, construction of a traditional art and craft culture centre at Nagroa-Bagwan, and rejuvenation of Markendeya temple complex and eco-tourism park at Naldehra have been completed. Besides, Dharamshala ropeway has also been made functional. | | Source: Respective State Governments, which have responded. |
|