Today, the Reserve Bank released the results of September 2023 round of its bi-monthly consumer confidence survey (CCS)1. The survey collects current perceptions (vis-à-vis a year ago) and one year ahead expectations of households on general economic situation, employment scenario, overall price situation and own income and spending across 19 major cities. The latest round of the survey was conducted during September 2-11, 2023, covering 6,077 respondents. Female respondents accounted for 50.3 per cent of this sample. Highlights: -
Consumer confidence for the current period reverted to its recovery path after a brief pause in July 2023 round of the survey; the current situation index (CSI)2 reached a four-year high on the back of respondents' better assessment of current general economic situation and employment conditions in September 2023 (Chart 1; Tables 1 and 2). -
General economic outlook as well as the prospects for employment, income and spending are expected to improve further over the next one year; the future expectations index (FEI) also reached a four-year high in the latest survey round (Chart 1; Tables 1, 2, 5 and 6). -
Households remain highly optimistic on future earnings even though their sentiment on current earnings remained around its July 2023 level (Table 5). -
Respondents were less pessimistic on prevailing price levels and inflation, when compared to a year ago. Though price expectations for the year ahead remain negative, respondents’ pessimism on this front has moderated in the latest survey round (Tables 3 and 4). 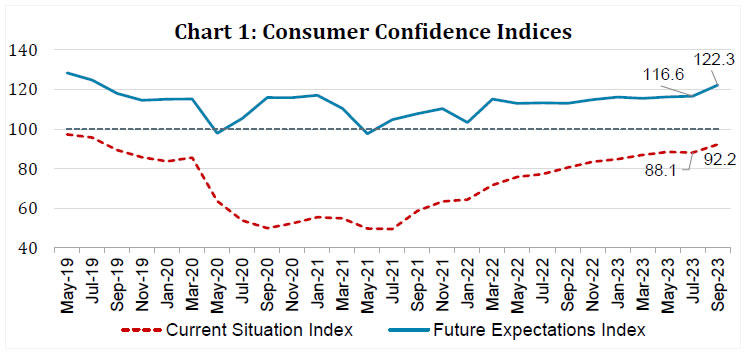 Note: Please see the excel file for time series data.3
| Table 1: Perceptions and Expectations on the General Economic Situation | | (Percentage responses) | | Survey Round | Current Perception | One year ahead Expectation | | Increased | Remained Same | Decreased | Net Response | Will Increase | Will Remain Same | Will Decrease | Net Response | | Sep-22 | 26.2 | 14.6 | 59.2 | -33.0 | 46.5 | 15.4 | 38.1 | 8.4 | | Nov-22 | 28.0 | 16.3 | 55.7 | -27.8 | 48.0 | 15.6 | 36.4 | 11.6 | | Jan-23 | 28.3 | 19.6 | 52.1 | -23.7 | 50.2 | 16.6 | 33.2 | 17.0 | | Mar-23 | 31.4 | 16.9 | 51.7 | -20.4 | 49.9 | 15.1 | 35.0 | 15.0 | | May-23 | 32.1 | 19.0 | 48.9 | -16.8 | 51.0 | 15.8 | 33.2 | 17.8 | | Jul-23 | 30.4 | 18.5 | 51.1 | -20.7 | 51.1 | 15.1 | 33.8 | 17.2 | | Sep-23 | 36.1 | 19.9 | 44.0 | -7.9 | 56.8 | 15.1 | 28.1 | 28.6 |
| Table 2: Perceptions and Expectations on Employment | | (Percentage responses) | | Survey Round | Current Perception | One year ahead Expectation | | Increased | Remained Same | Decreased | Net Response | Will Increase | Will Remain Same | Will Decrease | Net Response | | Sep-22 | 28.4 | 17.6 | 54.0 | -25.7 | 49.4 | 17.3 | 33.3 | 16.1 | | Nov-22 | 31.8 | 18.6 | 49.6 | -17.8 | 51.5 | 18.3 | 30.3 | 21.2 | | Jan-23 | 30.0 | 20.1 | 49.9 | -19.9 | 51.8 | 18.0 | 30.2 | 21.6 | | Mar-23 | 32.2 | 19.9 | 47.9 | -15.7 | 52.9 | 17.1 | 30.1 | 22.8 | | May-23 | 32.1 | 20.2 | 47.7 | -15.6 | 52.1 | 18.7 | 29.2 | 22.9 | | Jul-23 | 30.8 | 21.0 | 48.2 | -17.5 | 51.4 | 18.3 | 30.3 | 21.1 | | Sep-23 | 34.0 | 21.8 | 44.2 | -10.2 | 55.8 | 18.1 | 26.2 | 29.6 |
| Table 3: Perceptions and Expectations on Price Level | | (Percentage responses) | | Survey Round | Current Perception | One year ahead Expectation | | Increased | Remained Same | Decreased | Net Response | Will Increase | Will Remain Same | Will Decrease | Net Response | | Sep-22 | 94.6 | 4.3 | 1.1 | -93.6 | 79.9 | 11.0 | 9.1 | -70.8 | | Nov-22 | 94.9 | 4.1 | 1.0 | -93.9 | 82.2 | 9.3 | 8.6 | -73.6 | | Jan-23 | 93.6 | 5.0 | 1.3 | -92.3 | 83.0 | 10.1 | 7.0 | -76.1 | | Mar-23 | 93.8 | 5.2 | 1.0 | -92.9 | 84.3 | 9.0 | 6.7 | -77.5 | | May-23 | 92.2 | 6.4 | 1.4 | -90.8 | 82.7 | 10.0 | 7.3 | -75.4 | | Jul-23 | 92.7 | 6.0 | 1.3 | -91.4 | 80.9 | 10.2 | 8.9 | -72.0 | | Sep-23 | 91.8 | 6.4 | 1.8 | -90.0 | 78.4 | 9.9 | 11.7 | -66.8 |
| Table 4: Perceptions and Expectations on Rate of Change in Price Level (Inflation)* | | (Percentage responses) | | Survey Round | Current Perception | One year ahead Expectation | | Increased | Remained Same | Decreased | Net Response | Will Increase | Will Remain Same | Will Decrease | Net Response | | Sep-22 | 89.6 | 7.8 | 2.6 | -87.0 | 80.6 | 14.5 | 4.9 | -75.7 | | Nov-22 | 87.5 | 9.2 | 3.3 | -84.2 | 82.9 | 13.2 | 3.9 | -79.1 | | Jan-23 | 86.5 | 10.5 | 3.0 | -83.6 | 80.3 | 15.5 | 4.1 | -76.2 | | Mar-23 | 86.5 | 10.0 | 3.5 | -82.9 | 81.4 | 14.0 | 4.6 | -76.8 | | May-23 | 84.0 | 12.5 | 3.4 | -80.6 | 81.8 | 14.1 | 4.1 | -77.8 | | Jul-23 | 84.5 | 11.8 | 3.7 | -80.8 | 80.8 | 14.8 | 4.4 | -76.4 | | Sep-23 | 82.5 | 13.4 | 4.2 | -78.3 | 79.4 | 15.8 | 4.8 | -74.6 | | *Applicable only for those respondents who felt price has increased/price will increase. |
| Table 5: Perceptions and Expectations on Income | | (Percentage responses) | | Survey Round | Current Perception | One year ahead Expectation | | Increased | Remained Same | Decreased | Net Response | Will Increase | Will Remain Same | Will Decrease | Net Response | | Sep-22 | 20.2 | 45.5 | 34.4 | -14.2 | 51.3 | 39.8 | 8.9 | 42.4 | | Nov-22 | 20.9 | 46.1 | 32.9 | -12.0 | 52.5 | 39.9 | 7.6 | 44.9 | | Jan-23 | 21.4 | 49.0 | 29.6 | -8.3 | 54.5 | 38.7 | 6.9 | 47.6 | | Mar-23 | 22.2 | 49.7 | 28.1 | -5.9 | 54.1 | 38.4 | 7.5 | 46.7 | | May-23 | 23.9 | 49.7 | 26.3 | -2.4 | 53.8 | 39.4 | 6.9 | 46.9 | | Jul-23 | 25.4 | 49.9 | 24.8 | 0.6 | 54.7 | 38.6 | 6.7 | 48.0 | | Sep-23 | 25.0 | 49.8 | 25.2 | -0.3 | 55.7 | 37.8 | 6.5 | 49.2 |
| Table 6: Perceptions and Expectations on Spending | | (Percentage responses) | | Survey Round | Current Perception | One year ahead Expectation | | Increased | Remained Same | Decreased | Net Response | Will Increase | Will Remain Same | Will Decrease | Net Response | | Sep-22 | 75.9 | 17.5 | 6.6 | 69.2 | 74.2 | 20.7 | 5.2 | 69.0 | | Nov-22 | 74.9 | 19.2 | 5.9 | 69.0 | 75.0 | 20.3 | 4.7 | 70.2 | | Jan-23 | 73.9 | 20.6 | 5.5 | 68.4 | 75.5 | 19.8 | 4.7 | 70.8 | | Mar-23 | 75.0 | 19.6 | 5.4 | 69.6 | 75.4 | 19.9 | 4.6 | 70.8 | | May-23 | 73.4 | 21.3 | 5.3 | 68.1 | 73.8 | 21.7 | 4.6 | 69.2 | | Jul-23 | 74.5 | 20.5 | 5.0 | 69.6 | 73.8 | 21.3 | 4.8 | 69.0 | | Sep-23 | 74.6 | 20.2 | 5.2 | 69.4 | 75.2 | 20.3 | 4.6 | 70.6 |
| Table 7: Perceptions and Expectations on Spending- Essential Items | | (Percentage responses) | | Survey Round | Current Perception | One year ahead Expectation | | Increased | Remained Same | Decreased | Net Response | Will Increase | Will Remain Same | Will Decrease | Net Response | | Sep-22 | 85.2 | 10.7 | 4.1 | 81.1 | 80.9 | 15.4 | 3.7 | 77.3 | | Nov-22 | 84.7 | 11.6 | 3.7 | 81.0 | 81.1 | 15.4 | 3.5 | 77.7 | | Jan-23 | 84.1 | 12.3 | 3.6 | 80.5 | 81.3 | 15.2 | 3.5 | 77.8 | | Mar-23 | 85.3 | 11.5 | 3.2 | 82.1 | 81.7 | 14.8 | 3.5 | 78.2 | | May-23 | 84.0 | 12.8 | 3.2 | 80.8 | 81.3 | 15.2 | 3.5 | 77.8 | | Jul-23 | 85.3 | 11.8 | 3.0 | 82.3 | 81.0 | 15.5 | 3.5 | 77.5 | | Sep-23 | 84.9 | 11.9 | 3.2 | 81.7 | 82.0 | 14.4 | 3.6 | 78.4 |
| Table 8: Perceptions and Expectations on Spending- Non-Essential Items | | (Percentage responses) | | Survey Round | Current Perception | One year ahead Expectation | | Increased | Remained Same | Decreased | Net Response | Will Increase | Will Remain Same | Will Decrease | Net Response | | Sep-22 | 20.9 | 32.5 | 46.7 | -25.8 | 29.5 | 37.6 | 33.0 | -3.6 | | Nov-22 | 22.4 | 33.8 | 43.8 | -21.4 | 32.8 | 35.1 | 32.2 | 0.6 | | Jan-23 | 22.1 | 35.2 | 42.8 | -20.7 | 31.9 | 38.4 | 29.8 | 2.1 | | Mar-23 | 25.2 | 34.8 | 40.0 | -14.8 | 34.5 | 36.8 | 28.8 | 5.7 | | May-23 | 25.8 | 38.2 | 36.1 | -10.3 | 35.3 | 37.5 | 27.2 | 8.2 | | Jul-23 | 26.6 | 36.9 | 36.5 | -10.0 | 34.8 | 37.6 | 27.6 | 7.3 | | Sep-23 | 23.4 | 38.5 | 38.2 | -14.8 | 33.0 | 38.2 | 28.8 | 4.2 |
|