Today, the Reserve Bank released the results of November 2023 round of its bi-monthly consumer confidence survey (CCS)1. The survey collects current perceptions (vis-à-vis a year ago) and one year ahead expectations of households on general economic situation, employment scenario, overall price situation and own income and spending across 19 major cities. The latest round of the survey was conducted during November 2-11, 2023, covering 6,082 respondents. Female respondents accounted for 52.8 per cent of this sample. Highlights: -
Consumer confidence for the current period remained stable; the current situation index (CSI)2 remained unchanged at 92.2 from the previous round as higher pessimism on current general economic situation and employment was counterbalanced by a positive turnaround in sentiment on current income (Chart 1; Tables 1, 2 and 5). -
Respondents remained fairly optimistic on the one year ahead prospects for general economic situation, employment, income and spending; the confidence on general economic and employment conditions were, however, a shade lower vis-à-vis the previous survey round, which led to a moderation of the future expectations index (FEI) within the positive terrain (Chart 1; Tables 1, 2, 5 and 6). -
Consumers retained negative sentiments on both current and future price conditions (Tables 3 and 4). -
Households’ assessment of current earnings reached its highest level since July 2019 and expectations for future income also improved further (Table 5). 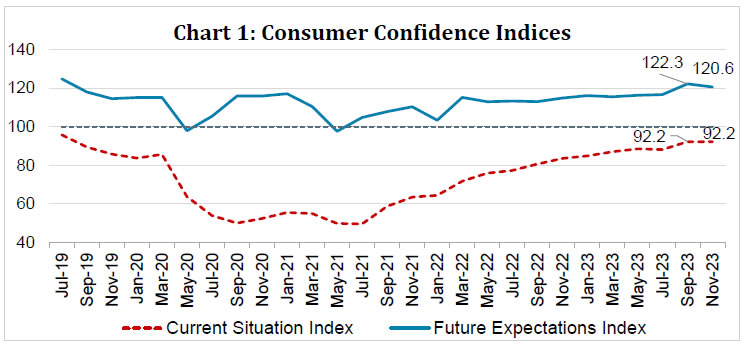 Note: Please see the excel file for time series data.3
| Table 1: Perceptions and Expectations on the General Economic Situation | | (Percentage responses) | | Survey Round | Current Perception | One year ahead Expectation | | Increased | Remained Same | Decreased | Net Response | Will Increase | Will Remain Same | Will Decrease | Net Response | | Nov-22 | 28.0 | 16.3 | 55.7 | -27.8 | 48.0 | 15.6 | 36.4 | 11.6 | | Jan-23 | 28.3 | 19.6 | 52.1 | -23.7 | 50.2 | 16.6 | 33.2 | 17.0 | | Mar-23 | 31.4 | 16.9 | 51.7 | -20.4 | 49.9 | 15.1 | 35.0 | 15.0 | | May-23 | 32.1 | 19.0 | 48.9 | -16.8 | 51.0 | 15.8 | 33.2 | 17.8 | | Jul-23 | 30.4 | 18.5 | 51.1 | -20.7 | 51.1 | 15.1 | 33.8 | 17.2 | | Sep-23 | 36.1 | 19.9 | 44.0 | -7.9 | 56.8 | 15.1 | 28.1 | 28.6 | | Nov-23 | 33.1 | 22.5 | 44.4 | -11.3 | 54.3 | 17.2 | 28.5 | 25.7 |
| Table 2: Perceptions and Expectations on Employment | | (Percentage responses) | | Survey Round | Current Perception | One year ahead Expectation | | Increased | Remained Same | Decreased | Net Response | Will Increase | Will Remain Same | Will Decrease | Net Response | | Nov-22 | 31.8 | 18.6 | 49.6 | -17.8 | 51.5 | 18.3 | 30.3 | 21.2 | | Jan-23 | 30.0 | 20.1 | 49.9 | -19.9 | 51.8 | 18.0 | 30.2 | 21.6 | | Mar-23 | 32.2 | 19.9 | 47.9 | -15.7 | 52.9 | 17.1 | 30.1 | 22.8 | | May-23 | 32.1 | 20.2 | 47.7 | -15.6 | 52.1 | 18.7 | 29.2 | 22.9 | | Jul-23 | 30.8 | 21.0 | 48.2 | -17.5 | 51.4 | 18.3 | 30.3 | 21.1 | | Sep-23 | 34.0 | 21.8 | 44.2 | -10.2 | 55.8 | 18.1 | 26.2 | 29.6 | | Nov-23 | 32.3 | 23.0 | 44.7 | -12.4 | 53.6 | 19.7 | 26.8 | 26.9 |
| Table 3: Perceptions and Expectations on Price Level | | (Percentage responses) | | Survey Round | Current Perception | One year ahead Expectation | | Increased | Remained Same | Decreased | Net Response | Will Increase | Will Remain Same | Will Decrease | Net Response | | Nov-22 | 94.9 | 4.1 | 1.0 | -93.9 | 82.2 | 9.3 | 8.6 | -73.6 | | Jan-23 | 93.6 | 5.0 | 1.3 | -92.3 | 83.0 | 10.1 | 7.0 | -76.1 | | Mar-23 | 93.8 | 5.2 | 1.0 | -92.9 | 84.3 | 9.0 | 6.7 | -77.5 | | May-23 | 92.2 | 6.4 | 1.4 | -90.8 | 82.7 | 10.0 | 7.3 | -75.4 | | Jul-23 | 92.7 | 6.0 | 1.3 | -91.4 | 80.9 | 10.2 | 8.9 | -72.0 | | Sep-23 | 91.8 | 6.4 | 1.8 | -90.0 | 78.4 | 9.9 | 11.7 | -66.8 | | Nov-23 | 91.3 | 7.3 | 1.4 | -89.9 | 81.0 | 10.2 | 8.8 | -72.3 |
| Table 4: Perceptions and Expectations on Rate of Change in Price Level (Inflation)* | | (Percentage responses) | | Survey Round | Current Perception | One year ahead Expectation | | Increased | Remained Same | Decreased | Net Response | Will Increase | Will Remain Same | Will Decrease | Net Response | | Nov-22 | 87.5 | 9.2 | 3.3 | -84.2 | 82.9 | 13.2 | 3.9 | -79.1 | | Jan-23 | 86.5 | 10.5 | 3.0 | -83.6 | 80.3 | 15.5 | 4.1 | -76.2 | | Mar-23 | 86.5 | 10.0 | 3.5 | -82.9 | 81.4 | 14.0 | 4.6 | -76.8 | | May-23 | 84.0 | 12.5 | 3.4 | -80.6 | 81.8 | 14.1 | 4.1 | -77.8 | | Jul-23 | 84.5 | 11.8 | 3.7 | -80.8 | 80.8 | 14.8 | 4.4 | -76.4 | | Sep-23 | 82.5 | 13.4 | 4.2 | -78.3 | 79.4 | 15.8 | 4.8 | -74.6 | | Nov-23 | 81.8 | 13.6 | 4.6 | -77.2 | 80.1 | 14.7 | 5.2 | -75.0 | | *Applicable only for those respondents who felt price has increased/price will increase. |
| Table 5: Perceptions and Expectations on Income | | (Percentage responses) | | Survey Round | Current Perception | One year ahead Expectation | | Increased | Remained Same | Decreased | Net Response | Will Increase | Will Remain Same | Will Decrease | Net Response | | Nov-22 | 20.9 | 46.1 | 32.9 | -12.0 | 52.5 | 39.9 | 7.6 | 44.9 | | Jan-23 | 21.4 | 49.0 | 29.6 | -8.3 | 54.5 | 38.7 | 6.9 | 47.6 | | Mar-23 | 22.2 | 49.7 | 28.1 | -5.9 | 54.1 | 38.4 | 7.5 | 46.7 | | May-23 | 23.9 | 49.7 | 26.3 | -2.4 | 53.8 | 39.4 | 6.9 | 46.9 | | Jul-23 | 25.4 | 49.9 | 24.8 | 0.6 | 54.7 | 38.6 | 6.7 | 48.0 | | Sep-23 | 25.0 | 49.8 | 25.2 | -0.3 | 55.7 | 37.8 | 6.5 | 49.2 | | Nov-23 | 27.2 | 50.1 | 22.7 | 4.5 | 57.9 | 36.0 | 6.1 | 51.8 |
| Table 6: Perceptions and Expectations on Spending | | (Percentage responses) | | Survey Round | Current Perception | One year ahead Expectation | | Increased | Remained Same | Decreased | Net Response | Will Increase | Will Remain Same | Will Decrease | Net Response | | Nov-22 | 74.9 | 19.2 | 5.9 | 69.0 | 75.0 | 20.3 | 4.7 | 70.2 | | Jan-23 | 73.9 | 20.6 | 5.5 | 68.4 | 75.5 | 19.8 | 4.7 | 70.8 | | Mar-23 | 75.0 | 19.6 | 5.4 | 69.6 | 75.4 | 19.9 | 4.6 | 70.8 | | May-23 | 73.4 | 21.3 | 5.3 | 68.1 | 73.8 | 21.7 | 4.6 | 69.2 | | Jul-23 | 74.5 | 20.5 | 5.0 | 69.6 | 73.8 | 21.3 | 4.8 | 69.0 | | Sep-23 | 74.6 | 20.2 | 5.2 | 69.4 | 75.2 | 20.3 | 4.6 | 70.6 | | Nov-23 | 74.8 | 20.6 | 4.6 | 70.1 | 75.0 | 21.0 | 4.1 | 70.9 |
| Table 7: Perceptions and Expectations on Spending- Essential Items | | (Percentage responses) | | Survey Round | Current Perception | One year ahead Expectation | | Increased | Remained Same | Decreased | Net Response | Will Increase | Will Remain Same | Will Decrease | Net Response | | Nov-22 | 84.7 | 11.6 | 3.7 | 81.0 | 81.1 | 15.4 | 3.5 | 77.7 | | Jan-23 | 84.1 | 12.3 | 3.6 | 80.5 | 81.3 | 15.2 | 3.5 | 77.8 | | Mar-23 | 85.3 | 11.5 | 3.2 | 82.1 | 81.7 | 14.8 | 3.5 | 78.2 | | May-23 | 84.0 | 12.8 | 3.2 | 80.8 | 81.3 | 15.2 | 3.5 | 77.8 | | Jul-23 | 85.3 | 11.8 | 3.0 | 82.3 | 81.0 | 15.5 | 3.5 | 77.5 | | Sep-23 | 84.9 | 11.9 | 3.2 | 81.7 | 82.0 | 14.4 | 3.6 | 78.4 | | Nov-23 | 85.7 | 11.4 | 2.9 | 82.7 | 82.3 | 14.4 | 3.4 | 78.9 |
| Table 8: Perceptions and Expectations on Spending- Non-Essential Items | | (Percentage responses) | | Survey Round | Current Perception | One year ahead Expectation | | Increased | Remained Same | Decreased | Net Response | Will Increase | Will Remain Same | Will Decrease | Net Response | | Nov-22 | 22.4 | 33.8 | 43.8 | -21.4 | 32.8 | 35.1 | 32.2 | 0.6 | | Jan-23 | 22.1 | 35.2 | 42.8 | -20.7 | 31.9 | 38.4 | 29.8 | 2.1 | | Mar-23 | 25.2 | 34.8 | 40.0 | -14.8 | 34.5 | 36.8 | 28.8 | 5.7 | | May-23 | 25.8 | 38.2 | 36.1 | -10.3 | 35.3 | 37.5 | 27.2 | 8.2 | | Jul-23 | 26.6 | 36.9 | 36.5 | -10.0 | 34.8 | 37.6 | 27.6 | 7.3 | | Sep-23 | 23.4 | 38.5 | 38.2 | -14.8 | 33.0 | 38.2 | 28.8 | 4.2 | | Nov-23 | 25.2 | 36.6 | 38.2 | -13.0 | 34.1 | 36.8 | 29.0 | 5.1 |
|