After aggressive rate hikes during 2022 to restore price stability, central banks moderated the pace of monetary tightening in 2023 or paused. Banking stress in the US and Europe in early 2023 was addressed through swift policy actions, which helped contain spillover impact on global financial stability. Amidst macroeconomic uncertainty, the health of the global banking sector has remained robust, as reflected by the capital buffers and leverage ratio. The medium-term challenges include effective regulation to mitigate risks emanating from technological innovations and climate change. 1. Introduction II.1 As the global economy grapples with tighter financial conditions and geopolitical tensions, financial stability concerns associated with disinflationary monetary policy are turning out to be challenging. This was reflected in the collapse of five mid-sized US banks and failure of a major bank in the European Union (EU). While the potential contagion from these bank failures was contained through prompt and sizeable regulatory and liquidity actions, the outlook is fraught with uncertainty, especially in the context of volatility in bond yields and equity and exchange markets. II.2 Against this backdrop, the rest of the chapter is organised into six sections. The next section provides a brief overview of global macroeconomic and monetary conditions. In Section 3, recent global banking policy developments are reviewed. The financial performance of the global banking sector is discussed in Section 4 with Section 5 focusing on an analysis of the world’s top 100 banks ranked by Tier I capital positions. Section 6 concludes with some perspectives on the outlook. 2. Global Macroeconomic Conditions II.3 Global growth is faltering under the impact of tightening financial conditions, geopolitical tensions and geoeconomic fragmentation. According to the October 2023 update of the International Monetary Fund’s (IMF’s) World Economic Outlook (WEO), global growth is projected to fall from 3.5 per cent in 2022 to 3.0 per cent in 2023 and 2.9 per cent in 2024, which is weak by historical standards (Chart II.1a)1. Concomitantly, the growth in global goods and services trade is expected to decelerate to 0.9 per cent in 2023 from 5.1 per cent a year ago, reflecting services-led growth, rising trade barriers and the lagged effects of US dollar appreciation on terms of trade. II.4 Inflation is ebbing gradually in response to monetary policy actions and correction in food and energy prices. Global inflation is projected to fall from 8.7 per cent in 2022 to 6.9 per cent in 2023 and 5.8 per cent in 2024, but would be well-above the pre-pandemic average of 3.5 per cent during 2017-19, and is likely to rule above target in major economies amidst elevated core inflation pressures (Chart II.1b). Global energy and non-energy commodity prices are exhibiting high volatility and pose risks to the disinflation path going ahead, along with the rising intensity and frequency of climate shocks. Crude oil prices crossed US Dollar (USD) 95 per barrel in September 2023 on production cuts by Organization of the Petroleum Exporting Countries (OPEC) plus, but corrected subsequently. II.5 The current account deficits (CADs) of major advanced economies (AEs) remain wider than before the pandemic (Chart II.1c). While government debt moderated from a post-pandemic peak in 2020 in major AEs, it is on a rising trajectory in emerging market and developing economies (EMDEs), posing downside risks to their growth prospects, given the sharp tightening of external financing conditions (Chart II.1d). 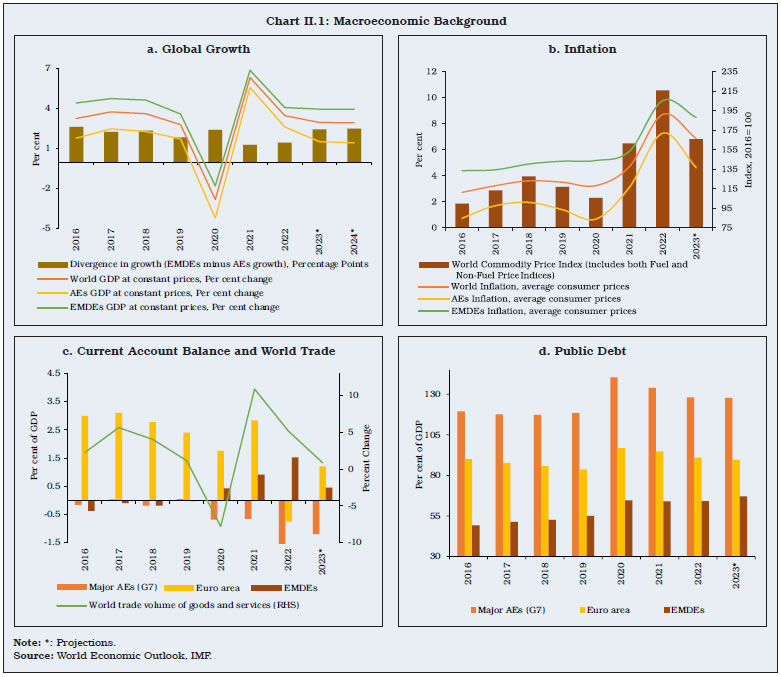 II.6 After aggressive rate hikes during 2022 to restore price stability, major AE central banks moderated the pace of monetary tightening over the course of 2023 or paused. They have also indicated that the tightening cycle is at or close to its peak. Monetary policy is expected to remain in restrictive territory in view of higher than target inflation, relatively sticky core inflation and strong labour markets. Amongst the major AEs, the US federal funds rate was raised by 525 basis points (bps) to 5.25-5.50 per cent since March 2022 while the European Central Bank (ECB) raised its policy rate (Main Refinancing Operation rate) by 450 bps to 4.5 per cent since July 2022. The EMDEs, which had started the hiking cycle earlier than AEs in 2021, are exhibiting diverging monetary policy paths. For instance, while Brazil started a rate cutting cycle in August 2023 after being amongst the earliest to start the tightening cycle, Russia and Turkey have reverted to monetary tightening in recent months due to inflationary pressures. China is pursuing an accommodative monetary policy – it cut its key policy rate for the first time in 10 months in June 2023 – to support economic growth. Indonesia raised its benchmark rate by 25 bps to 6 per cent in October 2023 after keeping it unchanged for eight consecutive meetings and kept it unchanged in November 2023 (Chart II.2b). 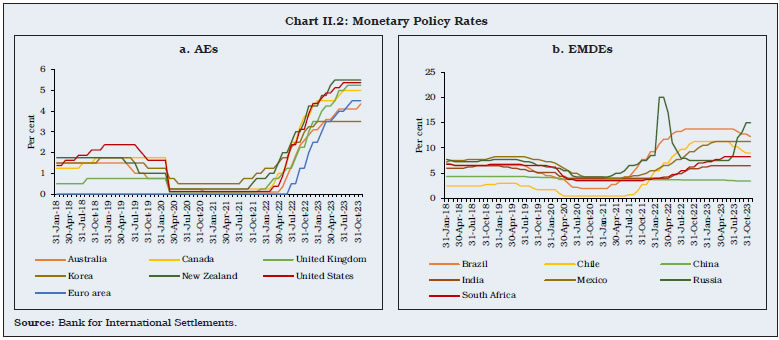 II.7 Reflecting monetary policy actions, elevated inflation trajectories and higher for longer scenario, sovereign bond yields hardened significantly. In October 2023 the US benchmark 10-year treasury yield touched its highest level since 2007 but moderated during November-December 2023. Similarly, yields on 10-year UK and German government bonds reached their highest levels since 2008 and 2011, respectively before correcting in November-December 2023. 3. Global Banking Policy Developments II.8 The confidence in the banking sector in the AEs was jolted significantly in 2023 by the failure of Silicon Valley Bank and other US regional banks in March 2023, and collapse of Credit Suisse prior to its merger with UBS in June 2023. These failures called into question the business models and strategies of banks predicated upon the continuation of the decade-long low interest rate regime. They also exposed the weaknesses in their risk management strategies as well as their regulatory and supervisory architecture. Furthermore, the banking turmoil raised issues related to proportionality in application of prudential regulations, risks of concentration in funding sources, risk management practices and governance arrangements, interactions between interest rate risk and liquidity risk across the financial system, the role of technology and social media in deposit runs, and the lack of effective international resolution frameworks2. Building Resilient Financial Institutions3 II.9 The Basel Committee on Banking Supervision (BCBS) member jurisdictions have made further progress in implementing the Basel III post-crisis reforms effective from January 1, 2023. Since end-September 2022, almost two-third of the new adoptions in member jurisdictions related to these standards4. In two jurisdictions, all standards are in force i.e., final rules are published and implemented by banks. The implementation of the global systemically important banks (G-SIBs) leverage ratio buffer has been completed in all relevant jurisdictions. Between end-September 2022 and end-September 2023, one additional member jurisdiction issued final rules for the revised standardised approach for credit risk and output floor, and two others issued final rules for the revised internal ratings-based (IRB) approach for credit risk and the revised operational risk framework. Furthermore, three additional member jurisdictions have adopted the revised credit valuation adjustment (CVA) framework, the revised minimum requirements for market risk, the revised leverage ratio (2017 exposure definition) and revised disclosure requirements. Moreover, most member jurisdictions have published draft rules for consultation. II.10 For standards that have been past due for longer, five more implementations for disclosure standards and three on the interest rate risk in the banking book (IRRBB) have been completed. Final rules have been issued for each of the large exposures framework (LEX), the capital standards for securitisations, the net stable funding ratio (NSFR) and the margin requirements for non-centrally cleared derivatives (NCCDs). Too-Big-To-Fail (TBTF) Reforms5 II.11 Implementation of higher loss absorbency as well as of the related reporting and disclosure requirements for G-SIBs is proceeding on a timely basis. At end-September 2023, all relevant G-SIBs had met the final 2022 minimum external total loss absorbing capacity (TLAC) requirements and work is continuing to build up the same for four EME G-SIBs that are due to comply with the TLAC standard by January 2025. Almost all G-SIB home and key host jurisdictions have in place comprehensive bank resolution regimes that align with the Financial Stability Board’s (FSB’s) key attributes. However, implementation of the key attributes is still incomplete in some FSB jurisdictions, and no new bank resolution powers were fully implemented since last year6. The powers most often lacking are bail-in and imposing a temporary stay on the exercise of early termination rights. The 2022–23 resolvability assessment process (RAP) identified that further work to enhance G-SIB resolvability is necessary in most crisis management groups (CMGs), focusing on liquidity and funding in resolution, unallocated TLAC, capabilities to support a bail-in execution, trading book wind-down and valuation, as well as testing and assurance of capabilities. Making Derivatives Markets Safer7 II.12 Overall implementation of the G20 over-the-counter (OTC) derivatives reforms is well-advanced but progress has slowed in recent years. There has been no increase in the number of FSB member jurisdictions with comprehensive trade reporting requirements over the past four years. Final capital requirements for NCCDs are in place in 18 FSB jurisdictions, unchanged from last year. However, jurisdictions that have not yet implemented these reforms account for a very low proportion of global OTC derivatives market activity. Enhancing Resilience of Non-Bank Financial Intermediation (NBFI)8 II.13 Implementation of Basel III reforms to mitigate spillovers between banks and non-bank financial entities is still ongoing. Three jurisdictions are yet to implement applicable risk-based capital requirements for banks’ investments in the equity of funds. Three jurisdictions (one fewer than last year) are yet to fully implement the supervisory framework for measuring and controlling banks’ large exposures. II.14 The FSB, in collaboration with International Organization of Securities Commissions (IOSCO) published policy proposals to enhance money market fund (MMF) resilience in 20219. A number of FSB member authorities have already published proposals or adopted policy reforms on MMFs. Further, adoption of the IOSCO recommendations on incentive alignment approaches for securitisation has been completed by 17 FSB jurisdictions, unchanged from last year. Three FSB jurisdictions are yet to implement the revised BCBS securitisation framework, compared to four jurisdictions the year before. In this context, the FSB has launched an evaluation of the effects of securitisation reforms agreed by the G20 in the aftermath of the 2008 global financial crisis (GFC), which is aimed to be completed around mid-2024. II.15 Progress continues at a slow pace on global securities financing data collection and aggregation. Only seven FSB jurisdictions are submitting data; in most cases the coverage is restricted to only a subset of market segments and granularity is limited. Moreover, implementation of the FSB recommendations for dampening procyclicality and other financial stability risks associated with securities financing transactions (SFTs) is incomplete and continues to face significant delays in most jurisdictions, with generally little progress over the past year. II.16 In September 2023, the FSB issued a progress report on enhancing resilience of NBFI10, documenting their progress over the past year and work planned by the FSB, other standard setting bodies (SSBs), and other international organisations. The report presents the findings of FSB’s analytical work on key amplifiers of liquidity stress, especially those associated with non-bank leverage. It also sets forth policy proposals being developed by the FSB and SSBs to reduce excessive spikes in liquidity demand related to: (i) structural liquidity mismatch in open-ended funds (OEFs); and (ii) margining practices. II.17 In September 2023, the FSB published a report on the financial stability implications of leverage in NBFI11. The report forms a part of FSB’s comprehensive NBFI work programme, which started after the March 2020 turmoil. The report provides an overview of aggregate NBFI leverage trends across FSB jurisdictions and discusses the vulnerabilities associated with them, including propagation and amplification mechanisms. Climate Related Financial Disclosures II.18 A significant milestone in strengthening the comparability, consistency and decision-usefulness of climate-related financial disclosures is the publication of the final standards of the International Sustainability Standards Board (ISSB) on June 26, 2023. These standards consisted of International Financial Reporting Standards (IFRS) S1 on general sustainability-related disclosures and IFRS S2 on specific climate-related disclosures. These standards require an entity to disclose information about its sustainability-related and climate-related risks and opportunities, to investors, covering areas of governance, strategy, risk management, and metrics and targets. II.19 Welcoming the ISSB disclosure standards, the FSB stated in July 2023 that there was a continuing need for enhancing climate data and improving its accuracy, consistency, and quality to support climate risk assessment and scenario analysis exercises12. The FSB has also stated that further work is needed to embed climate scenarios for monitoring of financial vulnerabilities and for understanding of the cross-border and cross-sectoral transmission of climate shocks for financial stability insights. The FSB has set up a Transition Plans Working Group that will, as an initial task, develop a conceptual understanding on the relevance of transition plans. II.20 In October 2022, the FSB’s recommendations on climate-related risks focussed on (i) supervisory and regulatory reporting and collection of climate-related data from financial institutions; (ii) system-wide perspectives and the extent to which supervisory and regulatory tools and policies address climate-related risks; and (iii) early consideration of other potential macroprudential policies and tools13. The linking of climate related objectives to the compensation of individuals and/or group of executives or senior management is also being explored14. II.21 Given limited fiscal policy space and high debt levels in many EMDEs after the pandemic, blended finance has a critical role to play in scaling up private climate financing15. Blended finance involves deploying public and donor capital to de-risk private capital investments in order to mobilise financing for climate adaptation and mitigation projects. While EMDEs are more vulnerable to climate risks than AEs, their financial markets are typically underdeveloped and relatively unattractive for private investors, especially for green bond issuances (Box II.1). Box II.1: Determinants of Green Bond Issuance: A Cross-Country Analysis In recent years, issuances of green bonds have grown exponentially, especially in AEs, while EMDEs lag behind (Chart II.1.1), despite being more vulnerable to climate change. Panel regressions for 40 countries using annual data for the period 2013-2022 with the amounts of green bond issuances as the dependent variable and potential explanatory variables like IMF’s Financial Development Index (FDI), INFORM’s Vulnerability Index (VI) and World Bank’s Government Effectiveness (GE) indicator along with GDP as the control variable show that financial development of a country is the most dominant factor which attracts green bond issuances. The climate vulnerability of an economy does not appear to be a significant factor. The positive relationship between GDP and green bond issuances suggests that, ceteris paribus, larger economies on an average tend to raise more funds through issue of these bonds (Table II.1.1). 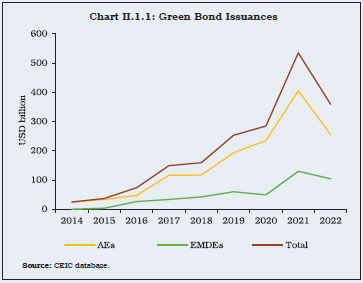
| Table II.1.1: Random Effect Model Regression Results | | Dependent Variable: Green Bond Issuances | (1) | (2) | (3) | (4) | (5) | | L.FDI | 1.50*** | | 1.08** | | 1.03** | | (0.41) | | (0.45) | | (0.49) | | L.VI | | -0.22 | -0.19 | | | | | (0.33) | (0.30) | | | | L.GE | | | | 0.32** | 0.19 | | | | | (0.14) | (0.14) | | Country_Dummy | -0.68** | -1.28*** | -0.86*** | -0.61* | -0.43 | | (0.30) | (0.29) | (0.30) | (0.32) | (0.30) | | Covid_Dummy | 1.04*** | 0.85*** | 0.94*** | 0.954*** | 0.10*** | | (0.13) | (0.11) | (0.12) | (0.13) | (0.14) | | L.GDP | 0.56*** | 0.84*** | 0.70*** | 0.76*** | 0.64*** | | (0.11) | (0.12) | (0.14) | (0.09) | (0.12) | | Constant | -7.35** | -15.08*** | -11.05*** | -13.36*** | -9.59*** | | (2.93) | (3.10) | (3.68) | (2.56) | (3.27) | | Observations | 238 | 257 | 219 | 253 | 219 | | Number of countries | 41 | 40 | 40 | 40 | 40 | | R-squared | 0.27 | 0.24 | 0.25 | 0.25 | 0.25 | Notes: 1. Robust standard errors in parentheses.
2. *** p<0.01, ** p<0.05, * p<0.1
3. Log values of dependent as well as independent variables are used in the analysis.
Source: RBI staff estimates. | The results thus suggest that consistent efforts to develop financial markets will benefit countries in raising more resources to mitigate climate change. References Dan, A. and A. Tiron-Tudor (2021), “The Determinants of Green Bond Issuance in the European Union,” Journal of Risk and Financial Management, MDPI, 14(9): 1-15, September. Barua, S. and M. Chiesa (2019), “Sustainable Financing Practices through Green Bonds: What Affects the Funding Size?”, Business Strategy and the Environment, Wiley Blackwell, 28(6) : 1131-1147, September. | II.22 The Network for Greening the Financial System (NGFS) has been developing climate scenarios to help public and private sector players carry out detailed analyses of the financial risks posed by climate change. In September 2022, NGFS published its third iteration of scenarios for central banks and supervisors16, exploring orderly, disorderly and hot-house world scenarios, covering various ranges of physical and transition risks. The scenarios include projections of potential losses from extreme weather events (in particular, cyclones and river floods) to complement the specific impacts of chronic climate changes on the economic activity. Regulation of Crypto-Assets II.23 Crypto-assets have been in existence for more than a decade. They are defined as a type of private sector digital asset primarily based on cryptography and distributed ledger or similar technology17. They have witnessed dramatic fluctuations in their values – sharp appreciation and subsequent steep price reversion. As observed by FSB (2022), financial stability risks may emerge as crypto-assets become increasingly interconnected with the wider financial system18. This highlights the necessity of coordination among national regulators and International Organisations (IOs) to develop effective and flexible comprehensive policy framework for crypto-assets19. II.24 In July 2023, the FSB published a regulatory framework for crypto-asset activities20. Based on the principle of ‘same activity, same risk, same regulation’, the framework provides a basis for consistent and comprehensive regulation of crypto-assets and stablecoins commensurate with the risks they pose, while supporting responsible innovations that can potentially be brought in by technological change21, 22. The framework covers aspects like oversight, governance, risk management, access to data, recovery and resolution, disclosures, redemption rights and stabilisation mechanisms of global stablecoins (GSCs). The significance of these recommendations was recently acknowledged and endorsed during the third G20 Finance Ministers and Central Bank Governors Meeting convened in July 2023 in Gujarat, India. The G20 leaders’ summit held in September 2023 at New Delhi welcomed the IMF-FSB synthesis paper which suggests a roadmap to support a coordinated and comprehensive policy framework, taking into account the full range of risks (including those specific to the EMDEs) and ongoing global implementation of Financial Action Task Force (FATF) standards to address money laundering and terrorism financing risks23. II.25 In December 2022, the BCBS finalised prudential standards on treatment of banks’ exposures to crypto-assets to be implemented by January 1, 202524. These final standards identify Group 1 crypto-assets, which include tokenised traditional assets and crypto-assets with effective stabilisation mechanisms and subject to capital requirements, based on the risk weights of underlying exposures as set out in the existing Basel Framework. Group 2 crypto-assets include unbacked crypto-assets that are subject them to a newly prescribed conservative capital treatment. Additional key elements of the standards include an infrastructure risk add-on, a Group 2 exposure limit, a redemption risk test and a supervision/regulation requirement. II.26 The Bank for International Settlements (BIS) report on “The crypto ecosystem: key elements and risks”, submitted to the G20 in July 2023, noted that crypto offers some elements of innovation, while highlighting several structural flaws. These include congestion and high fees leading to fragmentation, substantial de-facto centralisation, and the potential to amplify risks. These flaws emanate from the underlying economics of incentives, and can exacerbate known vulnerabilities. The report concludes that crypto has so far failed to harness innovation to the benefit of society, remains largely self-referential, suffers from inherent shortcomings related to stability, efficiency, accountability, and integrity, making it unsuitable to play a significant role in the monetary system25. II.27 In the face of these global developments and the rising financial stability concerns, the Reserve Bank continues to maintain that cryptos are fundamentally designed to bypass the established financial system. The recurring volatility in the crypto-asset markets further strengthens the view that they have no intrinsic value and they cannot serve as an efficient medium of exchange or store of value. They have the potential to disturb the established currency and banking system, while undermining the efficacy of macroeconomic and financial policies. II.28 FATF26 finds that jurisdictions continue to struggle with fundamental requirements such as undertaking risk assessments, enacting legislation to regulate virtual asset service providers (VASPs), and conducting supervisory inspections. The FATF’s recommendation15 and its interpretative note (R.15/INR.15) requires countries to identify and assess money laundering and terrorist financing (ML/TF) risks relating to the development of new products and business practices. Analysis of 98 FATF mutual evaluations and follow-up reports since the adoption of R.15/ INR.15, suggests that 75 per cent of jurisdictions are not compliant or only partially compliant with the FATF’s requirements. In addition, the FATF update states that jurisdictions have made insufficient progress in implementing FATF’s travel rule27, which is a serious concern as the risks posed by virtual assets (VAs) and VASPs continue to increase and the lack of regulation creates significant loopholes for criminals to exploit the lacunae. Artificial Intelligence II.29 The rise of artificial intelligence (AI) embodies the potential to revolutionise various aspects of banking, non-banking and financial markets. Some AI technologies have been around for more than five decades. Advances in computing power, availability of enormous quantities of data and new algorithms have led to major AI breakthroughs in recent years. AI is increasingly being used in areas such as asset management, algorithmic trading, credit underwriting, and blockchain-based financial services. AI is expected to transform financial services segment by spurring the creation of new products and services, opening up new markets and industries, and paving the way for innovation. Fraud detection, optimisation of information technology (IT) operations and digital marketing are some other areas where widespread adoption and heavy use of AI tools has been reported. Banks can reap the benefits of such applications through more efficient use of resources enabling better customer experience. Machine learning (ML) techniques allow real-time analysis of customer transactions to improve estimates of default risks which strengthens their risk management strategy. According to a recent survey, about one-third of the respondent financial services companies expect 51 to 75 per cent of their workload to be supported by AI technologies in five years28. II.30 Scheduled commercial banks (SCBs) in India, too, are leveraging AI for data analytics, fraud detection and other predictive analyses. Banks have also deployed chatbots or virtual assistants to improve customer experience (Box II.2). Box II.2: Adoption of Artificial Intelligence in Indian Banks Globally, banking and financial services are leading the adoption of AI (McKinsey, 2017). To measure AI awareness and potential adoption by Indian banks, a textual analysis is performed on the annual reports of Indian banks from 2015-16 to 2021-22, using a combination of related keyword matching and named entity recognition approaches while leveraging popular dictionaries/glossaries related to AI and ML such as Google Vertex AI, Google Developers, IBM, NHS AI Lab, the Council of Europe and Large Language Models like ChatGPT and Bard. The analysis indicates that the usage of AI related keywords in Indian banks has increased sizeably, especially in PVBs (Chart II.2.1). In PSBs, the adoption has been relatively muted but has still risen around 2.5 times over the sample period. A word cloud analysis reveals banks’ focus on automation, which may be driven by the objective of reaping efficiency gains and strengthening fraud detection and other predictive analytics (Chart II.2.2). The awareness or possible adoption of relatively newer technologies like Robotic Process Automation (RPA), the Internet of Things (IoT) and Natural Language Processing (NLP) is noteworthy. 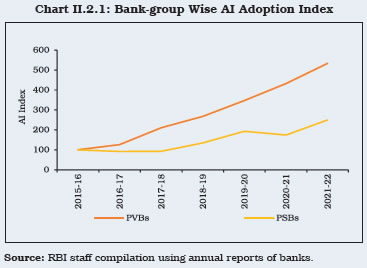 One of the prominent usages of AI across service industries is chatbots that can converse — either through text or through voice — with human users in natural languages. A survey shows that at end June-2023, 11 out of 12 PSBs and 15 out of 21 PVBs already had some form of chatbot and virtual assistant by using AI and ML technologies (Chart II.2.3 a and b). In most of the cases, the chatbots are accessible through the banks’ websites. In case of PSBs, mega mergers seem to have given a boost to adoption of chatbots, with merged entities adopting the technology of acquirers (Chart II.2.4 a and b) 29. NBFCs are also introducing chatbots for customer services.
Reference: McKinsey (2017,) Artificial Intelligence: The Next Digital Frontier?, available at
https://www.mckinsey.com/~/media/mckinsey/industries/advanced%20electronics/our%20insights/how%20artificial%20intelligence%20
can%20deliver%20real%20value%20to%20companies/mgi-artificial-intelligence-discussion-paper.ashx | II.31 The use of AI in finance could, however, amplify risks already present in the financial sector and induce new overriding risks, including potential financial consumer and investor protection considerations. The black box nature of AI models makes it difficult to understand how they generate results which may be incompatible not only with existing laws and regulations, but also with internal governance, risk management and control frameworks of financial service providers. These models may contribute to market shocks and can intensify systemic risks related to pro-cyclicality30. Although ML, including generative AI technologies, could improve cyber security automation in intrusion detection and data loss prevention, they could also be used to automate cyber reconnaissance and attacks. Thus, as the use of AI in the sector grows, so does the need for governance frameworks and regulations to ensure that ethical practices are implemented to keep pace with the rapidly changing landscape. To address these concerns, a new AI act is proposed in the EU, which requires that all such high-risk applications must undergo rigorous testing and certification processes before they can be used31. Financial institutions using AI algorithms need to create an inventory of their technology systems to identify potential areas of model risk. They will also have to establish frameworks for managing these risks and implement appropriate measures to mitigate them. II.32 A global summit held in the UK32 in November 2023 focused on multifaceted risks associated with AI and strategies to mitigate these risks effectively. Twenty-eight major countries including the US, China, Japan, the UK, France, India, and the EU agreed to sign a declaration, emphasising the role of global action to tackle the potential risks of AI. Named after the hosting venue, the Bletchley Park Declaration incorporates an acknowledgment of the substantial risks from potential intentional misuse or unintended issues of control of frontier AI – especially cybersecurity, biotechnology, and disinformation risks. 4. Performance of the Global Banking Sector II.33 In most AEs, credit growth moderated from the second half of 2022 under the weight of rising lending rates (Chart II.3). Lower loans to households drove the credit deceleration in Canada while anaemic unsecured credit to households led the credit downturn in the UK33. Bank lending surveys in the US and Europe indicated further tightening of credit standards in the face of heightened risk perceptions from the second quarter of 2023. The slowdown became especially evident in corporate loans and commercial real estate (CRE) lending34. Credit growth remained robust in India and Russia, while it slowed down in other EMDEs. Asset Quality II.34 In Q2:2023, the asset quality of banks — measured by the ratio of non-performing loans to total gross loans (NPL ratio) — remained robust across AEs (Table II.1). In the EU banks, delinquencies reached their lowest levels since the GFC, for the entire loan book as well as for loans to the non-financial private sector35. In Greece, government and institution-specific interventions led to significant improvement in banks’ asset quality36. Across EMDEs (except South Africa), asset quality has been improving since 2019, though the NPL ratio remained relatively elevated in Russia. 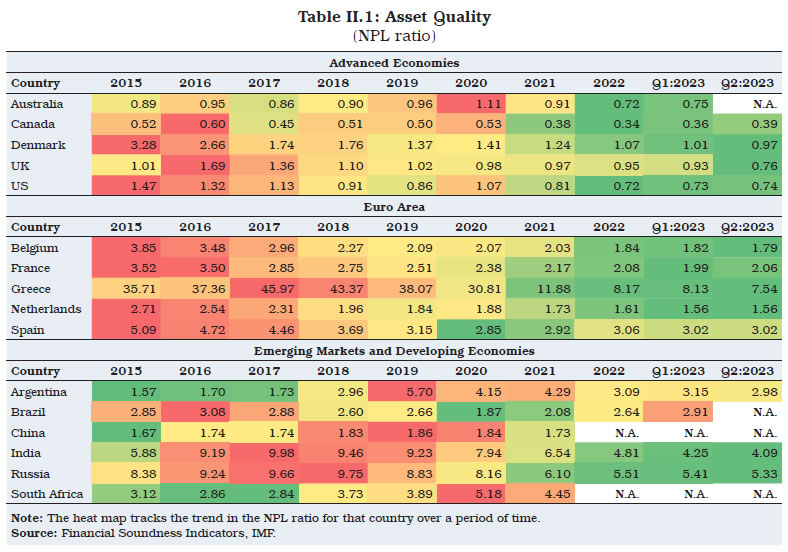 II.35 Banks are better placed now to manage NPLs than in the aftermath of the GFC, owing to higher capital buffers and stricter supervisory standards. Going forward, higher interest rates could dampen economic growth and put stress on asset quality in sectors such as CRE. For instance, the office-vacancy rates, especially in the US, are higher now than after the GFC, reflecting entrenched work-from-home habits37. Provision Coverage Ratio II.36 Provisioning buffers are designed to provide a cushion against possible credit impairment. The provision coverage ratio (PCR) for the US, which has been the highest among major AEs, improved further in Q2:2023, indicating greater resilience to stress in the banking book (Chart II.4a). The ratio has, however, remained low—in the range of 15 to 35 per cent—in other economies like Australia and Canada. In a few Euro Area countries like Italy, Spain and France, the PCR declined in 2022 (Chart II.4b). For the EMDEs, there was some moderation in 2022. Brazil recorded the highest PCR (Chart II.4c). Bank Profitability II.37 Bank profitability, measured by the return on assets (RoA), improved in Q1:2023 as rising policy rates were accompanied by a faster pace of transmission to lending rates relative to deposit rates, which boosted net interest margins (NIM) across AEs and EMEs (Chart II.5a). Profitability faces headwinds from subdued economic growth prospects, tighter credit standards and the lagged pass-through to deposit rates (Chart II.5b). Amongst EMEs, bank profitability in Brazil reduced in Q1:2023 due to an increase in loan loss provisions, mainly reflecting the filing of bankruptcy protection and restructuring by a major retail chain, as well as a slight worsening in operational efficiency38 (Chart II.5c). In China, increased policy support for the property sector was delivered via banks, asset management companies, trust companies and other non-banking financial institutions (NBFIs). Stress in the property segment imposed burden on financial entities’ balance sheets, first through their own exposure to the sector and second, through their exposure to local government finances39. This, combined with the overhang of the impact of stringent pandemic-containment measures, exacerbated asset quality risks for the banking system. While large Chinese banks have strong capital positions, smaller banks are more exposed to the property sector and small to medium-sized enterprises, with much higher NPL ratios, weaker provision coverage, lower capital adequacy, and are more closely linked to shadow banks40. 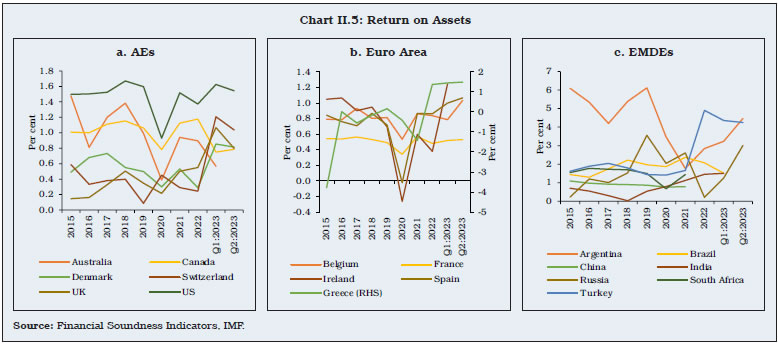 Capital Adequacy II.38 The capital adequacy ratio, measured by regulatory capital to risk weighted assets (CRAR), remains above the Basel III norms. Amongst the AEs, the Scandinavian countries such as Norway and Denmark maintain higher capital buffers while the US banks maintain the lowest CRAR (Table II.2). The capital ratios of the Euro Area banks (except Greece and Ireland) declined in 2022, reflecting the increase in risk-weighted assets (RWAs) stemming mainly from robust lending growth to non-financial corporations, which continued until the third quarter41. Among EMDEs, capital ratios improved in 2022 for almost all of them, except Brazil. In Brazil, the capital ratio moderated on account of lower net income and higher remuneration distribution to shareholders42. Leverage Ratio II.39 Leverage ratio, defined as regulatory Tier I capital divided by total assets, aims to ascertain the extent to which banks have financed their assets with equity and acts a backstop to CRAR to constrain banks’ risk-taking behaviour. Banks maintained leverage ratios more than twice the minimum of 3 per cent required under the Basel III norms. Although the ratio for the US banks declined, it remained higher than their peers (Chart II.6a). Among Euro Area countries, a reversion in the declining trend was observed in Greece (Chart II.6b). Among EMDEs, the leverage ratio in Argentina and Turkey improved, whereas it moderated for others (Chart II.6c).
Financial Market Indicators II.40 Bank failures in the US in early 2023 adversely affected market sentiments. The US bank equity prices were the hardest hit. The decline in the UK and the European bank equity prices was relatively smaller (Chart II.7a). There was a material increase in financial market risk premia and volatility, reflected in the increase in spreads on high-yield and investment-grade corporate bonds and leveraged loans. Credit default swap (CDS) spreads also widened (Chart II.7b). While market risk sentiment has stabilised in recent months, global financial markets remain nervous, given large uncertainties about the outlook for inflation and interest rates. 5. World’s Largest Banks II.41 In the aftermath of the GFC, the largest global banks, especially in the AEs, reduced the scale and scope of their trading activities to control risk exposures. These banks also curtailed their international business, preferring to focus on local business instead. More specifically, they have either shut down or restricted their correspondent relationships with banks in EMDE jurisdictions as they were perceived as riskier and prone to regulatory complexities43. On the other hand, the huge economic stimulus package announced by the Chinese government in the wake of the GFC to pump prime the economy was mainly channelised through the banking sector44. As a result, the share of AE banks in the top 100 banks worldwide has been shrinking in the post-GFC period while that of Chinese banks has been growing (Chart II.8a and 8b). 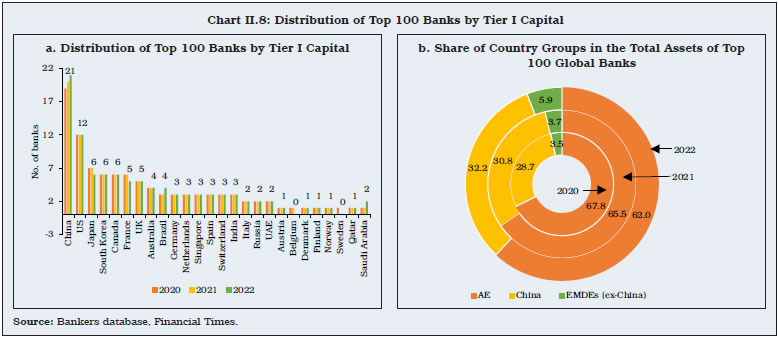 II.42 The asset quality of large global banks in AEs and EMDEs (excluding China) came under pressure in 2022. There was an increase in the number of AE and EMDE banks with NPL ratios crossing 2 per cent in 2022 (Chart II.9a). In contrast, all Chinese banks in the top 100 had their NPL ratios below 2 per cent. Moreover, the PCR of large Chinese banks, an indicator of loss absorbing capacity, was above 100 per cent at end-December 2022. In contrast, roughly half of the banks in AEs had PCRs below 100 per cent. Provisioning in EMDE banks improved significantly in 2022, with nearly three-fourth of them maintaining PCR greater than 100 per cent (Chart II.9b). 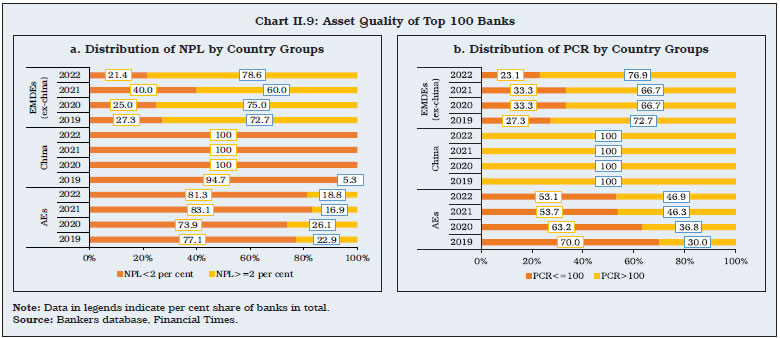 II.43 The distribution of capital measured by CRAR shifted leftward in 2022, as there was an increase in the number of banks maintaining CRAR below 14 per cent (Chart II.10a). In case of leverage ratio, the 6 to 8 per cent category has remained the modal class, although the peakedness of the distribution increased with decline in the number of banks in the 4 to 6 per cent and 8 to 10 per cent categories (Chart II.10b). II.44 The profitability of top 100 banks, which had shown marked improvement in 2021, moderated in 2022. The number of banks with RoA above 1 per cent fell in 2022 (Chart II.10c). This is in sharp contrast to the overall trend of banks enjoying higher profits in 2022. Mid-sized banks, especially in EMDEs (including China), seem to have reaped the benefits of higher interest rates as the monetary policy transmission to their lending rates was faster than to borrowing costs45. 6. Overall Assessment II.45 With inflation remaining above target, monetary policy could stay in restrictive territory for longer. Global growth is expected to weaken in 2024. Under these circumstances, credit growth is likely to remain subdued, bank profitability could dampen and asset quality could see some stress, although banks across jurisdictions are well-capitalised. EMDE banking systems are expected to build on the strong resilience exhibited in 2023. Going forward, therefore, the regulators and supervisors need to remain mindful of the emerging risks to the banking sector in a challenging environment.
|