| I. Macroeconomic Outlook The outlook for domestic economic activity remains resilient on the back of strong domestic demand and improved macroeconomic fundamentals. Volatile food prices interrupt the path of disinflation and cloud the inflation outlook. Geopolitical hostilities, volatile global financial markets and climate shocks are the key risks to the outlook. Monetary policy remains focused on aligning inflation with the target to pave the path for sustained growth in the medium-term. I.1 Key Developments since the October 2023 MPR The global economy has remained surprisingly resilient despite repeated and overlapping shocks and unprecedented monetary tightening. Growth in the US and several major emerging market economies (EMEs) has held up better than expected. Sectorally, manufacturing activity has remained subdued, but services have exhibited strength. Headline inflation has come down across countries although the descent in core and services inflation has been slow amidst continuing tightness in labour markets. Major central banks in advanced economies (AEs) have kept policy rates on hold to ensure the aligning of inflation with targets. Incoming data on the economic outlook and evolving expectations about monetary policy’s trajectory in AEs reverberated through global financial markets imparting high volatility. A faster-than-expected decline in inflation fuelled expectations of an early reversal in the US monetary policy cycle, leading to a sharp correction in sovereign bond yields in November and December 2023. Yields have, however, hardened since the beginning of 2024 as central bank communication pushed back on market exuberance related to the magnitude and pace of monetary policy easing. Following the correction seen in Q3:2023 (July-September), global equity markets posted strong gains in November-December, primarily in AEs. The US dollar (US$) depreciated to a 6-month low at end-December but recovered subsequently on stronger-than-expected US economic data. Crude oil prices declined during October-December 2023 on slowing global demand and improved supply from countries outside of organization of the petroleum exporting countries (OPEC) but recovered thereafter in the wake of supply disruptions in key shipping routes and extension of production cuts by OPEC plus through June 2024. Food prices eased with the decline in prices of cereals, meat and vegetable oils, although sugar prices have firmed up. Turning to the domestic economy, the second advance estimates (SAE) released by the National Statistical Office (NSO) placed real gross domestic product (GDP) growth for 2023-24 at 7.6 per cent, underpinned by strong investment activity. On the supply side, gross value added (GVA) expanded by 6.9 per cent in 2023-24, with manufacturing and services sectors turning out to be the key drivers. Real GDP growth for Q3:2023-24 was placed at 8.4 per cent, outpacing consensus forecasts by a wide margin, underpinned by strong investment and an improvement in private consumption. Headline CPI inflation moderated to 5.3 per cent in October 2023-February 2024 from an average of 5.5 per cent in H1:2023-24. Sporadic food price shocks continued to impart significant volatility to the inflation trajectory, with headline inflation rising sharply in November and December 2023 due to a spike in vegetable prices. Core inflation (i.e., CPI excluding food and fuel) has, however, been on a steadily declining path. In February 2024, it fell to 3.4 per cent, among the lowest prints in the current CPI series (2012=100), driven by both core goods and services components. With the cumulative rate hike of 250 basis points (bps) undertaken during May 2022-February 2023 working its way through the economy, the Monetary Policy Committee (MPC) kept the policy repo rate unchanged at 6.50 per cent through H2 and remained resolute in its commitment to align inflation with the target, keeping in mind the objective of growth. Monetary Policy Committee Meetings: October 2023 – March 2024 When the MPC met in October 2023, global growth and trade were losing momentum, inflation was easing gradually but remained well above targets in major economies. Concerns about higher for longer interest rates were keeping financial conditions tight and imparting volatility to global financial markets. Domestically, CPI headline inflation rose sharply in July 2023 on the back of a spike in vegetable prices while core inflation softened. The projection of CPI inflation for 2023-24 was retained at 5.4 per cent as the spurt in vegetable prices was expected to be transitory. Domestic economic activity was showing resilience despite external headwinds. The real GDP growth projection for 2023-24 was retained at 6.5 per cent. The MPC observed that the unprecedented food price shocks were impinging on the evolving trajectory of inflation and that recurring incidence of such overlapping shocks could impart generalisation and persistence. Accordingly, the MPC unanimously decided to keep the policy repo rate unchanged at 6.50 and, by a majority of 5-1, voted to remain focused on the stance of withdrawal of accommodation to ensure that inflation progressively aligns with the target, while supporting growth. At the time of the December 2023 meeting, receding global inflation was engendering expectations of a reversal in the monetary policy cycle in AEs. Market sentiments improved amidst declining sovereign bond yields, a depreciating US dollar and strengthening global equity markets. In India, CPI headline inflation had fallen to 4.9 per cent (October 2023 print) from an average of 6.4 per cent during the previous quarter (July-September 2023). Furthermore, core inflation had moderated to levels last seen in Q4:2019-20. Domestic economic activity exhibited resilience, with real GDP growing by 7.6 per cent in Q2:2023-24, driven by robust investment and government consumption. The projection of real GDP growth for 2023-24 was revised up to 7.0 per cent while that of inflation was retained at 5.4 per cent. The MPC observed that recurring food price shocks were impeding the ongoing disinflation process and monetary policy needed to remain actively disinflationary to ensure anchoring of inflation expectations and fuller transmission. Against this backdrop, the MPC unanimously voted to keep the policy repo rate unchanged at 6.50 per cent and voted with a 5-1 majority to continue with the stance of withdrawal of accommodation. In the run up to the February 2024 meeting, headline CPI inflation had picked up to 5.7 per cent in December 2023, led primarily by an increase in vegetable price inflation, even as deflation in fuel prices deepened. Core inflation had softened to a four-year low of 3.8 per cent in December. Assuming a normal monsoon, CPI inflation was projected to decline to 4.5 per cent in 2024-25 from 5.4 per cent in 2023-24. Domestic economic activity was strengthening, with the first advance estimates (FAE) released by the NSO placing year-on-year (y-o-y) GDP growth at 7.3 per cent for 2023-24, underpinned by strong investment activity. Real GDP growth was projected at 7.0 per cent for 2024-25. The MPC noted that considerable uncertainty prevailed on the food price outlook from the possibility of adverse weather events. Upside risks to inflation also emanated from geopolitical developments and their impact on supply chains, volatility in international financial markets and uncertainty around commodity prices. The MPC decided by a majority of 5-1 to keep the policy repo rate unchanged at 6.50 per cent while retaining the stance of withdrawal of accommodation. | Table I.1: Monetary Policy Committee Meetings and Policy Rate Voting Patterns | | Country | Policy Meetings: October 2023 - March 2024 | | Total meetings | Meetings with full consensus | Meetings without full consensus | Variation in policy rate (basis points) | | Brazil | 4 | 4 | 0 | -200 | | Chile | 3 | 2 | 1 | -225 | | Colombia | 4 | 0 | 4 | -100 | | Czech Republic | 4 | 1 | 3 | -125 | | Hungary | 5 | 3 | 2 | -400 | | India | 3 | 2 | 1 | 0 | | Japan | 4 | 3 | 1 | 10 | | South Africa | 3 | 3 | 0 | 0 | | Sweden | 3 | 3 | 0 | 0 | | Thailand | 2 | 1 | 1 | 0 | | UK | 4 | 0 | 4 | 0 | | US | 4 | 4 | 0 | 0 | | Sources: Central bank websites. | The MPC’s voting pattern reflects the diversity in individual members’ assessments, expectations and policy preferences – a characteristic also reflected in voting patterns of other central banks (Table I.1). With the economic outlook diverging across countries, central banks’ policy rate decisions have become increasingly asynchronous. Central banks of Brazil and Chile, which tightened policy earlier, have reduced their policy rates since the second half of 2023 in response to declining inflation and in support of economic activity. On the other hand, Japan raised its benchmark policy rate for the first time in 17 years in March, ending eight years of negative interest rates. Macroeconomic Outlook Chapters II and III analyse macroeconomic developments relating to inflation and economic activity during H2:2023-24 (October 2023 - March 2024). Turning to the baseline assumptions, international crude prices exhibited sizeable two-way movements in H2, falling in October-December 2023 to around US$75 per barrel on slowing global demand amidst weak manufacturing activity and easing demand for transportation fuels as well as supply increases from non-OPEC countries. Amidst intensifying hostilities in the Middle-East, deep output cuts by OPEC plus, and incidents of supply outages, international crude prices moved higher from mid-December reaching an average close to US$ 85 per barrel in March. Geopolitical tensions imparted significant uncertainty to the outlook (Charts I.1a and I.1b). The spread between global petroleum product prices and crude prices eased from its recent peaks in mid-2022 but remains elevated by historical standards in view of demand-supply refinery mismatches (Chart I.1c). Taking into account these factors, the baseline assumption for crude price (Indian basket) is retained at US$ 85 per barrel (Table I.2). | Table I.2: Baseline Assumptions for Projections | | Indicator | MPR October 2023 | MPR April 2024 | | Crude Oil (Indian basket) | US$ 85 per barrel during H2:2023-24 | US$ 85 per barrel during 2024-25 | | Exchange rate | ₹82.5/US$ during H2:2023-24 | ₹83/US$ during 2024-25 | | Monsoon | 6 per cent below long period average for 2023-24 | Normal for 2024-25 | | Global growth | 3.0 per cent in 2023
3.0 per cent in 2024 | 3.1 per cent in 2024
3.2 per cent in 2025 | Fiscal deficit (per cent of GDP) | To remain within
BE 2023-24
Centre: 5.9
Combined: 8.5 | To remain within
BE 2024-25
Centre: 5.1
Combined: 7.7 | | Domestic macroeconomic/ structural policies during the forecast period | No major change | No major change | Notes: 1. The Indian basket of crude oil represents a derived numeraire comprising sour grade (Oman and Dubai average) and sweet grade (Brent) crude oil.
2. The exchange rate path assumed here is for the purpose of generating the baseline projections and does not indicate any ‘view’ on the level of the exchange rate. The Reserve Bank is guided by the objective of containing excess volatility in the foreign exchange market and not by any specific level of and/or band around the exchange rate.
3. BE: Budget estimates.
4. Combined fiscal deficit refers to that of the Centre and States taken together.
Sources: RBI estimates; Budget documents; and IMF. |
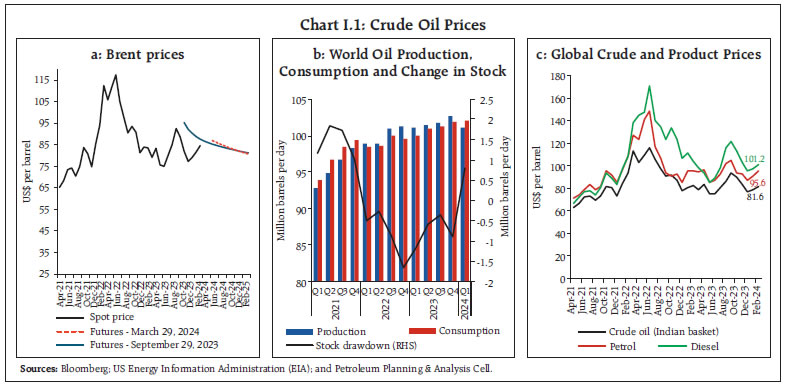 Second, the nominal exchange rate of the Indian rupee (₹) saw two-way movements in the range of ₹82.8-83.4 per US dollar in H2. Taking into consideration the uncertainty around US dollar movements, the ebbs and flows of global capital flows and international crude oil prices, the baseline assumption for the exchange rate is revised to ₹83 per US dollar. Third, the global growth forecast for 2024 was revised upwards by 20 bps to 3.1 per cent by the International Monetary Fund (IMF) in its January 2024 update of the World Economic Outlook (WEO) from its October 2023 projection. Global growth is expected to increase marginally to 3.2 per cent in 2025 (Chart I.2). Global trade growth (goods and services combined) is projected to accelerate from 0.4 per cent in 2023 to 3.3 per cent in 2024 and further to 3.6 per cent in 2025. Global GDP growth for 2024 and 2025 is expected to trail its historical (2000-19) average of 3.8 per cent as multiple headwinds – tighter monetary policy; withdrawal of fiscal stimulus given debt sustainability challenges; reduced pent-up demand; financial stability risks; continued geopolitical challenges; and geoeconomic fragmentation – weigh on prospects. Inflation is projected to decline in most regions in 2024 – more rapidly in AEs vis-à-vis EMEs – amidst unwinding of supply-side pressures, restrictive monetary policy, easing labour markets and the pass-through of earlier declines in energy prices. I.2 The Outlook for Inflation In H2, movements in headline inflation were driven by fluctuations in food prices even as core inflation witnessed a sustained decline (Chapter II). In the March 2024 round of the Reserve Bank’s inflation expectations survey1, both the three months and one year ahead median inflation expectations of urban households decreased by 20 bps vis-à-vis the previous round. Concomitantly, the proportion of respondents expecting the general price level to increase by more than the current rate decreased for both horizons vis-à-vis the previous round (Chart I.3). The distributional characteristics of inflation expectations contain useful forward-looking information about future inflation (Box I.1). 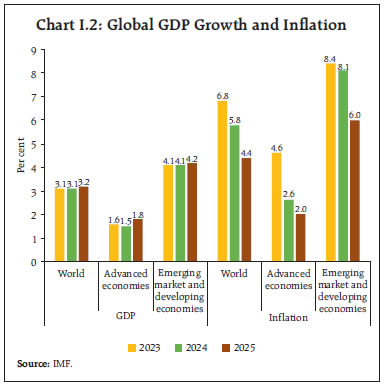
Box I.1: Information Content of the Distribution of Inflation Expectations Households’ inflation expectations are an important driver of consumption, savings and wage-setting behaviour. Given the innate heterogeneity, higher order moments of its distribution have useful forward-looking information about inflation, especially during regime shifts (Reis, 2021; Adrian, 2023). 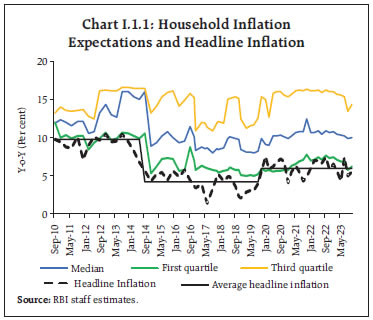 The distributional characteristics of inflation expectations are examined by partitioning the period January 2010 to January 2024 into three regimes, based on the breaks in headline inflation.2 This analysis suggests that the distribution was marked by low dispersion and negative skew during the high inflation episode of January 2010-July 2014, i.e., households’ inflation expectations were elevated and concentrated in a narrow band, with very few respondents expecting low inflation (Charts I.1.1 and I.1.2). With the adoption of flexible inflation targeting (FIT), the distribution became more dispersed and symmetric during August 2014-September 2019, with more households expecting lower inflation and diversity of expectations rising. During the subsequent period which was affected by the pandemic and war-led disruptions, there was a rise in median inflation expectations and uncertainty on dispersion across households increased. The distribution developed a negative skew as more households expected higher inflation. 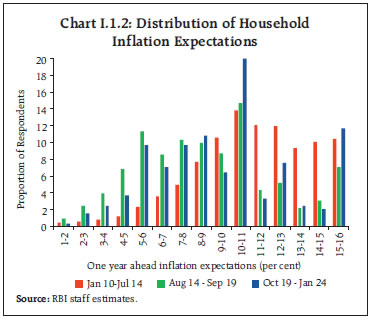
| Table I.1.1: Distributional Characteristics of Inflation Expectations and One Year Ahead Inflation | | | One year ahead headline inflation | | (1) | (2) | (3) | (4) | (5) | | Median | 0.0712 | | | | | | | (0.157) | | | | | | Mean | | 0.191 | | | | | | | (0.246) | | | | | Standard Deviation | | | -0.919*** | | | | | | | (0.328) | | | | Interquartile Range | | | | -0.377*** | | | | | | | (0.122) | | | Skewness | | | | | -1.673*** | | | | | | | (0.622) | | Headline inflation (t) | 0.307** | 0.267* | 0.223** | 0.302*** | 0.0992 | | | (0.139) | (0.146) | (0.102) | (0.092) | (0.132) | | Constant | 2.342* | 1.339 | 7.911*** | 6.092*** | 3.804*** | | | (1.286) | (2.048) | (1.891) | (1.188) | (0.672) | | R2 | 0.425 | 0.430 | 0.495 | 0.509 | 0.490 | | Observations | 61 | 61 | 61 | 61 | 61 | | Controls | Yes | Yes | Yes | Yes | Yes | Standard errors in parentheses.
* p < 0.10, ** p < 0.05, *** p < 0.01
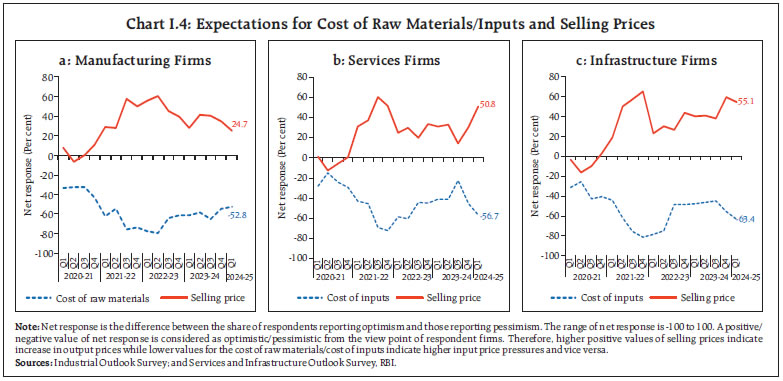
Source: RBI staff estimates. | The future information content of higher order moments of inflation expectations for the period January 2012-November 2023 is examined under: 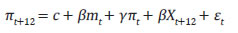 where, πt+12 is one year ahead headline CPI inflation, mt denotes moments of the distribution, πt is current inflation, Xt+12 are controls for one year ahead y-o-y change in global food prices as measured by the FAO index, crude oil prices (Indian basket) and the rupee-dollar exchange rate.εt is the error term. This model’s estimates suggest that median and mean of household expectations are slow-moving indicators and are not significant in predicting one year ahead inflation. On the other hand, measures of dispersion – standard deviation and interquartile range – are significant with a negative sign, suggesting that higher disagreement among households is associated with lower inflation. When inflation falls from its peak, a larger variance is associated with decreasing inflation, as informed households reduce their expectations early and the mass of the distribution follows with a lag (Marques et al., 2023). Skewness is also significant with a negative sign, as expected (Table I.1.1). References: Reis, R. (2021). “Losing the Inflation Anchor,” CEPR Discussion Paper No. DP16664, (London, Centre for Economic Policy Research). L. B. Marques, Gelos G., Hofman D., Otten J., Pasricha G. K., Strauss Z. (2023). “Do Household Expectations Help Predict Inflation?”, IMF Working Paper WP/23/224. T. Adrian (2023). “The Role of Inflation Expectations in Monetary Policy”, IBF / Deutsche Bundesbank Symposium | Manufacturing firms polled in the January-March 2024 round of the Reserve Bank’s industrial outlook survey expect easing in cost pressures from raw materials as well as selling prices in Q1:2024-25 vis-à-vis the previous round (Chart I.4a).3 In contrast, services sector companies expect higher input cost pressures and growth in selling prices in Q1:2024-25, while infrastructure firms expect higher input cost pressures but lower growth in selling prices (Charts I.4b and I.4c).4 In the PMI surveys, manufacturing firms reported increased input cost pressures but slower output price increases in March 2024. Services firms reported higher input and output prices, with a marked increase in the rate of inflation in March 2024. Professional forecasters surveyed by the Reserve Bank in March 2024 expected headline CPI inflation to moderate from 5.4 per cent in Q3:2023-24 to 5.1 per cent in Q4, 5.0-3.8 per cent in H1:2024-25, and 4.8-4.6 per cent in H2 (Chart I.5a and Table I.3).5 They expected core inflation (i.e., CPI excluding food and beverages, pan, tobacco and intoxicants, and fuel and light) at 3.4 per cent in Q4:2023-24 and Q1:2024-25, increasing progressively to 3.7 per cent in Q2, 4.1 per cent in Q3, and 4.3 per cent in Q4. Their 5-year ahead inflation expectations remained unchanged at 4.7 per cent, while their 10-year ahead inflation expectations declined by 20 bps to 4.3 per cent in the March 2024 round from the previous round (Chart I.5b). 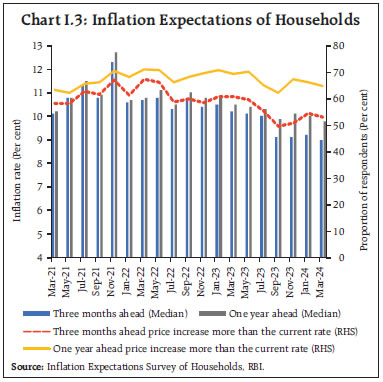
Looking ahead, the outlook for inflation will be contingent largely on the evolving food inflation dynamics. Rabi sowing has exceeded last year’s levels, but pulses have witnessed a decline. According to the second advance estimates, the production of cereals, pulses and oilseeds has trailed last year’s level. Water reservoir levels remain significantly below the level of last year and of the decadal average. Vegetable prices are undergoing seasonal correction unevenly. The continuing pass-through of monetary policy actions and stance, on the other hand, is keeping core inflation subdued. Adverse weather events and continuing geopolitical hostilities, however, remain the key risks. Taking into account the initial conditions, signals from forward-looking surveys and estimates from time-series and structural models6, CPI inflation is projected to average 4.5 per cent in 2024-25 – 4.9 per cent in Q1, 3.8 per cent in Q2, 4.6 per cent in Q3 and 4.5 per cent in Q4, with risks evenly balanced (Chart I.6). The 50 per cent and the 70 per cent confidence intervals for headline inflation in Q4:2024-25 are 3.2–5.8 per cent and 2.5–6.5 per cent, respectively. For 2025-26, assuming a normal monsoon and no further exogenous or policy shocks, structural model estimates indicate that inflation will average 4.1 per cent, in a range of 3.9–4.3 per cent. In Q4:2025-26, CPI inflation is projected at 4.0 per cent, with the 50 per cent and the 70 per cent confidence intervals at 2.7–5.3 per cent and 2.0–6.0 per cent, respectively. 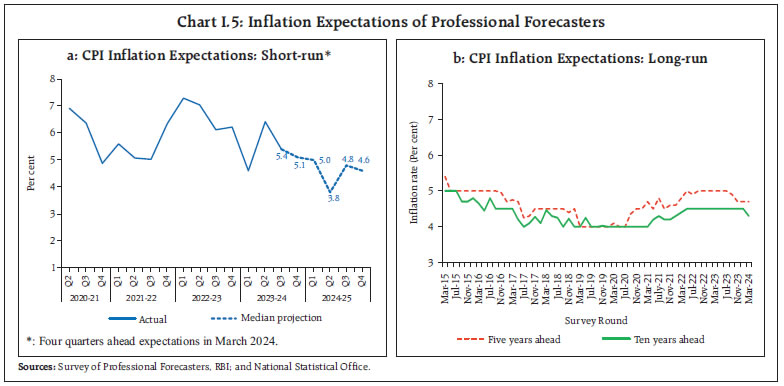
| Table I.3: Projections - Reserve Bank and Professional Forecasters | | (Per cent) | | | 2023-24 | 2024-25 | 2025-26 | | Reserve Bank’s Baseline Projections | | | | | Inflation, Q4 (y-o-y) | 5.0 | 4.5 | 4.0 | | Real GDP growth | 7.6 | 7.0 | 7.0 | | Median Projections of Professional Forecasters | | | | | Inflation, Q4 (y-o-y) | 5.1 | 4.6 | - | | Real GDP growth | 7.6 | 6.7 | 6.5 | | Gross domestic saving (per cent of GNDI) | 30.4 | 31.6 | 30.0 | | Gross capital formation (per cent of GDP) | 32.6 | 33.3 | 33.9 | | Credit growth of scheduled commercial banks | 16.9 | 13.5 | 13.5 | | Combined gross fiscal deficit (per cent of GDP) | 8.9 | 8.1 | 7.5 | | Central government gross fiscal deficit (per cent of GDP) | 5.8 | 5.1 | 4.5 | | Repo rate (end-period) | 6.50 | 6.00 | - | | Yield on 91-days treasury bills (end-period) | 6.9 | 6.4 | 6.3 | | Yield on 10-year central government securities (end-period) | 7.1 | 6.8 | 6.5 | | Overall balance of payments (US$ billion) | 50.0 | 39.8 | 30.2 | | Merchandise exports growth | -3.7 | 3.3 | 6.2 | | Merchandise imports growth | -5.5 | 4.8 | 7.5 | | Current account balance (per cent of GDP) | -1.0 | -1.2 | -1.1 | Note: GNDI: Gross National Disposable Income.
Sources: RBI staff estimates; and Survey of Professional Forecasters (March 2024). | These baseline forecasts are subject to several upside and downside risks. The upside risks emanate from persistent food price pressures from extreme weather-related disturbances; an escalation in geopolitical hostilities which could further aggravate supply disruptions; increased volatility in prices of key commodities, particularly crude oil; and a larger pass-through of input cost pressures to output prices as demand gains strength. The downside risks emanate from an early resolution of geopolitical conflicts; a pronounced slowdown in the global demand with further easing of global commodity prices; and an improvement in supply responses of key primary commodities. I.3 The Outlook for Growth Domestic economic activity is supported by an upturn in the investment cycle on the back of the government’s continued thrust on capital expenditure, higher capacity utilisation, underlying resilience of the services sector, double digit credit growth, and healthier corporate and bank balance sheets. Escalating geopolitical tensions, new flashpoints choking arterial routes of global trade, and volatile global financial conditions, however, impart uncertainty to the outlook. 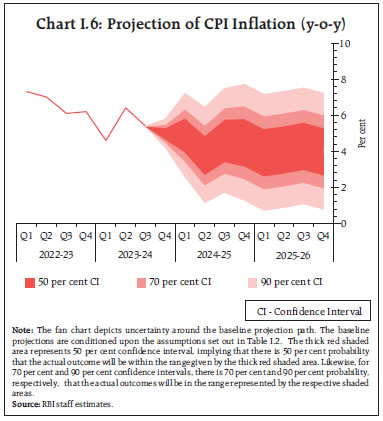 Turning to the key messages from forward-looking surveys, consumer confidence of urban households (the current situation index) improved further in the March 2024 survey round vis-à-vis the previous round, reaching closer to the neutral level on the back of improved perceptions on general economic conditions and the employment situation. Consumers’ future outlook—for the year ahead—continued in optimistic territory and registered a new peak since the onset of the pandemic, propelled by improvement in all parameters (Chart I.7).7 In the Reserve Bank’s industrial outlook survey of January-March 2024, manufacturing firms were optimistic on the business outlook during Q1:2024-25, albeit with waning sentiments from the previous round (Chart I.8a). Services and infrastructure companies remained upbeat on the overall business situation in Q1:2024-25, though with some moderation in sentiments for the latter (Charts I.8b and I.8c). Recent surveys by other agencies generally reported sequential improvement in business expectations relative to the previous round (Table I.4). Manufacturing and services firms in the latest PMI surveys exhibited optimism for the year ahead. Professional forecasters polled in the March 2024 round of the Reserve Bank’s survey expected real GDP growth at 6.0 per cent in Q4:2023-24, 6.7 per cent in H1:2024-25, and 6.6-6.8 per cent in H2 (Chart I.9 and Table I.3). Overall, the outlook for growth is improving on the back of domestic drivers of demand, although persisting uncertainties on the global front pose risks to the outlook. Taking into account the baseline assumptions, survey indicators and model forecasts, real GDP growth is expected at 7.0 per cent in 2024-25 – 7.1 per cent in Q1; 6.9 per cent in Q2; and 7.0 per cent each in Q3 and Q4 - with risks evenly balanced around this baseline path (Chart I.10 and Table I.3). For 2025-26, assuming a normal monsoon and no major exogenous or policy shocks, structural model estimates indicate real GDP growth at 7.0 per cent, with quarterly growth rates in the range of 6.7-7.4 per cent. 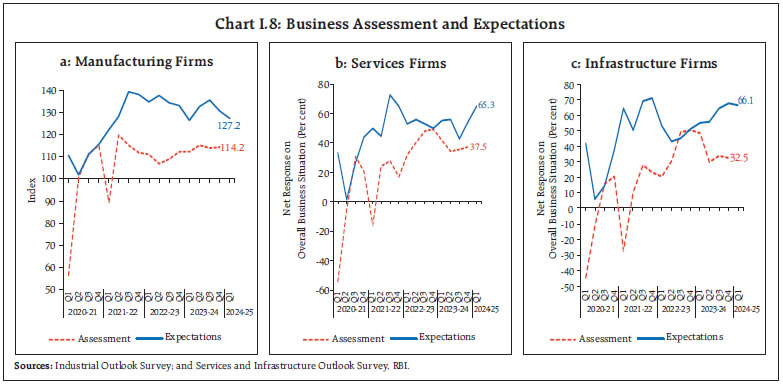
| Table I.4: Business Expectations Surveys | | Item | NCAER Business Confidence Index (January 2024) | FICCI Overall Business Confidence Index (February 2024) | Dun and Bradstreet Composite Business Optimism Index (February 2024) | CII Business Confidence Index (January 2024) | | Current level of the index | 127.6 | 70.9 | 72.8 | 67.8 | | Index as per previous survey | 140.7 | 66.9 | 70.3 | 67.1 | | % change (q-o-q) sequential | -9.3 | 5.9 | 3.6 | 1.0 | | % change (y-o-y) | 0.8 | 16.2 | -5.8 | 0.3 | Notes: 1. NCAER: National Council of Applied Economic Research.
2. FICCI: Federation of Indian Chambers of Commerce & Industry.
3. CII: Confederation of Indian Industry.
4. Dun and Bradstreet Composite Business Optimism Index is for Q4:2023-24, and the rest pertain to Q3:2023-24.
Sources: NCAER; FICCI; CII; and Dun & Bradstreet Information Services India Pvt. Ltd. | There are upside and downside risks to this baseline growth path. The upsides emanate from a stronger growth in the manufacturing and services sectors sustained by strong domestic demand; upbeat business optimism; accelerated private investment spurred by government’s continued capex push; an early resolution of geopolitical conflicts; faster disinflation; and improvement in global trade and supply chains. On the contrary, further escalation in geopolitical tensions and geoeconomic fragmentation; unexpected spurts in global commodity prices; increased volatility in international financial markets; deceleration in global trade and demand; and frequent weather-related disturbances due to climate change pose downside risks to the baseline growth path.
I.4 Balance of Risks The projections of growth and inflation presented in this chapter are, inter alia, conditioned on the assumptions set out in Table 1.2. These are subject to uncertainties on the global growth outlook, crude oil prices, exchange rate and food prices. Against this backdrop, this section explores the alternative scenarios to assess the balance of risks to the baseline projections. (i) Global Growth Uncertainties Global economic activity moderated in H2:2023 but remained more robust than anticipated earlier. With inflation declining and growth holding firm, the likelihood of a soft landing has increased for the global economy. There are, however, downside risks, going forward. The escalation in geopolitical tensions in West Asia hampering shipping through the Suez Canal and resultant supply disruptions could keep inflation elevated, delaying the easing of monetary conditions. Furthermore, if the last mile of disinflation turns out to be protracted, it may require interest rates to remain higher for longer thereby posing considerable downside risks to growth. At high risk are less developed economies with relatively elevated debt-to-GDP ratio. Rising trade distortions and geoeconomic fragmentation could also weigh on global trade and growth. All these factors can pull down global growth well below the baseline. In such a scenario, if global growth is 100 bps lower than the baseline, domestic growth and inflation could be around 30 bps and 15 bps, respectively, below their baseline trajectories. Conversely, on the upside, a faster disinflation could allow monetary authorities to reduce policy rates earlier than anticipated, easing financial conditions further, improving sentiments and providing a fillip to global growth. Further, a greater push for supply-side reforms and harnessing of new technologies such as artificial intelligence could provide a boost to productivity, global growth and demand. In this scenario, if global growth is higher by 50 bps, domestic growth and inflation could edge higher by around 15 bps and 7 bps, respectively (Charts I.11a and I.12a). (ii) International Crude Oil Prices Global crude oil prices have remained highly volatile, with Brent crude falling from a high of US$ 95 in early October 2023 to below US$ 75 by mid-December, before rebounding and settling above US$ 80 in the first quarter of 2024. An escalation in the conflict in West Asia and logistical impediments in key trade routes may cause serious disruptions in the oil market. Assuming crude oil price to be 10 per cent above the baseline, domestic inflation could be higher by 30 bps and growth weaker by around 15 bps, respectively. Conversely, de-escalation of geopolitical tensions along with a further weakening of global demand may pull down crude oil prices. If crude oil prices fall by 10 per cent relative to the baseline and assuming their full pass-through to the domestic product prices, inflation could ease by around 30 bps with a boost of 15 bps to India’s real GDP growth (Charts I.11a and I.12a). (iii) Exchange Rate In H2, the Indian Rupee (INR) moved bi-directionally against the US dollar. Looking ahead, a ‘higher for longer’ interest rate scenario could keep risk aversion towards EME assets elevated, impinging upon capital flows. Concerns around public debt in EMEs, particularly in those with large foreign currency debt, could induce flight to safety and a broad-based depreciation of EME currencies. Crude oil and other commodity prices could harden over the baseline. Should the INR depreciate by 5 per cent from the baseline assumption, inflation could edge up by around 35 bps while GDP growth could be higher by around 25 bps through stimulating exports. On the other hand, the Indian economy remains the fastest growing large economy in the world and is pivotal to the global outlook. Sustained global disinflation and the accompanying scenario of monetary easing in AEs along with the strengthening of domestic macroeconomic fundamentals and the inclusion of government bonds in global indices could enhance India’s attractiveness as a destination for foreign investors. In this scenario, if the INR appreciates by 5 per cent relative to the baseline, inflation and GDP growth could moderate by around 35 bps and 25 bps, respectively (Chart I.11b and I.12b). 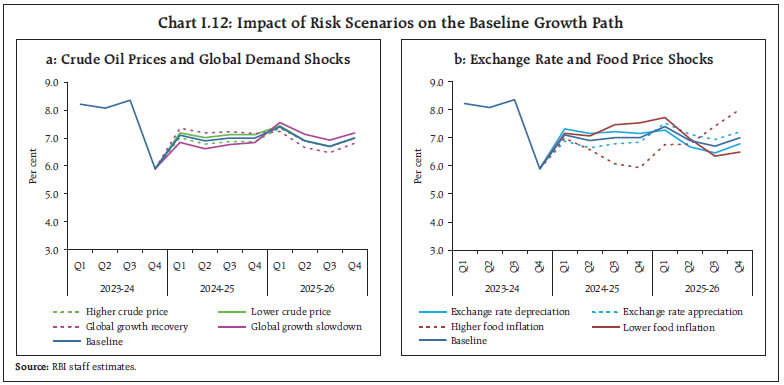 (iv) Food Inflation Food inflation exhibited sizeable volatility in H2:2023-24, driven by large shocks to vegetable prices. Erratic rainfall and deficient soil moisture hindered rabi sowing, although the effect was uneven across crops and regions. While crops such as wheat, oilseeds and coarse cereals witnessed an increase in acreage, area sown under pulses declined by over 6 lakh hectares year-on-year. Water reservoir levels have dipped below the decadal average. According to the SAE, production of cereals, pulses and oilseeds in 2023-24 was lower than a year ago. These developments impart uncertainty to the outlook on food prices. The global food price outlook is also subject to significant upside risks from the historically unprecedented heat wave sweeping across the globe. The India Meteorological Department (IMD) has forecast above-normal temperatures and heatwave days during the summer season. Climate change has increased the frequency and ferocity of weather shocks, posing challenges for monetary policy (Box I.2). All these developments could impart upside risk to the domestic food inflation trajectory and could raise headline inflation by around 100 bps over the baseline. On the other hand, ample foodgrains buffer stocks and effective supply management could help ease food inflationary pressures and pull headline inflation 50 bps below the baseline. Box I.2: Climate Change and Monetary Policy Global average temperatures are on a rise, with accompanying increase in extreme weather events (EWE), and the economic and social impact of global warming is becoming increasingly evident. There are different channels through which climate change can affect monetary policy. First, climate change directly impacts inflation through adverse weather events affecting agricultural production and global supply chains. Second, climate change could impact the natural rate of interest due to increasing temperatures and occurrence of EWE undermining productivity and lowering potential output. Thirdly, the after-effects of climate change might weaken the transmission of monetary policy actions to financing conditions faced by households and firms (Schnabel, 2021). For these reasons, central banks are increasingly incorporating climate risks explicitly into their modelling frameworks. A New-Keynesian model that incorporates a physical climate risk damage function calibrated with aspects of the National institute Global Econometric Model (NiGEM) is used to estimate the counterfactual macroeconomic impact of climate change (Scenario 1) vis-à-vis a no climate change scenario (Baseline) (RBI, 2023; Dafermos, 2022). In the absence of any climate mitigation policies, the long-term output will be lower by around 9 per cent by 2050 vis-à-vis a no climate change scenario with full pass-through of the physical risks of climate change to the economy. Both inflation and its volatility may increase over time (RBI, 2023). Lower productivity may lead to a fall in the natural rate of interest. Frequent shocks to inflation will, however, necessitate tighter monetary policy even with a lower natural rate of interest (Chart I.2.1). Furthermore, if inflation hysteresis gets entrenched, it may lead to de-anchoring of inflation expectations. The undermining of the central bank’s credibility would warrant even higher interest rates to rein in inflation, entailing greater loss of output (Scenario 2, Chart I.2.1). References: Dafermos, Y (2022), Monetary policy and the macroeconomic modelling of climate change, ASEAN Core Curriculum on Climate Risk Resilience/Sustainable Finance. RBI, (2023), Chapter II: Macroeconomic Effects of Climate Change in India, Report of Currency and Finance. Schnabel, I. (2021), Central banks must do their part in fighting global warming, available at https://www.imf.org/en/Publications/fandd/issues/2021/09/isabel-schnabel-ECB-climate-change | I.5 Conclusion Amidst global challenges, the Indian economy has stayed resilient. Buoyed by strong domestic demand and backed by robust macroeconomic fundamentals, India has emerged as the fastest growing major economy of the world in 2023-24. The upturn in the investment cycle, broad-based revival in manufacturing and services sectors, government’s capex push, upbeat business and consumer sentiments and strong corporate and bank balance sheets provide impetus to the growth momentum going forward. Volatile food prices, however, interrupt the path of disinflation and cloud the inflation outlook. The continuing effect of monetary policy action and stance is keeping core inflation muted. Spillovers from geopolitical hostilities, volatile global financial markets and climate shocks are the key risks to the growth and inflation outlook. _________________________________________________________________________________
II. Prices and Costs Headline inflation has been on a moderating path during H2:2023-24 with resurgences in food price pressures interrupting the descent, even as core inflation softened across its goods and services components. Industrial and farm input price pressures remain muted, and nominal rural and organised sector wage growth stays steady. Going forward, the risks to the 'last mile' of disinflation process may emanate from incidence of unpredictable supply side shocks. Since August 2023, headline consumer price index (CPI) inflation1 has been on a moderating trajectory, troughing at 4.9 per cent in October 2023. A resurgence of food price pressures pushed it up to 5.7 per cent in December, despite steady core (CPI excluding food and fuel)2 disinflation and a deepening fuel price deflation. In January-February 2024, headline inflation eased to 5.1 per cent, with both food and core inflation easing and fuel prices remaining in deflation (Chart II.1). Notwithstanding the moderation, food inflation remained elevated. The softening of core inflation to 3.4 per cent in February, among the lowest prints in the current CPI series (2012=100), was broad based across its goods and services components. 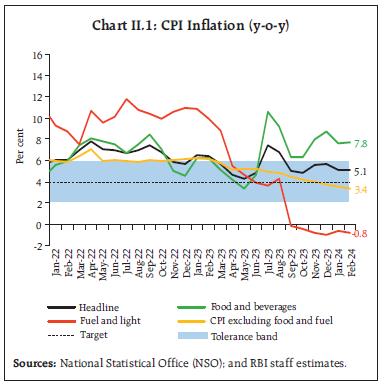 The Reserve Bank of India (RBI) Act enjoins the RBI to set out deviations of actual inflation outcomes from projections, if any, and explain the underlying reasons thereof. The October 2023 MPR had projected inflation to edge down to 5.6 per cent in Q3:2023-24 and further to 5.2 per cent in Q4 (Chart II.2). Actual inflation at 5.4 per cent in Q3 and at 5.1 per cent in Q4 (January-February 2024) was lower than the projections by 20 basis points (bps) and 10 bps, respectively. The undershooting of inflation came about from food as well as core components. Proactive supply side interventions helped to contain the build-up of price pressures, especially in respect of onions, cereals and pulses. In the core component, the softening of services inflation, particularly under housing, turned out to be sharper than anticipated. II.1 Consumer Prices Headline inflation dynamics in H2:2023-24 were broadly shaped by the interplay between volatile food price momentum and base effects3. Favourable base effects and sharp negative price momentum – from a part reversal of the spike in vegetable prices in July, sharp decline in LPG prices and muted rise in core CPI prices – pulled down headline inflation from 6.8 per cent in August to 5.0 per cent in September. Thereafter, by November, headline inflation edged up on a significant pick-up in food price momentum and unfavourable base effects. Although the momentum turned negative in December, a strong unfavourable base effect, primarily from the food group, pushed up headline inflation further to 5.7 per cent. In January 2024, the decline in momentum, driven by correction in food prices along with favourable base effects, led to a softening of headline inflation to 5.1 per cent. It remained steady in February as a positive price momentum in food and core was evened out by favourable base effects from fuel and core groups (Chart II.3). A comparison of the distribution of CPI inflation in 2023-24 vis-à-vis 2022-23 indicates that a fall in the mean of the distribution to 5.4 per cent in 2023-24 (April-February) from 6.8 per cent in the corresponding period of 2022-23 coexisted with a marked increase in its standard deviation (Chart II.4). Furthermore, inflation variability across CPI remained high in H2 of 2023-24 (Chart II.5), attesting to the lingering impact of overlapping supply side shocks on the inflation formation process. 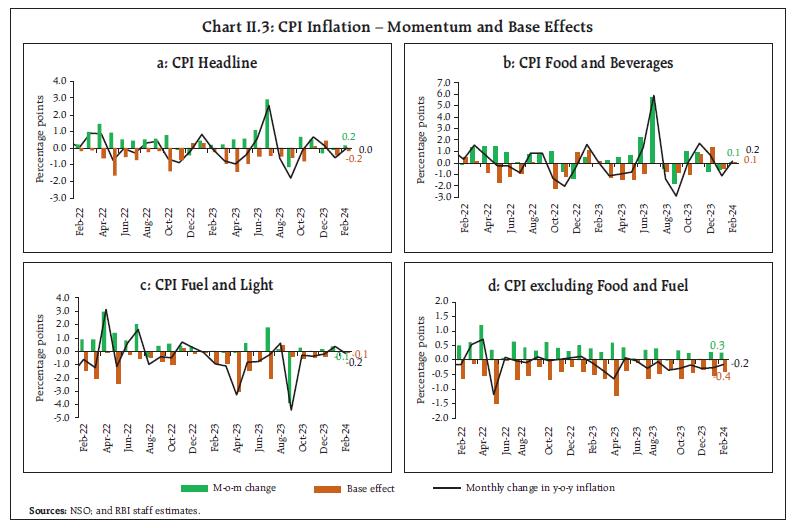 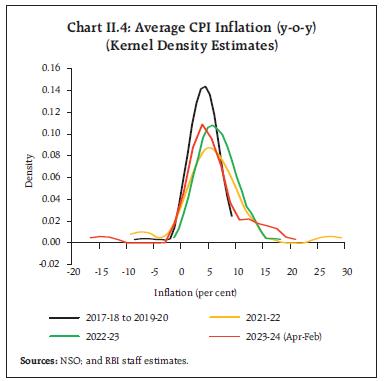 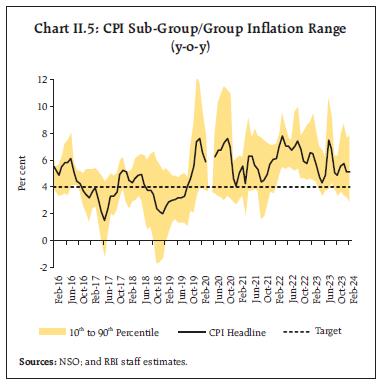 Headline CPI diffusion indices (DIs)4 remained elevated since August 2023, driven largely by CPI goods, with some moderation observed in February 2024. DI for CPI services corrected during November-December, but it registered a pick-up in January-February (Chart II.6a). Even as CPI DIs remained in the expansionary zone, threshold DI5 – for price increases in excess of 4 per cent as well as 6 per cent on a seasonally adjusted annualised rate (saar) basis – slipped further into the contractionary zone in H2:2023-24, indicating that a generalised and durable disinflation is underway in 2023-24 so far (Chart II.6b). II.2 Drivers of Inflation A historical decomposition of inflation using a vector autoregression (VAR)6 model indicates that the moderation in inflation in Q3:2023-24 and Q4 came from weakening of supply side shocks, especially in food prices from a spike in Q2, and from the transmission of past monetary policy actions (Chart II.7a). Price inflation in goods (with a weight of 76.6 per cent in overall CPI) contributed to around 80 per cent of headline inflation during August-December 2023 and services (with a weight of 23.4 per cent) contributed the remaining 20 per cent. By February 2024, the contribution of goods to overall inflation rose to around 86 per cent (Chart II.7b). Perishable items (non-durable with a 7-day recall7), which include vegetables, spices, fruits and other food items such as milk, meat and fish and prepared meals, contributed most to goods inflation variability. Among semi -perishables (non-durable goods with a 30-day recall), cereals, pulses, electricity, personal care items (like toiletries) and medicines were the main drivers of inflation. Broadly, the contribution of durables (goods with a 365-day recall) like clothing and footwear items, motorcycles/scooters and household goods (furniture and electronic items) to overall inflation came down from around 12 per cent during September-November 2023 to around 8 per cent in February 2024. Analysis of price setting behaviour suggests that after adjusting for idiosyncratic item-specific price shocks, economy wide price shocks tend to lead to more frequent change in food prices. Core prices tend to be stickier (Box II.1). 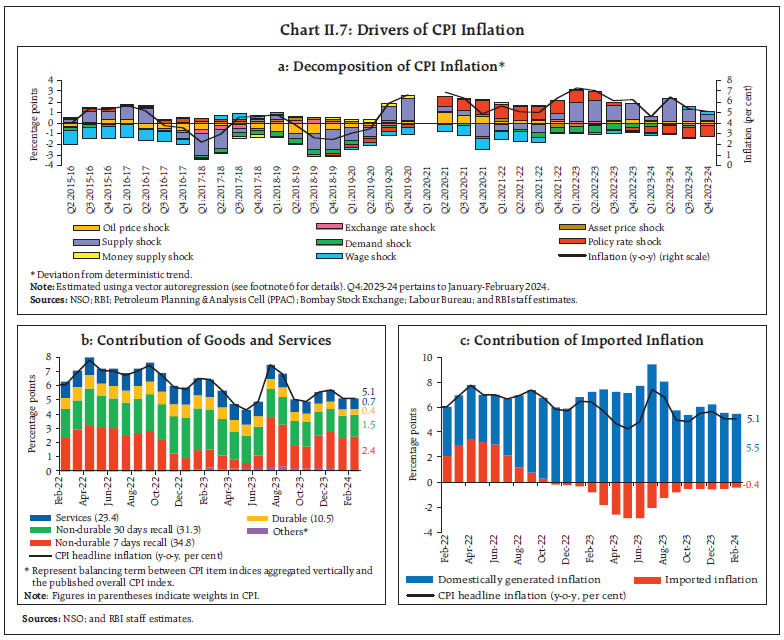
Box II.1: Sticky and Flexible Prices The extent of price stickiness or the degree of responsiveness of retail prices to changing market conditions has a considerable bearing on persistence observed in the inflation process and the impact of monetary policy actions on macroeconomic variables. Price stickiness in CPI item level data for the period Jan-2014 to Jan-2024 is analysed based on the indirect frequency approach (Banerjee and Bhattacharya, 2017)8. After controlling for idiosyncratic price shocks9 that is specific to each item in CPI basket, the results indicate that the probability of price changes in food and core (CPI excluding food and fuel) in a month from economy-wide aggregate shocks is 24 per cent and 20 per cent, respectively. In terms of duration of price spell, economy wide shocks could translate to price changes, on an average, every 3.9 months for CPI food and 5.6 months for CPI core items (Table II.1.1), with the average size of price changes being higher in case of food. A statistically significant positive correlation between frequency and size of price change (0.46) indicates that exogenous price shocks often trigger corresponding price adjustments. | Table II.1.1: CPI Price Stickiness# – Stylised Facts | | CPI Groups | Probability of price change in a month | Duration of price stickiness (in months) | Average size of price change (per cent) | | CPI Food | 0.24 | 3.88 | 0.50 | | CPI Fuel | 0.18 | 5.74 | 0.47 | | CPI Core (CPI excl. food & fuel) | 0.20 | 5.55 | 0.40 | #: Controlling for idiosyncratic price shocks
Source: RBI staff estimates. |
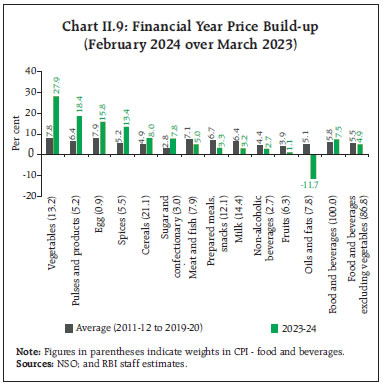
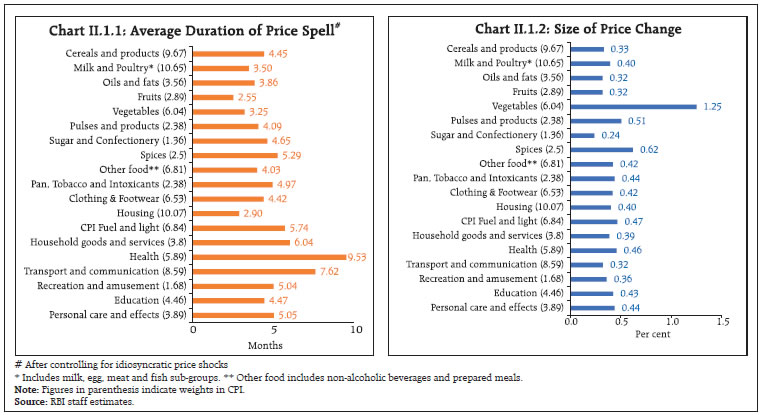 In terms of sub-groups, the duration of price stickiness within food group is lower for perishable items like vegetables and fruits, signifying more frequent incidence of price changes due to shocks. Within the non-food sub-groups/ groups, higher duration of price spells were seen in sub-groups of health, transport and communication, and household goods and services, implying higher price stickiness10 (Chart II.1.1). Vegetables, with an average month-on-month price increase of 1.25 per cent, is an outlier when compared to other sub-groups. Excluding vegetables, the size of monthly price changes, on an average, has been in the range of 0.24 per cent to 0.62 per cent (Chart II.1.2). The analysis shows that core prices tend to be stickier while food prices are vulnerable to exogenous shocks. Given the overlapping nature of shocks to food sector in recent times (Patra et al. 2024), the evolving food price trajectory also needs to be carefully monitored for its implications on headline inflation persistence and anchoring of inflation expectations. References: Patra, M. D., John, J., & George, A. T. (2024). Are Food Prices the ‘True’ Core of India’s Inflation?, RBI Bulletin, Vol. 78(1). Banerjee, S., & Bhattacharya, R. (2019). Micro-level Price Setting Behaviour in India. Economic & Political Weekly, 54(49), 35. | With the gradual moderation in international commodity prices since September 2022, the contribution of imported components11 to headline inflation turned negative from the end of 2022, driven by y-o-y decline in the prices of edible oils, energy, electronic goods parts and polymer (Chart II.7c). Deflation in international commodity prices of precious metals (gold; silver), energy (LPG; crude oil), palm kernel, electronic goods parts and polymer prices abated since July 2023; as a result, the contribution of imported inflation in pulling down headline inflation lessened to (-)0.5 percentage points in October 2023 from (-)2.9 percentage points in June 2023, and broadly remained stable thereafter. CPI Food Group Food and beverages (weight of 45.9 per cent in the CPI basket) inflation, which increased sharply in July-August 2023 due to a spike in vegetables prices caused by excess rainfall/floods and supply disruptions, moderated in September-October with the normalisation of supply chains and fresh crop arrivals. The softening was short-lived, however, and food inflation picked up again in November-December and remained elevated at 7.8 per cent in February 2024, primarily driven by increase in inflation of vegetables, pulses, as well as from an uptick in egg, meat and fish inflation in February. Food inflation excluding vegetables, however, moderated from 6.8 per cent in September 2023 to 4.9 per cent in February 2024, on the back of easing of inflation in cereals, milk, spices and prepared meals. Oils and fats sub-group has been in deflation since February 2023 (Chart II.8). Though vegetable prices dominated the overall food price build-up during 2023-24 so far, pulses, eggs, spices, cereals and sugar also registered substantial price increases, much higher than historical patterns. This was, however, offset by meat and fish, prepared meals, milk, non-alcoholic beverages and fruits which experienced lower price build-up this year than their pre-COVID long-term averages. Moreover, oils and fats registered significant price decline. As a result, price build-up in food excluding vegetables was lower than that in the pre-COVID period (Chart II.9). 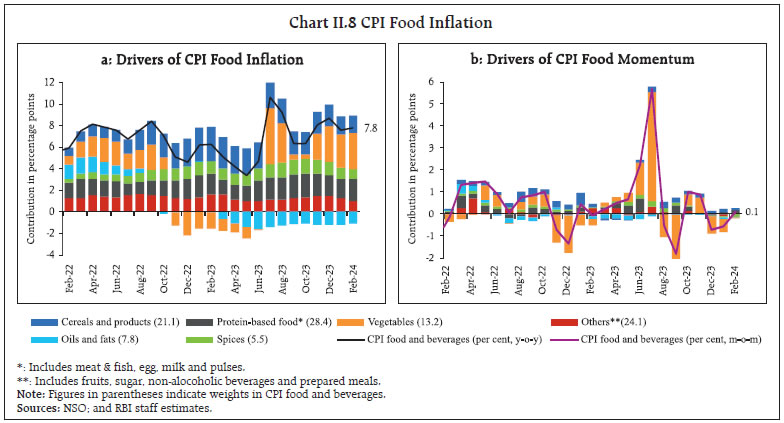
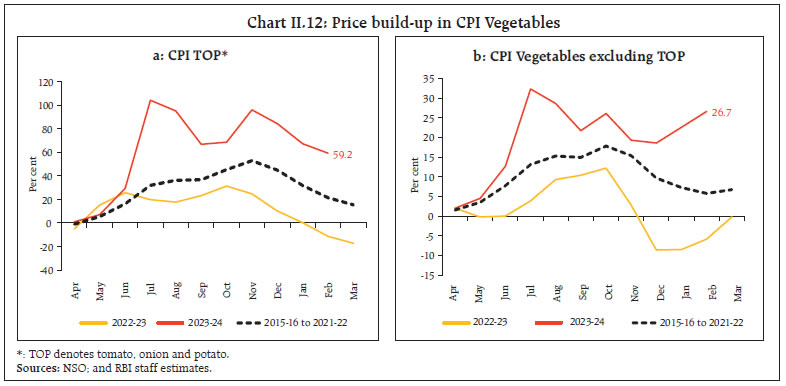
 The relatively shallower winter easing in vegetables prices during November 2023-February 2024 was primarily driven by lower market arrivals due to unseasonal rainfall in some parts of the country; above-normal temperatures owing to prevailing El-Niño conditions turning unfavourable for winter crop yields; lower production of some vegetables like garlic; and higher demand during the festival season. Moreover, deficient production in kharif pulses [(-) 6.6 per cent as per the second advance estimates (SAE) of 2023-24 over final estimates (FE) of 2022-23] on top of a decline in year-on-year (y-o-y) production in 2022-23 contributed to the hardening of inflation in pulses. The observed price pressures in the food and beverages group, however, was not broad-based as inflation remained below 4 per cent for items weighing almost 50 per cent in the food basket in February 2024. Inflation in cereals (weight of 9.7 per cent in the CPI and 21.1 per cent in the food and beverages group) moderated from 10.9 per cent in September 2023 to 7.6 per cent in February 2024 (Chart II.10). While rice prices, on a y-o-y basis, remained in double digits, prices of wheat (y-o-y) witnessed a sustained moderation since March 2023. Rice prices (y-o-y) were elevated as supply conditions remained tight despite restrictions on rice exports due to lower production [(-) 1.4 per cent based on the SAE of 2023-24 over FE of 2022-23]. Comfortable buffer stocks of rice (7.6 times the norm as of March 16, 2024) along with price stabilisation measures, including extension of 20 per cent duty on exports of parboiled rice; fixing the minimum export prices (MEP) of basmati rice at US$ 950 per tonne; increased offloading under the Open Market Sale Scheme (OMSS); and a targeted sale of newly launched ‘Bharat Rice’ at a fixed price (₹29 per kg) are likely to improve domestic availability and enable ebbing of price pressures in the medium term. In the case of wheat, price stabilisation measures including tightening of stock limits with respect to traders/wholesalers and retailers; the increased offloading of stocks under the OMSS; the sale of newly launched ‘Bharat Atta’ at a fixed retail price (₹27.5 per kg); and the ban/restriction on wheat exports since May 2022 helped contain inflation. The hike in the minimum support price (MSP) of wheat by 7.1 per cent in the rabi marketing season (RMS) of 2024-25 and an improved acreage by 1.2 per cent in the 2023-24 rabi season augurs well for higher wheat production and domestic supply. The SAE of 2023-24 indicates an increase in production of wheat by 1.3 per cent over the FE of 2022-23. 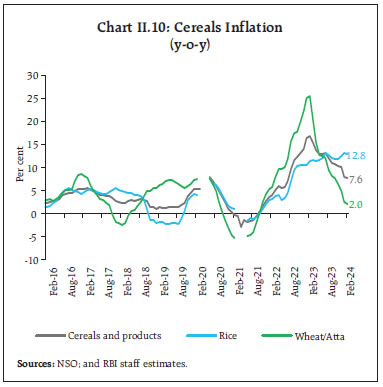 Vegetables (weight of 6.0 per cent in the CPI and 13.2 per cent in the food and beverages group) price inflation moderated in September-October 2023 but increased in November 2023-February 2024 due to less than usual winter easing in prices, above-normal temperatures, and cold waves in some parts of northern India (Chart II.11). Among key vegetables, onion prices increased sharply in November 2023 with a y-o-y inflation of 86.3 per cent driven by lower kharif acreage and fall in production [(-)15.7 per cent in 2023-24 as per the first advance estimates (FAE) over FE of 2022-23] due to erratic rainfall, on top of a production shortfall in the previous year. Onion prices fell in December 2023-February 2024 as price stabilisation measures such as imposition of 40 per cent export duty, followed by prohibition of exports, increased procurement, and offloading of onions at a fixed retail price (₹25 per kg) from select outlets helped improve domestic availability and contain price pressures. Tomato prices recorded y-o-y deflation in September-October 2023 after the surge in July-August due to floods and supply bottlenecks in some parts of the country. Inflationary pressures, however, recurred in November due to unseasonal rainfall which damaged crops. Potato prices, however, remained in deflation since February 2023 till January 2024 on account of higher production last year (an increase of 7.1 per cent in 2022-23 over FE of 2021-22). Production in 2023-24 experienced some shortfall [(-)1.9 per cent in 2023-24 as per the FAE over FE of 2022-23]. Potato prices increased in February, on a y-o-y basis, primarily due to an adverse base effect. Vegetables excluding TOP (tomato; onion; and potato) category like garlic, cauliflower and cabbage also witnessed lower than usual price correction during November 2023-February 2024, thereby emerging as major drivers of vegetables inflation (Chart II.11). More specifically, the lower production of garlic [(-) 0.8 per cent in 2023-24 as per the FAE over 2022-23 on top of (-) 8.1 per cent in 2022-23 over 2021-22] resulted in sustained price pressures leading to triple digit inflation since September 2023 – reaching 264.3 per cent in February 2024. As a result, vegetable price build-ups across TOP and non-TOP categories turned out to be much larger than usual in the financial year so far (Chart II.12). 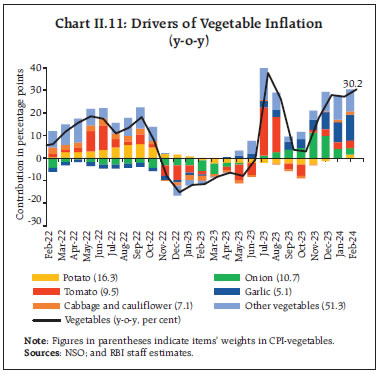
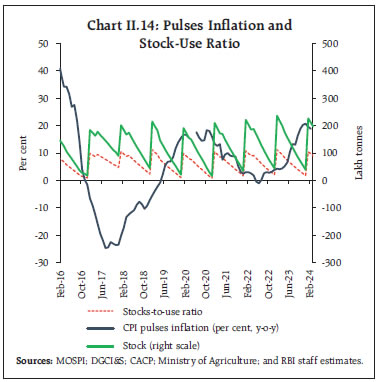
 Inflation in fruits (weight of 2.9 per cent in the CPI and 6.3 per cent within the food and beverages group), recorded a sustained increase since June 2023, peaking at 11.1 per cent in December 2023 before moderating to 4.8 per cent in February 2024. Elevated inflation in fruits, despite higher production (1.7 per cent in 2023-24 as per the FAE over FE of 2022-23), was driven primarily by apple due to lower than usual correction in its prices in November 2023-February 2024. Inflation in groundnut prices also remained in double digits during July-December 2023 on account of lower production. The primary source of plant-based protein i.e., pulses (weight of 2.4 per cent in the CPI and 5.2 per cent in the food and beverages group) recorded a sharp increase in prices. Double digit inflation since June 2023 was primarily driven by lower production of tur [(-) 21.5 per cent in 2022-23 over 2021-22 and an increase of only 0.8 per cent in 2023-24 as per the SAE over 2022-23], urad [(-) 5.2 per cent in 2022-23 over 2021-22 and (-) 14.4 per cent in 2023-24 as per the SAE of 2023-24 over 2022-23] and moong [(-) 17.6 per cent in 2023-24 as per the SAE of 2023-24 over 2022-23] (Chart II.13). The knock-on effect of lower production is also reflected in lower stock-to-use ratio (Chart II.14). Price pressures in pulses eased marginally and inflation moderated to 18.9 per cent in February 2024 following supply-side measures including extension of ‘free’ import policy for urad and tur till March 31, 2025; removal of minimum import price restrictions on yellow peas till March 2024 and sale of subsidised chana dal under the brand 'Bharat Dal'. 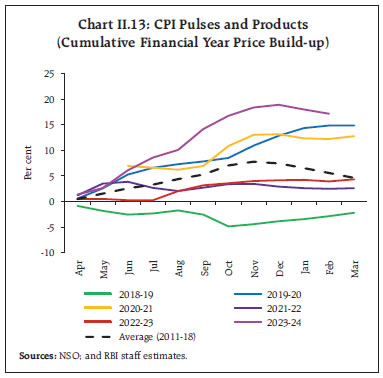
 Prices of animal-based protein items increased marginally during October 2023-February 2024 as increase in prices of milk and products (weight of 6.6 per cent in the CPI and 14.4 per cent within the food and beverages group) and eggs (weight of 4.0 per cent within the group) were partially offset by moderation in meat and fish (weight of 3.6 per cent in CPI and 7.9 per cent within the food and beverages group) prices (Chart II.15). Inflation in prices of milk and products has consistently moderated since its 9-year peak of 9.6 per cent in February 2023 on the back of higher milk production as well as easing feed and fodder costs. Prices of eggs, however, have exhibited high momentum since September 2023 reflecting seasonal demand and higher exports. On the other hand, prices of meat and fish eased more than usual in the second half of 2023-24 due to higher production against lower than anticipated demand. In February 2024, however, inflation in meat and fish picked up sharply due to lower supply of broiler on account of bird flu in Andhra Pradesh as well as adverse base effects. Prices of oils and fats (weight of 3.6 per cent in the CPI and 7.8 per cent within the food and beverages group) remained in deflation throughout 2023-24 (April-February) due to lower international prices and higher domestic production of oilseeds during the 2022-23 season (8.9 per cent in 2022-23 over FE of 2021-22) (Chart II.16). Extension of lower import duty on crude palm, sunflower and soyabean oil till March 2025 is likely to keep inflation low despite an estimated shortfall in oilseeds production [(-) 9.2 per cent in 2023-24 as per the SAE of 2023-24 over FE of 2022-23]. Ghee and butter price inflation moderated, reflecting pass-through of easing milk price inflation and favourable base effect. 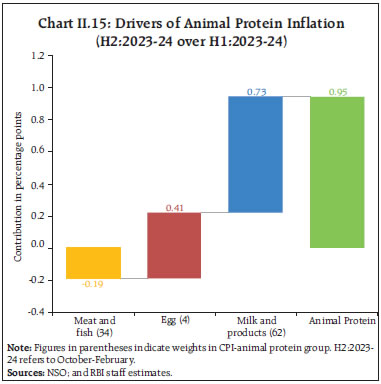 Inflation in prices of sugar and confectionery (weight of 1.4 per cent in the CPI and 3.0 per cent in the food and beverages group) hardened during October-February 2023-24 on lower kharif production [(-) 9.0 per cent as per the SAE of 2023-24 over FE of 2022-23], following higher year-on-year production in 2022-23, and an increase in the fair and remunerative price (FRP) of sugarcane by ₹10 per quintal for 2023-24. Nevertheless, supply measures to ensure domestic availability, including extension of export restrictions, ban on the use of sugarcane juice and syrup for ethanol production and imposition of 50 per cent export duty on molasses used for ethanol production w.e.f. January 2024 are likely to contain inflationary pressures. 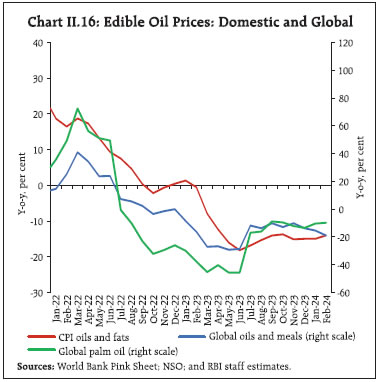 Among other food items, inflation in spices remained in double digits, primarily driven by jeera on account of adverse weather conditions and stagnant production. Spices inflation has, however, gradually moderated since October 2023 as month-on-month (m-o-m) price pressures in jeera eased and turned negative in December 2023 due to higher acreage and production (49 per cent as per FAE of 2023-24 over FE of 2022-23). Prices of prepared meals have moderated gradually, reflecting the pass-through of lower input costs of edible oils and liquified petroleum gas (LPG). Retail Margins Retail price margins – the difference of retail and wholesale prices12 – for cereals increased during September 2023-March 2024. After recording a sustained increase from September 2023 to January 2024, pulses price margins stabilised from February onwards. Retail price margins in edible oils softened in the recent period, primarily due to a moderation in the margin in refined oils. Retail price margins of TOP vegetables had moderated from its peak recorded in July 2023 due to softening of tomato prices during mid-August 2023. The margins, however, hardened again in November 2023 with a pick-up in wholesale prices of onions. Aided by supply-side measures to control the rise in onion prices, the retail price margins of TOP vegetables have started to soften from December 2023 onwards (Chart II.17).
Sectoral and Spatial Distribution of Food Inflation CPI food inflation pressures were seen across both rural and urban areas, with urban food inflation outpacing its rural counterpart (Chart II.18). At the same time, volatility in food inflation13 in urban areas was higher than in rural areas. This was mainly driven by protein, fruits, and vegetables. Spatially, food inflation pressures are softening – the number of states/UT with food inflation higher than 6.0 per cent in the period 2023-24 (April-February) has decreased to 20 vis-à-vis 27 in the corresponding period a year ago (Table II.1). | Table II.1: Distribution of food inflation across States/UTs: Number of states14 | | Food Inflation Range | 2022-23
(Apr-Feb) | 2023-24
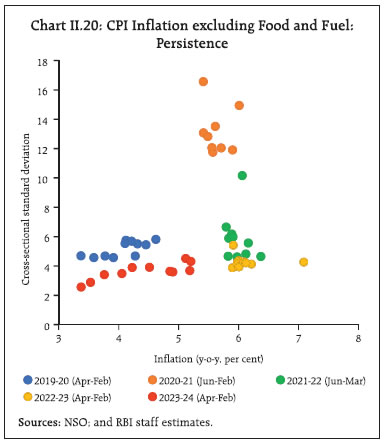
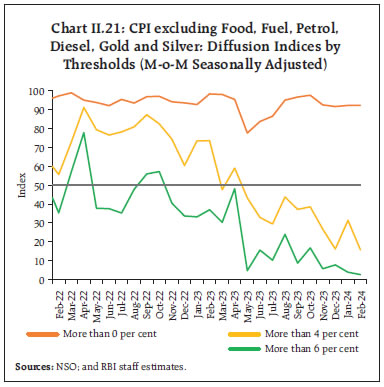
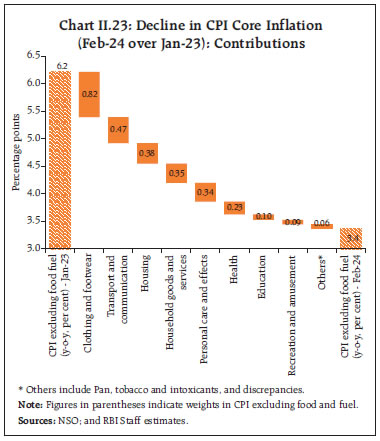
(Apr-Feb) | | Less than 2 per cent | 1 | 1 | | Between 2 to 4 per cent | 1 | 4 | | Between 4 to 6 per cent | 7 | 11 | | Greater than 6 per cent | 27 | 20 | | Sources: NSO; and RBI staff estimates. | CPI Fuel Group CPI fuel slipped into deflation of (-) 0.1 per cent in September 2023 from 4.3 per cent in August, and remained in the deflationary zone till February 2024. Its primary driver has been the substantial reduction in domestic liquified petroleum gas (LPG) prices by ₹200 per cylinder at the end of August, alongside a y-o-y decline in kerosene prices aided by softening international prices, and a slowdown in price increases (y-o-y) in firewood and chips. Electricity price increases, on a y-o-y basis, moderated from a record 13.5 per cent in August 2023 to 10.4 per cent in February 2024 (Chart II.19). Core CPI (CPI excluding Food and Fuel) Disinflation in core (CPI excluding food and fuel) continued during H2 of 2023-24, softening from 4.9 per cent in August 2023 to 3.4 per cent in February 2024 – the lowest rate of core inflation in the current CPI series (2012=100)15. Other exclusion-based measures of underlying inflation, which remove volatile items such as petrol, diesel, gold, and silver in addition to food and fuel, also witnessed sharp and sequential moderation during this period (Table II.2) along with lower cross-sectional variation in inflation rates (Chart II.20). The sharp broad-based softening of core price momentum in H2 is observed in the collapse in CPI threshold diffusion indices (DIs). CPI excluding food, fuel, petrol, diesel, gold and silver DIs for price increases of greater than 6 per cent (saar) and 4 per cent (saar) slipped deeper into the contraction zone during September-December 2023, indicating sequentially lower incidence of price increases beyond the 6 per cent and 4 per cent saar thresholds. The rebound of the 4 per cent threshold DI in January 2024 was transient as it corrected in February to slide further into the contraction zone along with collapse of the 6 per cent threshold DI to low single digits (Chart II.21). Both core goods and services categories experienced significant easing in 2023-24 so far (April-February). Barring personal care and effects, which was impacted by pick-up in gold prices, the contribution of all other sub-groups/groups to core inflation fell (Chart II.22). Out of the 2.8 percentage points moderation in core from its recent peak in January 2023, 82 bps was contributed by clothing and footwear sub-group. In addition, transport and communication accounted for 47 bps; housing contributed 38 bps; household goods and services, and personal care and effects contributed around 35 bps each (Chart II.23). | Table II.2: Exclusion-based Measures of Inflation (y-o-y) | | Period | CPI excluding food and fuel (47.3) | CPI excluding food fuel petrol diesel (45.0) | CPI excluding food fuel petrol diesel gold silver (43.8) | | Jan-23 | 6.2 | 6.5 | 6.3 | | Feb-23 | 6.1 | 6.4 | 6.2 | | Mar-23 | 5.8 | 6.0 | 5.9 | | Apr-23 | 5.1 | 5.8 | 5.6 | | May-23 | 5.2 | 5.8 | 5.4 | | Jun-23 | 5.2 | 5.4 | 5.2 | | Jul-23 | 4.9 | 5.1 | 4.8 | | Aug-23 | 4.9 | 5.1 | 4.8 | | Sep-23 | 4.5 | 4.7 | 4.4 | | Oct-23 | 4.2 | 4.4 | 4.1 | | Nov-23 | 4.1 | 4.2 | 3.9 | | Dec-23 | 3.8 | 3.9 | 3.6 | | Jan-24 | 3.5 | 3.7 | 3.4 | | Feb-24 | 3.4 | 3.5 | 3.3 | Notes: (1) Figures in parentheses indicate weights in CPI.
(2) Derived as residual from headline CPI.
Sources: NSO; and RBI staff estimates. |
 Decomposing CPI excluding food, fuel, petrol, diesel, gold, and silver inflation into its goods (with a weight of 20.7 per cent in the headline CPI) and services (weight of 23.0 per cent) components shows softening in both the categories, mainly led by goods. While core goods inflation moderated by around 190 bps from 5.4 per cent in August 2023 to 3.5 per cent in February 2024, core services inflation fell by around 105 bps from 4.2 per cent to 3.2 per cent during the same period. The key drivers of the softening in goods inflation were clothing and footwear, household goods, health and personal care and effects (excluding gold and silver) (Chart II.24a). In the case of services, housing (primarily house rent), transportation fares (bus/tram/taxi fare, air fare) and communication services drove the moderation in inflation (Chart II.24b). 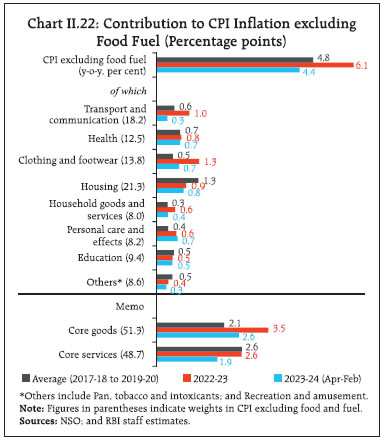
 Trimmed mean measures16 also indicated an easing of underlying inflation pressures, with weighted median inflation registering a decline of around 160 bps from 5.2 per cent in August 2023 to 3.6 per cent in February 2024 (Table II.3). Other Measures of Inflation CPI inflation for agricultural labourers (CPI-AL) and rural labourers (CPI-RL) exceeded CPI headline inflation during September 2023-February 2024 due to higher food and fuel inflation. Inflation in terms of CPI for industrial workers (CPI-IW), on the other hand, was below the headline CPI during September 2023 - January 2024, primarily on account of fuel inflation being significantly lower in CPI-IW vis-à-vis headline CPI. After staying in deflationary territory between April and October 2023, wholesale price index (WPI) inflation turned positive in November 2023 on the back of a pick-up in food prices along with unfavourable base effects. On account of an uptick in CPI inflation and WPI inflation turning positive, inflation measured by deflators for gross value added (GVA) and gross domestic product (GDP) further hardened in Q3:2023-24 (Chart II.25a). 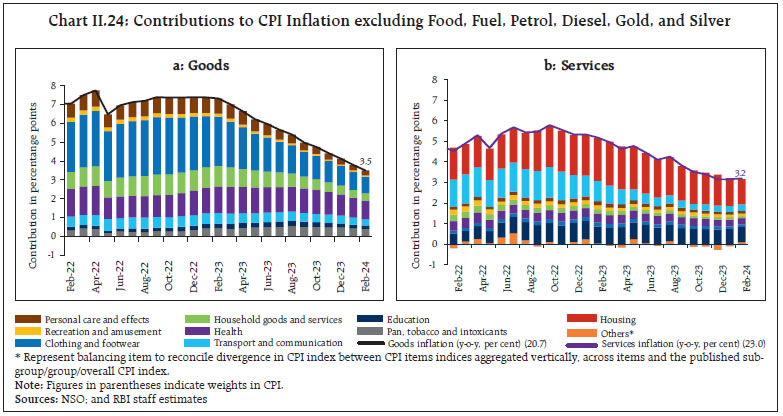
| Table II.3: Trimmed Mean Measures of Inflation (y-o-y) | | Month | 5% trimmed | 10% trimmed | 25% trimmed | Weighted Median | | Jan-23 | 6.6 | 6.6 | 6.6 | 6.8 | | Feb-23 | 6.6 | 6.5 | 6.5 | 6.6 | | Mar-23 | 6.0 | 6.3 | 6.3 | 6.4 | | Apr-23 | 5.1 | 5.6 | 5.9 | 5.7 | | May-23 | 5.1 | 5.6 | 5.7 | 5.5 | | Jun-23 | 5.5 | 5.7 | 5.7 | 5.8 | | Jul-23 | 6.1 | 6.0 | 5.6 | 5.5 | | Aug-23 | 5.7 | 5.6 | 5.3 | 5.2 | | Sep-23 | 4.7 | 5.0 | 4.9 | 4.7 | | Oct-23 | 4.5 | 4.9 | 4.7 | 4.4 | | Nov-23 | 4.6 | 4.8 | 4.5 | 4.1 | | Dec-23 | 4.8 | 4.7 | 4.2 | 4.1 | | Jan-24 | 4.7 | 4.5 | 3.9 | 3.7 | | Feb-24 | 4.6 | 4.4 | 3.7 | 3.6 | | Sources: NSO; and RBI staff estimates. | On the whole, WPI inflation remained far below headline CPI inflation during September 2023-February 2024, driven down by deflation in non-food manufactured products in WPI. In terms of similar categories, WPI inflation in food (particularly cereals, vegetables, fruits and egg), and clothing and footwear ruled below corresponding CPI groups/subgroups. Deflation in edible oil and fuel prices was deeper in the WPI. On the other hand, inflation in spices, sugar, milk, and petrol was higher in the WPI than in the CPI (Chart II.25b). II.3 Costs Costs, as measured by WPI inflation in industrial raw materials and farm inputs, had entered negative territory in April-May 2023 and remained muted during September 2023-February 2024 on account of sustained easing of international commodity prices (Chart II.26). Prices of industrial inputs such as high-speed diesel (HSD), aviation turbine fuel (ATF), bitumen and petroleum coke were also in deflation during November 2023-February 2024. The other contributory factors were non-food articles, particularly cotton and oilseeds, the prices of which continued to decline due to easing in international prices and lower demand. Minerals price inflation, however, remained positive during this period, driven by metallic minerals, particularly iron ore due to increased global demand, and copper due to both rising demand and limited supply owing to constraints on new mining projects worldwide, increased taxes and environmental regulations. Farm input prices deflated during September 2023-February 2024 due to decline in prices of HSD, fodder, pesticides, and fertilisers. The price of WPI electricity – a key input in both industrial and farm inputs – remained in deflation for most part of H2:2023-24 due to low rise in prices of coal coupled with favourable base effects. 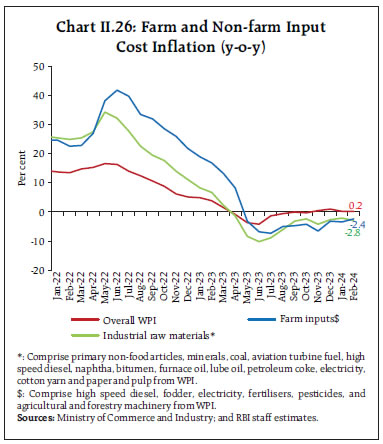 Nominal rural wages increased by 5.9 per cent in January 2024, driven by wage growth in the non-agricultural rural sector (Chart II.27). While an increase in agricultural wages was recorded primarily in irrigation, harvesting and animal husbandry, the increase in non-agricultural wages was broad-based across major activities in the rural sector. In the organised sector, staff cost growth (y-o-y) remained steady for manufacturing firms among listed companies in Q3:2023-24, while it decelerated for services firms. The share of staff cost in the value of production for manufacturing was broadly stable, whereas it fell steeply in Q3 for the services sector (Chart II.28).
As per the firms polled in the Reserve Bank’s enterprise surveys17, the pace of salary outgo, cost of inputs and selling prices is expected to rise steeply for services sector in Q1:2024-25. On the other hand, pace of growth in selling prices is likely to soften for manufacturing and infrastructure sectors even though inputs costs for infrastructure sector and salary outgo for manufacturing sector would rise at a faster rate in Q1 (Chart II.29).
After witnessing a dip in January 2024, one year ahead business inflation expectations18 increased by 9 basis points to 4.46 per cent in February on account of mild increase in cost pressures and sales expectations. As per the purchasing managers’ index (PMI), barring a transient dip in February, the input prices momentum of manufacturing firms rose during December 2023-March 2024 due to increase in prices of cotton, iron, machinery tools, plastics, chemical, paper and textiles. The growth in output prices, however, remained stable with a marginal decline in February-March leading to input-output price gap turning positive in March. For services sector, the pace of increase in input prices remained volatile with a sharp pick-up in March 2024 due to food, labour costs, cosmetics and medical equipment. The prices charged by service firms rose more than input prices in March 2024 which led to a further narrowing of the input-output price gap (Chart II.30). II.4 Conclusion Inflation has seen substantial moderation from elevated levels in the summer of 2022 but is still above the target. With core disinflation being broad based across goods and services, risks to the 'last mile' of disinflation process may emanate from incidence of unpredictable supply side shocks, which include adverse climate events and their impact on agricultural production; and geo-political tensions and its spillovers to trade and commodity markets. The combination of monetary policy action and stance, and proactive supply side measures have helped steer the disinflation process in the face of considerable uncertainties. This approach would need to be sustained to ensure a durable return of inflation to the target, thereby setting strong foundations for the high growth trajectory that is underway. _________________________________________________________________________________
III. Demand and Output Domestic economic activity remained resilient in H2:2023-24 with investment demand firming up at a robust pace. Manufacturing activity strengthened further, and construction activity stayed firm. Consumer and business optimism remains buoyant. Headwinds from geopolitical tensions, rising geoeconomic fragmentation, volatility in global commodity prices, and escalation of Red Sea disruptions, however, pose risks to the outlook. After a strong performance in H1:2023-24, the momentum of domestic economic activity remained resilient in H2, driven by strong aggregate demand. Fixed investment firmed up at a robust pace with the government’s continued thrust on infrastructure building. Private corporate investment is gaining vitality. Private consumption held up well in urban areas, although its overall growth moderated. India’s exports recouped some ground which, in conjunction with deceleration in imports growth, led to a lower drag from net external demand on aggregate demand in H2. Overall, real gross domestic product (GDP) expanded strongly by 7.6 per cent year-on-year (y-o-y) in 2023-24, with 8.4 per cent growth in Q3 – the third successive quarter of over eight per cent growth. On the supply side, manufacturing activity continued to gain traction in H2, supported by lower commodity prices, diversifying global supply chains and easing logistic costs due to improving infrastructure. Buoyancy in construction activity contributed to services sector momentum. Real gross value added (GVA) posted a growth of 6.9 per cent y-o-y in 2023-24. Headwinds from geopolitical tensions, rising geoeconomic fragmentations, volatility in global commodity prices, and escalation of Red Sea disruptions, however, pose risks to the outlook. III.1 Aggregate Demand Aggregate demand conditions exhibited buoyancy in Q3:2023-24 (Chart III.1 and Table III.1). Its momentum – quarter-on-quarter (q-o-q) seasonally adjusted annualised rate (saar) – remained strong in Q3. 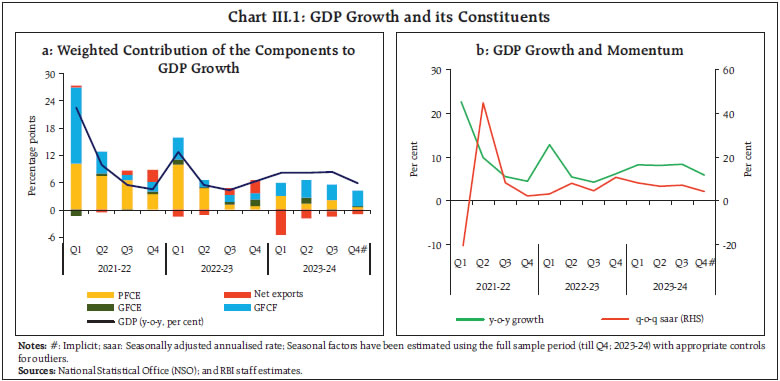
| Table III.1: Real GDP Growth | | (y-o-y, per cent) | | Item | 2022-23 | 2023-24 | Weighted Contribution* | 2022-23 | 2023-24 | | (FRE) | (SAE) | 2022-23 | 2023-24 | Q1 | Q2 | Q3 | Q4 | Q1 | Q2 | Q3 | Q4# | | Private final consumption expenditure | 6.8 | 3.0 | 3.9 | 1.8 | 18.5 | 8.2 | 1.8 | 1.5 | 5.3 | 2.4 | 3.5 | 1.0 | | Government final consumption expenditure | 9.0 | 3.0 | 0.9 | 0.3 | 9.8 | 3.4 | 7.1 | 13.9 | -0.1 | 13.8 | -3.2 | 2.7 | | Gross fixed capital formation | 6.6 | 10.2 | 2.2 | 3.4 | 13.9 | 4.7 | 5.0 | 3.8 | 8.5 | 11.6 | 10.6 | 10.2 | | Exports | 13.4 | 1.5 | 3.0 | 0.4 | 19.1 | 11.7 | 10.9 | 12.4 | -6.5 | 5.3 | 3.4 | 3.5 | | Imports | 10.6 | 10.9 | 2.5 | 2.7 | 26.1 | 16.1 | 4.1 | -0.4 | 15.3 | 11.9 | 8.3 | 8.2 | | GDP at market prices | 7.0 | 7.6 | 7.0 | 7.6 | 12.8 | 5.5 | 4.3 | 6.2 | 8.2 | 8.1 | 8.4 | 5.9 | Notes: *: Component-wise contributions to growth do not add up to GDP growth because change in stocks, valuables and discrepancies are not included.
FRE: First revised estimates; SAE: Second advance estimates. #: Implicit.
Sources: NSO; and RBI staff estimates. | GDP Projections versus Actual Outcomes The October 2023 Monetary Policy Report projected real GDP growth at 6.5 per cent for Q2:2023-24, 6.0 per cent for Q3 and 5.7 per cent for Q4. The actual growth for Q2 turned out to be higher at 8.1 per cent led by sharper than expected expansion in gross fixed capital formation (GFCF) (Chart III.2). In Q3 also, the actual growth at 8.4 per cent overshot the projection due to more than expected increase in GFCF and moderation in drag from net exports. Data for Q4:2023-24 are scheduled to be released by the National Statistical Office (NSO) on May 31, 2024. III.1.1 Private Final Consumption Expenditure Growth in private final consumption expenditure (PFCE) – the mainstay of aggregate demand – improved to 3.5 per cent in Q3 after a dip in Q2 and contributed 2.2 percentage points to overall GDP growth. Steady urban consumption, coupled with improving income levels in the informal sector, are supporting private consumption. For the full year 2023-24, PFCE growth moderated to 3.0 per cent from 6.8 per cent in 2022-23, partly reflecting sensitivity to financial conditions (Box III.1). High frequency indicators of urban demand exhibited sustained expansion in H2:2023-24 (Chart III.3). Domestic air passenger traffic, passenger vehicle sales and household credit posted robust growth. Consumer durables expanded at a modest pace in Q3, but recorded double digit growth in January. Sustained buoyancy in the services sector along with corporate salary hikes are supporting urban demand. Rural demand is gaining pace gradually as exhibited by high frequency indicators, although it lags urban demand. Motorcycle sales expanded at a rapid pace in H2:2023-24, while sales of tractors and fertilisers remained subdued after high growth last year. Consumer non-durables registered moderate growth in Q3 and contracted marginally in January (Chart III.4). The demand for work under the Mahatma Gandhi National Rural Employment Guarantee Act (MGNREGA) declined in H2, suggesting improvement in non-farm employment in rural areas and recovery in informal sector activity. Agricultural credit growth remained robust, notwithstanding lower estimates of rabi production. 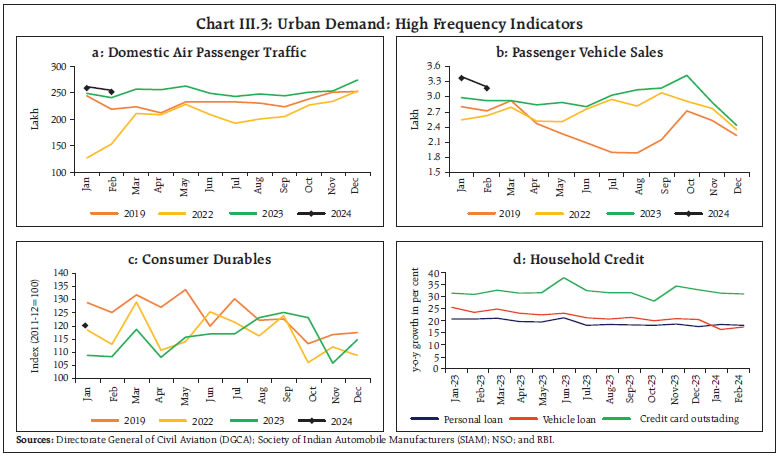
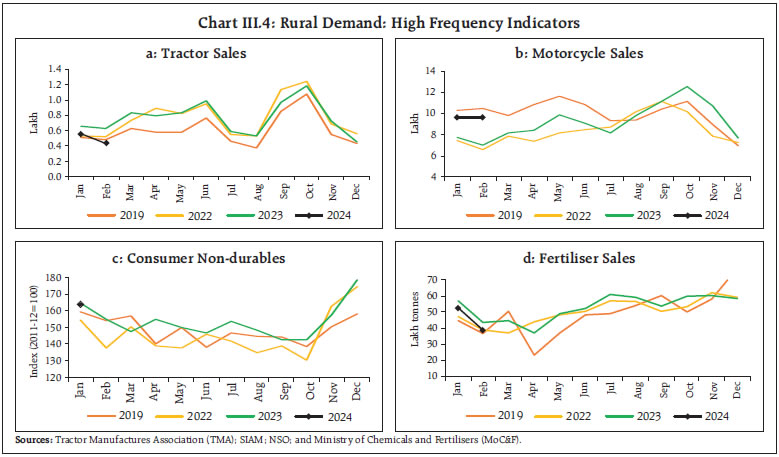 The labour force participation rate (LFPR) and employment rate (ER) reflect improvement in labour market conditions. As per the Periodic Labour Force Survey (PLFS), LFPR at all India level for persons aged 15 years and above (usual status) improved to 59.8 per cent (56.1 per cent last year) and the unemployment rate dropped to 3.1 per cent (3.6 per cent last year) during 2023 (January-December). The latest quarterly PLFS indicate that LFPR for person aged 15 years and above (current weekly status) increased to 49.9 per cent in Q3:2023-24 in urban areas, the highest since the survey’s inception. The unemployment rate in urban areas during Q3 dropped to 6.5 per cent, the lowest in the PLFS series (Chart III.5a). The Employees’ Provident Fund Organisation (EPFO) payrolls data also point to strengthening of formal employment in Q3 as net payroll additions rose by 12.5 per cent y-o-y in Q3 and by 35.4 per cent y-o-y in January 2024 (Chart III.5b). Box III.1: Interest Rate Sensitivity of Consumption and Investment Analysing the impact of policy rate changes on aggregate demand (consumption and investment) is important for monetary policy transmission (Mallick and Agarwal, 2007; Pattanaik et al., 2014). This involves isolating changes in the policy rate due to monetary policy surprises or shocks. Policy rate shocks are derived as residuals in a regression of actual policy rate on actual and expected1 inflation and GDP growth2 (Holm et al., 2021). Subsequently, the impact of policy rate shocks3 on private consumption and fixed investment is examined, by including potential asymmetric effects4 in a Vector Auto Regression (VAR) model for Q4:2007-08 to Q2:2023-24. Real gross domestic product (GDP) is used as a control variable for domestic demand shocks. The impulse response of private consumption and fixed investment to a one standard deviation change in policy rate shocks5 suggests that private consumption exhibits a swift adverse response, reaching its peak approximately after two quarters following a policy rate shock, while the maximum response of fixed investment is seen around the fifth quarter (Chart III.1.1). The full impact of policy rate shocks on fixed investment takes relatively more time to materialise compared to private consumption. Furthermore, the asymmetric impact suggests a stronger and statistically significant impact on both private consumption and fixed investment during tightening cycles, whereas the impact on both appears insignificant during easing cycles. References: Holm, M. B., Paul, P., & Tischbirek, A. (2021). The Transmission of Monetary Policy Under the Microscope. Journal of Political Economy, 129(10), 2861-2904. Pattanaik, S., Behera, H., Kavediya, R., Das, A., Shrivastava, A. K., & Joshi, H. (2014). Sensitivity of Investment and Growth to Changes in Real Interest Rates in India. Prajnan, 43(1). Mallick, H., & Agarwal, S. (2007). Impact of Real Interest Rates on Real Output Growth in India: A Long-run Analysis in a Liberalized Financial Regime. The Singapore Economic Review, 52(02), 215-231. | On the other hand, according to the Naukri Jobspeak data, there was moderation in new vacancies during October-January 2023-24 due to easing of hiring in some specific sectors like IT hardware and software services, telecom, retailing and BPO. III.1.2 Gross Fixed Capital Formation Gross fixed capital formation (GFCF) grew by 10.6 per cent y-o-y in Q3:2023-24, driven by a revival in private capex and the continued thrust on capital expenditure by the government. The share of GFCF in GDP, however, moderated to 32.4 per cent in Q3, after achieving a new peak during H1. Healthy balance sheets of banks and corporates, rising capacity utilisation, improving business sentiment and large public investment bode well for a sustained upturn in the private sector investment cycle. Amongst the various high-frequency indicators of investment in machinery and equipment, import of capital goods grew at a healthy pace in Q3 and January-February on the back of strong imports of electronic goods, machine tools and professional instruments (Chart III.6a). The output of power generating equipment, water purification apparatus and commercial vehicles drove a pick up in capital goods production during October-January (Chart III.6b). Coincident indicators of construction activity maintained strength in Q3 and Q4 (up to February). Steel consumption registered robust growth and cement production also grew at a healthy pace (Chart III.6c and 6d). The strong demand for residential housing and elevated public infrastructure spending also propelled construction activity. Capacity utilisation (CU) in the manufacturing sector rose to 74.7 per cent in Q3:2023-24 from 74.0 per cent recorded in the previous quarter. The seasonally adjusted CU increased marginally by 10 bps to 74.6 per cent in Q3: 2023-24. The CU continued to remain above the long-term average6 (Chart III.7). Debt servicing capacity of listed private manufacturing companies remained stable at comfortable level in Q3:2023-24, as reflected in their interest coverage ratio (ICR).7 This augurs well for additional corporate investments. The ICR of non-IT services sector remained above the threshold level of unity (Chart III.8). The investment rate8 at 32.2 per cent in 2022-23 was maintained almost at the level of the previous year (32.4 per cent), supported by the government’s infrastructure push. On the other hand, the domestic saving rate dipped to 30.2 per cent of GDP in 2022-23 from 31.2 per cent in 2021-22 (Chart III.9).
Net household financial savings declined to 5.3 per cent of GDP in 2022-23 from 7.3 per cent in the preceding year partly due to a sharp uptick in liabilities for financing fixed assets/investment. III.1.3 Government Consumption Government final consumption expenditure (GFCE) decelerated in H2:2023-24, with the ongoing fiscal consolidation and expenditure rationalisation. The central government’s revenue expenditure excluding interest payments and subsidies declined by 7.5 per cent y-o-y, while capital outlay grew by 65.1 per cent y-o-y during Q3 (Chart III.10). In 2023-24 revised estimates (RE), the growth in the centre’s revenue expenditure excluding interest payments and subsidies remained subdued at 3.9 per cent y-o-y, despite lower outgo on subsidies. Capital expenditure, on the other hand, recorded a strong expansion of 28.4 per cent y-o-y. For 2024-25, the interim union budget projects the gross fiscal deficit (GFD) at 5.1 per cent of GDP, marking a drop of 70 basis points from 2023-24 (RE). This is in line with the medium term GFD target of 4.5 per cent by 2025-26 (Table III.2). Revenue expenditure increased by 3.2 per cent y-o-y in 2024-25 budget estimate (BE), but moderated to 11.2 per cent of GDP from 12.0 per cent in 2023-24 (RE). Revenue expenditure excluding interest payments and major subsidies is budgeted at 6.4 per cent of GDP in 2024-25, lower than 7.0 per cent in 2023-24 (RE). The budgeted capital expenditure rose by 16.9 per cent y-o-y to 3.4 per cent of GDP in 2024-25 from 3.2 per cent in 2023-24 (RE). The interim union budget has projected a strong growth of 11.5 per cent y-o-y in gross tax revenues for 2024-25, with continued higher support from direct taxes. 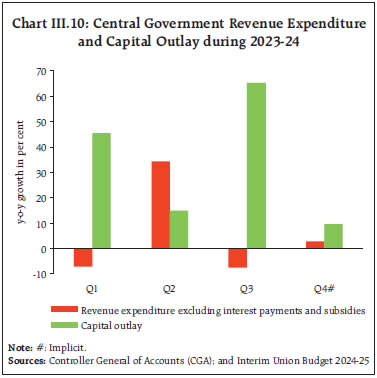 The central government’s gross tax revenue recorded a robust growth of 13.4 per cent during April-February 2023-24, boosted by buoyant direct tax collections. Direct taxes increased by 21.6 per cent, with income tax and corporation tax expanding by 25.8 per cent and 17.3 per cent, respectively. Indirect tax collections remained subdued as union excise duties contracted by 5.8 per cent y-o-y and custom duties rose by 3.9 per cent. Monthly GST collections (centre plus states) averaged ₹1.68 lakh crore during 2023-24, registering a growth of 11.6 per cent y-o-y (Chart III.11). | Table III.2: Central Government Finances | | Indicator | (Per cent to GDP) | | 2021-22 | 2022-23 | 2023-24(RE) | 2024-25(BE) | | 1. Revenue receipts | 9.2 | 8.8 | 9.2 | 9.2 | | a. Tax revenue (Net) | 7.6 | 7.8 | 7.9 | 7.9 | | b. Non-tax revenue | 1.5 | 1.1 | 1.3 | 1.2 | | 2. Non-debt capital receipts | 0.2 | 0.3 | 0.2 | 0.2 | | 3. Revenue expenditure | 13.6 | 12.8 | 12.0 | 11.2 | | a. Interest payments | 3.4 | 3.4 | 3.6 | 3.6 | | b. Major subsidies | 1.9 | 2.0 | 1.4 | 1.2 | | 4. Revenue expenditure excluding interest payments and subsidies | 8.3 | 7.4 | 7.0 | 6.4 | | 5. Capital expenditure | 2.5 | 2.7 | 3.2 | 3.4 | | 6. Capital outlay | 2.3 | 2.3 | 2.7 | 2.9 | | 7. Total expenditure | 16.1 | 15.6 | 15.3 | 14.5 | | 8. Gross fiscal deficit | 6.7 | 6.4 | 5.9 | 5.1 | | 9. Revenue deficit | 4.4 | 4.0 | 2.9 | 2.0 | | 10. Primary deficit | 3.3 | 3.0 | 2.3 | 1.5 | Notes: RE: Revised Estimates; BE: Budget Estimates.
Figures may vary from those published in the Union Budget due to revision in GDP.
Source: Union Budget Documents. | During April-February 2023-24, the central government’s revenue expenditure excluding interest payments and major subsidies increased by 3.3 per cent y-o-y, while capital expenditure posted a solid growth of 36.5 per cent, reflecting continued emphasis on infrastructure building. State governments also continued with fiscal prudence, while supporting growth with a focus on capital expenditure, which was budgeted to expand by 40.3 per cent y-o-y in 2023-24 (BE). States’ GFD was budgeted at 3.1 per cent of GDP in 2023-24 as against the limit of 3.5 per cent set by the centre (Table III.3). | Table III.3: State Government Finances - Key Deficit Indicators | | | (Per cent to GDP) | | 2021-22 | 2022-23 | 2023-24 | | (A) | (PA) | (BE) | | Revenue deficit | 0.4 | 0.3 | 0.1 | | Gross fiscal deficit | 2.8 | 2.8 | 3.1 | | Primary deficit | 1.0 | 1.2 | 1.4 | Notes: Data pertain to 31 States/UTs.
A: Actuals; PA: Provisional Accounts; BE: Budget Estimates.
Sources: Budget Documents of States/UTs; and Comptroller and Auditor General (CAG) of India. | During 2023-24 (April-January), states’ GFD reached 67.5 per cent of their budget estimates, higher than a year ago, as growth in revenue receipts slowed down to 7.4 per cent y-o-y (18.4 per cent last year). States’ own tax revenues increased at a moderate pace during April-January 2023-24, partly due to contraction in revenues from sales tax/ value-added tax (VAT). On the expenditure front, revenue expenditure increased at a decelerated pace during April-January 2023-24, while capital spending rose by 31.2 per cent y-o-y during this period (Chart III.12a and b). States’ revenue and capital expenditure stood at 69.7 per cent and 58.4 per cent of budget estimates, respectively, during April-January 2023-24. 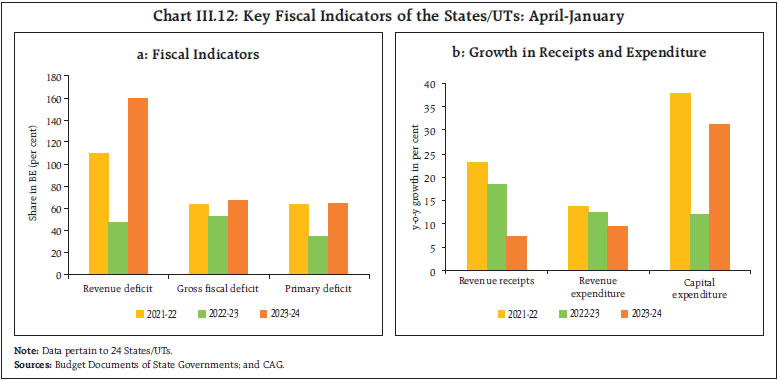 States capex was aided by the Scheme for Special Assistance to States for Capital Investment. Under this scheme, ₹95,225.77 crore has already been disbursed to the states by February 2024. This scheme has been extended for 2024-25 in the interim union budget, with 23.2 per cent higher allocations over 2023-24 (RE). The quality of states expenditure continued to improve, owing to sustained growth-inducing capex (Chart III. 13a and 13b). In 2023-24, the centre’s gross market borrowings of ₹15.43 lakh crore were completed, the same as envisaged in the budget estimates. As part of active debt consolidation, the Reserve Bank also conducted eleven switch auctions on behalf of the central government amounting to ₹1.03 lakh crore, substituting shorter maturity securities with longer maturity securities. The weighted average yield of issuances during 2023-24 dropped marginally to 7.2 per cent from 7.3 per cent in 2022-23, while the weighted average maturity elongated to 18.1 years from 16.1 years during this period further reducing the rollover risk. States raised gross market borrowings of ₹10.07 lakh crore in 2023-24 as against the total sanctioned amount of ₹11.29 lakh crore for the current financial year (Table III.4). The Ways and Means Advances (WMA) limit fixed for the central government at ₹1.5 lakh crore and ₹50,000 crore for H1 and H2 of 2023-24, respectively, for meeting temporary mismatches between receipts and payments, remained unchanged from last year’s level. For states/union territories also, the WMA limits were kept unchanged at ₹47,010 crore in 2023-24 as recommended by the Advisory Committee on Ways and Means Advances to State Governments (Chairman: Shri Sudhir Shrivastava). 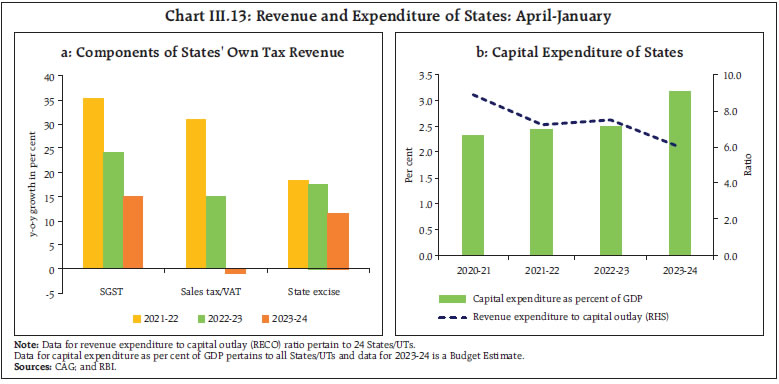 In the interim union budget 2024-25, gross and net market borrowings are budgeted at ₹14.13 lakh crore and ₹11.75 lakh crore, respectively. Net market borrowings are marginally lower than ₹11.81 lakh crore in 2023-24, indicating reduced pressure in the G-sec market and higher space for private sector funding. Issuance calendar for H1:2024-25 has planned to raise government dated securities amounting to ₹7.5 lakh crore (53.1 per cent of the total amount budgeted for the full year). III.1.4 External Demand India’s external demand exhibited signs of recovery in H2:2023-24 (October-February) despite protracted geopolitical tensions. Merchandise exports (US$ terms) expanded by 3.7 per cent during H2 (October-February), while merchandise imports inched up by 2.5 per cent during this period. The merchandise trade deficit at US$ 105.7 billion widened marginally during H2 (October-February) from US$ 105.1 billion during the corresponding period of last year (Chart III.14). | Table III.4: Government Market Borrowings | | (₹ crore) | | | 2021-22 | 2022-23 | 2023-24 | | Centre | States | Total | Centre | States | Total | Centre | States | Total | | Net borrowings | 8,63,103 | 4,92,483 | 13,55,586 | 11,08,261 | 5,18,830 | 16,27,091 | 11,80,975 | 7,17,140 | 18,98,115 | | Gross borrowings | 11,27,382 | 7,01,626 | 18,29,008 | 14,21,000 | 7,58,392 | 21,79,392 | 15,43,000 | 10,07,058 | 25,50,058 | | Sources: Government of India (GoI); and RBI staff estimates. |
The recovery in merchandise exports during H2:2023-24 (October-February) was led by engineering goods, electronic goods, drugs and pharmaceuticals, iron ore and cotton yarn (Chart III.15). On the other hand, petroleum products, rice, other cereals, readymade garments, and marine products dragged down exports. Petroleum products contributed a lower share of 19.9 per cent to total merchandise exports during H2 (October-February) than 21.6 per cent in the same period last year. Growth of merchandise imports picked up in H2:2023-24 (October-February) due to higher imports of gold, electronic goods, and silver (Chart III.16). Oil imports declined by 7.5 per cent due to softening prices, while gold imports jumped substantially by 90.0 per cent during this period, reflecting strong retail demand. The growth in non-oil non-gold imports remained moderate at 1.7 per cent during H2 (October-February), led by expansion in imports of electronic goods, silver, machinery (electrical and non-electrical), and pulses. Services trade witnessed some slowdown in H2:2023-24 (October-February) on a y-o-y basis, reflecting sluggish global demand. Services exports expanded by 5.2 per cent in Q3:2023-24 as compared with 24.5 per cent in the same period last year. Services export growth was mainly driven by software, business, and travel services. On the other hand, services imports contracted by 4.3 per cent in Q3, registering a decline for the second consecutive quarter on a y-o-y basis, primarily on account of decline in transportation and business services (Chart III.17).
On a balance of payments basis, the current account deficit (CAD) narrowed marginally to 1.2 per cent of GDP in Q3:2023-24 from 1.3 per cent in Q2 with an improvement in net services trade and an increase in net transfer receipts. In the financial account, capital flows increased sharply in H2:2023-24 on account of robust foreign direct investment (FDI) and foreign portfolio investment (FPI) flows. Net FDI flows jumped to US$ 9.9 billion in H2 (October-January) from US$ 5.4 billion a year ago (inflows of US$ 4.2 billion in Q3:2023-24). The top five source countries for FDI in 2023-24 (April-January) include Singapore, Mauritius, USA, Netherlands and Japan, which together accounted for a share of 72.8 per cent. On the sectoral front, manufacturing, computer services, power generation, distribution and transmission, financial services, transport, and retail and wholesale trade constituted 73.6 per cent share of FDI equity inflow. Foreign portfolio investment (FPI) extended the positive momentum in H2:2023-24, supported by net inflows in both equity and debt segments (Chart III.18). Net FPI equity flows increased to US$ 8.0 billion during H2:2023-24 from US$ 3.1 billion in the same period of the preceding year. Net debt inflows by FPIs amounted to US$ 13.3 billion in H2 as compared to net outflows of US$ 0.4 billion a year ago, aided by a substantial jump in flows after the September 2023 announcement of the inclusion of Indian government bonds in J. P. Morgan’s benchmark emerging market index from June 2024. Furthermore, the bandwagon effect of inclusion in other bond indices also supported debt inflows – Bloomberg Emerging Markets Index recently announced inclusion of Indian Government bonds from January 31, 2025. 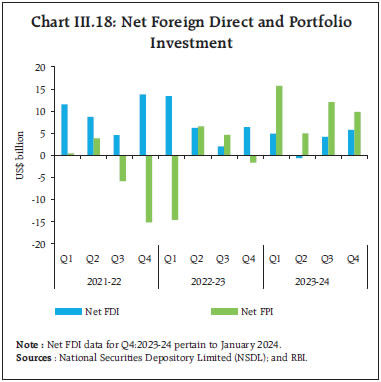 External commercial borrowings (ECBs) to India recorded net outflows of US$ 0.1 billion in H2:2023-24 (up to February). Net accretions to non-resident deposits, on the other hand, rose to US$ 4.7 billion in H2 (up to January) from US$ 3.1 billion in the corresponding period of the previous year. As on March 29, 2024, India’s foreign exchange reserves stood at US$ 645.6 billion, equivalent to 11.3 months of projected merchandise imports in 2023-24 and 99.6 per cent of outstanding external debt at end-December 2023. III.2 Aggregate Supply Aggregate supply – measured by real gross value added (GVA) at basic prices – expanded by 6.5 per cent in Q3:2023-24 (4.8 per cent a year ago), led by manufacturing and construction activity (Table III.5). For the financial year 2023-24 as a whole, real GVA is estimated in the second advance estimates (SAE) to grow at 6.9 per cent compared with 6.7 per cent last year. The momentum of overall GVA, measured by q-o-q saar, recorded robust growth in Q3 (Chart III.19). | Table III.5: Real GVA Growth | | (y-o-y, per cent) | | Sector | 2022-23 | 2023-24 | Weighted Contribution | 2022-23 | 2023-24 | | (FRE) | (SAE) | 2022-23 | 2023-24 | Q1 | Q2 | Q3 | Q4 | Q1 | Q2 | Q3 | Q4# | | Agriculture, forestry and fishing | 4.7 | 0.7 | 0.7 | 0.1 | 2.7 | 2.3 | 5.2 | 7.6 | 3.5 | 1.6 | -0.8 | -0.6 | | Industry | -0.6 | 8.3 | -0.1 | 1.8 | 4.0 | -5.5 | -2.8 | 1.7 | 5.0 | 13.6 | 10.9 | 4.7 | | Mining and quarrying | 1.9 | 8.1 | 0.0 | 0.2 | 6.6 | -4.1 | 1.4 | 2.9 | 7.1 | 11.1 | 7.5 | 7.4 | | Manufacturing | -2.2 | 8.5 | -0.4 | 1.4 | 2.2 | -7.2 | -4.8 | 0.9 | 5.0 | 14.4 | 11.6 | 3.9 | | Electricity, gas, water supply and other utilities | 9.4 | 7.5 | 0.2 | 0.2 | 15.6 | 6.4 | 8.7 | 7.3 | 3.2 | 10.5 | 9.0 | 7.6 | | Services | 9.9 | 7.9 | 6.1 | 5.0 | 16.4 | 9.4 | 7.5 | 7.3 | 10.4 | 6.9 | 7.4 | 7.2 | | Construction | 9.4 | 10.7 | 0.8 | 0.9 | 14.7 | 6.9 | 9.5 | 7.4 | 8.5 | 13.5 | 9.5 | 11.3 | | Trade, hotels, transport, communication | 12.0 | 6.5 | 2.1 | 1.2 | 22.1 | 13.2 | 9.2 | 7.0 | 9.7 | 4.5 | 6.7 | 5.5 | | Financial, real estate and professional services | 9.1 | 8.2 | 2.0 | 1.9 | 10.5 | 8.7 | 7.7 | 9.2 | 12.6 | 6.2 | 7.0 | 6.8 | | Public administration, defence and other services | 8.9 | 7.7 | 1.1 | 1.0 | 23.6 | 7.3 | 3.5 | 4.7 | 8.2 | 7.7 | 7.5 | 7.6 | | GVA at basic prices | 6.7 | 6.9 | 6.7 | 6.9 | 11.3 | 5.0 | 4.8 | 6.0 | 8.2 | 7.7 | 6.5 | 5.4 | Notes: FRE: First revised estimates; SAE: Second advance estimates. #: Implicit.
Sources: NSO; and RBI staff estimates. |
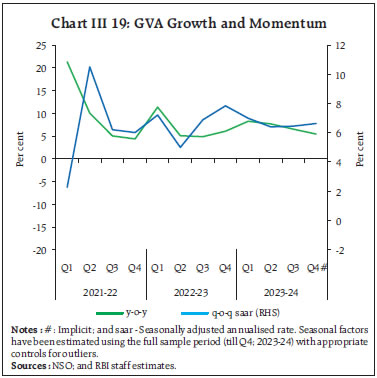 III.2.1 Agriculture Real GVA in agriculture, forestry and fishing contracted by 0.8 per cent in Q3:2023-24 (5.2 per cent growth a year ago) on account of a decline in foodgrains production during kharif season. Deficient and unevenly distributed rainfall (both spatially and temporally) along with depleting reservoir levels led to decrease in foodgrains production. As of March 28, 2024, reservoir levels were at 36 per cent of the full capacity, below the last year’s level of 43 per cent and the decadal average of 37 per cent. Foodgrains production for 2023-24 is estimated at 3093.5 lakh tonnes, 1.3 per cent lower than the final estimates of last year (Table III.6). Among major crops, the output of rice declined while that of wheat rose. Pulses production dropped with a sharp decline recorded during the kharif season. Among commercial crops, the output of oilseeds, cotton and sugarcane registered a sharp decline vis-à-vis last year. As per the FAE, the production of horticultural crops during 2023-24 was placed at 355.3 million tonnes, marginally lower than the final estimates of 2022-23 and 1.2 per cent higher than the FAE of 2022-23. | Table III.6: Agricultural Production in 2023-24 | | (Lakh tonnes) | | Crop | 2022-23 | 2023-24 | Variation in 2023-24 (Per cent) | | SAE* | Final** | Target | SAE | Over Final 2022-23 | Over Target | | Foodgrains | 3235.5 | 3135.5 | 3193.5 | 3093.5 | -1.3 | -3.1 | | Kharif | 1534.3 | 1557.1 | 1581.3 | 1541.9 | -1.0 | -2.5 | | Rabi | 1701.2 | 1578.4 | 1612.2 | 1551.6 | -1.7 | -3.8 | | Rice | 1308.4 | 1255.2 | 1255.2 | 1238.2 | -1.4 | -1.4 | | Wheat | 1121.8 | 1105.5 | 1140.0 | 1120.2 | 1.3 | -1.7 | | Pulses | 278.1 | 239.8 | 272.6 | 234.4 | -2.2 | -14.0 | | Oilseeds | 400.0 | 403.0 | 428.6 | 366.0 | -9.2 | -14.6 | | Sugarcane | 4687.9 | 4905.3 | 4700.0 | 4464.3 | -9.0 | -5.0 | | Cotton # | 337.2 | 336.6 | 350.0 | 323.1 | -4.0 | -7.7 | | Jute & Mesta ## | 100.5 | 93.9 | 105.0 | 96.3 | 2.6 | -8.3 | Notes: #: Lakh bales of 170 kgs. each.
##: Lakh bales of 180 kgs. each.
*: Rabi and total production figures include summer production figures and hence, not comparable with SAE for 2023-24.
**: Rabi and total production figures here exclude summer production and hence, comparable with SAE for 2023-24.
SAE: Second advance estimates.
Sources: Ministry of Agriculture and Farmers’ Welfare; and GoI. |
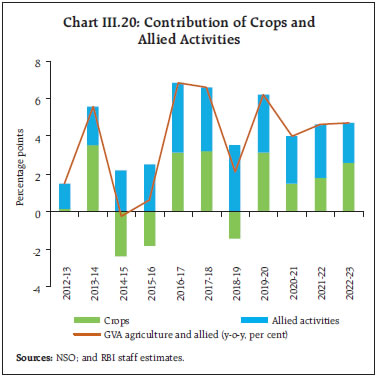 Allied activities – livestock, forestry and fishing – contributed almost 45 per cent of agricultural GVA growth in 2022-23 (Chart III.20). The overall procurement of rice during kharif marketing season in 2023-24 declined by 7.7 per cent to 454.4 lakh tonnes, while wheat procurement during rabi marketing season in 2023-24 at 262.0 lakh tonnes as on March 31, 2024 was 39.0 per cent higher than last year. As on March 16, 2024, foodgrains buffer stocks were 574.6 lakh tonnes for rice (7.6 times the norm) and 82.7 lakh tonnes for wheat (0.6 times the norm) (Chart III.21a and b). The high frequency indicators exhibit a mixed picture of rural activity as two-wheeler sales, agriculture credit and MNREGA demand indicate buoyancy while tractor sales and fertiliser sales suggest some softness in activity during H2 (Table III.7). Prospects of rural activity, however, appear bright due to better prospects of agricultural output on the back of an expected normal south-west monsoon in 2024 and accelerated pick up in informal sector activity. III.2.2 Industry The industrial sector strengthened further and recorded double digit growth in Q3:2023-24 on a favourable base and aided by strong activity across all sub-sectors. For the year as a whole, industry grew by 8.3 per cent y-o-y in 2023-24 as per the SAE. Manufacturing GVA expanded at a double digit pace for the second consecutive quarter in Q3, gaining strength from benign international commodity prices (Box III.2). Manufacturing has emerged as the key driver of economic activity, powered by reforms. The production linked incentive (PLI) scheme has made India a hub of mobile phones manufacturing and is expected to similarly benefit several other industries in the next few years. Introduction of goods and services tax (GST) has considerably improved the ease of doing of business. Mining activity was supported by robust coal and natural gas production, while crude oil production remained subdued. GVA of electricity, gas, water supply, and other utility services grew by 9.0 per cent y-o-y during Q3 (Chart III.22). 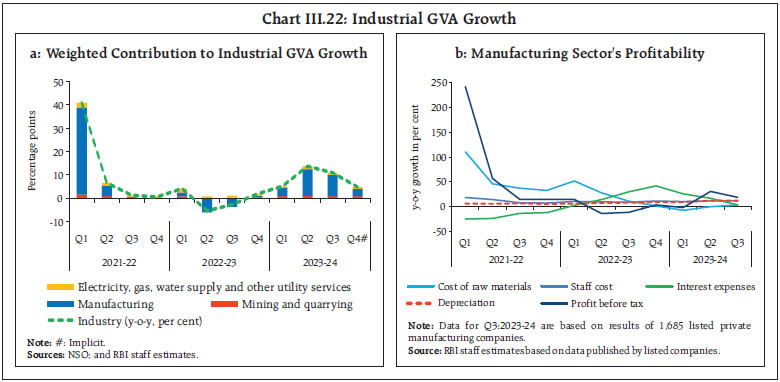
| Table III.7: Rural Economy – High Frequency Indicators | | Item | Unit | H1 (Apr-Sep) | H2 (Oct-Feb) | | 2021-22 | 2022-23 | 2023-24 | 2021-22 | 2022-23 | 2023-24 | | Tractor sales | Number (in lakh) | 4.4 | 4.9 | 4.7 | 3.3 | 3.8 | 3.3 | | Two-wheeler sales | Number (in lakh) | 65.5 | 84.0 | 87.4 | 58.2 | 61.7 | 77.5 | | Fertiliser sales | Lakh tonnes | 269.1 | 307.2 | 312.9 | 237.0 | 275.2 | 270.3 | | Demand for employment (MGNREGA)* | Crore households | 16.7 | 13.9 | 15.1 | 13.6 | 12.0 | 11.5 | | Agriculture and allied sector exports** | USD billion | 22.7 | 26.4 | 23.3 | 17.7 | 16.4 | 15.4 | | Agriculture credit growth | y-o-y | 13.1 | 13.4 | 16.8 | 12.9 | 15.0 | 20.1 | | Rice stock to buffer norm# | Ratio | 3.4 | 2.8 | 3.1 | 7.5 | 5.8 | 7.6 | | Wheat stock to buffer norm# | Ratio | 2.3 | 1.1 | 1.2 | 1.5 | 0.7 | 0.6 | Sources: TMA; SIAM; MoC&F; Ministry of Rural Development; CMIE; RBI; and FCI.
Notes: *up to March. **up to January.
#; as on March 16, 2024. |
Box III.2: Transmission of Commodity Prices Shocks to Value Addition of Different Sectors in India A surge in commodity prices, triggered by supply chain disruptions amidst the pandemic and subsequently Russia-Ukraine conflict, has impacted both global and domestic economic activity in the form of input cost pressures. Global commodity prices have softened since then, providing tailwinds to growth of real gross value added (GVA). The effect of international commodity prices on GVA of major sectors is modelled by using a structural vector autoregression (SVAR) with global and domestic variables (Knoop and Vespignani, 2014)- using quarterly data from Q1:2003-04 to Q2:2023-249. 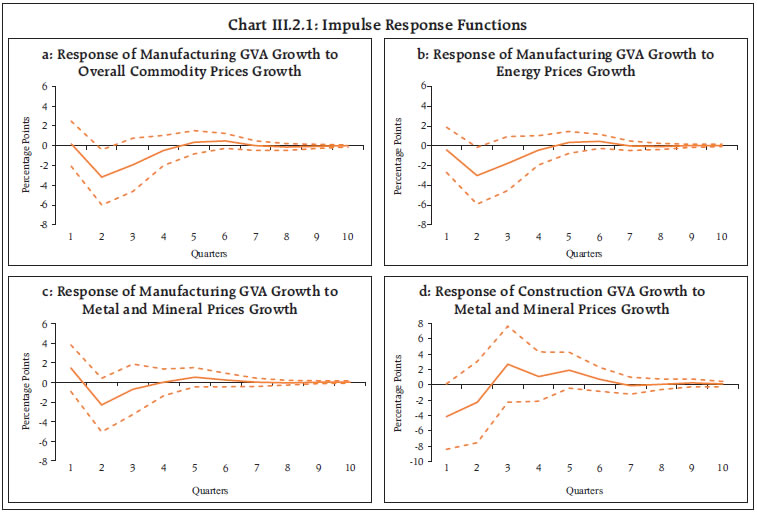 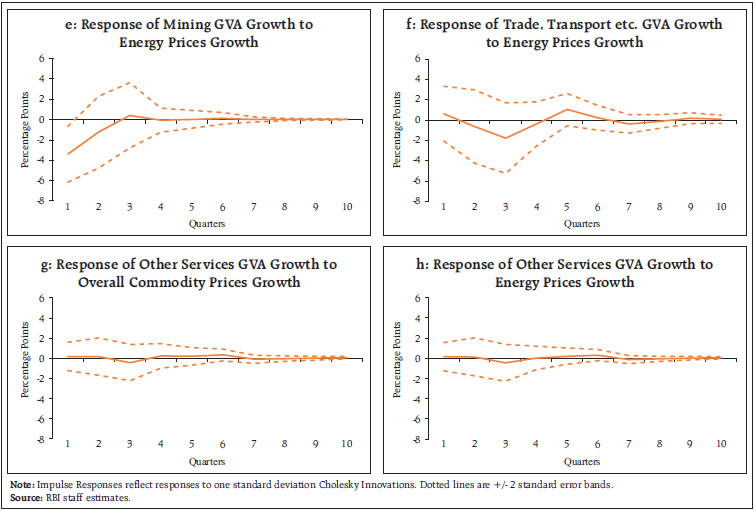 The impulse responses indicate that a positive shock to growth in international aggregate commodity prices; energy prices; and metal and mineral prices pulls down domestic manufacturing GVA growth with a lag of two quarters (Chart III.2.1). The adverse impact of metals and mineral prices on construction GVA growth is steeper and faster. Energy prices also adversely impact GVA growth in mining within one quarter. On the contrary, though energy prices negatively impact GVA growth of trade, transport etc., their impact is not found to be statistically significant. GVA growth of other services appears to be immune to commodity price fluctuations. References: Stephen J. Knop & Joaquin L. Vespignani (2014). The sectorial impact of commodity price shocks in Australia. Economic Modelling, 42 (2014), 257-271. | The index of industrial production (IIP) grew at 6.0 per cent during Q3:2023-24 and 3.8 per cent y-o-y in January, with support from all constituents (Chart III.23 and Table III.8). Mining and quarrying gained further with a growth of 8.2 per cent in Q3 and 5.9 per cent in January. Manufacturing recorded an expansion of 5.3 per cent in Q3 (1.4 per cent during the previous year) and 3.2 per cent in January. While the production of basic metals, coke and refined petroleum products, motor vehicles and machinery and equipment recorded an upsurge in Q3, manufacturing of furniture, wearing apparel and computer, electronic and optical products acted as a drag on growth. In terms of the use-based classification, primary, capital, intermediate, infrastructure and consumer durables rose during Q3 and January. Consumer non-durable goods, however, grew at a subdued pace during this period. 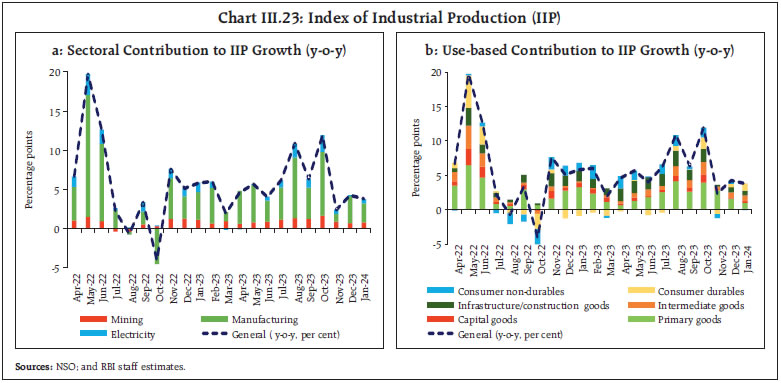
| Table III.8: Industrial Sector y-o-y growth | | (per cent) | | Indicators | 2023-24 | | Q1 | Q2 | Q3 | Jan | Feb | Mar | | 1 | PMI: Manufacturing (>50 indicates growth over previous month) | 57.9 | 57.9 | 55.5 | 56.5 | 56.9 | 59.1 | | 2 | Index of Industrial Production (IIP) | 4.8 | 7.8 | 6.0 | 3.8 | | | | 3 | IIP: Manufacturing | 5.1 | 6.8 | 5.3 | 3.2 | | | | 4 | IIP: Primary goods | 3.6 | 9.3 | 8.1 | 2.9 | | | | 5 | IIP: Capital goods | 5.1 | 8.8 | 7.5 | 4.1 | | | | 6 | IIP: Infrastructure and construction goods | 13.2 | 12.8 | 6.4 | 4.6 | | | | 7 | IIP: Consumer durables | -2.7 | 1.1 | 5.1 | 10.9 | | | | 8 | IIP: Consumer non-durables | 6.8 | 7.0 | 2.4 | -0.3 | | | | 9 | Eight Core Industries (ECI) | 6.0 | 10.5 | 8.4 | 4.1 | 6.7 | | | 10 | ECI: Steel | 16.5 | 15.4 | 10.2 | 8.7 | 8.4 | | | 11 | ECI: Cement | 12.7 | 10.4 | 5.1 | 5.7 | 10.2 | | | 12 | Electricity demand | 1.5 | 13.9 | 9.9 | 5.9 | 6.9 | | | | Production of Automobiles | | | | | | | | 13 | Passenger vehicles | 7.0 | 5.6 | 5.0 | 9.8 | 14.4 | | | 14 | Two wheelers | 1.3 | -1.5 | 19.0 | 26.0 | 35.7 | | | 15 | Three wheelers | 24.3 | 19.6 | 13.4 | 4.8 | 14.3 | | | 16 | Tractors | -8.9 | -10.1 | -13.0 | -17.4 | -13.6 | | | Sources: CMIE; CEIC; NSO; SIAM; HSBC, S&P Global; and RBI staff estimates. | Electricity, gas, water supply and other utility services maintained buoyancy and posted sharp growth in H2, reflecting underlying demand conditions. Electricity generation rose sharply by 9.0 per cent y-o-y in Q3:2023-24 (7.9 per cent a year ago) driven by thermal power generation which registered a growth of 14.3 per cent. Renewable energy sources, which have a share of 11.5 per cent in total generation, increased by 7.0 per cent. In Q4 (up to February), electricity generation growth increased to 6.6 per cent (Chart III.24a). Region-wise, electricity demand remained strong in all regions in Q3 and Q4 (up to February) (Chart III.24b).
The manufacturing purchasing managers’ index (PMI) stayed in expansion mode all through H2, and rose to 57.5 in Q4 with a sharp uptick in new orders, including for exports. The future output index also strengthened (Chart III.25a). III.2.3 Services Services remain the backbone of the Indian economy, with a contribution of over 70 per cent to GVA growth. Over the years, there has been a shift from low value addition services to high-skilled high value addition services. The sector maintained its momentum in H2:2023-24, with an impetus from construction activity; trade, hotels, transport, communication and broadcasting; and financial, real estate and professional services (Chart III.26a). Services sector GVA growth accelerated to 7.4 per cent in Q3 from 6.9 per cent in the previous quarter. As per the SAE, the services sector is expected to grow in 2023-24 at 7.9 per cent y-o-y on the top of 9.9 per cent growth a year ago. High frequency indicators suggest strong construction activity in H2 – steel consumption recorded robust growth and a healthy expansion was registered by cement production (Chart III.26b). GVA growth of trade, hotels, transport, and communication was 6.7 per cent y-o-y in Q3:2023-24 (4.5 per cent in Q2). GST collections in H2:2023-24 point towards robust domestic trading activity. Domestic air passenger traffic remained steady in H2, reflecting sustained growth in tourism and business-related travels. Indicators of transportation services, however, display a mixed picture – commercial vehicles growth slowed down in Q3, while passenger vehicles sale and toll collections remained strong in Q3 and Q4 (January-February). Port cargo registered double digit growth in Q3 and expansion in Q4 (January-February), while railway freight traffic held up its momentum during this period. 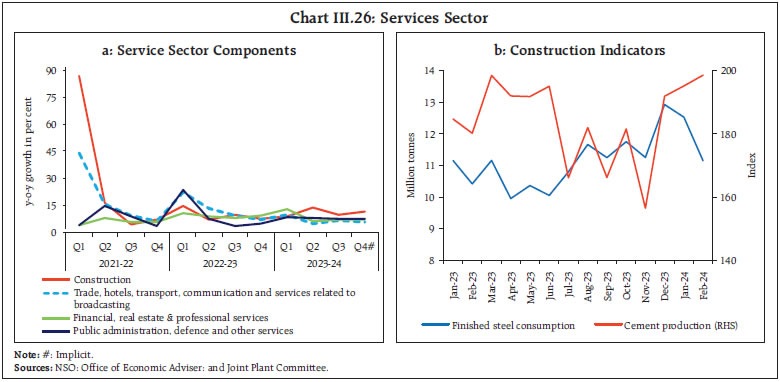 Financial, real estate and professional services rose by 7.0 per cent y-o-y in Q3:2023-24 and was a major contributor to service sector GVA growth (31.9 per cent) as well as to aggregate GVA growth (22.0 per cent). Bank credit and deposits expanded y-o-y by 16.3 per cent and 12.9 per cent, respectively, as on March 22, 2024. Insurance premia growth in both life and non-life segments also remained healthy in H2 (October-February) (Table III.9). Nominal sales growth of non-IT services improved in Q3 after witnessing two consecutive quarters of decline. The performance of IT sector, however, weakened in Q3, owing to global headwinds (Chart III.27). Real estate activity strengthened in Q3:2023-24, marked by the highest units sold since 2013-14. Unsold inventory dipped as new launches trailed units sold (Chart III.28a). The rise in all-India housing prices remained moderate in Q3, easing in Mumbai and Delhi, and accelerating in Bengaluru and Chennai (Chart III.28b). Public administration, defence, and other services (PADO) grew at 7.5 per cent y-o-y in Q3. The centre’s revenue expenditure, excluding interest payments and subsidies, declined during Q3. Healthy growth in other services like health, education and recreation, however, offset muted government consumption. 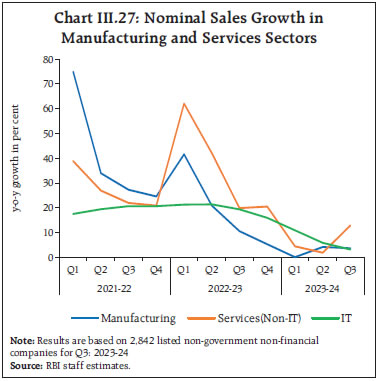
| Table III.9: Services Sector y-o-y growth | | (per cent) | | | Indicators | 2023-24 | | Q1 | Q2 | Q3 | Jan | Feb | Mar | | 1 | PMI: Services (>50 indicates growth over previous month) | 60.6 | 61.1 | 58.1 | 61.8 | 60.6 | 61.2 | | | Construction | | | | | | | | 2 | Steel consumption | 10.4 | 19.3 | 14.5 | 12.3 | 7.0 | | | 3 | Cement production | 12.7 | 10.4 | 5.1 | 5.7 | 10.2 | | | | Trade, Hotels, Transport, Communication and Services related to Broadcasting | | | | | | | | 4 | Commercial vehicle sales | -3.3 | 6.9 | 3.5 | | | | | 5 | Domestic air passenger traffic | 19.1 | 23.0 | 9.1 | 5.0 | 5.8 | | | 6 | Domestic air cargo | -1.0 | -1.0 | 9.5 | 10.0 | 11.5 | | | 7 | International air cargo | 0.1 | 3.7 | 10.7 | 19.3 | 30.2 | | | 8 | Freight traffic | 1.1 | 4.8 | 6.4 | 6.4 | 10.1 | | | 9 | Port cargo | 1.7 | 3.0 | 10.1 | 3.2 | 2.4 | | | 10 | Toll collection: volume | 15.4 | 13.3 | 12.8 | 10.2 | 12.1 | 10.6 | | 11 | Petroleum consumption | 6.4 | 6.3 | 1.7 | 8.3 | 5.7 | | | 12 | GST E-way bill | 15.8 | 15.0 | 17.1 | 16.4 | 18.9 | | | 13 | GST revenue | 11.6 | 10.6 | 12.9 | 10.4 | 12.5 | 11.5 | | | Financial, Real Estate and Professional Services | | | | | | | | 14 | Credit outstanding | 16.2 | 15.3 | 15.6 | 16.1 | 16.5 | 16.3 | | 15 | Bank deposits | 12.9 | 12.4 | 12.6 | 12.5 | 12.5 | 12.9 | | 16 | Life insurance premium | -0.9 | -21.2 | 5.4 | 27.0 | 48.4 | | | 17 | Non-life insurance premium | 18.0 | 12.7 | 12.1 | 6.6 | 12.6 | | | Sources: CMIE; CEIC; NSO; HSBC, S&P Global; MOSPI; IRDAI; and RBI staff estimates. | The services PMI strengthened from 58.1 in Q3:2023-24 to 61.2 in Q4, boosted by buoyant domestic demand and new business gains from abroad (Table III.9 and Chart III.25b). The PMI composite output index improved from 58.1 in Q3:2023-24 to 61.2 in Q4. III.3 Conclusion Backed by strong fundamentals, domestic economic activity remained robust in H2:2023-24, weathering challenges from muted global demand. Fixed investment and the lower drag from net external demand propelled real GDP growth, while private consumption received support from steady urban demand. On the supply side, manufacturing activity strengthened further, benefitting from lower input costs and improvement in global supply chains. Construction activity remained firm on the back of buoyant housing demand and the government’s thrust on infrastructure. Going ahead, private consumption will get support from improved prospects for rural demand and rising consumer confidence. The government’s continued emphasis on infrastructure creation, coupled with an uptick in private corporate investment and buoyant business optimism, could nurture a sustained revival in investment cycle, which augurs well for boosting productivity and growth in the economy. The impact of a lower fiscal impulse on growth could be offset by higher growth-inducing capital expenditure. The medium and long-term growth potential of the economy is rising, propelled by structural drivers like improving physical infrastructure; development of world class digital and payments technology; ease of doing business; enhanced labour force participation; and improved quality of fiscal spending. _________________________________________________________________________________
IV. Financial Markets and Liquidity Conditions Domestic financial market exhibited orderly movements during H2:2023-24 in contrast to volatile global market conditions. Money market rates evolved in consonance with the monetary policy stance and long-term bond yields remained stable. Banks' lending and deposit rates increased, reflecting improvement in monetary policy transmission. The Reserve Bank conducted market operations to ensure adequate liquidity to meet the productive requirements of the economy. Introduction During H2:2023-24, global financial markets remained volatile in anticipating the course of monetary policy. While sovereign bond yields moderated from October 2023, they have hardened since January 2024. Global equity markets remained buoyant in several advanced and emerging market economies. In the currency markets, the US dollar strengthened in Q3:2023-24 in the wake of tight labour market conditions, easing inflation, resilient economic growth and hawkish Fed policy commentary. Consequently, emerging market currencies turned volatile amidst large fluctuations in capital flows. IV.1 Domestic Financial Markets In contrast to global movements, domestic financial markets remained relatively stable. Money market rates evolved in tune with liquidity shifts; in contrast, long-term government bond yields eased in response to domestic developments. Equity markets remained buoyant with intermittent corrections. The INR was the least volatile among major EM currencies. In the credit market, growth in bank credit remained robust, outpacing deposit expansion. IV.1.1 Money Market During H2:2023-24 (October to January), overnight money market rates initially hovered around the marginal standing facility (MSF) rate – the ceiling of the liquidity adjustment facility (LAF) corridor – reflecting tight liquidity conditions engendered by elevated level of government cash balances and higher currency demand (Chart IV.1a). These rates moderated from February 2024 as liquidity conditions eased with a pick-up in government spending. On an average basis, the weighted average call rate (WACR) – the operating target of monetary policy – was 21 basis points (bps) above the policy repo rate during H2, up from 5 bps in H1:2023-24 (Chart IV.1b). Other overnight rates i.e., triparty repo (TREPS) and market repo moved in tandem with the WACR. 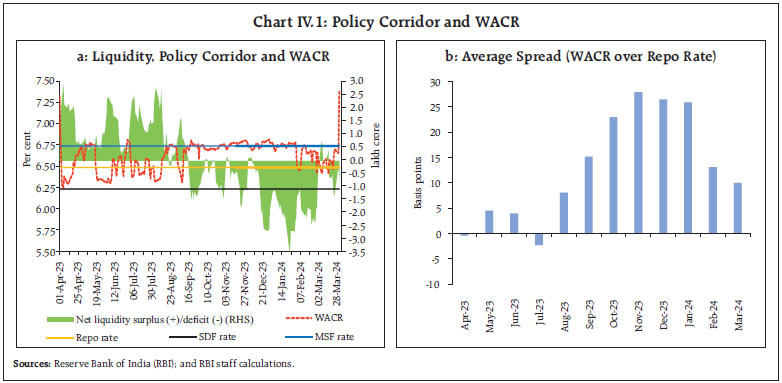 The elevated level of the WACR during H2:2023-24 was largely on account of primary dealers (PDs), the main borrowers in the overnight call market with a share of about three-fourths. Recognising the liquidity stress faced by PDs, the Reserve Bank enhanced the limit for Standalone Primary Dealers (SPDs) under the Standing Liquidity Facility (SLF) in January 2024 and made special provision under the LAF in March 2024 (see Section IV.3 for details). In the overnight call money segment, the share of reported deals1 in the total volume was negligible during H2, indicating that nearly all the deals have taken place on the NDS-Call platform, reflecting increasing NDS-Call membership. Money market activity remained dominated by the collateralised segments, with the share of the uncollateralised call money market unchanged at 2.0 per cent in H2. The share of TREPS increased to 68 per cent from 64 per cent in H1:2023-24, with a corresponding moderation in the share of market repo to 30 per cent from 34 per cent (Chart IV.2). Mutual funds (MFs) remained the major lenders in the triparty repo segment (66 per cent share in H2 as compared with 64 per cent in H1). In the market repo segment, the share of MFs declined (33 per cent share in H2 as against 40 per cent in H1) while that of foreign banks increased (43 per cent share in H2 as compared with 28 per cent in H1). On the borrowing side, the share of public sector banks (PSBs) in TREPS declined to 45 per cent in H2:2023-24 from 50 per cent in H1 while their share in market repo increased to 9 per cent in H2 from 7 per cent in H1. 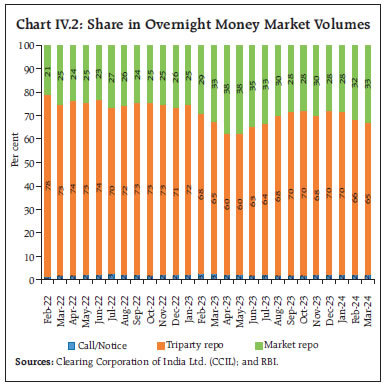 In the longer-term money market segments, the yield on 3-month T-bills (TBs), commercial papers (CPs) and certificates of deposits (CDs) ruled above the MSF rate in the second half of the year amidst tight liquidity conditions (Chart IV.3). Yields on 3-month CPs for non-banking financial companies (NBFCs) firmed up after the announcement of several regulatory measures by the Reserve Bank on November 16, 20232. The spreads of TBs, CDs and CPs over the MSF rate increased to 19 bps, 74 bps and 100 bps, respectively, in H2:2023-24 from 2 bps, 25 bps and 41 bps, respectively, in H1. Money market rates eased after the Interim Budget 2024-25 announcement implying higher government spending for 2023-24. The rates, however, spiked towards end-March 2024 due to year-end liquidity stress. 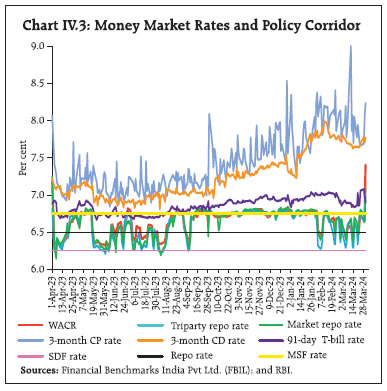 Fresh issuances of CDs increased to ₹5.5 lakh crore in H2:2023-24 from ₹3.0 lakh crore in H1, as deposit growth trailed robust credit growth. Resource mobilisation through fresh issuances of CPs moderated to ₹6.7 lakh crore during H2:2023-24 from ₹7.1 lakh crore in H1 amidst hardening of rates (Chart IV.4a). The weighted average discount rate (WADR) of CP issuances firmed up to 7.75 per cent in H2 from 7.15 per cent in H1. Corporates and NBFCs were the major issuers of CPs with a share of 34 per cent and 33 per cent, respectively, in H2 (Chart IV.4b). | Table IV.1: Maturity Profile of CP Issuances | | (₹ lakh crore) | | Tenor | H2: 2022-23 | H1: 2023-24 | H2: 2023-24 | | 7- 30 days | 0.38 | 0.45 | 0.48 | | 31-90 days | 3.13 | 3.18 | 2.32 | | 91-180 days | 1.94 | 2.75 | 3.11 | | 181-365 days | 0.97 | 0.70 | 0.77 | | Total | 6.42 | 7.09 | 6.67 | | Outstanding (as at end-period) | 3.54 | 4.12 | 3.89 | | Sources: CCIL; F-TRAC; and RBI. | Among various maturity buckets, the 91-180 days segment had the largest share of fresh CP issuances (47 per cent in H2 as against 39 per cent in H1) (Table IV.1). IV.1.2 Government Securities (G-sec) Market During H2:2023-24, G-sec yields softened, reflecting both domestic and global factors (Chart IV.5). In Q3:2023-24, the yields initially firmed up but softened thereafter tracking lower than expected domestic CPI prints for October and November, decline in crude oil prices, proposed inclusion of Indian Government bonds in a major global emerging market index and decline in US yields. Overall, the 10-year G-sec yield softened by 2 bps in Q3 to close at 7.20 per cent. The moderation continued in January 2024 due to lower-than-expected supply of state government securities. Domestic yields eased further in February 2024 following the announcement of lower gross market borrowings in the Interim Budget 2024-25. Overall, the 10-year G-sec yield fell by 13 bps in Q4 to 7.07 per cent; cumulatively, yield declined by 15 bps in H2:2023-24. The yields on T-bills hardened across tenors amidst tightening of liquidity conditions (Chart IV.6). The trading volume in G-secs increased in H2:2023-24 as compared with the corresponding period of 2022-23 tracking softening of yields (Chart IV.7). The weighted average yield (WAY) on traded maturities for G-secs declined by 11 bps while that on T-bills increased by 31 bps in H2 from their levels in H2:2022-23, reflecting liquidity tightness at the shorter end. Yields softened across the term structure as reflected in the downward shift of the curve during H2:2023-24 (Charts IV.8a). The overall dynamics of the yield curve are captured by its level, slope and curvature.3 During H2:2023-24, the average level of yields softened by 22 bps while the slope flattened by 37 bps due to relatively higher increase in short-term rates (Chart IV.8b). The curvature, on the other hand, declined by 31 bps reflecting pronounced softening in the mid segment of the curve compared to the long end. In the Indian context, the level and curvature of the yield curve are found to have more information content on future macroeconomic outcomes than the slope, unlike in AEs.4 The softening rates along with flatter slope indicates better anchoring of inflation expectations. 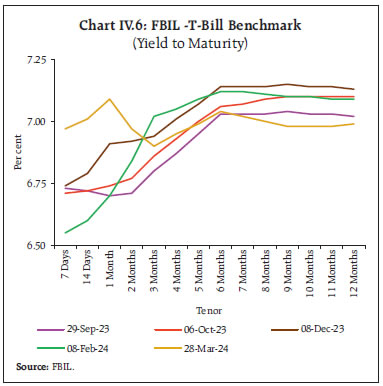
 To facilitate debt consolidation, the Reserve Bank conducted five switch auctions on behalf of the Central Government amounting to ₹51,396 crore during H2:2023-24. The weighted average maturity (WAM) of the outstanding stock of G-secs at 12.54 years during H2, was higher than 12.22 years at end- September 2023. The weighted average coupon (WAC) at 7.29 per cent at end-March 2024 was broadly at the same level as at end-September 2023 (7.28 per cent).
The weighted average spread of cut-off yields on state government securities (SGS) over the G-sec yields of comparable maturities was 34 bps in H2:2023-24 (Chart IV.9). The average inter-state spread on securities of 10-year tenor (fresh issuances) was 4 bps in H2:2023-24 as against 1 bp in H1. Overall, the Reserve Bank successfully completed the gross market borrowing programme of the Central Government for 2023-24 amounting to ₹15.4 lakh crore (net market borrowings of ₹11.8 lakh crore). Among the issuances during the year, sovereign green bonds of 5, 10 and 30 years maturity worth ₹20,000 crore were issued in H2:2023-24, underscoring the Government's commitment to sustainable and green finance. Despite record market borrowing by the Central Government during 2023-24, there was no devolvement on PDs for the first time since 2005-06. Furthermore, there was no cancellation of G-Sec auctions. The Interim Union Budget for 2024-25 has budgeted gross market borrowing of ₹14.1 lakh crore during 2024-25 (net market borrowing of ₹11.8 lakh crore). IV.1.3 Corporate Bond Market Corporate bond yields generally hardened, and spreads widened during H2:2023-24 amidst tightening of liquidity conditions and regulatory measures relating to consumer credit and bank credit to non-banking financial companies (NBFCs), as mentioned earlier. Issuer-wise, the average yield on AAA-rated 3-year bonds issued by public sector undertakings (PSUs), financial institutions (FIs) and banks softened by 2 bps (to 7.63 per cent) taking cues from easing G-sec yields while those on NBFCs and corporates hardened by 14 bps (to 7.98 per cent) and 12 bps (to 7.95 per cent), respectively, in March 2024 over September 2023, reflecting tighter regulation on NBFCs (Chart IV.10a). The risk premium (the spread over 3-year G-sec yields) increased from 33 bps to 44 bps for PSUs, FIs and banks; from 51 bps to 80 bps for NBFCs; and from 51 bps to 77 bps for corporates, respectively, in H2 (Chart IV.10b). 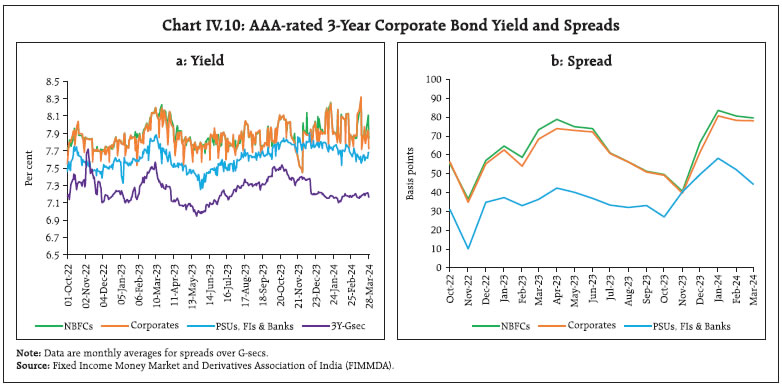
| Table IV.2: Financial Markets - Rates and Spread | | | Interest Rates
(per cent) | Spread (bps)
(over corresponding risk-free rate) | | Instrument | March 2023 | September 2023 | March 2024 | March 2023 | September 2023 | March 2024 | | 1 | 2 | 3 | 4 | 5 | 6 | 7 | | Corporate | | | | | | | | Bonds | | | | | | | | (i) AAA (1-yr) | 8.08 | 7.68 | 7.97 | 66 | 53 | 77 | | (ii) AAA (3-yr) | 8.07 | 7.83 | 7.95 | 68 | 51 | 77 | | (iii) AAA (5-yr) | 8.00 | 7.69 | 7.74 | 57 | 37 | 54 | | (iv) AA (3-yr) | 8.77 | 8.46 | 8.55 | 139 | 113 | 137 | | (v) BBB-minus (3-yr) | 12.42 | 12.14 | 12.18 | 504 | 481 | 500 | Note: Yields and spreads are computed as monthly averages.
Source: FIMMDA. | The increase in risk premia was seen across tenors and the rating spectrum (Table IV.2). In contrast, the average 3-year credit default swap (CDS) spreads for the State Bank of India and the ICICI Bank trading overseas reduced by 17 bps each in H2:2023-24 over H1 in the wake of easing global financial conditions and robust earnings of the banking sector. Primary issuances of listed corporate bonds declined to ₹3.6 lakh crore during H2 (up to February 2024) from ₹3.9 lakh crore during the corresponding period of 2022-23 (Chart IV.11a). Overseas issuances, however, witnessed an uptick. Almost the entire resource mobilisation in the corporate bond market (97.9 per cent) was through the private placement route (up to February 2024). Outstanding investments by foreign portfolio investors (FPIs) in corporate bonds increased marginally to ₹1.08 lakh crore at end-March 2024, from ₹1.03 lakh crore at end-September 2023, with the utilisation of the approved limits rising from 15.4 per cent to 16.2 per cent (Chart IV.11b). Rising FPI inflows in the sovereign debt segment in the run up to India’s inclusion in the global bond indices has not got meaningfully reflected in the corporate debt market so far. Secondary market activity increased marginally, with daily average trading volume at ₹5,500 crore during H2 (up to end-February 2024), 3.2 per cent higher than in the corresponding period of the previous year (Chart IV.11c). 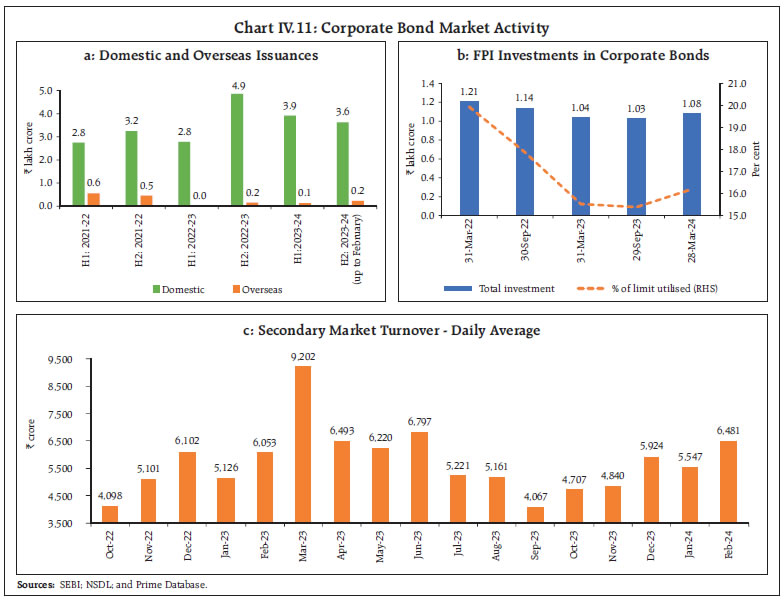 IV.1.4 Equity Market Domestic equity markets continued their upward trajectory in H2:2023-24, with the total market capitalisation of the Bombay Stock Exchange (BSE) listed firms crossing the historic US$ 4 trillion mark and making India the fifth largest market in the world. At the beginning of H2, markets declined amidst persistent FPI outflows triggered by rising geopolitical tensions in the Middle East. Thereafter, markets regained confidence in the wake of positive domestic corporate earnings for Q2:2023-24 and rising expectations of rate cuts by major advanced economy (AE) central banks. Markets remained flat at the start of the new year as disruptions to global shipping channels in the Red Sea and hawkish commentary from major central banks quelled market optimism over interest rate cuts. Moderation in the domestic CPI inflation print, strong GDP growth data for Q3:2023-24 and positive global cues kept domestic equity markets buoyant in February and early March 2024. Markets, however, corrected intermittently in March amidst regulatory concerns on valuation and liquidity risks in the broader segments before rebounding on dovish comments by the US Fed. Overall, the BSE Sensex gained 11.9 per cent during H2:2023-24 to close at 73,651 while the BSE MidCap and BSE SmallCap indices rose by 21.6 per cent and 14.9 per cent, respectively, during H2 (Chart IV.12a). Indian equity markets kept pace with major emerging market (EM) economies in H2 (Chart IV.12b). 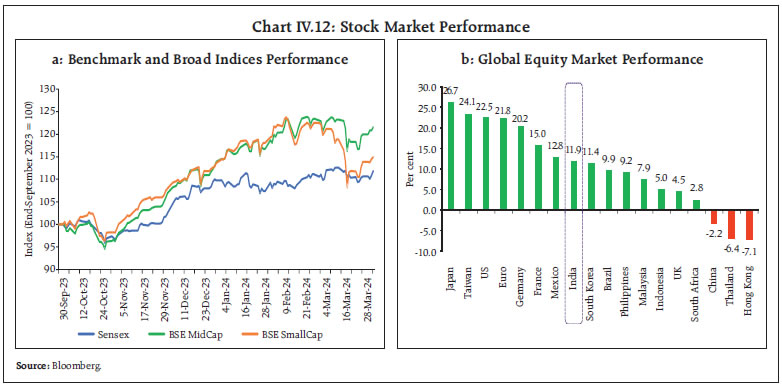 FPI flows remained volatile during H2:2023-24, with net outflows in two of the six months till March 2024. Nevertheless, foreign investors remained overall net buyers in equities, with monthly net investment flows touching a 3-year high in December 2023. Flows from domestic institutional investors (DIIs) were robust during H2:2023-24, along with reduced flows from FPIs. Overall, DIIs and FPIs were net buyers to the tune of ₹1.6 lakh crore and ₹0.7 lakh crore, respectively, in H2 (Chart IV.13a). In terms of Systematic Investment Plan (SIP) contribution through mutual funds, monthly contributions continued to record fresh highs in each successive month in H2:2023-24 (up to February 2024). Primary market resource mobilisation in equity markets increased to ₹1.17 lakh crore during H2 (up to February 2024) from ₹0.55 lakh crore in the corresponding period of the previous year (Chart IV.13b). Out of the total primary market mobilisation, the amount raised through SME IPOs/ FPOs has shown robust growth during recent years. Illustratively, the amount raised through SME IPOs/ FPOs has almost tripled to reach ₹2,925 crore during H2 (up to February 2024) from ₹991 crore in the corresponding period of the previous year. IV.1.5 Foreign Exchange Market The Reserve Bank’s exchange rate policy focusses on ensuring orderly conditions in the foreign exchange market. In 2023-24, the INR has largely remained range-bound due to strong macroeconomic fundamentals and improvements in India’s external position with the moderation in the current account deficit (CAD), revival of capital flows, and rising foreign exchange reserves. In H2:2023-24, the Indian rupee depreciated by 0.4 per cent against the US dollar. The INR traded with a depreciating bias during October-December 2023 with the strengthening of the US dollar on rising US treasury yields and on safe haven demand due to geopolitical tensions in the Middle East. Thereafter, it appreciated with INR volatility – measured by the 1-month at the money (ATM) option implied volatility – averaging 2.4 per cent during H2:20223-24, lower than 3.6 per cent during H1 (Chart IV.14). 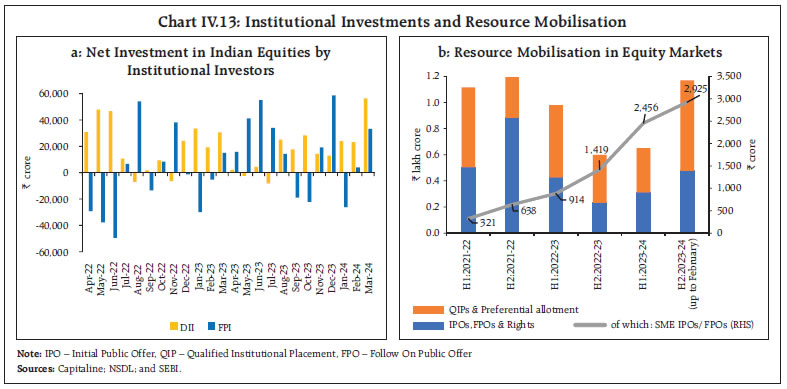
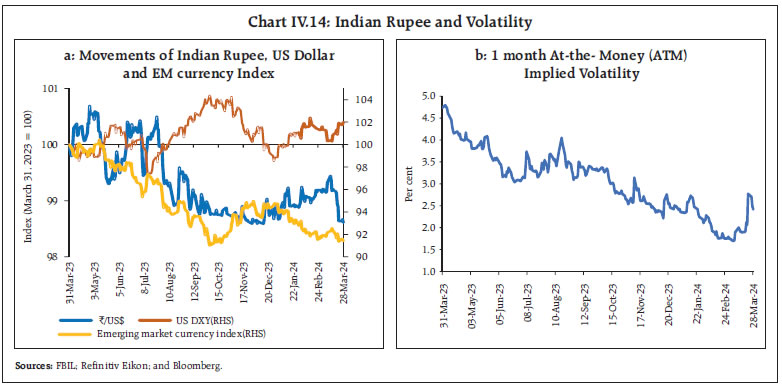 Between end-March 2023 and end-March 2024, the INR depreciated by 1.4 per cent against the US dollar although it outperformed other EME currencies (Chart IV.15). In H2:2023-24, exchange rate volatility across EME currencies abated. The Indian rupee remained among the least volatile EME currencies (Table IV.3). In terms of the Reserve Bank’s 40-currency real effective exchange rate index, the INR appreciated by 0.3 per cent between end-September 2023 (average) and end-March 2024 (Table IV.4). Forward premia declined sharply at the beginning of H2:2023-24 but recovered thereafter (Chart IV.16). On an average, the 1-month forward premia eased to 1.15 per cent in H2:2023-24 from 1.42 per cent in H1 in tandem with narrowing interest rate differential between the US and India.
IV.1.6 Credit Market Bank credit growth remained robust in H2:2023-24 with improving economic activity. Growth in non-food bank credit increased to 16.3 per cent (y-o-y) as at end-March 2024 from 15.4 per cent as at end-March 2023 (Chart IV.17).
Table IV.4: Nominal and Real Effective Exchange Rate Indices (Trade-weighted)
(Base: 2015-16 = 100) | | Item | End-March 2024
(P) | Appreciation (+) / Depreciation (-) (Per cent) | | End-March 2024 over September (average) 2023 | | 40-currency REER | 104.6 | 0.3 | | 40-currency NEER | 91.9 | 0.6 | | 6-currency REER | 102.1 | -0.2 | | 6-currency NEER | 83.5 | -0.9 | | ₹/US$ (March 28) | 83.4 | -0.4 | P: Provisional.
Sources: RBI; and FBIL. | While credit growth (y-o-y) picked up across the board, it remained higher for private sector banks (PVBs) (19.3 per cent) vis-à-vis public sector banks (PSBs) (14.7 per cent) (Chart IV.18a). PSBs, however, continued to be the major driver of incremental credit extended by all scheduled commercial banks (SCBs) in 2023-24 (Chart IV.18b).
From a sectoral perspective, credit growth was driven by services and retail sectors. Credit growth to agriculture sector peaked in January 2024 and outpaced that to the retail sector. Industrial credit growth, which was tepid during the first half of 2023-24, improved in the third quarter. Credit growth to the services sector remained resilient during 2023-24, while personal loans growth moderated, especially after the regulatory measures taken by the Reserve Bank on November 16, 20235. SCBs’ incremental credit offtake in agriculture and services sectors rose to 15.9 per cent and 35.9 per cent in February 2024 from 12.6 per cent and 35.1 per cent, respectively, in the previous year. On the contrary, the incremental share of personal loans declined over the same period (Chart IV.19). Credit to agriculture and allied activities registered double digit growth, improving to 20.1 per cent (y-o-y) in February 2024 from 15.0 per cent a year ago. The enhanced agriculture credit target and the interest subvention scheme provided by the government kept agriculture credit growth robust6. Industrial credit growth rose to 8.6 per cent in February 2024 from 6.8 per cent in the previous year due to improved credit offtake by large as well as micro and small industries. Among major industries, textiles and metals industries exhibited robust bank credit demand during the year, while credit to infrastructure and chemical industries picked up pace during H2:2023-24 (Chart IV.20). Services sector credit witnessed a healthy growth of 21.2 per cent (y-o-y) in February 2024 as compared with 20.5 per cent a year ago. Credit to NBFCs continued to be the largest contributor to this growth, though the pace moderated during the year. Credit growth to commercial real estate and transport operators improved during the year, while bank credit to trade remained resilient (Chart IV.21a). Personal loans growth moderated to 18.1 per cent in February 2024 from 20.6 per cent a year ago.
Unsecured7 personal loans growth decelerated after the increase in risk weights on select segments in November 2023. Vehicle loans growth moderated in the third quarter of the year while that for housing loans remained range bound (Chart IV.21b). The asset quality of SCBs improved during 2023-24 (up to December 2023), with the overall gross non-performing assets (NPA) ratio declining to 3.0 per cent in December 2023 from 4.5 per cent a year ago (Chart IV.22a). Asset quality improved across all the major sectors (Chart IV.22b). Non-SLR8 investments of banks (comprising investments in CPs, bonds, debentures and shares of public and private corporates) increased by 4.1 per cent in H2:2023-24 as against a decline of 3.7 per cent in H1:2023-24 (Chart IV.23a). The growth in adjusted non-food credit (i.e., non-food bank credit plus non- SLR investments by banks) accelerated to 15.5 per cent in Q4:2023-24 from 13.9 per cent in Q4:2022-23 (Chart IV.23b).
Reflecting the improvement in credit offtake, excess holdings of SLR securities of SCBs moderated to 7.7 per cent of their net demand and time liabilities (NDTL) as on February 23, 2024 from 8.7 per cent at end-March 2023 (Chart IV.24). Excess SLR holdings provide collateral buffers to banks for availing funds under the LAF and are also a component of the liquidity coverage ratio (LCR). During H2:2023-24, the incremental credit-deposit ratio remained below 100 per cent as against ruling above 100 per cent for the corresponding period a year ago (Chart IV.25). This reflected a surge in deposit mobilisation, particularly in the wake of withdrawal of ₹2000 notes. Consequently, the wedge between credit and deposit growth has reduced. As at end-March 2024, the incremental credit-deposit ratio stood at 95.9 per cent. IV.2 Monetary Policy Transmission The transmission to banks’ lending and deposit rates continued in H2:2023-24, with banks increasing rates on the back of persistent credit demand. The 1-year median marginal cost of funds-based lending rate (MCLR) of scheduled commercial banks (SCBs) increased by 15 basis points (bps), reflecting higher cost of borrowings. The weighted average lending rates (WALRs) on outstanding and fresh rupee loans witnessed marginal change with WALR on outstanding rupee loans inceasing by 1 bp, while that on fresh rupee loans declining by 2 bps during H2: 2023-24 (up to February 2024). In response to the cumulative increase of 250 bps in the policy repo rate since May 2022, the WALRs on fresh and outstanding rupee loans of SCBs increased by 185 bps and 111 bps, respectively, in the current tightening phase, i.e., May 2022 to February 2024. On the deposit side, the weighted average domestic term deposit rates (WADTDRs) on fresh and outstanding rupee deposits of SCBs increased by 12 bps and 17 bps, respectively, in H2:2023-24 (up to February 2024). The WADTDRs on fresh and outstanding rupee deposits of SCBs increased by 241 bps and 183 bps, respectively, during May 2022 to February 2024 (Table IV.5). 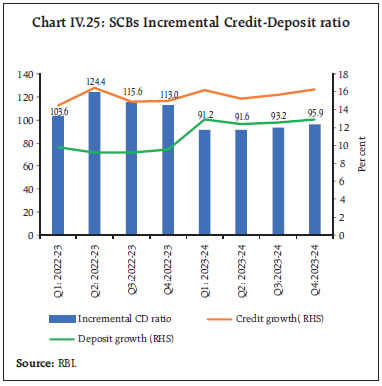 The share of EBLR-linked loans in total outstanding floating rate loans increased to 56.2 per cent as at end-December 2023 from 49.6 per cent in March 2023. Concomitantly, the share of MCLR linked loans declined to 39.4 per cent (Chart IV.26). The increasing share of EBLR-linked loans with shorter reset periods and the increase in the MCLRs aided transmission to WALRs on outstanding loans of SCBs in the current tightening cycle. Across bank groups, the transmission to WALRs on fresh rupee loans for PSBs was higher than that of PVBs during May 2022 to February 2024. In the case of WALRs on outstanding rupee loans, however, it was higher for PVBs (Chart IV.27a). The lending rates of PVBs remained above those of PSBs (Chart IV.27b). The maximum pass-through to lending rates was witnessed in the case of foreign banks, reflecting their higher share of low-cost and wholesale deposits of lower maturity. The share of EBLR-linked loans has been the highest for foreign banks, facilitating monetary policy transmission9. | Table IV.5: Transmission from the Repo Rate to Banks’ Deposit and Lending Rates | | (Variation in basis points) | | | | Term Deposit Rates | Lending Rates | | Period | Repo Rate | WADTDR - Fresh Deposits | WADTDR- Outstanding Deposits | EBLR | 1-Yr. MCLR (Median) | WALR - Fresh Rupee Loans | WALR- Outstanding Rupee Loans | | | | Retail Deposits | Retail and Bulk Deposits | | | | | | (1) | (2) | (3) | (4) | (5) | (6) | (7) | (8) | (9) | | Easing Period | | | | | | | | | | Feb 2019 to Mar 2022 | -250 | -209 | -259 | -188 | -250 | -155 | -232 | -150 | | Tightening Period | | | | | | | | | | May 2022 to Feb 2024 | +250 | 162 | 241 | 183 | 250* | 167* | 185 | 111 | | Of which | | | | | | | | | | Oct 2023 to Feb 2024 | 0 | -2 | 12 | 17 | 0 | 15* | -2 | 1 | Notes: 1. WALR: Weighted average lending rate. WADTDR: Weighted average domestic term deposit rate;
MCLR: Marginal cost of funds-based lending rate; EBLR: External benchmark-based lending rate.
2. Data on EBLR pertain to 32 domestic banks.
*: Latest data on EBLR and MCLR pertain to March 2024.
Source: RBI. |
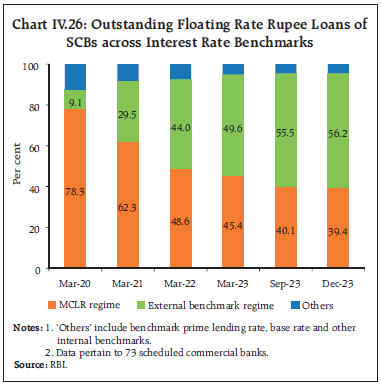 The combination of tight liquidity conditions and robust credit demand prompted banks to increase their term deposit rates in order to raise fresh deposits (Chart IV.28a). Across bank groups, the pass-through to WADTDRs on fresh and outstanding deposit rates was higher for PSBs than PVBs (Chart IV.28b). During the period May 2022 to February 2024, the transmission to WALRs on fresh and outstanding loans has been broad-based across sectors. The highest increase in the WALRs on fresh rupee loans was witnessed in case of large industries (185 bps) followed by agriculture (167 bps), infrastructure (155 bps), education (154 bps) and other personal loans (152 bps) (Chart IV.29a). In case of floating rate loans, which are mandatorily linked to EBLR, the WALRs on fresh loans of domestic banks increased by 166 bps for vehicle loans, 166 bps for MSME loans, 150 bps for education loans and 139 bps for housing loans (Chart IV.29b).
The spreads (WALRs on fresh floating rate rupee loans over the policy repo rate) have narrowed in the recent period, thereby moderating the extent of transmission to WALRs on fresh rupee loans (Table IV.6). In the current tightening cycle, the extent of transmission to term deposit rates has remained higher than lending rates (Chart IV.30a and b). Though the savings deposit rates of banks have remained almost unchanged, the declining share of current account and savings account (CASA) deposits in total deposits along with the higher transmission to term deposit rates as compared to lending rates, has exerted downward pressure on net interest margins (NIMs) of banks in the recent quarter (Chart IV.30c and d). 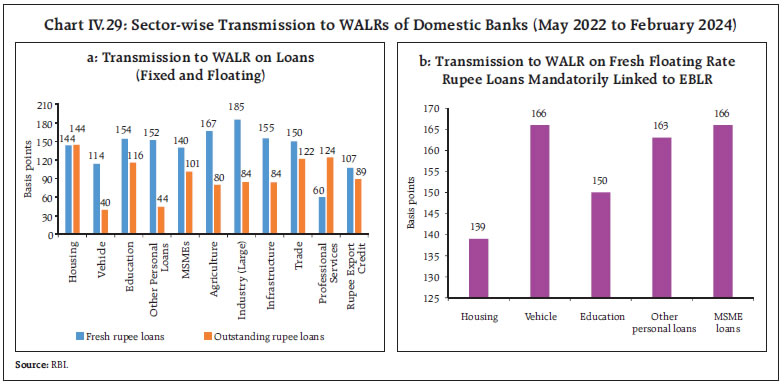
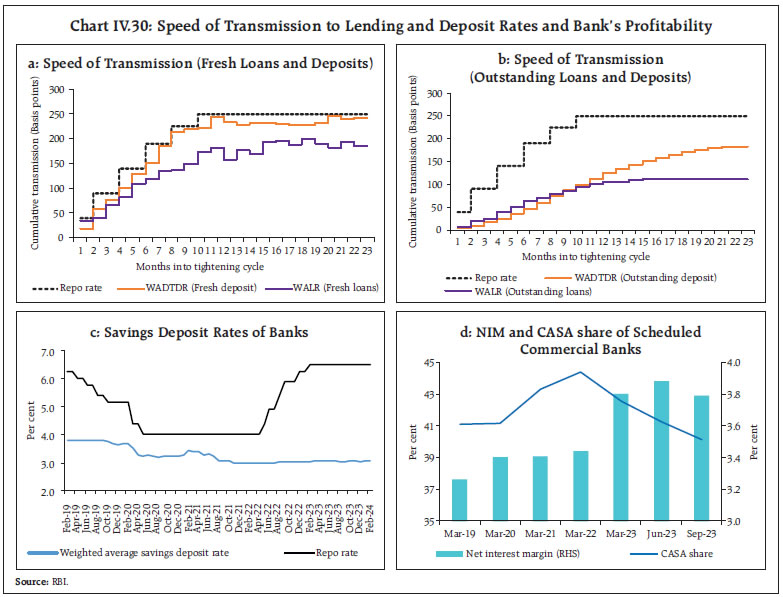
| Table IV.6: Loans linked to External Benchmark- Spread of WALR (Fresh Loans) over the Repo Rate | | Sectors | Apr-22 | Feb-24 | | Public sector banks | Private sector banks | Domestic banks | Public sector banks | Private sector banks | Domestic banks | | MSME Loans | 4.27 | 3.93 | 4.04 | 3.36 | 3.15 | 3.20 | | Personal Loans | | | | | | | | Housing | 2.91 | 3.32 | 3.21 | 2.12 | 2.09 | 2.10 | | Vehicle | 3.37 | 4.39 | 3.55 | 2.63 | 3.05 | 2.71 | | Education | 4.42 | 5.71 | 4.71 | 3.77 | 3.64 | 3.71 | | Other personal loans | 3.54 | 7.35 | 4.01 | 3.22 | 2.80 | 3.14 | Note: Other personal loans include loans other than housing, vehicle, education and credit card loans.
Sources: RBI; and RBI staff estimates. |
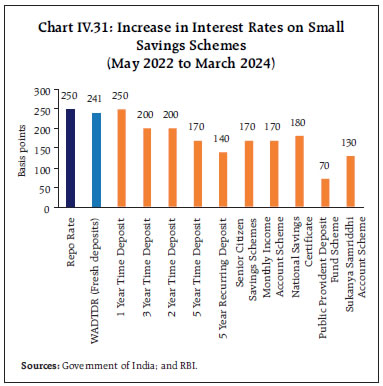
| Table IV.7: Interest Rates on Small Savings Instruments – Q1:2024-25 | | Small Savings Scheme | Maturity (years) | Spread (Percentage point) $ | Average G-sec Yield (%) of Corresponding Maturity (Dec 2023 to Feb 2024) | Formula based Rate of Interest (%) (applicable for Q1:2024-25) | Government Announced Rate of Interest (%) in Q1:2024-25 | Difference (percentage points) | | (1) | (2) | (3) | (4) | (5) = (3) + (4) | (6) | (7) = (6) - (5) | | Savings Deposit | - | | | | 4.0 | - | | Public Provident Fund | 15 | 0.25 | 7.27 | 7.52 | 7.1 | -0.42 | | Term Deposits | | | | | | | | 1 Year | 1 | 0 | 6.81 | 6.81 | 6.9 | 0.09 | | 2 Year | 2 | 0 | 6.86 | 6.86 | 7.0 | 0.14 | | 3 Year | 3 | 0 | 6.92 | 6.92 | 7.1 | 0.18 | | 5 Year | 5 | 0.25 | 7.03 | 7.28 | 7.5 | 0.22 | | Recurring Deposit Account | 5 | 0 | 6.92 | 6.92 | 6.7 | -0.22 | | Monthly Income Scheme | 5 | 0.25 | 6.99 | 7.24 | 7.4 | 0.16 | | Kisan Vikas Patra | 115 Months# | 0 | 7.27 | 7.27 | 7.5 | 0.23 | | NSC VIII issue | 5 | 0.25 | 7.22 | 7.47 | 7.7 | 0.23 | | Senior Citizens Saving Scheme | 5 | 1 | 7.03 | 8.03 | 8.2 | 0.17 | | Sukanya Samriddhi Account Scheme | 21 | 0.75 | 7.27 | 8.02 | 8.2 | 0.18 | $: Spreads for fixing small saving rates as per Government of India Press Release of February 2016.
#: Current maturity is 115 months.
Note: Compounding frequency varies across instruments.
Sources: Government of India; FBIL; and RBI staff estimates. | Interest rates on various small savings instruments (SSIs) have been cumulatively increased by the Government of India in the range of 70-250 bps since Q3:2022-23 (Chart IV.31). With these revisions, the rates on most of the instruments are now aligned with the formula-based rates, except for those on public provident funds and post office recurring deposits (Table IV.7). IV.3 Liquidity Conditions and the Operating Procedure of Monetary Policy The Reserve Bank of India (RBI) Act, 1934 requires the RBI to place the operating procedure relating to the implementation of monetary policy and changes thereto from time to time, if any, in the public domain (Box IV.1). During H2:2023-24, the monetary policy committee (MPC) kept the policy repo rate unchanged at 6.5 per cent and continued with the stance of withdrawal of accommodation. Drivers and Management of Liquidity Among the autonomous factors, currency in circulation (CiC) drained liquidity from the banking system in H2 as it expanded by ₹2.26 lakh crore due to festival demand and state elections. This was more than offset by the drawdown of government cash balances (₹1.43 lakh crore) and net forex purchases10 by the Reserve Bank (₹1.95 lakh crore). OMO sales through the NDS-OM11 withdrew liquidity from the banking system while the phased unwinding of the incremental cash reserve ratio (I-CRR)12 augmented liquidity. Overall, net injection under the LAF narrowed to ₹0.53 lakh crore as on March 29, 2024, from ₹0.97 lakh crore on September 29, 2023 (Table IV.8). Box IV.1: Liquidity Management Framework Liquidity management is the implementation of monetary policy decisions on a day-to-day basis through market operations. The liquidity management framework of the Reserve Bank is continuously reviewed and, as and when deemed appropriate, suitably modified to ensure efficient transmission of monetary policy signals (RBI, 2021). Changes in the framework are complemented with operational modifications to provide flexibility to banks in their own liquidity management. The revised liquidity management framework was announced on February 6 (RBI, 2020a) and operationalised on February 14, 2020. The salient features of the framework are given below: Liquidity Adjustment Facility (LAF) The weighted average call rate (WACR) remains the operating target of monetary policy. The objective of liquidity management operations is to keep the WACR around the policy repo rate, which is the single policy rate under the LAF and is decided by the Monetary Policy Committee (MPC) of the Reserve Bank. Under the LAF, the standing facilities are (i) the marginal standing facility (MSF) through which the Reserve Bank provides liquidity to banks against collateral; and (ii) the standing deposit facility (SDF) wherein banks park surplus funds with the Reserve Bank at the end of the day without collateral backing.13 Both the standing facilities are available on all days of the week throughout the year. Thus, the liquidity management corridor is characterised by the rates on the standing facilities – the MSF rate as its upper bound (ceiling) and the SDF rate as the lower bound (floor) – with the policy repo rate within and ordinarily in the middle of the corridor.14 At present, the MSF and SDF rates are equidistant from the policy repo rate – 25 bps above and below, respectively – thus rendering the liquidity management corridor symmetric with a width of 50 bps. While the facilities under the LAF are accessible to banks, standalone primary dealers (SPDs) are allowed to participate directly in all overnight liquidity management operations, including the SDF. SPDs are, however, not allowed access to the MSF. Instruments of Liquidity Management As per the extant framework, instruments of liquidity management include variable rate repo/reverse repo (VRR/ VRRR) auctions of various maturities (1-14 days), outright open market operations (OMOs), buy/sell forex swaps and other instruments as may be deployed from time to time. In order to facilitate the development of a term money market and with a view to nudge banks towards taking a view on interest rates beyond the overnight rate, a 14-day term VRR/VRRR operation at a variable rate and conducted to coincide with the cash reserve ratio (CRR) maintenance cycle15 is the main liquidity management tool.16 The main liquidity operation is supported by fine-tuning operations, overnight and/or of longer tenor, to tide over any unanticipated frictional liquidity changes during the reserve maintenance period. In addition, the RBI may conduct, if required, longer-term variable rate repo/reverse repo operations of more than 14 days. Operational Refinements To provide eligible LAF/MSF participants greater flexibility in managing their end of the day CRR balances, the Reserve Bank has introduced an optional automated sweep-in and sweep-out (ASISO) facility in its e-Kuber system effective August 6, 2020 (RBI, 2020b). Under the facility, banks can set the amount (specific or range) that they wish to keep as balances in their current accounts with the Reserve Bank at the end of each day. Depending upon this pre-set amount, access to the MSF and the SDF, as the case may be, are generated automatically without any manual intervention at the end of the day. This facility is optional and is in addition to the existing mechanism of placing manual bids in the SDF and MSF windows through the e-Kuber portal. Taking cognisance of banks’ higher recourse to the MSF while simultaneously parking large surplus funds under the SDF, reversal of liquidity facilities under both the SDF and the MSF was allowed even during weekends and holidays, effective December 30, 2023.17 This facility provides banks greater flexibility in their operations, alleviates tightness in liquidity conditions during weekends and imparts greater efficiency to liquidity management. Communication In order to improve communication on the Reserve Bank’s liquidity management framework and procedures, the (i) daily press release detailing Money Market Operations (MMO) was modified suitably to show the impact of both daily flow as well as stock of liquidity operations; and (ii) the Reserve Bank started publishing a quantitative assessment of durable liquidity conditions in the banking system on a fortnightly basis with a lag of one fortnight. In addition, periodic consultations are conducted with market participants and other stakeholders. References: 1. RBI (2020a), Statement on Developmental and Regulatory Policies, February 6. 2. RBI (2020b), Statement on Developmental and Regulatory Policies, August 6. 3. RBI (2022), Statement on Developmental and Regulatory Policies, April 8. 4. RBI (2023), Governor’s Statement, December 8. | The Reserve Bank’s liquidity management encompassed two-way operations during H2:2023-24. System liquidity turned into deficit mode for the first time in mid-September 2023 after a gap of nearly four and a half years and the deficit persisted in the wake of elevated government cash balances during H2.18 The Reserve Bank injected liquidity through twenty-nine variable rate repo (VRR) operations – six main and twenty-three fine tuning auctions – to ease liquidity tightness in H2 (Chart IV.32a). The demand for these funds was robust as reflected in high bid-cover ratios (Chart IV.32b). Additionally, banks took recourse to the MSF and borrowed funds – ₹0.72 lakh crore in H2 – higher than ₹0.29 lakh crore in H1. Daily MSF borrowings scaled an all-time high of ₹2.34 lakh crore on November 22, 2023. Of the average total absorption under the LAF at ₹0.76 lakh crore during H2, average placement under the SDF constituted about 88.2 per cent (₹0.67 lakh crore), while the remaining was absorbed through VRRR auctions. During H2, six fine tuning VRRR auctions were conducted between February 2-7, 2024, to absorb surplus liquidity engendered by the pick-up in government spending, followed by eight more in the remaining part of February and March. In view of banks’ likely preference for holding liquidity in the wake of deficit conditions, eleven of these operations were of overnight maturity. On a net basis, average daily injection amounted to ₹1.06 lakh crore in H2 as against net absorption of ₹1.07 lakh crore in H1. Adjusted for government cash balances, however, average potential liquidity in the banking system remained in surplus (₹2.34 lakh crore) during H2. | Table IV.8: Liquidity – Key Drivers and Management | | (₹ crore) | | | 2022-23 | 2023-24 | | H1 | H2 | H1 | H2 | | Drivers | | (i) CiC [withdrawal (-) /return (+)] | -24,604 | -2,20,200 | 89,356 | -2,26,367 | | (ii) Net Forex [Purchases (+)/ Sales (-)] | -2,73,554 | 28,750 | 1,44,667 | 1,94,861 | | (iii) GoI Cash Balances [build-up (-) / drawdown (+)] | -1,99,861 | 2,83,889 | -4,17,851 | 1,42,695 | | (iii) Excess Reserves [build-up (-) / drawdown (+)] | 95,719 | 21,674 | 34,925 | -46,886 | | Management | | (i) Net OMO [Purchases (+)/ Sales (-)] | -21,080 | -10,280 | -8,480 | -10,025 | | (ii) Required Reserves [including both change in NDTL and CRR] | -1,17,000 | -45,701 | -1,35,220 | 7,503 | | Memo Item | | | | | | Net Absorption (+)/ Injection (-) as at end-period | 54,110 | 1,28,497 | -97,015 | -52,918 | CiC: Currency in Circulation. GoI: Government of India
Note: (+) / (-) sign suggests accretion/depletion in banking system liquidity.
Data pertains to the last Friday of the respective period.
Source: RBI. |
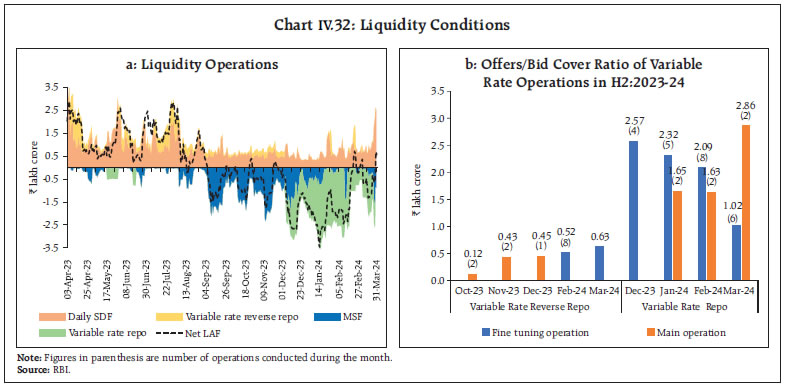 Reserve money (RM) expanded by 6.7 per cent (y-o-y) (adjusted for the first-round impact of the change in the CRR) as against 7.4 per cent a year ago. The growth in currency in circulation (CiC) decelerated to 4.1 per cent from 7.8 per cent a year ago, reflecting the withdrawal of ₹2000 banknotes. Money supply (M3) increased by 11.2 per cent (y-o-y) as at end-March 2024 from 9.0 per cent during the corresponding period of the previous year, led by double digit growth in aggregate deposits (Table IV.9). | Table IV.9: Banking and Monetary Aggregates | | (Y-o-y growth, per cent) | | Indicator | March 2022 | March 2023 | September 2023 | March 2024 | | Reserve money | 13.0 | 9.7 | 6.4 | 6.7 | | (Adjusted for CRR changes) | (10.3) | (7.4) | (5.0) | (6.7) | | Broad money (M3) | 8.8 | 9.0 | 10.8 | 11.2 | | Currency in circulation | 9.8 | 7.8 | 4.1 | 4.1 | | Aggregate deposits | 8.9 | 9.6 | 12.4 | 12.9 | | Demand deposits | 11.4 | 5.2 | 11.3 | 12.1 | | Time deposits | 8.6 | 10.2 | 13.5 | 13.7 | | Bank credit | 9.6 | 15.0 | 15.3 | 16.3 | Source: RBI.
Note: Data on broad money, deposit and credit growth exclude the impact of merger of a bank with a non-bank. | Other policy measures Based on an assessment of the liquidity conditions and its impact on PDs, the Reserve Bank of India made available an aggregate amount of ₹5,000 crore, over and above the existing limit of ₹5,000 crore, to Standalone Primary Dealers (SPDs) under the Standing Liquidity Facility (SLF) at the prevailing repo rate effective January 31, 2024. Moreover, as a special case, SPDs were also allowed to participate in the 6-day VRR auction of ₹75,000 crore conducted on March 27, 2024. IV.4 Conclusion Domestic financial market conditions evolved in an orderly manner in H2:2023-24, notwithstanding volatility in global market conditions. Money market rates moved in consonance with the monetary policy stance. While short-term rates fluctuated in reflection of liquidity developments, long-term rates remained largely stable, reflecting better anchoring of inflation expectations. Equity market scaled new highs, supported by inflows from domestic investors. The INR exhibited lower volatility than its emerging market peers. Monetary transmission continued amidst robust credit growth outpacing deposit expansion. The evolution of liquidity conditions was in alignment with the monetary policy stance. Going forward, the Reserve Bank will remain agile and nimble in conducting market operations to ensure financial stability while providing liquidity to meet the productive requirements of the economy. _________________________________________________________________________________
V. External Environment The global economy remained resilient. Inflation eased, although it still rules above targets in several economies prompting central banks to maintain monetary policy restraint as they tread the 'last mile' of disinflation. Geopolitical tensions, elevated public debt amidst tight financial conditions, weak recovery in China, geoeconomic fragmentation and extreme weather events pose downside risks to the outlook. Since the October 2023 MPR, the global economy has exhibited resilience amidst several headwinds. Global growth is projected to remain steady in 2024 but with divergent trajectories across countries. Both headline and core inflation (headline excluding food and energy) are easing although headline inflation still rules above targets in several economies. Major central banks have maintained monetary policy restraint as they tread the last mile of disinflation. Global financial markets remain volatile in response to fluctuating perceptions on the monetary policy trajectory. Global equity markets corrected in October 2023 over expectations of ‘higher for longer’ monetary policy paths but rallied subsequently as prospects of reversal of monetary policy cycles appeared brighter. Bond yields have moderated since October. The US dollar pared gains in Q4:2023 but strengthened in Q1:2024. Emerging market economy (EME) currencies broadly strengthened since the last MPR. Risks to global growth outlook are broadly balanced. V.1 Global Economic Conditions In H2:2023, global activity remained resilient but with cross-country divergences. Growth was stronger than anticipated in the United States, and in several major emerging market and developing economies (EMDEs)1. It was subdued in the Euro area and many low-income economies, reflecting weak consumer sentiment and sluggish interest-rate-sensitive manufacturing and business investment amidst elevated borrowing costs. High frequency indicators for Q1:2024 point to rebound in manufacturing and sequential improvement in service sector activity. The International Monetary Fund (IMF) in its World Economic Outlook (WEO) update of January 2024 revised up global growth projection for 2024 by 20 bps to 3.1 per cent and retained the projection for 2025 at 3.2 per cent2. Among major economies, the US economy grew at a resilient pace of 3.4 per cent (quarter-on-quarter, seasonally adjusted annualised rates (q-o-q, saar)) in Q4:2023 (lower than the Q3 outturn of 4.9 per cent) reflecting the support from consumer spending, government spending, exports and non-residential fixed investment (Table V.1). The unemployment rate remained low with a better balance in labour demand and supply than Q3. The US composite S&P global purchasing managers’ index (PMI3) edged lower to 52.1 in March from 52.5 in February 2024, its highest since June 2023. The Euro area stagnated in Q4:2023 following a contraction of 0.2 per cent in Q3 (q-o-q, saar), reflecting monetary tightening and the adverse impact of the war in Ukraine. Industrial production declined on a year-on-year (y-o-y) basis for H2:2023 and January 2024 albeit with expansion of production in construction sector. Nonetheless, the labour market remained robust with the unemployment rate at a record low of 6.4 per cent in January 2024. The UK economy slipped into technical recession at the end of 2023 as GDP registered a contraction of 0.5 per cent in Q3 and 1.2 per cent in Q4 (q-o-q, saar) due to decline in the volume of net trade, household consumption and gross capital formation. The labour market, however, remained relatively tight but with a moderation in wage growth. The UK composite PMI at around 53 in January-February 2024 was at its highest since June 2023, signalling a robust expansion in business activity in early 2024 before edging down marginally to 52.8 in March. Japan avoided a technical recession as GDP increased by 0.4 per cent (q-o-q, saar) in Q4:2023 after contracting by 3.2 per cent in Q3, driven by increase in gross fixed capital formation. The unemployment rate remained low at 2.6 per cent in February and nominal wages per employee increased moderately. The composite PMI (au Jibun Bank) remained in expansion since the beginning of 2024, increasing to 51.7 in March from 50.6 in February. | Table V.1: Real GDP Growth | | (Per cent) | | Country | Q1-2023 | Q2-2023 | Q3-2023 | Q4-2023 | 2022 | 2023 (E) | 2024 (P) | 2025 (P) | | Quarter-on-quarter, seasonally adjusted, annualised rate (q-o-q, saar) | | Canada | 2.6 | 0.6 | -0.5 | 1.0 | | | | | | Euro area | 0.2 | 0.5 | -0.2 | -0.2 | | | | | | Japan | 4.0 | 4.2 | -3.2 | 0.4 | | | | | | South Korea | 1.3 | 2.5 | 2.5 | 2.5 | | | | | | UK | 0.7 | 0.0 | -0.5 | -1.2 | | | | | | US | 2.2 | 2.1 | 4.9 | 3.4 | | | | | | Year-on-year | | Advanced Economies | | Canada | 1.8 | 1.0 | 0.5 | 0.9 | 3.8 | 1.1 | 1.4 | 2.3 | | Euro area | 1.3 | 0.6 | 0.1 | 0.1 | 3.4 | 0.5 | 0.9 | 1.7 | | Japan | 2.6 | 2.3 | 1.6 | 1.2 | 1.0 | 1.9 | 0.9 | 0.8 | | South Korea | 0.9 | 0.9 | 1.4 | 2.2 | 2.6 | 1.4 | 2.3 | 2.3 | | UK | 0.3 | 0.2 | 0.2 | -0.2 | 4.3 | 0.5 | 0.6 | 1.6 | | US | 1.7 | 2.4 | 2.9 | 3.1 | 1.9 | 2.5 | 2.1 | 1.7 | | Emerging Market Economies | | Brazil | 4.2 | 3.5 | 2.0 | 2.1 | 3.0 | 3.1 | 1.7 | 1.9 | | China | 4.5 | 6.3 | 4.9 | 5.2 | 3.0 | 5.2 | 4.6 | 4.1 | | India | 6.2 | 8.2 | 8.1 | 8.4 | 7.0 | 7.6 | 6.5 | 6.5 | | Indonesia | 5.0 | 5.2 | 4.9 | 5.0 | 5.3 | 5.0 | 5.0 | 5.0 | | Philippines | 6.4 | 4.3 | 6.0 | 5.6 | 7.6 | 5.3 | 6.0 | 6.1 | | Russia | -1.8 | 4.9 | 5.5 | | -1.2 | 3.0 | 2.6 | 1.1 | | South Africa | 0.1 | 1.8 | -0.7 | 1.2 | 1.9 | 0.6 | 1.0 | 1.3 | | Thailand | 2.6 | 1.8 | 1.4 | 1.7 | 2.5 | 2.5 | 4.4 | 2.0 | | Memo: | | World | 2022 | 2023 (E) | 2024 (P) | 2025 (P) | | Year-on-year | | Output | 3.5 | 3.1 | 3.1 | 3.2 | | Trade volume | 5.2 | 0.4 | 3.3 | 3.6 | E: Estimate P: Projection
Note: India’s annual data correspond to fiscal year (April-March); e.g., 2023 pertains to April 2023-March 2024.
Sources: Official statistical agencies; Bloomberg; IMF WEO Update, January 2024; and RBI staff estimates. | Among EMEs, China’s real GDP growth moderated to 4.1 per cent (q-o-q, saar) in Q4 from 6.1 per cent in Q3 amidst a deepening property crisis, mounting deflationary risks and tepid demand. Nonetheless, for the full year 2023, the economy grew by 5.2 per cent – propelled higher primarily by base effects – exceeding the official target of 5.0 per cent. The composite PMI (Caixin) accelerated to 52.7 in March from 52.5 in February, signalling an expansion of the overall Chinese business activity for the fifth straight month. The Chinese economy is projected to grow by 4.6 per cent in 2024, according to the IMF. China has set its real GDP growth target for 2024 at 5 per cent. China undertook monetary easing and provided regulatory relaxation for its real estate sector to stimulate the economy. Amongst other major EMEs, Brazil’s GDP growth remained relatively steady at 2.1 per cent (y-o-y) in Q4:2023 vis-a-vis 2.0 per cent in Q3, driven by expansion in the industrial sector which was partially offset by a deceleration in its agricultural sector. The labour market, however, remained tight as the unemployment rate declined for nine consecutive months till December 2023 before picking up marginally in January and February 2024. The composite PMI remained unchanged at 55.1 in March 2024 for the second consecutive month its highest joint level since July 2022. The South African economy grew by 1.2 per cent (y-o-y) in Q4:2023 following a contraction of 0.7 per cent in Q3 over expansion in transport, storage and communication industry and robust mining activity. The composite PMI for South Africa declined to 48.4 in March– down from 50.8 in February – registering its lowest level since July 2023. The Russian economy grew by 5.5 per cent (y-o-y) in Q3:2023, partly driven by soaring military and defence spending. The composite PMI at 52.7 in March, up from 52.2 in February, signalled a modest expansion in private sector business activity. The south-east Asian economies have shown resilience in the face of large global shocks. To a large extent, this can be attributed to improved monetary and macroeconomic policy frameworks. Growth in the region has remained strong, while inflation has been lower than the OECD average. The ASEAN4 economies recorded resilient growth in Q4, amidst higher output but lower new orders. In Q1:2024, growth improved sequentially with increased output, higher employment and reduction in suppliers’ delivery time. The ASEAN manufacturing PMI for March 2024 edged up to an eleven month high of 51.5 with stronger expansion in production, rise in new orders and moderation in price pressures. In the BRICS economies barring South Africa, GDP growth for 2024 is projected to moderate marginally (Table V.2). The inflation scenario in these countries is expected to improve in 2024 for all barring Russia where inflation has been fuelled by the war, and China which is facing weak prices amidst a property slump and subdued consumer sentiment. Turning to high frequency indicators, the OECD composite leading indicators (CLIs) for February 2024 registered an uptick for most economies (Chart V.1a). The global composite PMI increased to 52.1 in February 2024 – its highest reading since July 2023 – as manufacturing PMI returned to expansion zone in February 2024 and the services PMI improved sequentially. The global manufacturing PMI accelerated in March to 50.6, its highest reading since July 2022 as new orders, output and employment expanded (Chart V.1b). | Table V.2: Select Macroeconomic Indicators for BRICS | | Real GDP growth rate (y-o-y, per cent) | Country | 2022 | 2023(E) | 2024(P) | General Govt. gross debt (per cent of GDP)# | Country | 2022 | 2023(E) | 2024(P) | | Brazil | 3.0 | 3.1 | 1.7 | Brazil | 85.3 | 88.1 | 90.3 | | Russia | -1.2 | 3.0 | 2.6 | Russia | 18.9 | 21.2 | 21.8 | | India | 7.0 | 7.6 | 6.5 | India | 81.0 | 81.9 | 82.3 | | China | 3.0 | 5.2 | 4.6 | China | 77.0 | 83.0 | 87.4 | | South Africa | 1.9 | 0.6 | 1.0 | South Africa | 71.1 | 73.7 | 75.8 | | CPI inflation rate (y-o-y, per cent) | Country | 2022 | 2023(E) | 2024(P) | Current account balance (per cent of GDP) | Country | 2022 | 2023(E) | 2024(P) | | Brazil | 9.3 | 4.7 | 4.5 | Brazil | -2.8 | -1.9 | -1.8 | | Russia | 13.8 | 5.3 | 6.3 | Russia | 10.5 | 3.4 | 4.0 | | India | 6.7 | 5.4 | 4.6 | India | -2.0 | -1.8 | -1.8 | | China | 1.9 | 0.7 | 1.7 | China | 2.2 | 1.5 | 1.4 | | South Africa | 6.9 | 5.8 | 4.8 | South Africa | -0.5 | -2.5 | -2.8 | | General Govt. net lending/borrowing (per cent of GDP) | Country | 2022 | 2023(E) | 2024(P) | Forex reserves* (in US$ billion) | Country | 2022 | 2023 | 2024 | | Brazil | -3.1 | -7.1 | -6.0 | Brazil | 324.7 | 355.0 | 352.7 | | Russia | -1.4 | -3.7 | -2.6 | Russia | 582.0 | 598.6 | 582.6 | | India | -9.2 | -8.8 | -8.5 | India | 562.7 | 622.5 | 642.6 | | China | -7.5 | -7.1 | -7.0 | China | 3306.5 | 3449.7 | 3437.5 | | South Africa | -4.7 | -6.4 | -6.5 | South Africa | 60.6 | 62.5 | 61.2 | E: Estimate P: Projection
*: Forex reserves for 2024 pertain to February 2024 for all countries except South Africa (January 2024) and India (March 2024).
#: Gross debt refers to the nonfinancial public sector, excluding Eletrobras and Petrobras, and includes sovereign debt held by the central bank.
Notes: India’s data correspond to fiscal year (April-March) except data on forex reserves which are as per calender year. India's inflation data for 2023 is from April 2023-February 2024.
Sources: Official statistical agencies; WEO October 2023 database and January 2024 Update, IMF; International Reserve and Foreign Currency Liquidity (IRFCL), IMF; and RBI. |
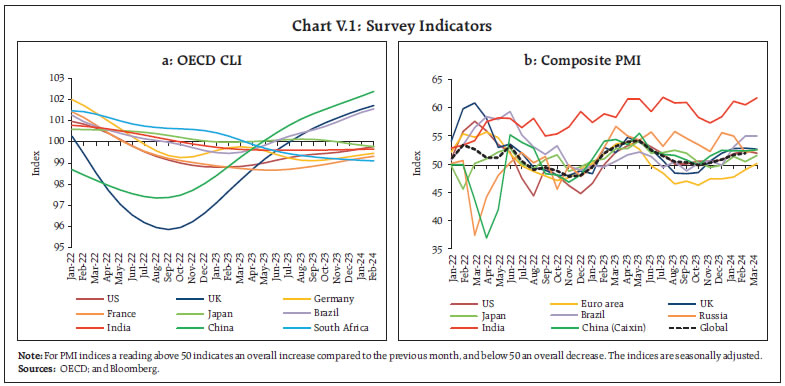 Global merchandise trade volume recorded a modest recovery of 0.4 per cent (y-o-y) in January 2024, as strong trade recovery in EMEs more than offset the contraction in AEs, following a contraction in 2023 (Chart V.2a). The momentum continued to be positive for the second month, with world trade volume rising by 0.9 per cent (m-o-m) in January (Chart V.2b). The Freightos Baltic Global Index, the global ocean freight container pricing index that measures 40-feet container prices, seemed to be losing momentum in March (-14.9 per cent, m-o-m) after a surge in January and February due to the impact of attacks on commercial ships in the Red Sea trade route. The attacks necessitated rerouting of maritime trade, inter alia, Europe and Asia via the South African Cape of Good Hope, leading to higher transit times, freight costs and war-risk premia. The latest reading of the WTO’s goods trade barometer (100.6 in December 2023 slightly above the baseline value of 100) suggests that the merchandise trade could witness a modest recovery in early 2024; however, these gains could reverse due to geopolitical risks. In its WEO update (January 2024), the IMF projected world trade volume (goods and services) to grow at 3.3 per cent in 2024, lower than the historical average of 4.9 per cent, on account of rising trade distortions and geoeconomic fragmentation. 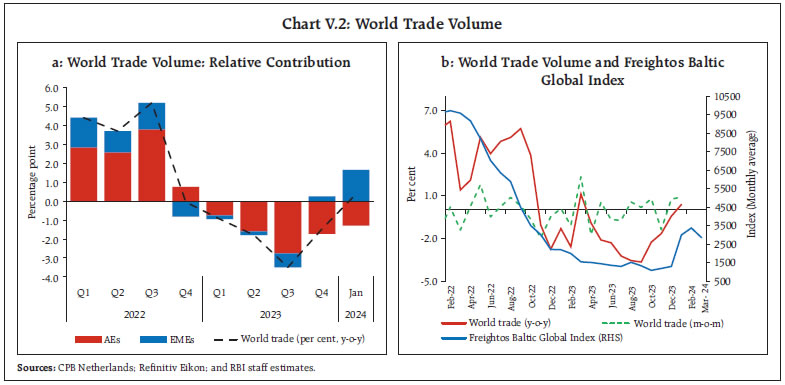 V.2 Commodity Prices and Inflation Global commodity prices softened by 5.9 per cent (in terms of the Bloomberg commodity price index) during Q4:2023, reflecting moderation in the energy sub-index (Chart V.3a). The commodity prices, however remained volatile in Q1:2024 due to easing in the agriculture sub-index, especially grains and hardening in energy sub-index. Global food prices, according to the Food and Agriculture Organization (FAO), softened by 2.2 per cent in Q4:2023 and edged down further by 1.6 per cent in Q1:2024 (up to February), primarily driven by correction in the prices of sugar, cereals and meat (Chart V.3b). Sugar prices, however, firmed up partially in Q1:2024. In contrast, the prices of dairy increased steadily throughout Q4:2023 and Q1:2024. 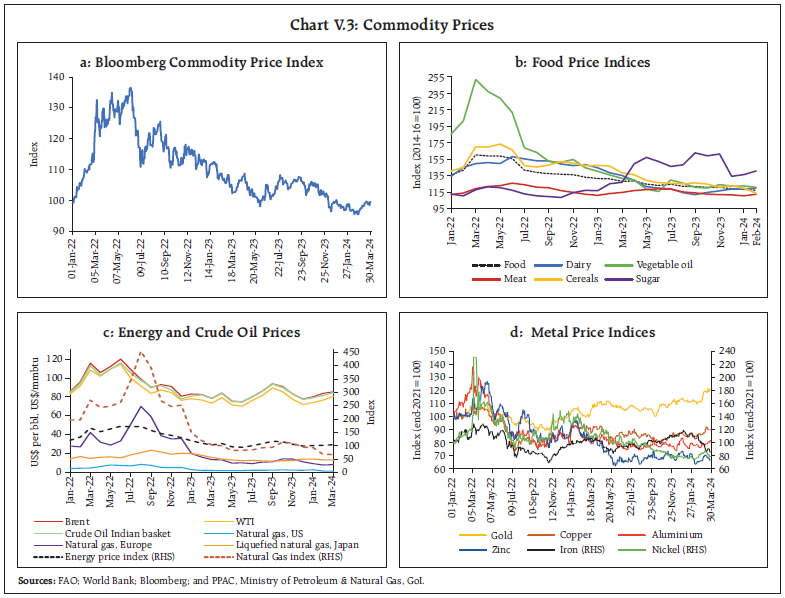 After staying elevated at US$ 90 per barrel in September-October due to output cuts by the OPEC+ and onset of the Israel-Hamas war, crude oil prices declined in Q4:2023 largely reflecting increase in non-OPEC supply, particularly from the US and Brazil, deteriorating demand prospects, and a seasonal moderation in demand (Chart V.3c). Oil prices ticked up in Q1:2024 in response to the Red Sea crisis, risk of conflagration of geopolitical tensions in the Middle East and the OPEC+ announcement of extension of voluntary cut for Q2:2024. Natural gas prices (according to World Bank’s natural gas index) remained volatile in Q4:2023 as rising geo-political tensions pushed the prices, which was offset by increased supply, especially from the US. The price of natural gas moderated in Q1:2024 reflecting higher inventory levels and an improving supply outlook (Chart V.3c). Prices of base metals like iron and copper firmed up in Q4:2023 as demand conditions improved in China, the top consumer of base metals. Nickel prices, however, declined in Q4:2023 due to a supply glut, especially in Indonesia, before a marginal recovery in prices on improvement in demand for electronic vehicles lent support to prices in Q1:2024. Most base metals, including aluminium, iron and zinc, softened in Q1:2024 as supply of these metals increased amidst looming demand concerns, uncertainty over rate cuts by the US Fed and a cloudy growth outlook for China. Gold prices rallied in Q4 as financial markets priced in deeper policy rate cuts for 2024 as reflected in lower bond yields and a weaker US dollar. The hardening of gold prices continued in Q1:2024 to record high in March on growing expectations of interest rate cuts by the US Fed, coupled with demand by central banks and Chinese investors (Chart V.3d). Consumer Price Inflation Consumer price inflation eased with recent prints nearing the pre-pandemic average for both headline and core inflation. In most countries, supply chain disruptions corrected, and central banks kept their monetary policy restrictive. Easing inflationary pressures also reflect fading energy price shocks and attenuating labour market tightness with a decline in job vacancies and a modest rise in unemployment. Wage growth has remained generally muted forestalling the formation of wage-price spirals. Notwithstanding the decline, inflation rules above target in most inflation-targeting AEs and about half of inflation-targeting EMDEs5 (Table V.3). Moreover, the inflation momentum (m-o-m change in the price index) remained volatile, delaying the descent to target. Goods inflation in major AEs has exhibited a notable decline while services inflation has remained relatively sticky (Box V.1). On the whole, near-term inflation expectations have fallen in major economies, with long-term expectations remaining anchored. According to the IMF’s WEO update of January 2024, global inflation is projected to fall from 6.8 per cent in 2023 to 5.8 per cent in 2024 and further to 4.4 per cent in 2025. | Table V.3: Consumer Price Inflation | | (Y-o-y, Per cent) | | Country | Inflation Target | Q1:2023 | Q2:2023 | Q3:2023 | Q4:2023 | Q1:2024 | | Advanced Economies | | Canada | 2.0 ± 1.0 | 5.1 | 3.5 | 3.7 | 3.2 | 2.9 | | Euro area | 2.0 | 8.0 | 6.2 | 4.9 | 2.7 | 2.6 | | Japan | 2.0 | 3.5 | 3.3 | 3.0 | 2.6 | 2.4 | | South Korea | 2.0 | 4.6 | 3.3 | 3.2 | 3.4 | 3.0 | | UK | 2.0 | 10.2 | 8.4 | 6.7 | 4.2 | 3.7 | | US | (2.0) | 5.8 | 4.0 | 3.5 | 3.2 | 3.2 | | | | (5.0) | (3.9) | (3.3) | (2.7) | (2.5) | | Emerging Market Economies | | Brazil | 3.0 ± 1.5 | 5.3 | 3.8 | 4.6 | 4.7 | 4.5 | | Russia | 4.0 | 8.8 | 2.7 | 5.2 | 7.2 | 7.6 | | India | 4.0 ± 2.0 | 6.2 | 4.6 | 6.4 | 5.4 | 5.1 | | China | | 1.3 | 0.1 | -0.1 | -0.3 | -0.1 | | South Africa | 3.0-6.0 | 7.0 | 6.2 | 5.0 | 5.5 | 5.5 | | Mexico | 3.0 ± 1.0 | 7.5 | 5.7 | 4.6 | 4.4 | 4.6 | | Indonesia | 3.0 ± 1.0 | 5.3 | 4.0 | 2.9 | 2.7 | 2.8 | | Philippines | 3.0 ± 1.0 | 8.3 | 6.0 | 5.4 | 4.3 | 3.1 | | Thailand | 1.0-3.0 | 3.9 | 1.1 | 0.5 | -0.5 | -0.9 | | Turkey | 5.0 ± 2.0 | 54.5 | 40.5 | 56.1 | 62.7 | 66.8 | | Memo: | | | 2022 | 2023 (E) | 2024 (P) | 2025 (P) | | World consumer price inflation | 8.7 | 6.8 | 5.8 | 4.4 | E: Estimate P: Projection
Notes: (1) Figures in the parentheses for US are year-on-year change in personal consumption expenditure (PCE) price index.
(2) Brazil’s inflation target for 2024 is 3.0 ± 1.5 per cent and was 3.25 ± 1.5 per cent for 2023.
(3) Inflation numbers for Q1:2024 are up to February 2024 except for Euro Area, South Korea, Indonesia and Turkey (March 2024).
Sources: Central bank websites; IMF; and Bloomberg. |
Box V.1: An Analysis of Goods and Services Inflation – A Comparative Study across AEs and EMEs Prices of services generally tend to increase faster than prices of goods due to their non-tradable nature (Balassa-Samuelson effect); higher income elasticity of demand for services; higher productivity growth in goods production than in services; and rising mark ups (ECB, 2009). In the long-run, however, the gap between both the inflation rates tends to close with either a rise in goods inflation or a decrease in services inflation (Peach et al., 2004). The magnitude of the response from goods inflation is generally much greater than the adjustment process for services inflation (Esteve et al., 2006). Prior to COVID, co-movement of goods and services inflation was evident. Post the pandemic, however, demand-supply imbalances led to high and persistent inflation amidst tight labour markets, contact-intensive services being the worst affected. As consumer spending shifted towards essentials, goods inflation flared up vis-a-vis services inflation as demand for services declined, breaking the usual co-movement briefly. With easing of restrictions on movement of people and ebbing supply chain pressures, the demand for services surged again and services inflation replaced goods inflation as the main driver of headline inflation (Atkinson and Zhou, 2022). A panel regression of 15 economies (comprising both AEs and EMEs) for January 2009 to December 2023 indicates the presence of a cointegrating relationship between goods and services inflation. Accordingly, a vector error correction model (VECM) is estimated by the pooled mean group (PMG) approach (Pesaran et al., 1999). The results indicate that in the pre-COIVD period, coefficients of the error correction term in both goods and services inflation equations are negative and statistically significant (Table V.1.1). Thus, in case of a shock leading to deviation from equilibrium, both goods as well as services inflation adjust, with speed of adjustment in goods inflation being somewhat higher. For the full sample period (including COVID and post-COVID period), both services inflation and goods inflation converge towards equilibrium, at least in the short run. The long-run coefficient of services inflation in the goods inflation equation, is, however, insignificant possibly due to a huge shift towards goods consumption during COVID and surge in services consumption post COVID as mobility restrictions were lifted. | Table V.1.1: Goods and Services Inflation: Co-integration and Error Correction Estimates | | Pre-COVID (January 2009- February 2020) | | Variables | Advanced economies (AEs) | Emerging market economies (EMEs) | Combined | | ∆Services inflation | | Long run equation: Services inflation= β.Goods inflation + error correction | | L.Goods | 0.25 *** | 0.38 *** | 0.28 *** | | (7.26) | (4.62) | (8.64) | | Short run | | Error correction | -0.15 *** | -0.09 *** | -0.13 *** | | (-6.15) | (-4.65) | (-7.03) | | D.Goods | 0.07 *** | 0.15 *** | 0.10 *** | | ( -2.99) | (4.40) | (4.63) | | ∆Goods inflation | | Long run equation: Goods inflation= β.Services inflation + error correction | | L.Services | 0.52 ** | 0.89 *** | 0.77 *** | | (2.03) | (6.09) | (5.66) | | Short run | | Error correction | -0.09 *** | -0.09 * | -0.09 *** | | (-6.35) | (-1.65) | (-5.17) | | D.Services | 0.23 ** | 0.28 *** | 0.25 *** | | (2.25) | (3.70) | (3.50) | | Full Sample (January 2009- December 2023) | | ∆Services inflation | | Long run equation: Services inflation= β.Goods inflation + error correction | | L.Goods | 0.52 *** | 0.59 *** | 0.54 *** | | (13.34) | (8.62) | (15.69) | | Short run | | Error correction | -0.10 *** | -0.06 *** | -0.09 *** | | (-7.36) | (-3.99) | (-8.12) | | D.Goods | 0.07 *** | 0.10 *** | 0.08 *** | | (-6.24) | (9.88) | (9.32) | | ∆Goods inflation | | Long run equation: Goods inflation= β.Services inflation + error correction | | L.Services | -0.44 | 0.03 | -0.23 | | | (-0.98) | (0.07) | (-0.74) | | Short run | | Error correction | -0.05 *** | -0.04 *** | -0.05 *** | | (-10.44) | (-5.91) | (-11.08) | | D.Services | 0.31 *** | 0.31 ** | 0.31 *** | | (5.13) | (2.42) | (5.55) | Notes: (1) Figures in parentheses are t-statistics.
* p<0.1, ** p<0.05, ***p<0.01.
(2) L refers to first lag and D refers to first difference of the corresponding variable.
Source: RBI staff estimates. | References: 1. Atkinson, T., V. Wei, and X. Zhou (2022), “U.S. likely didn’t slip into recession in early 2022 despite negative GDP growth”, Federal Reserve Bank of Dallas. 2. European Central Bank (2009), “Why is Services Inflation Higher than Goods Inflation in the Euro Area?”, Monthly Bulletin, January, Box 3. 3. Esteve, V., S. Gil-Pareja, J. A. Martinez-Serrano, and R. Llorca-Vivero (2006), “Threshold Cointegration and Nonlinear Adjustment between Goods and Services inflation in the United States, Economic Modelling, 23, pp. 1033-1039. 4. Peach, R. W., R. Rich, and A. Antoniades (2004), “The Historical and Recent Behaviour of Goods and Services Inflation”, Economic Policy Review, Federal Reserve Bank of New York, Vol. 10, No. 3, pp. 19-31. 5. Pesaran, M. H., Y. Shin, and R. P. Smith (1999), “Pooled Mean Group Estimation of Dynamic Heterogeneous Panels”, Journal of the American Statistical Association, Vol. 94, No. 446, pp. 621-634. | In the US, headline CPI inflation receded from 3.7 per cent in September 2023 to 3.2 per cent in February 2024, primarily due to decline in energy prices which were partially offset by rise in shelter prices. Core CPI inflation also moderated at a tardy pace from 4.1 per cent in September 2023 to 3.8 per cent in February 2024. Inflation in terms of the personal consumption expenditure (PCE) price index – the Fed’s preferred measure of inflation – moderated from 3.4 per cent in September to 2.5 per cent in February (Chart V.4a), while core PCE inflation fell from 3.6 per cent to 2.8 per cent over the same period (Chart V.4b). In the Euro area, CPI inflation eased by 190 bps to 2.4 per cent in March 2024 from 4.3 per cent in September 2023. Core inflation (inflation excluding energy, food, alcohol and tobacco) also moderated by 160 bps over the same period to 2.9 per cent in March, with non-energy industrial goods inflation declining more (from 4.1 per cent in September to 1.1 per cent in March) than services inflation (from 4.7 per cent in September to 4.0 per cent in March). In the UK, CPI headline inflation eased to 3.4 per cent in February 2024 from 6.7 per cent in September 2023, with core inflation declining by 160 bps to 4.5 per cent in February from 6.1 per cent in September. In Japan, CPI inflation (all items less fresh food), the Bank of Japan’s inflation target metric, moderated steadily from 2.9 per cent in October 2023 to 2.0 per cent in January 2024, but reversed sharply to 2.8 per cent in February driven by inflation in prices of culture & recreation, and communication. Core inflation (inflation excluding both fresh food and energy) declined to 3.2 per cent in February from 4.2 per cent in September. Amongst major EMEs, CPI inflation in Brazil softened to 4.5 per cent in February 2024 from 5.2 per cent in September 2023 (Chart V.4c). In Russia, it edged up to 7.7 per cent in February from 6.0 per cent in September, partly due to soaring government spending on defence. In South Africa, CPI inflation has remained volatile within the upper tolerance band of the central bank’s target since September 2023, reaching 5.6 per cent in February 2024. China, on the other hand, has been experiencing deflation (fall in price level, y-o-y) – from the no-inflation point in September 2023 to a deflation of 0.8 per cent in January 2024 – reflecting subdued consumption spending and weak consumer confidence amidst the property sector crisis. In February, however, China exited deflation as inflation rose to 0.7 per cent on robust spending during the Lunar New Year holiday. Like AEs, core inflation in EMEs also remained elevated (Chart V.4d). V.3 Monetary Policy Stance During Q4:2023 and Q1:2024, monetary policy cycles diverged with the growing deviation in growth-inflation dynamics. Most central banks across AEs maintained their policy rates at restrictive levels. On the other hand, major central banks across EMEs either paused or cut their policy rates, as convergence of inflation towards the target on a durable basis appeared to be in sight. The US Fed had started its tightening cycle in March 2022, but paused it in September 2023 and has continued to maintain the target range for the federal funds rate at 5.25-5.50 per cent in all its subsequent meetings (Chart V.5a). As per the Summary of Economic Projections released in March 2024, the majority of Federal Open Markets Committee (FOMC) participants expected the federal funds rate to be in the range of 4.50-4.75 per cent by end-2024, indicating a rate cut of 75 bps in 2024. The FOMC members, however, agreed that it would not be appropriate to reduce the target range until they gained greater confidence that inflation is moving sustainably towards the 2 per cent target. The US Fed also continued with its balance sheet reduction policy. The ECB also kept its three key interest rates unchanged in each of its October and December 2023, and January and March 2024 policy meetings. It indicated that it would continue to follow a data-dependent approach to determine the appropriate level and duration of restriction and to maintain the policy rates at sufficiently restrictive levels for as long as necessary. Besides, the Asset Purchase Programme (APP) portfolio continues to decline as principal payments from maturing securities are no longer reinvested. It, however, intends to continue to reinvest, in full, the principal payments from maturing securities purchased under the Pandemic Emergency Purchase Programme (PEPP) during the first half of 2024 and to reduce the PEPP portfolio by €7.5 billion per month on average in H2:2024 before discontinuing reinvestments at the end of 2024. The ECB announced changes in operational framework for implementing monetary policy on March 13, 2024 that sets out how Governing Council would steer short-term money market rates in line with its monetary policy decisions as Eurosystem normalises its balance sheet6. After pausing its rate hike cycle in September 2023, the Bank of England (BoE) maintained its policy rate at 5.25 per cent in all its subsequent policy meetings in November and December 2023 and February and March 2024 and judged that monetary policy will need to remain restrictive for sufficiently long to return inflation to the target. 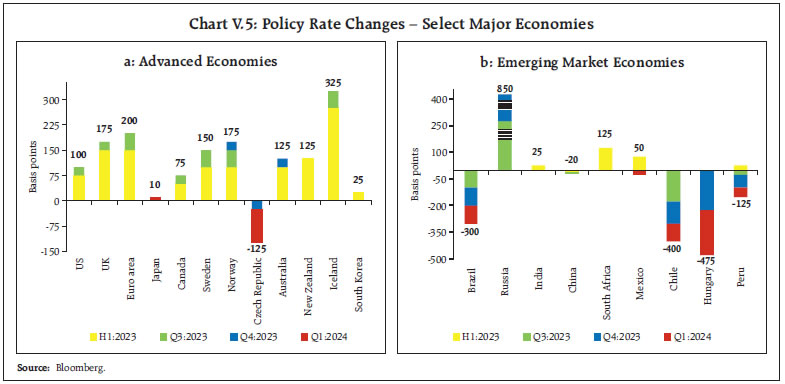 Amongst other major AEs, the Bank of Canada, the Sveriges Riksbank, the Reserve Bank of New Zealand, the Bank of Korea and the Central Bank of Iceland maintained status quo in all their meetings during Q4:2023 and Q1:2024. After keeping its policy rate unchanged since July 2023, the Reserve Bank of Australia raised the cash rate by 25 bps in November and maintained status quo in its subsequent meetings of December 2023 and February and March 2024. Similarly, the Norges Bank paused its rate hike in November 2023, but raised its policy rate by 25 bps in December 2023 before pausing again in its January and March 2024 meetings. The Czech National Bank, which had maintained a pause since August 2022, embarked on monetary easing cycle by cutting its key rate by 25 bps in December 2023 and 50 bps each in February and March 2024 policy meetings. The Swiss National Bank also began its easing cycle with a 25 bps rate cut in its March meeting. At the same time, the Bank of Japan (BoJ) maintained an accommodative stance with the overnight interest rate on hold at minus 0.1 per cent till late-March 2024. In its October 2023 meeting, the BoJ increased flexibility in the conduct of yield curve control (YCC) with the upper bound of 1.0 per cent for the yields as reference vis-a-vis 0.5 per cent earlier. In its March 2024 meeting, however, the BoJ became the last central bank to exit the negative rate as it switched from interest rate of (-) 0.1 per cent on Policy Rate Balances to encouraging the uncollateralized overnight call rate to remain at around 0 to 0.1 per cent. It also abandoned the policy of Quantitative and Qualitative Easing (QQE) with YCC7. In the BRICS, the Banco Central do Brasil cut the Selic rate in November and December 2023 and January and March 2024 by 50 bps each after it had embarked on an easing cycle in August 2023. The South African Reserve Bank and the People’s Bank of China (PBoC) kept their policy rates unchanged in all their meetings held in Q4:2023 and Q1:2024. The PBoC, however, continued its accommodative stance by lowering the reserve requirement ratio by 50 bps in February 2024, to provide a liquidity boost to the financial system. It also lowered its benchmark five-year loan prime rate by 25 bps, the largest cut since it was introduced in 2019, to boost real estate demand. The Bank of Russia (BoR) continued its tightening cycle that started in July 2023 by increasing the policy rate by 200 bps and 100 bps in October and December 2023 meetings, respectively, prompted by inflationary pressures and a depreciating rouble. It, however, kept the policy rate unchanged at 16.0 per cent in its February and March 2024 meetings (Chart V.5b). Among Asian EMEs, the Bank of Thailand kept the benchmark rate unchanged in its November 2023 and February 2024 meetings. The Bank Indonesia raised its key rate in October 2023 by 25 bps before maintaining a pause in all its subsequent meetings. In Latin America, the central bank of Mexico held its policy rate unchanged in all meetings since May 2023, before embarking on a policy easing cycle in March 2024 with a 25 bps rate cut. After keeping the key rate unchanged since June 2023, the central bank of Colombia commenced a monetary policy easing cycle by cutting its benchmark rate by 25 bps each in December 2023 and January 2024 and 50 bps in March. Chile lowered its policy rate by 225 bps to 7.25 per cent during October 2023 - February 2024. Peru cut its policy rate by 25 bps each in all the 6 meetings held during October 2023 - February 2024, before maintaining a pause in its March meeting. Among European EMEs, Hungary switched gears by commencing an easing cycle in October 2023, reducing the policy rate by 75 bps in each of the meetings held in October, November and December 2023 and January 2024, followed by a rate cut of 100 bps in February and 75 bps in March. Poland cut its policy rate by 25 bps in October 2023 and kept it on hold in all its subsequent meetings. The central bank of Turkey, on the other hand, raised its policy rate by 1500 bps cumulatively between October 2023 and January 2024 on the top of 2150 bps hike during June-September 2023 before holding it unchanged at 45.0 per cent in its February 2024 policy as it fights elevated and rising inflation and a weakening currency. It, however, increased its policy rate again by 500 bps in March meeting citing the continuing need to counter climbing inflation (68.5 per cent in March 2024 from 61.5 per cent in September 2023). V.4 Global Financial Markets Global financial markets witnessed large swings in Q4:2023 and Q1:2024 in response to fluctuating perceptions on monetary policy trajectories, stickiness of inflation and strength of economic activity. Global equity markets corrected in October over anticipation of ‘higher for longer’ monetary policy stances but rallied afterwards as a few systemic central banks signalled interest rate cuts in the near future. Overall, bond yields have moderated since the last MPR. The US dollar pared gains in Q4:2023 but strengthened later in Q1:2024. The EME currencies broadly strengthened since last MPR. In terms of MSCI world index, equity markets gained 19.3 per cent since end-September, reflecting gains in both AEs and EMEs (Chart V.6a). Among AEs, the US S&P 500 shed gains in October over ‘higher for longer’ monetary policy stances and tardy pace of disinflation. It, however, gained starting November as the Fed signalled a possible end of its rate hiking cycle and rate cuts in 2024. Overall, the US S&P 500 index rose by 22.5 per cent during October 2023 and March 2024. European stock markets tracked the US markets, paring gains in October and rallying afterwards with intermittent episodes of volatility as inflation slowed down and the euro area narrowly missed recession. The UK’s stock indices gained by 1.6 per cent in Q4:2023 and by 2.8 per cent in Q1:2024 over a sharp drop in consumer prices though the indices exhibited volatility, especially in Q1, over GDP concerns. The Japanese market outperformed its peers on continuation of ultra-accommodative monetary policy by the BoJ. Tracking global cues in Q4:2023, EME equities, barring China and Russia, gained as they reaped benefits of an early commencement of the tightening cycle leading to lower inflation prints (Chart V.6b). Chinese stocks crashed due to its flagging real estate sector, high unemployment and deflation. It has, however, exhibited signs of recovery since early February 2024 as a wide range of support measures eased bearish sentiment and capital inflows in to equity markets resumed. Overall, in Q1:2024, EME equities soared, barring those of Brazil and South Africa. Sovereign bond yields softened across major AEs in Q4:2023 as systemic central banks signalled the end of tightening cycles and a possible reversal. Yields hardened in Q1:2024 as the likelihood of early rate cuts receded due to the sluggish pace of disinflation. The US 10-year treasury yield shot up to a 16-year high in October, reaching the peaks last touched in 2007 due to a surge in Treasury debt issuance and hawkish commentary by the Fed chair. Subsequently, the yields fell precipitously in Q4:2023 on expectations of a rate cut in the early months of 2024 and announcement of a slower pace of long dated issuance. The yields hardened again in Q1:2024 as labour market exhibited strength and market participants priced in expectations of delayed rate cuts (Chart V.7a). The UK 10-year Gilt yield and German 10-year bond yield broadly tracked the US market. The 10-year Japanese Government bond yield hardened throughout October to reach close to 1 per cent as the BoJ incorporated flexibility in the conduct of YCC. The yields fell subsequently in Q4:2023 as BoJ decided to maintain its ultra-loose monetary policy. Yields, however, registered an uptick again in Q1:2024 as the BoJ indicated an exit from its easing measures but softened after the BoJ committed to continue its JGB purchases with broadly the same amount as before the end of YCC. Taking on global cues, bond yields in several EMEs exhibited a hardening bias in October, followed by softening for the rest of Q4:2023 as EMEs pivoted towards maintaining key rates in some cases. Yields remained volatile in Q1:2024 with a hardening bias (Chart V.7b). Bond yields in China, however, treaded down over accommodative monetary policy actions of the PBoC. 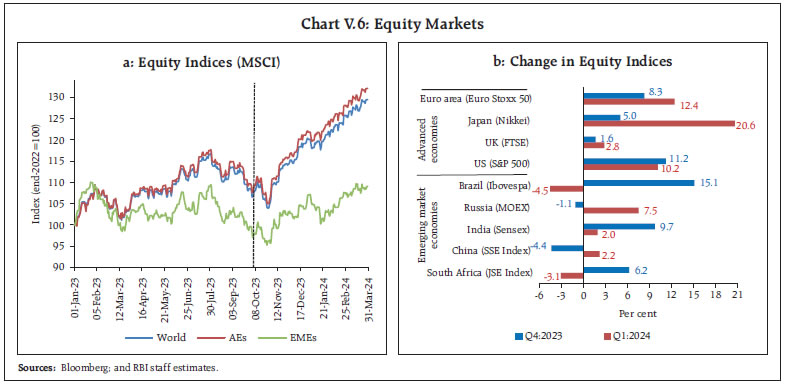 In the currency markets, the US dollar weakened in Q4:2023 over optimism about easing US monetary policy. Tight labour market conditions, sticky inflation, and resilient economic growth, however, led market participants to reprice a lower probability of policy cycle reversal by the Fed, thus strengthening the dollar in Q1:2024 (Chart V.8a). The US dollar’s movement was mirrored in the EME currencies, exacerbated by swings in capital flows (Chart V.8b). The MSCI Emerging Market Currency Index gained 4.3 per cent in Q4:2023 but fell by 0.9 per cent in Q1:2024. V.5 Conclusion Global growth remained resilient, supported by public and private spending and robust labour market conditions. Going forward, the chances of hard landing have receded and risks to the outlook are in balance. While continuation of geopolitical tensions, elevated public debt amidst tight financial conditions, weak recovery in China, geoeconomic fragmentation and extreme weather events pose downside risks to the outlook, faster disinflation and slower withdrawal of fiscal stimulus may provide upsides. Changing perceptions on the monetary policy trajectory and persistence of geopolitical conflicts are imparting volatility to global financial markets. Growth prospects in EMEs remain bright though weak global demand, impediments to global trade, volatile capital flows, elevated debt levels, extreme weather events and tight financial conditions pose downside risks to their outlook. While inflation has eased across countries with restrictive policies and easing of supply shocks, it still rules above targets, especially in advanced economies, and the last mile of disinflation is likely to be gradual. Central banks will need to modulate their monetary policies cautiously to support the descent of inflation to the target while supporting the nascent growth recovery. 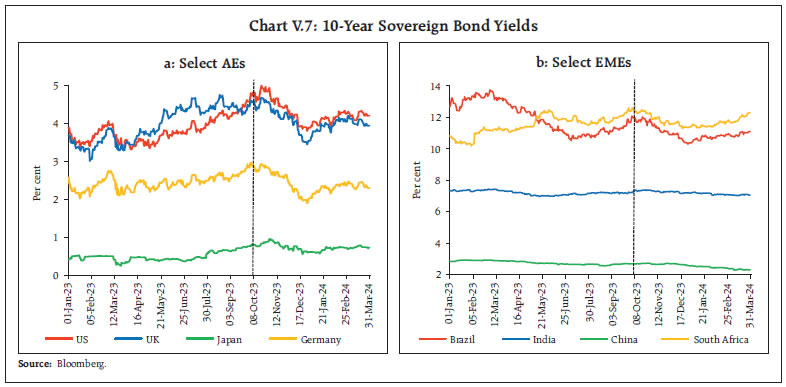
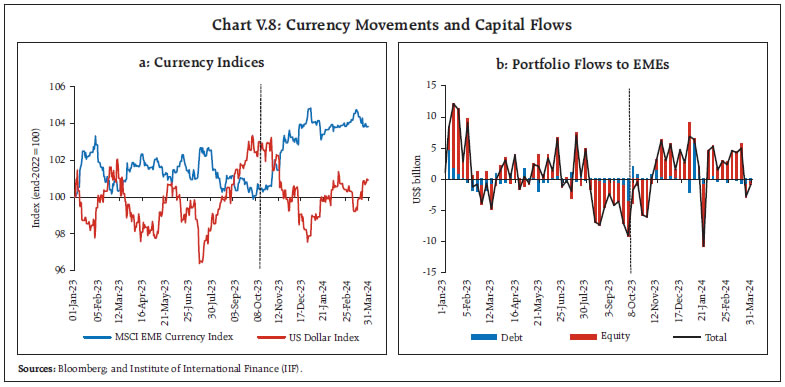 _________________________________________________________________________________
ABBREVIATIONS | AEs | Advanced Economies | | APP | Asset Purchase Programme | | ASEAN | Association of Southeast Asian Nations | | ASISO | Automated Sweep-in and Sweep-out | | ATF | Aviation Turbine Fuel | | ATM | At the money | | BE | Budget Estimates | | BIES | Business Inflation Expectations Survey | | BoE | Bank of England | | BoJ | Bank of Japan | | BoR | Bank of Russia | | bps | Basis Points | | BRICS | Brazil, Russia, India, China and South Africa | | BSE | Bombay Stock Exchange | | CACP | Commission for Agricultural Costs and Prices | | CAD | Current Account Deficit | | CAG | Comptroller and Auditor General | | CASA | Current Account and Savings Account | | CCIL | Clearing Corporation of India Limited | | CDs | Certificates of Deposit | | CDS | Credit Default Swap | | CEA | Central Electricity Authority | | CGA | Controller General of Accounts | | CI | Confidence Interval | | CiC | Currency in Circulation | | CII | Confederation of Indian Industry | | CLI | Composite Leading Indicator | | CMIE | Centre for Monitoring Indian Economy | | COVID-19 | Coronavirus Disease 2019 | | CP | Commercial Paper | | CPB | Central Planning Bureau | | CPI | Consumer Price Index | | CPI-AL | Consumer Price Index for Agricultural Labourers | | CPI-IW | Consumer Price Index for Industrial Workers | | CPI-RL | Consumer Price Index for Rural Labourers | | CRR | Cash Reserve Ratio | | CU | Capacity Utilisation | | DCA | Department of Consumer Affairs | | DFR | Deposit Facility Rate | | DGCA | Directorate General of Civil Aviation | | DGCI&S | Directorate General of Commercial Intelligence and Statistics | | DI | Diffusion Index | | DII | Domestic Institutional Investor | | EBIT | Earnings Before Interest and Taxes | | EBLR | External Benchmark Lending Rate | | ECB | External Commercial Borrowing | | ECB | European Central Bank | | ECI | Eight Core Industries | | EIA | Energy Information Administration | | EMDEs | Emerging Market and Developing Economies | | EMEs | Emerging Market Economies | | EPFO | Employees' Provident Fund Organisation | | ER | Employment Rate | | ETFs | Exchange-traded Funds | | EWEs | Extreme Weather Events | | FAE | First Advance Estimates | | FAO | Food and Agriculture Organization | | FBIL | Financial Benchmarks India Pvt. Ltd | | FCI | Food Corporation of India | | FDI | Foreign Direct Investment | | FE | Final Estimates | | Fed | Federal Reserve | | FICCI | Federation of Indian Chambers of Commerce and Industry | | FIMMDA | Fixed Income Money Market and Derivatives Association of India | | FI | Financial Institution | | FOMC | Federal Open Market Committee | | FPI | Foreign Portfolio Investment/Investor | | FPO | Follow on Public Offer | | FRE | First Revised Estimate | | FRRR | Fixed Rate Reverse Repo | | F-TRAC | FIMMDA Trade Reporting and Confirmation System | | FTSE | Financial Times Stock Exchange | | GDP | Gross Domestic Product | | GFCE | Government Final Consumption Expenditure | | GFCF | Gross Fixed Capital Formation | | GFD | Gross Fiscal Deficit | | GNDI | Gross National Disposable Income | | GoI | Government of India | | G-Secs | Government Securities | | GST | Goods and Services Tax | | GVA | Gross Value Added | | H1 | First Half of the Financial Year (April-September) | | H2 | Second Half of the Financial Year (October-March) | | HFI | High Frequency Indicator | | HSD | High-Speed Diesel | | ICICI | Industrial Credit and Investment Corporation of India (Bank) | | ICR | Interest Coverage Ratio | | I-CRR | Incremental Cash Reserve Ratio | | IIF | Institute of International Finance | | IIP | Index of Industrial Production | | IMD | India Meteorological Department | | IMF | International Monetary Fund | | INR | Indian Rupee | | IOCL | Indian Oil Corporation Limited | | IPO | Initial Public Offering | | IRDAI | Insurance Regulatory and Development Authority | | IRF | Impulse Response Function | | IRFCL | International Reserves and Foreign Currency Liquidity | | IT | Information Technology | | JGB | Japanese Government Bond | | J-REITs | Japan Real Estate Investment Trusts | | JSE | Johannesburg Stock Exchange | | LAF | Liquidity Adjustment Facility | | LCR | Liquidity Coverage Ratio | | LFPR | Labour Force Participation Rate | | LMV | Light Motor Vehicle | | LPG | Liquefied Petroleum Gas | | LTRO | Long Term Repo Operation | | MCLR | Marginal Cost of Funds Based Lending Rate | | MEP | Minimum Export Prices | | MFs | Mutual Funds | | MGNREGA | Mahatma Gandhi National Rural Employment Guarantee Act | | MMO | Money Market Operations | | MMRP | Modified Mixed Reference Period | | MOEX | Moscow Exchange | | MoC&F | Ministry of Chemicals and Fertilisers | | M-o-M | Month-on-Month | | MOSPI | Ministry of Statistics and Programme Implementation | | MPR | Monetary Policy Report | | MRO | Main Refinancing Operations | | MSCI | Morgan Stanley Capital International | | MSF | Marginal Standing Facility | | MSME | Micro, Small and Medium Enterprises | | MSP | Minimum Support Price | | NBFCs | Non-Banking Financial Companies | | NCAER | National Council of Applied Economic Research | | NDS | Negotiated Dealing System | | NDS-OM | Negotiated Dealing System-Order Matching | | NDTL | Net Demand and Time Liabilities | | NEER | Nominal Effective Exchange Rate | | NGFS | Network for Greening the Financial System | | NiGEM | National Institute Global Econometric Model | | NIM | Net Interest Margin | | NPA | Non-Performing Asset | | NSC | National Savings Certificate | | NSDL | National Securities Depository Limited | | NSO | National Statistical Office | | NSSO | National Sample Survey Office | | OBICUS | Order Books, Inventories and Capacity Utilisation Survey | | OECD | Organisation for Economic Co-operation and Development | | OMO | Open Market Operation | | OMSS | Open Market Sale Scheme | | OPEC | Organization of the Petroleum Exporting Countries | | OTC | Over-the-Counter | | PA | Provisional Accounts | | PADO | Public Administration, Defence and Other services | | PBoC | People’s Bank of China | | PCE | Personal Consumption Expenditure | | PDs | Primary Dealers | | PE | Provisional Estimates | | PEPP | Pandemic Emergency Purchase Programme | | PFCE | Private Final Consumption Expenditure | | PL | Personal Loan | | PLFS | Periodic Labour Force Survey | | PLI | Production Linked Incentive | | PMG | Pooled Mean Group | | PMI | Purchasing Managers’ Index | | POL | Petroleum, Oil and Lubricants | | POSOCO | Power System Operation Corporation Limited | | PPAC | Petroleum Planning and Analysis Cell | | PSB | Public Sector Bank | | PSU | Public Sector Undertaking | | PVB | Private Sector Bank | | Q1 | First Quarter | | Q2 | Second Quarter | | Q3 | Third Quarter | | Q4 | Fourth Quarter | | QIP | Qualified Institutional Placement | | q-o-q | Quarter-on-Quarter | | QQE | Quantitative and Qualitative Easing | | RBI | Reserve Bank of India | | RE | Revised Estimates | | RECO | Revenue Expenditure to Capital Outlay | | REER | Real Effective Exchange Rate | | RHS | Right Hand Side | | RL | Rural Labourers | | RM | Reserve money | | S&P | Standard and Poor | | SAAR | Seasonally Adjusted Annualised Rate | | SAE | Second Advance estimate | | SCB | Scheduled Commercial Bank | | SDF | Standing Deposit Facility | | SEBI | Securities and Exchange Board of India | | SGS | State Government Securities | | SIAM | Society of Indian Automobile Manufacturers | | SIC | Schwarz Information Criterion | | SIP | Systematic Investment Plan | | SLF | Standing Liquidity Facility | | SLR | Statutory Liquidity Ratio | | SPD | Standalone Primary Dealers | | SSE | Shanghai Stock Exchange | | SSI | Small Savings Instruments | | STU | Stocks-to-Use | | SVAR | Structural Vector Auto Regression | | TBs/T-Bill | Treasury Bills | | TOP | Tomato, Onion and Potato | | TMA | Tractor Manufacturers Association | | TREPS | Tri-party Repo | | TRQ | Tariff Rate Quota | | UK | United Kingdom | | US | United States | | US$ | US Dollar | | USA | United States of America | | UT | Union Territory | | VAR | Vector Auto Regression | | VAT | Value Added Tax | | VECM | Vector Error Correction Model | | VRR | Variable Rate Repo | | VRRR | Variable Rate Reverse Repo | | WAC | Weighted Average Coupon | | WACMR | Weighted Average Call Money Rate | | WADR | Weighted Average Discount Rate | | WADTDR | Weighted Average Domestic Term Deposit Rate | | WALR | Weighted Average Lending Rate | | WAM | Weighted Average Maturity | | WAY | Weighted Average Yield | | WEO | World Economic Outlook | | WMA | Ways and Means Advances | | WPI | Wholesale Price Index | | WTI | West Texas Intermediate | | WTO | World Trade Organization | | YCC | Yield Curve Control | | Y-o-Y | Year-on-Year | |