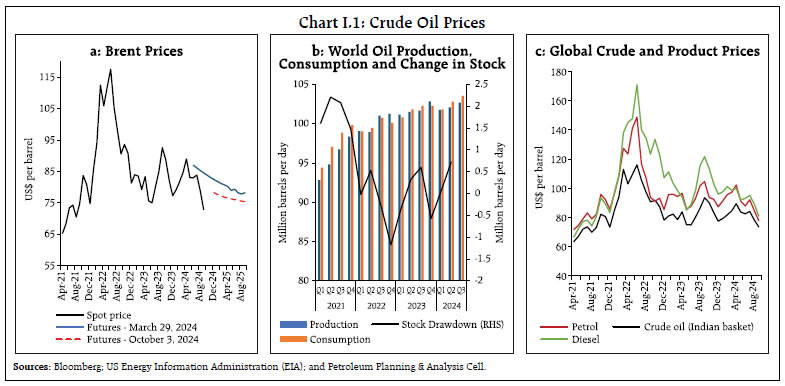
| I. Macroeconomic Outlook The outlook for domestic economic activity remains resilient buoyed by strong consumption and investment activities. Geopolitical conflicts, uncertain global outlook, volatile global financial markets amidst changing perceptions on monetary policy trajectories, and climate shocks are the key risks to the outlook. Monetary policy remains steadfast on aligning inflation with the target on a durable basis, setting strong foundations for a sustained period of high growth. I.1 Key Developments since the April 2024 MPR Since the release of the April 2024 Monetary Policy Report (MPR), global economic activity has shown resilience in the face of continuing geopolitical tensions and intermittent financial market volatility. Disinflation in headline inflation has been slow due to stubborn services inflation which is keeping core inflation (i.e., CPI inflation excluding food & fuel) elevated, relative to the headline. Several central banks have started easing monetary policy while others have maintained a restrictive stance, leading to divergence in policy pathways. Financial markets have been on edge, with incoming data shifting expectations about the direction of monetary policy. Sovereign bond yields have trended downwards on anticipation of policy pivots. Global equity markets have exhibited resilience, recovering quickly and regaining risk-taking appetite in spite of stretched valuations and still high leverage. Capital flows to emerging market economies (EMEs) have resumed albeit amidst heightened volatility. The US dollar index peaked in mid-June and receded thereafter on signs of cooling labour market conditions and easing inflation. Supply chain pressures have inched up since May driven by conflicts in the Middle East. Global commodity prices declined on the back of softening prices of base metals, agricultural products, and energy, however, price pressures have increased recently amidst heightened geopolitical tensions. Brent crude oil prices, that were hovering around US dollar (US$) 90 per barrel in April 2024, have since declined – even dipping below US$ 70 briefly – due to slowdown in demand and the Organization of the Petroleum Exporting Countries (OPEC) plus’ intent to gradually restore supplies. Of late, the US dollar index, sovereign bond yields and crude oil prices have inched up. International prices of most agricultural commodities have risen due to increase in prices of vegetable oil, dairy and meat. Turning to the domestic economy, real gross domestic product (GDP) grew by 6.7 per cent in Q1:2024-25 as per the National Statistical Office (NSO). Private consumption expenditure registered a growth of 7.4 per cent, contributing 63 per cent to overall GDP growth. Consumption spending has been robust in Q1:2024-25, supported by rural demand which is expected to improve further on the back of favourable monsoon, higher sowing activity and moderating inflation. Investment activity also maintained its momentum in Q1, supported by high capacity utilisation, continued buoyancy in steel consumption and capital goods imports. On the supply side, real gross value added (GVA) expanded by 6.8 per cent in Q1, with industry and services sectors being the key drivers. Headline consumer price index (CPI) inflation moderated to 4.4 per cent in April-August 2024 from 5.2 per cent in H2:2023-24. Base effects continue to have an outsized role in monthly inflation prints. Consequently, the moderation in headline inflation has been uneven. Core inflation was on a steadily declining path–in May 2024, it fell to its lowest level of 3.1 per cent in the current series (since January 2012) before increasing in July-August. Food price inflation, on the other hand, remained elevated, averaging 6.9 per cent over the last five months (April-August 2024), and contributing 72.5 per cent of headline inflation during the period. Recognising the risks from volatile and elevated food prices and its likely adverse impact on inflation expectations and spillovers to core inflation, the Monetary Policy Committee (MPC) kept the policy repo rate unchanged at 6.5 per cent through H1 and remained resolute in its commitment to aligning inflation with the target, while supporting growth. Monetary Policy Committee Meetings: April 2024 - September 2024 When the MPC met in April 2024, global economy was showing resilience and inflation was trending down. Financial markets were responding to the timing and pace of monetary policy trajectories, with heightened uncertainty pushing up gold prices on safe haven demand. The domestic economic momentum appeared strong, supported by healthy bank and corporate sector balance sheets and upbeat business and consumer sentiments. Hence, the real GDP growth projection for 2024-25 was retained at 7 per cent. CPI headline inflation had softened in January-February 2024 from its December high although food inflation edged up. The MPC noted the uncertainties around the inflation trajectory stemming from weather-driven food price shocks, cost push pressures, firming crude oil prices due to geopolitical tensions and volatility in financial markets, and retained the projection of CPI inflation for 2024-25 at 4.5 per cent. The MPC observed that food price pressures have been interrupting the ongoing disinflation process, posing challenges for the final descent of inflation to the target. Considering that the path of disinflation has to be sustained till inflation reaches the 4 per cent target on a durable basis, MPC also decided, by a 5-1 majority, to keep the policy repo rate unchanged at 6.5 per cent. The MPC decided by a majority of 5-1 to remain focused on withdrawal of accommodation so as to ensure that inflation progressively aligns with the target, while supporting growth. At the time of June 2024 meeting, global growth was sustaining momentum. Central banks remained steadfast and data-dependent in their fight against inflation, acknowledging that the final leg of disinflation might be tough. High frequency indicators for domestic economic activity showed resilience, with expectations of above normal monsoon brightening the prospects of agriculture sector and rural demand. Investment demand in the private sector was buoyed by high capacity utilisation and healthy balance sheet of banks and corporates while improving world trade was expected to support external demand. The projection of real GDP growth for 2024-25 was revised upwards by 20 basis points from the previous meeting to 7.2 per cent. In India, headline CPI inflation moderated for three successive months to 4.8 per cent in April 2024. Food inflation was persistently high while core inflation had fallen to historic lows. Nevertheless, the future inflation trajectory remained uncertain due to supply shocks, input cost pressures and crude oil price volatility. The projection of CPI inflation for 2024-25 was retained at 4.5 per cent. The MPC noted that while the growth-inflation balance had moved favourably since its previous meeting, risks to inflation remain from recurring food price shocks and monetary policy has to stay watchful of the spillovers of food price pressures to core inflation and inflation expectations. Accordingly, the MPC decided by a majority of 4-2 to keep the policy rate unchanged at 6.5 per cent. The MPC voted with a 4-2 majority to continue with the stance of withdrawal of accommodation. In the run up to August 2024 meeting, headline inflation, after remaining steady at 4.8 per cent during April and May 2024, increased to 5.1 per cent in June 2024, primarily driven by the food component even though fuel prices remained in deflation and core inflation touched new lows. Assuming a normal monsoon, CPI inflation projection for 2024-25 was retained at 4.5 per cent. Domestic economic activity was strengthening, with the pick-up in southwest monsoon rainfall and improved spatial spread translating into higher kharif sowing. Other high frequency indicators suggested expansion in services activity. A revival in private consumption has been underway with rural demand catching up with urban consumption. The pickup in investment activity gathered strength as reflected by expansion in steel consumption, high capacity utilisation and the government’s thrust on infra-spending. The projection of real GDP growth for 2024-25 was retained at 7.2 per cent. The MPC observed that risks from volatile and elevated food prices remain high, which may adversely impact inflation expectations and result in spillovers to core inflation. Accordingly, the MPC decided by a majority of 4-2 to keep the policy repo rate unchanged at 6.5 per cent while retaining the stance of withdrawal of accommodation. The MPC’s voting pattern reflects the diversity in individual members’ assessments, expectations and policy preferences - a characteristic also reflected in voting patterns of other central banks (Table I.1). With the emerging view that the disinflation process is in its final leg, a larger number of central banks have begun an easing cycle while others have retained policy rates at restrictive levels. EME central banks that began policy rate easing have undertaken larger cuts since April 2024 while two major advanced economies (AEs) the US and the United Kingdom - have begun their policy pivot in the second half of 2024. | Table I.1 Monetary Policy Committees and Policy Rate Voting Patterns | | Country | Policy Meetings: April 2024 - September 2024 | | Total meetings | Meetings with full consensus | Meetings without full consensus | Variation in policy rate (basis points) | | Brazil | 4 | 3 | 1 | 0 | | Chile | 5 | 4 | 1 | -175 | | Colombia | 4 | 0 | 4 | -200 | | Czech Republic | 4 | 2 | 2 | -150 | | Hungary | 5 | 5 | 0 | -150 | | India | 3 | 0 | 3 | 0 | | Japan | 4 | 3 | 1 | 15 | | South Africa | 3 | 2 | 1 | -25 | | Sweden | 4 | 4 | 0 | -75 | | Thailand | 3 | 0 | 3 | 0 | | UK | 4 | 0 | 4 | -25 | | US | 4 | 3 | 1 | -50 | | Sources: Central bank websites. | Macroeconomic Outlook Chapters II and III analyse macroeconomic developments relating to inflation and economic activity during H1:2024-25 (April-September 2024). Turning to the baseline assumptions, international crude prices exhibited sizeable two-way movements in H1, receding from their five-month peak of US$ dollar (US$) 91 per barrel in early April 2024 to US$ 77 per barrel by early June 2024 on slowing demand in Organization for Economic Cooperation and Development (OECD) countries and easing supply conditions. In September 2024, they were settling around US$ 71-78 per barrel. While global growth uncertainties on the demand side and geopolitical tensions on the supply side impart significant volatility to the outlook (Charts I.1a and I.1b), easing global demand-supply refinery divergences have reduced the wedge between global petroleum product prices and crude prices (Chart I.1c). Considering these factors, crude prices (Indian basket) are assumed at US$ 80 per barrel in the baseline as compared with US$ 85 in the April 2024 MPR (Table I.2). | Table I.2: Baseline Assumptions for Projections | | Indicator | MPR April 2024 | MPR October 2024 | | Crude Oil (Indian basket) | US$ 85 per barrel during 2024-25 | US$ 80 per barrel during H2:2024-25 | | Exchange rate | ₹ 83/US$ during 2024-25 | ₹ 83.5/US$ during H2:2024-25 | | Monsoon | Normal for 2024-25 | Normal for 2025-26 | | Global growth | 3.1 per cent in 2024
3.2 per cent in 2025 | 3.2 per cent in 2024
3.3 per cent in 2025 | | Fiscal deficit (per cent of GDP) | To remain within BE 2024-25
Centre: 5.1
Combined: 7.7 | To remain within BE 2024-25
Centre: 4.9
Combined: 7.3 | | Domestic macroeconomic/structural policies during the forecast period | No major change | No major change | Notes: 1. The Indian basket of crude oil represents a derived numeraire comprising sour grade (Oman and Dubai average) and sweet grade (Brent) crude oil.
2. The exchange rate path assumed here is for the purpose of generating the baseline projections and does not indicate any ‘view’ on the level of the exchange rate. The Reserve Bank is guided by the objective of containing excess volatility in the foreign exchange market and not by any specific level of and/or band around the exchange rate.
3. BE: Budget estimates.
4. Combined fiscal deficit refers to that of the Centre and States taken together.
Sources: RBI estimates; Budget documents; and International Monetary Fund (IMF). |
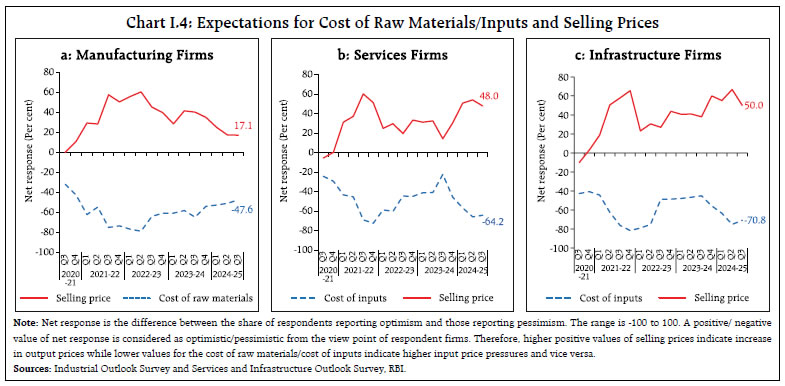
 Second, the nominal exchange rate of the Indian rupee (₹) saw two-way movements in the range of ₹83-84 per US$ in H1, with a depreciating bias since July 2024. Taking into consideration the uncertainty around US dollar movements, the ebbs and flows of global capital flows and international crude oil prices, the exchange rate is assumed at INR 83.5 per US dollar in the baseline as against INR 83 in the April 2024 MPR. Third, repeated geopolitical tensions, rekindled fears of a potential recession in key economies and financial market volatility in response to monetary policy divergence weigh heavily on global growth prospects. The global composite purchasing managers' index (PMI) has exhibited moderation since May 2024 with PMI manufacturing in contraction zone since July 2024. The IMF retained the global growth estimate for 2024 at 3.2 per cent and revised upwards its growth forecast for 2025 to 3.3 per cent in its July World Economic Outlook (WEO) compared with April 2024 update. With modest recovery on the global front, the projection for global growth in 2024 and 2025 is still below the historical annual average1 of 3.8 per cent. Inflation is projected to fall from 5.9 per cent in 2024 to 4.4 per cent in 2025. The pace of decline in inflation to targets, however, is likely to be faster in AEs vis-à-vis EMEs (Chart I.2). Global trade growth is estimated to rebound to 3.1 per cent in 2024 from 0.8 per cent in 2023, notwithstanding the surge in cross-border trade restrictions that pose risks to the global trade outlook. 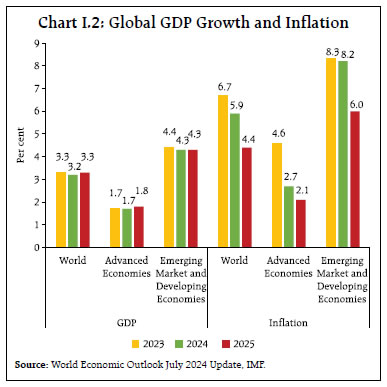 I.2 The Outlook for Inflation In H1:2024-25 (up to August), headline inflation remained within the tolerance band while food inflation remained elevated and persistent (Chapter II). In the September 2024 round of the Reserve Bank’s survey2, the three months and one year ahead median inflation expectations of urban households reduced by 20 and 10 bps to 9.2 per cent and 10.0 per cent, respectively, vis-à-vis the previous round. The proportion of respondents expecting the general price level to increase by more than the current rate declined for both horizons vis-à-vis the previous round (Chart I.3). Manufacturing firms polled in the July - September 2024 round of the Reserve Bank’s industrial outlook survey expect pressures from cost of raw materials to continue, with some softening and selling price growth momentum to continue in Q3:2024-25 (Chart I.4a).3 Services sector companies and infrastructure firms expect input cost pressures to persist and selling prices growth to moderate in Q3:2024-25 (Charts I.4b and I.4c).4 In the PMI surveys for September 2024, input price indices of both manufacturing and services firms increased vis-à-vis the previous month while output prices decreased for both firms. 
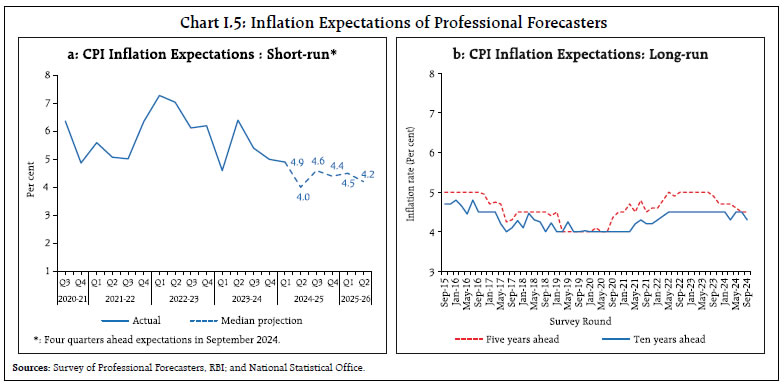 Professional forecasters surveyed by the Reserve Bank in September 2024 expect headline CPI inflation to increase from 4.0 per cent in Q2:2024-25 to 4.6 per cent in Q3, 4.4 per cent in Q4 and 4.2-4.5 per cent in H1:2025-26 (Chart I.5a and Table I.3).5 Core inflation (i.e., CPI excluding food and beverages, pan, tobacco and intoxicants, and fuel and light) is expected to successively increase from 3.5 per cent in Q2:2024-25 to 3.9 per cent in Q3 and is expected to remain between 4.2-4.3 per cent in the next three quarters.In the September 2024 round, their 5-year ahead expected inflation remained unchanged at 4.5 per cent, while their 10-year ahead expectations moderated to 4.3 per cent as compared to 4.5 per cent in the previous round (Chart I.5b). Looking ahead, evolving food inflation dynamics will impinge upon the outlook for inflation. The above normal south-west monsoon rainfall, significantly higher reservoir levels as compared to decadal average and higher kharif sowing vis-a-vis last year bode well for the inflation outlook. Nevertheless, rising global supply chain pressures, adverse weather events, volatile food prices and continuing geopolitical strife remain key risks. Taking into account the initial conditions, signals from forward-looking surveys and estimates from time-series and structural models6, CPI inflation is projected to average 4.5 per cent in 2024-25 – 4.1 per cent in Q2, 4.8 per cent in Q3 and 4.2 per cent in Q4, with risks evenly balanced (Chart I.6). The 50 per cent and the 70 per cent confidence intervals for headline inflation in Q4:2024-25 are 3.2-5.2 per cent and 2.6-5.8 per cent, respectively. For 2025-26, assuming a normal monsoon, and no further exogenous or policy shocks, structural model estimates indicate that inflation will average 4.1 per cent with 4.3 per cent in Q1, 3.7 per cent in Q2, 4.2 per cent in Q3 and 4.1 per cent in Q4. The 50 per cent and the 70 per cent confidence intervals for headline inflation in Q4:2025-26 are 2.8-5.4 per cent and 2.1-6.1 per cent, respectively. | Table I.3: Projections - Reserve Bank and Professional Forecasters | | (Per cent) | | | 2024-25 | 2025-26 | | Reserve Bank’s Baseline Projections | | | | Inflation, Q4 (y-o-y) | 4.2 | 4.1 | | Real GDP growth | 7.2 | 7.1 | | Median Projections of Professional Forecasters | | | | Inflation, Q4 (y-o-y) | 4.4 | - | | Real GDP growth | 6.9 | 6.7 | | Gross domestic saving (per cent of GNDI) | 30.0 | 30.3 | | Gross capital formation (per cent of GDP) | 33.5 | 33.5 | | Credit growth of scheduled commercial banks | 13.5 | 13.0 | | Combined gross fiscal deficit (per cent of GDP) | 7.9 | 7.4 | | Central government gross fiscal deficit (per cent of GDP) | 4.9 | 4.5 | | Repo rate (end-period) | 6.25 | - | | Yield on 91-days treasury bills (end-period) | 6.4 | 6.2 | | Yield on 10-year central government securities (end-period) | 6.6 | 6.5 | | Overall balance of payments (US$ billion) | 48.8 | 37.1 | | Merchandise exports growth | 3.4 | 5.5 | | Merchandise imports growth | 4.6 | 5.9 | | Current account balance (per cent of GDP) | -1.0 | -1.0 | Note: GNDI: Gross National Disposable Income.
Sources: RBI staff estimates; and Survey of Professional Forecasters (September 2024). |
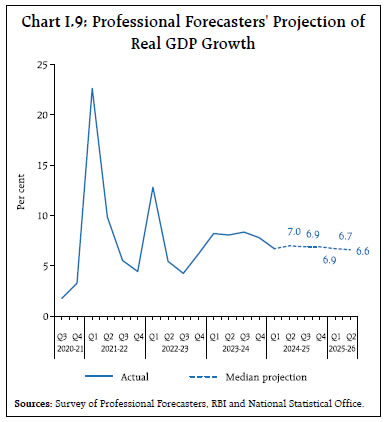
 The baseline forecasts are subject to several upside and downside risks. The upside risks emanate from uneven distribution of rainfall; prolonged geopolitical conflicts and resultant supply disruptions; recent uptick in food and metal prices; volatility of crude oil prices; and adverse weather events. The downside risks could materialise from an early resolution of geopolitical conflicts; weakening of global demand accompanied by further easing of global food and commodity prices; improvement in supply conditions; and proactive supply side measures by the government. I.3 The Outlook for Growth Domestic economic activity remains resilient. Improved performance of industrial sector, upturn in investment activity, above normal monsoon, pick up in rural demand, high capacity utilisation, healthy balance sheets of banks and corporates, and the government’s continued thrust on infrastructure spending augur well for the growth outlook. Uncertain global economic outlook, lingering geopolitical conflicts, rising supply chain pressures, and volatile global financial conditions, however, weigh heavily on the outlook to the downside. Turning to the key messages from forward-looking surveys, consumer confidence (the current situation index) improved in the September 2024 survey round vis-à-vis the previous round on account of better perceptions about the general economic, employment, and income conditions. Consumers’ optimism for the year ahead, measured by the future expectations index, also improved in the latest round vis-à-vis the previous one (Chart I.7).7 Optimism in the manufacturing sector for Q3:2024-25 improved in the July- September 2024 round of the Reserve Bank’s industrial outlook survey (Chart I.8a). Services and infrastructure companies continue to maintain a highly optimistic outlook for Q3:2024-25 (Charts I.8b and I.8c). Recent surveys by other agencies report sequential improvement in business expectations relative to the previous round (Table I.4). Manufacturing and services firms in the PMI surveys for September 2024 remained upbeat for the year ahead though a marginal deceleration in expectations is observed vis-à-vis the previous month for manufacturing firms. Professional forecasters polled in the September 2024 round of the Reserve Bank’s survey expected real GDP growth at 6.9-7.0 per cent during 2024-25 and 6.6-6.7 per cent during H1:2025-26 (Chart I.9 and Table I.3). | Table I.4: Business Expectations Surveys | | Item | NCAER Business Confidence Index (July 2024) | FICCI Overall Business Confidence Index (May 2024) | Dun and Bradstreet Composite Business Optimism Index (July 2024) | CII Business Confidence Index (October 2024) | | Current level of the index | 149.8 | 73.7 | 78.9 | 68.2 | | Index as per previous survey | 138.2 | 70.9 | 75.9 | 67.3 | | % change (q-o-q) sequential | 8.4 | 3.9 | 3.9 | 1.3 | | % change (y-o-y) | 17.0 | 18.1 | 12.6 | 1.6 | Notes: 1. NCAER: National Council of Applied Economic Research.
2. FICCI: Federation of Indian Chambers of Commerce & Industry.
3. CII: Confederation of Indian Industry.
4. Dun and Bradstreet Composite Business Optimism Index and CII Business Confidence Index are for Q2:2024-25, NCAER Business Confidence Index is for Q1:2024-25, and FICCI Overall Business Confidence Index pertain to Q4:2023-24.
Sources: NCAER, FICCI, CII and Dun & Bradstreet Information Services India Pvt. Ltd. | Real GDP growth exceeded 8 per cent growth in the first three quarters of 2023-24 before dipping marginally to 7.8 per cent in Q4. Real GDP growth of 6.7 per cent in Q1:2024-25 is reflective of the underlying momentum in key drivers of the economy viz., private consumption and investment. Taking into account the baseline assumptions, survey indicators and model forecasts, real GDP growth is expected at 7.2 per cent in 2024-25 with 7.0 per cent in Q2; 7.4 per cent both in Q3 and Q4 - with risks evenly balanced around the baseline (Chart I.10 and Table I.3). For 2025-26, assuming a normal monsoon and no major exogenous or policy shocks, structural model estimates indicate real GDP growth at 7.1 per cent, with Q1 at 7.3 per cent, Q2 at 7.2 per cent, Q3 and Q4 both at 7.0 per cent. 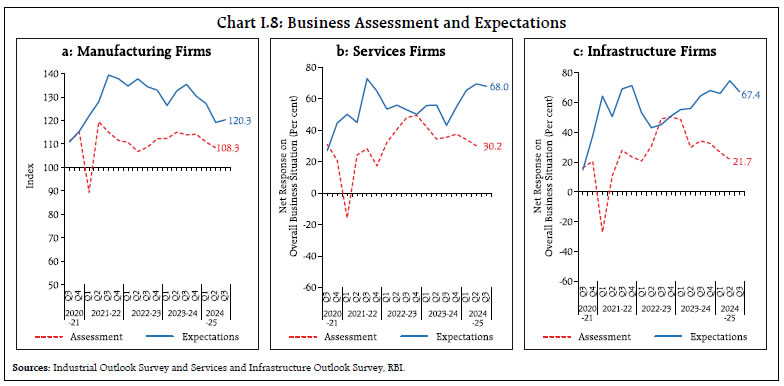
 There are upside and downside risks to this baseline growth path. The upside risks emanate from robust government capex and revival in private investment; improved prospects of agricultural sector due to favourable monsoon rainfall; strengthening manufacturing and services sector activity sustained by strong domestic demand; retreating global and domestic inflation; improvement in global trade; and earlier than anticipated easing of global financial conditions. On the contrary, further escalation in geopolitical tensions; volatility in international financial markets and geoeconomic fragmentation; deceleration in global demand; frequent weather-related disturbances due to climate change; and supply chain disruptions pose downside risks to the baseline growth path. I.4 Balance of Risks The baseline projections of growth and inflation are conditional on assumptions of the future path of key domestic and global macroeconomic variables set out in Table 1.2. These baseline assumptions are, however, subject to uncertainties emanating from prolonged geopolitical conflicts, volatility in global financial markets and recurrent adverse climate events. In this context, this section explores the plausible alternative scenarios to assess the balance of risks around the baseline projections. (i) Global Growth Uncertainties Global economic activity is subject to uncertainties going forward. Policy divergence among major central banks could trigger heightened volatility in global financial markets, with spillovers to emerging market economies. Services price and wage inflation remain areas of concern for the last mile of disinflation which might keep global interest rates higher for longer, with adverse impact on global growth prospects. The global economic outlook is also subject to headwinds from prolonged geopolitical and trade tensions, supply chain disruptions and swings in economic policies resulting from impending elections in major economies. In case these downside risks materialise, and, if global growth is 100 bps lower than the baseline, domestic growth and inflation could be lower than baseline projections by around 30 bps and 15 bps, respectively. If, however, there is faster convergence in global disinflation and alignment in monetary policy paths going forward, recovery in global trade and resolution of geopolitical tensions, there can be an upside to global growth. If global growth is higher by 50 bps, domestic growth and inflation could turn out to be higher by around 15 bps and 7 bps, respectively (Charts I.11a and I.12a). (ii) International Crude Oil Prices Global crude oil prices have exhibited some moderation, with Brent crude falling from a high of US$ 93 per barrel in mid-April 2024 to US$73 per barrel by end-September. Global growth recovery, continuation of geo-political tensions and non-reversal of production cut by OPEC plus may put upward pressure on crude oil prices. In this scenario, assuming crude oil price to be 10 per cent above the baseline and full pass-through to domestic product prices, domestic inflation could be higher by 30 bps and growth weaker by around 15 bps, respectively. Conversely, early resolution of geopolitical tensions, weak global demand, higher production from non-OPEC economies along with unwinding of production cuts by OPEC plus may soften crude oil prices. If crude oil prices fall by 10 per cent relative to the baseline, inflation could ease by around 30 bps with a boost of 15 bps to India’s real GDP growth (Charts I.11a and I.12a).
(iii) Exchange Rate The Indian Rupee (INR) has remained steady against the US dollar, being least volatile among major EME currencies in recent months. Going ahead, restrictive monetary policy by major AEs to achieve the last mile of disinflation could limit attractiveness of EME assets and trigger reversal of capital flows. Crude oil and other global commodity prices could also harden in comparison with the baseline. In this scenario, if INR depreciates by 5 per cent over the baseline, inflation could be higher by around 35 bps while GDP growth could edge up by around 25 bps through short term stimulation of exports. On the other hand, the Indian economy remains the fastest growing major economy globally and is poised to play an important role in revival of global growth. These developments, along with robust domestic macroeconomic fundamentals, inclusion of government bonds in global indices, and faster than anticipated monetary policy easing by AEs would attract foreign investors. In this scenario, if the INR appreciates by 5 per cent relative to the baseline, inflation and GDP growth could moderate by around 35 bps and 25 bps, respectively (Charts I.11b and I.12b). (iv) Food Inflation Food inflation remained persistently high in H1:2024-25, driven by high prices in cereals and pulses along with large shocks to vegetable prices triggered by recurrent adverse climate events of rising intensity. Further, food prices may be subject to extreme weather events such as excess rains and floods affecting kharif crops, unseasonal rains typically associated with extreme La Niña conditions, which may result in damage of winter crops and perishables. In such a scenario, there could be upward pressures on food prices and could raise headline inflation by around 50 bps over the baseline. Persistent shocks to food inflation warrant a cautious approach by monetary policy to contain spillover effects (Box I.1). On the other hand, kharif sowing remained robust, with higher acreage for major crops. Reservoir levels, too, are higher than both last year’s levels and the decadal average, which augurs well for the rabi season. These developments along with effective supply management measures may result in easing of food inflation pressures and could lower headline inflation by 50 bps compared with the baseline (Charts I.11b and I.12b). Box I.1: Monetary Policy Response to Food Inflation Under Alternative Scenarios The implications of food inflation for monetary policy are conditional on the size and duration of shocks to food prices and their transmission to headline inflation. The direct or first round impact of food inflation shocks is observed as a change in headline CPI inflation, given the dominant share of food items in the average household consumption basket. In the event of repeated and/or persistent food price shocks, price pressures may spillover to other components through shifts in inflation expectations (Das, 2024; Patra, et.al., 2024) and correction in relative prices. These are the indirect or second-round effects of food inflation. While the first-round effects are largely invariant to monetary policy, the second-round effects fall within its ambit. Therefore, prudent monetary policy must assess persistence of shocks to food inflation, their direct and indirect effects, and the relative efficacy of interest rate changes in moderating these impulses. This assumes importance in the broader macroeconomic context that accounts for contemporaneous aggregate demand conditions as well as the credibility of the central bank in anchoring inflation expectations. This general equilibrium approach are modelled by using the Quarterly Projection Model 2.0 (John et. al., 2023)8. Scenario 1 models the impact of a transitory shock compared to repeated shocks to food inflation. Transitory shocks may largely be seen through as they tend not to pass through to core inflation, warranting no policy response. In the event of repeated shocks to food inflation, however, there may be spillover to core inflation through elevated second round effects, requiring substantive monetary policy action to stabilise prices. Scenario 2 illustrates the relative effect of repeated food inflation shocks (from scenario 1) in the presence of buoyant aggregate demand conditions as against a situation with slack in demand. In the event of robust demand conditions, the spike in core inflation will be compounded, warranting more aggressive monetary policy action. In case of slack demand conditions, the pass-through of repeated shocks from food to core inflation will be moderate, meriting lesser urgency for monetary policy tightening. Finally, Scenario 3 illustrates the impact of a series of repeated food inflation shocks (from scenario 1) in the case of a perfectly credible central bank. Higher credibility leads to better anchoring of inflation expectations of economic agents, which may lead to restricted pass-through of higher costs to prices and therefore warranting less tightening of monetary policy. If the central bank credibility is low, economic agents may develop adaptive expectations and therefore inflationary shocks may pass-through without friction, warranting more aggressive policy rate action to stabilise the economy. These simulations suggest that while transitory shocks to food inflation can largely be ignored by monetary policy, repeated shocks do pose a challenge. If monetary policy does not respond to the second-round effects of repeated shocks to food inflation, it risks unanchoring of inflation expectations and consequently a more durable upward drift in core inflation, warranting more aggressive monetary policy to achieve disinflation in the future. References: S. Das (2024). “Governor’s Statement: Monetary Policy Statement (August 6-8) 2024-25”. RBI Bulletin, August 2024, Vol. 78(8). J. John, Kumar D., George A.T., Mitra P., Kapur M., & Patra, M.D. (2023). “A Recalibrated Quarterly Projection Model (QPM 2.0) for India”. RBI Bulletin, February 2023, Vol. 77(2). M.D. Patra, John J., & George, A.T. (2024). “Are Food Prices Spilling Over?”. RBI Bulletin, August 2024, Vol. 78(8). | I.5 Conclusion Domestic economic activity is expected to remain robust on the back of strong fundamentals. The revival of private consumption is buoyed by receding inflation and pick-up in rural demand is expected to be its mainstay. The Government’s capex push on infrastructure, upturn in investment activity, improved prospects of agricultural sector, strong corporate and bank balance sheets and improved outlook of global growth and trade are further aiding the growth momentum. Headline inflation is on a downward trajectory and is expected to moderate further in 2024-25, though the pace may be slow and uneven. Core inflation has bottomed out but remains subdued, supported by disinflationary monetary policy. The last mile of disinflation is contingent upon reining in food inflation and checking its spillover impact on inflation expectations and core inflation. Monetary policy remains steadfast on aligning inflation with the target. Geopolitical conflicts, uncertain global outlook, volatile global financial markets, and climate shocks remain key risks to the growth and inflation outlook. _________________________________________________________________________________
II. Prices and Costs Headline CPI inflation after remaining sticky till June 2024, fell sharply thereafter buoyed by favourable base effects. The wedge between headline and core inflation widened further in June, before moderating in July-August. Input costs have remained subdued while rural wages and manufacturing staff cost growth decelerated. Headline consumer price index (CPI) inflation1 remained sticky at around 5 per cent during March to June 2024, with key groups displaying considerable divergence. Food inflation edged up from an elevated level of 7.8 per cent in February 2024 to 8.4 per cent by June under the impact of repeated supply-side shocks. Deflation in fuel prices deepened from (-)0.8 per cent in February to (-)3.6 per cent in June. Core (CPI excluding food and fuel) inflation2 softened from 3.4 per cent to 3.1 per cent over the same period, the lowest reading recorded in the current CPI (2012=100) series so far. The wedge between headline and core inflation widened, from 1.7 percentage points in February 2024 to 2.0 percentage points in June. In July-August 2024, headline CPI inflation fell sharply to 3.6-3.7 per cent, buoyed by large favourable base effects in July, which also pulled food inflation down to 5.1-5.3 per cent. Core inflation edged up to around 3.4 per cent in July-August, primarily on account of a pick-up in core services inflation, while deflation in fuel prices intensified (Chart II.1). The Reserve Bank of India (RBI) Act enjoins the RBI to set out deviations of actual inflation outcomes from projections, if any, and explain the underlying reasons thereof. The April 2024 MPR had projected inflation at 4.9 per cent in Q1:2024-25 and 3.8 per cent in Q2:2024-25 (Chart II.2). Actual inflation outcomes have largely mirrored these projections. The projections of a significant softening of inflation in Q2 (July to September), induced by large favourable base effects in July, was also confirmed by actual inflation outcomes. The projections for Q2 (July-September) had also factored in a likely pick-up in inflation in September due to adverse base effects. II.1 Consumer Prices Inflation dynamics in 2024-25 so far (April to August) have undergone two distinct phases. First, after moderating to 4.9 per cent in March from 5.1 per cent in February, on favourable base effects and a sharp fall in fuel price momentum3, headline inflation remained steady at 4.8 per cent in April-May and edged up thereafter to 5.1 per cent in June due to a sharp pick up in price momentum triggered by an increase in food prices, notwithstanding significant favourable base effects. In the second phase from July, CPI price momentum remained firm across food and core groups, while statistical gains from favourable base effects pulled down headline CPI inflation by 1.5 percentage points to 3.6 per cent. In August, the modest increase in headline inflation by 5 basis points (bps) to around 3.7 per cent reflected base effects only as the overall prices remained unchanged (Chart II.3). The distribution of CPI inflation in 2024 so far (January-August) reflects a lower median and mean along with lower standard deviation than a year ago when large and multiple food price shocks had played an outsized role (Chart II.4). Stickiness in headline inflation between January-June 2024 was accompanied by a considerable divergence in food, fuel and core inflation trajectories. In July-August, a fall in food inflation led to narrowing of these divergences (Chart II.5). 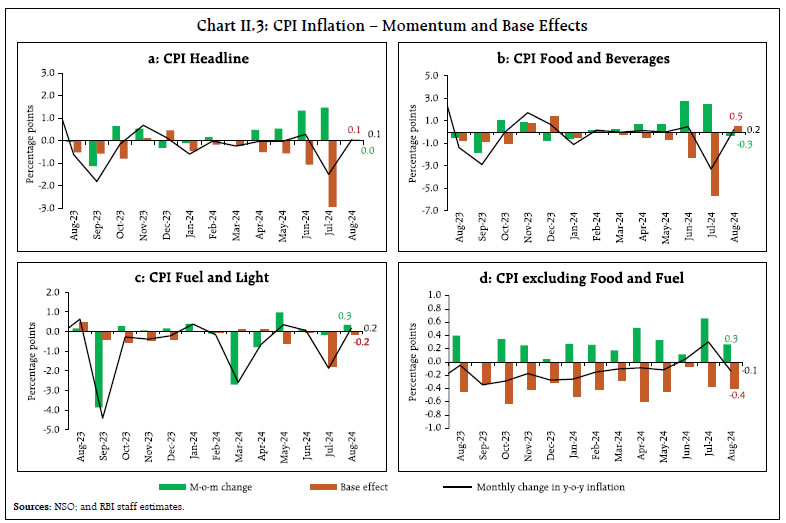 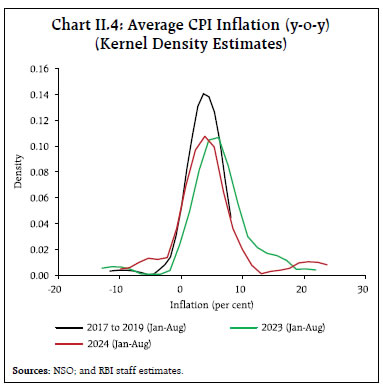 Diffusion indices (DIs)4 remained in high expansionary zone between March and August 2024, indicative of positive price increases across a broad spectrum of the CPI basket. After recording a transient uptick in March 2024, headline CPI DI dipped in April-May across both goods and services components. During June-August 2024, headline CPI DI edged up due to wider dispersion of price increases, first in goods and thereafter in services (Chart II.6a). Threshold DI5 – for price increases in excess of 4 per cent as well as 6 per cent on a seasonally adjusted annualised rate (saar) basis – continued to remain well below the 50 level mark, indicating little incidence of any broad-basing of such price momentum (Chart II.6b). II.2 Drivers of Inflation A historical decomposition of inflation using a vector autoregression (VAR)6 model indicates that the moderation in inflation in Q2:2024-25 stemmed from the negative contribution of supply side shocks to overall inflation - after being the major driver of inflation in the last four successive quarters - and from the disinflationary impact of past monetary policy actions (Chart II.7a). Goods inflation (with a weight of 76.6 per cent in the overall CPI) contributed around 88 per cent of headline inflation between March and June 2024 and around 82 per cent in July and August 2024 (Chart II.7b). The contribution of services (with a weight of 23.4 per cent) edged up over this period due to the pick-up in mobile tariffs. The increase in the contribution of perishable items (non-durable with a 7-day recall7), which include vegetables, spices, fruits and other food items such as milk, meat and fish and prepared meals, contributed to the stickiness in inflation in Q1. The contribution of semi-perishables (non-durable goods with a 30-day recall) to overall inflation remained broadly unchanged with cereals, pulses, and personal care items being the main inflation drivers. The contribution of durable items (goods with a 365-day recall) to overall inflation edged up during April-August 2024, primarily reflecting the uptick in gold prices. 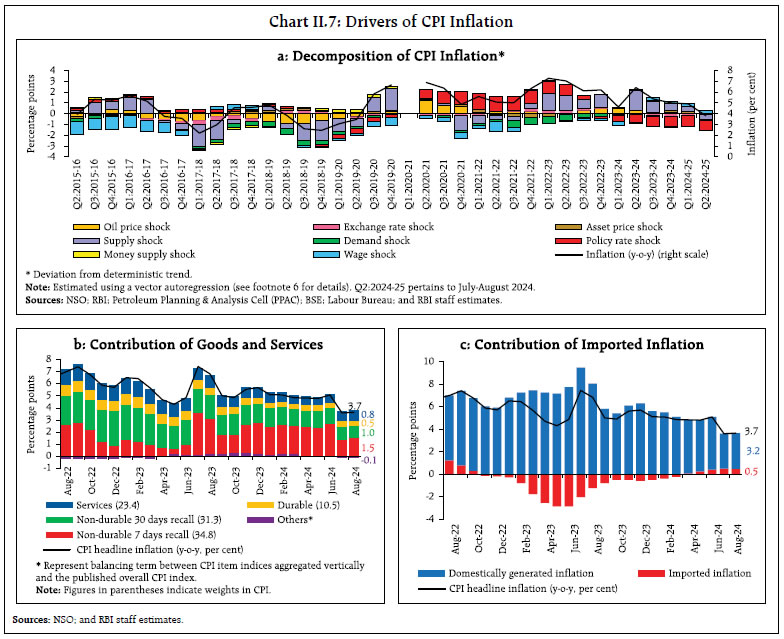 The contribution of imported components8 to headline inflation turned positive from April 2024 and increased gradually to 0.5 percentage points by August 2024, driven by higher gold and silver prices (Chart II.7c). CPI Food Group Food and beverages (weight of 45.9 per cent in the CPI basket) inflation exhibited distinct phases during the year so far. It averaged 8.0 per cent during April-June 2024, as weather disturbances such as heatwave conditions and uneven rainfall distribution, as well as tight supply conditions led to inflationary pressures in vegetables, cereals, and pulses. There was, however, a sharp moderation in food inflation to 5.1 per cent in July 2024, as favourable base effects more than offset a significant pickup in momentum. In August, despite a decline in food price momentum, food inflation increased to 5.3 per cent due to unfavourable base effects (Chart II.8). The food price build-up during 2024-25 so far (up to August) has been substantial, although lower than last year and the long-term historical average. High vegetable prices contributed a disproportionately large share to this build-up for the second successive year in a row (Chart II.9).  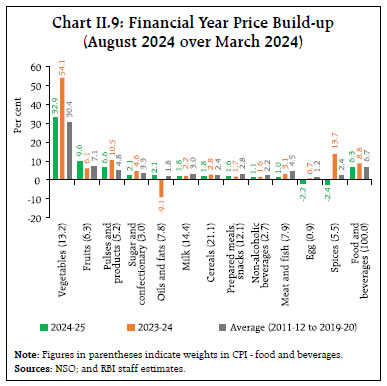 Cereals (weight of 9.7 per cent in the CPI and 21.1 per cent in the food and beverages group) inflation remained elevated at an average of 8.3 per cent during April-August 2024 (Chart II.10). Within cereals, rice inflation remained in double digits, despite export restrictions, reflecting tight supply conditions due to lower rabi and summer production [(-)2.4 per cent year-on-year (y-o-y) in 2023-24]. For effective supply management and price stabilisation, government has announced several measures including the retail sale of ‘Bharat Rice’ and allowing rice-deficient states to directly purchase rice from the Food Corporation of India at a fixed price of ₹2800/quintal under the Open Market Sale Scheme (OMSS) from August 2024. The buffer stocks of rice (3.0 times the norm as of September 16, 2024) are comfortable and kharif sowing has been higher by 2.5 per cent in 2024-25 as on September 27, 2024 compared to the corresponding period of last year, which are likely to improve supply conditions and contain price pressures. With signs of easing of supply conditions, government has lifted the ban on exports of non-basmati white rice subject to a minimum export price (MEP) of $490/tonne, while removing the MEP on Basmati rice in September 2024 to support farmers’ price realisation. Wheat inflation, on the other hand, was moderating till February 2024, but it hardened thereafter to reach 6.6 per cent in August, reflecting lower buffer stocks (0.9 times the norm as of September 16, 2024) and lower mandi arrivals than in 2023-24. Wheat inflation was elevated despite higher production and price stabilisation measures, including the imposition of stock limits for traders/wholesalers and retailers till March 2025, the likely offloading of stocks under the OMSS and continued restrictions on wheat exports. 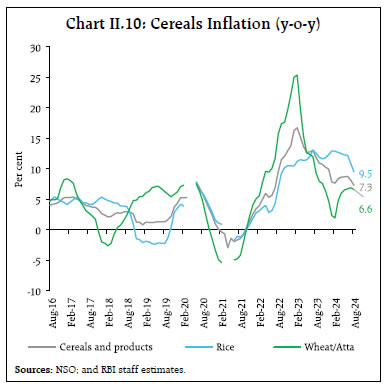 Vegetables (weight of 6.0 per cent in the CPI and 13.2 per cent in the food and beverages group) inflation remained elevated till June 2024, but witnessed a sharp correction in July primarily because of favourable base effect (Chart II.11). The price momentum, however, remained firm in July, reflecting lower production [(-)3.2 per cent in 2023-24 over 2022-23 as per 3rd advance estimates (AE) 2023-24] and supply disruptions due to heatwave conditions in parts of northern India, excess rains in parts of central and southern India and the resultant lower market arrivals. As supplies resumed, vegetable prices declined in August, particularly from a sharp correction in tomato prices. 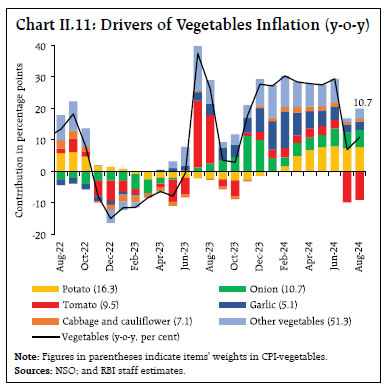 Among key vegetables, potato prices, on a y-o-y basis, increased sequentially in 2024, reaching 65 per cent in July-August, driven by production shortfalls [(-)5.1 per cent in 2023-24 over 2022-23 as per 3rd AE 2023-24] due to unseasonal rains and prolonged spells of fog and cold conditions during winter in the major producing states of Uttar Pradesh, West Bengal, and Bihar. Onion prices moderated during January-February 2024, but started rising again, recording a y-o-y inflation of 60.6 per cent in July 2024 and 54.1 per cent in August due to deficient production [(-)19.7 per cent in 2023-24 over 2022-23 as per 3rd AE 2023-24]. For effective supply management, onion exports were allowed and 40 per cent export duty with a MEP of $550 per metric tonne was imposed in May 2024. Subsequently, in September 2024, the export duty was reduced to 20 per cent, and MEP was removed, allowing free shipments of onion. Tomato price increase, which averaged around 37 per cent during December 2023-June 2024 on a y-o-y basis, was on account of tight supply conditions induced by heatwaves and unseasonal rainfall. Prices declined by (-)43.0 per cent, on a y-o-y basis, in July 2024 as a strong favourable base effect outweighed the substantial increase in price momentum. Softening in prices in August further pulled down tomato inflation to (-)47.9 per cent. Vegetables excluding TOP (tomato; onion; and potato), particularly garlic, also witnessed considerable price build-up in Q1:2024-25, emerging as another major driver of vegetables inflation (Chart II.12).  Inflation in fruits (weight of 2.9 per cent in the CPI and 6.3 per cent within the food and beverages group) eased in July on a strong favourable base effect, after rising during April-June 2024 to 6.3 per cent on average. In August, it rose to 6.5 per cent despite higher production (2.3 per cent in 2023-24 over 2022-23 as per the 3rd AE), with price increases primarily driven by bananas, apples and mangoes. Inflation in groundnut prices, however, moderated from around 10.4 per cent in December 2023 to 1.7 per cent in July 2024 before falling into the deflationary zone at (-)1.5 per cent in August 2024, on account of higher kharif production (1.1 per cent in 2023-24). Pulses, the primary source of plant-based protein (weight of 2.4 per cent in the CPI and 5.2 per cent in the food and beverages group), continued to record double-digit inflation due to deficient kharif and rabi production [(-)7.0 per cent in 2023-24 over 2022-23] on top of a decline in production in 2022-23. Within pulses, lower production of gram [(-)10 per cent in 2023-24], urad [(-)11.9 per cent] and moong [(-)15.6 per cent] as well as subdued production in tur (3.2 per cent increase in 2023-24 over 2022-23 against 21.5 per cent decline in 2022-23) were the primary drivers of price pressures (Chart II.13). Inflation in pulses prices moderated to 13.6 per cent in August 2024 on interventions to ease supply conditions through imposition of stock limits on tur and gram (till September 30, 2024), extension of free import policy for yellow peas (till December 31, 2024), and tur and urad (till March 31, 2025), weekly stock disclosure requirements for five major pulses, and sale of chana dal under the brand ‘Bharat Dal’. As a result, the stock-to-use ratio improved to 6.8 per cent during April-August 2024 from 6.5 per cent during the corresponding period of 2023 (Chart II.14). Animal-based protein items exhibited high and volatile inflation movements during April-August 2024. Inflation in prices of meat and fish (weight of 3.6 per cent in the CPI and 7.9 per cent in the food and beverages group) averaged 6.2 per cent during April-August 2024. Inflation in the price of eggs (weight of 0.43 per cent in the CPI and 0.9 per cent in the food and beverages group) exhibited considerable volatility, falling from 10.3 per cent in March to 4.1 per cent in June before increasing to 7.1 per cent in August. Inflation in milk and products (weight of 6.6 per cent in the CPI and 14.4 per cent within the food and beverages group) has remained range bound at around 3 per cent during April-August. Although milk price hikes by several cooperatives, including Amul and Mother Dairy, in June 2024 led to higher price momentum in June, it was offset by favourable base effects (Chart II.15).  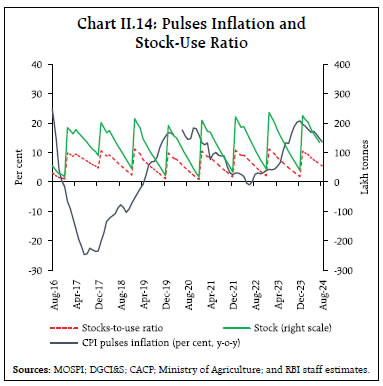 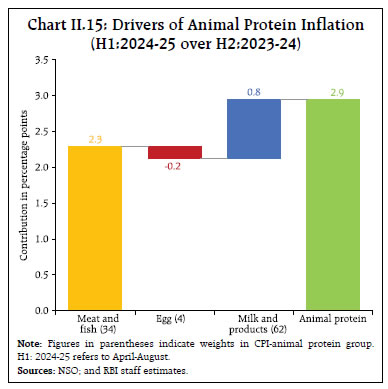 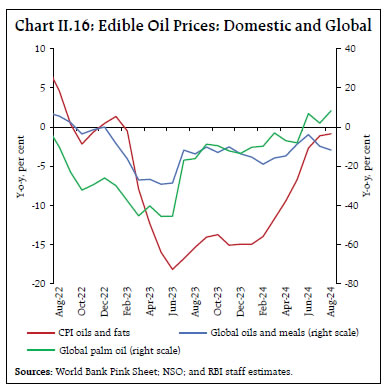 Prices of oils and fats (weight of 3.6 per cent in the CPI and 7.8 per cent within the food and beverages group) remained in deflation during April-August 2024 on higher imports and lower international prices of major edible oils (Chart II.16). The pace of deflation, however, moderated, with continued positive momentum reflecting pick-up in international edible oil prices as well as lower domestic production of oilseeds in the 2023-24 season [(-)4.1 per cent in 2023-24 over 2022-23]. The current kharif season sowing of oilseeds has been encouraging, particularly for groundnut. In January 2024, the regime of lower import duties on crude palm, sunflower and soyabean oil were extended till March 2025. To improve domestic price realisation, however, the import duty on crude and refined edible oils has been hiked by 20 percentage points in September 2024. Among other items in the oils and fats sub-group, inflation in ghee and butter prices continued to moderate. Inflation in prices of sugar and confectionery (weight of 1.4 per cent in the CPI and 3.0 per cent in the food and beverages group) has moderated in 2024-25 compared to H2:2023-24 despite lower sugarcane production [(-)7.6 per cent in 2023-24 over 2022-23]. Measures to augment domestic availability of sugar include extension of export restrictions, and imposition of 50 per cent export duty on molasses used for ethanol production as well as restriction on the use of sugarcane juice and syrup for ethanol production since December 2023. The restrictions on sugar diversion for ethanol production were, however, eased in August 2024. Among other food items, inflation in spices moderated on a sustained basis since April 2024 and slipped into deflation since July after recording double-digit inflation for a 22-month period till March 2024. The recent decline was led by jeera and dry chillies, on account of higher spices production (5.5 per cent as per 3rd AE in 2023-24 over 2022-23). Inflation in prices of prepared meals has moderated gradually, reflecting the pass-through of lower input costs. Retail Margins Retail price margins – the difference between retail and wholesale prices9 – in the case of cereals edged up during March-May 2024 and thereafter started to decline from June 2024 onwards to ₹4.3 per kg, the lowest since December 2020. After recording a sustained increase between September 2023 and January 2024, pulses price margins witnessed a sustained decrease during February-September 2024. Retail price margins in edible oils continued to soften since June 2024, primarily due to the moderation in the margin of refined oils. Retail price margins of TOP vegetables started firming up from March 2024 onwards (Chart II.17). Sectoral and Spatial Distribution of Food Inflation Heightened CPI food inflation pressures were seen across both rural and urban areas, with average rural food inflation during April to August 2024 outpacing its urban counterpart (Chart II.18).
| Table II.1: Distribution of food inflation across States/UTs: Number of states# | | Food Inflation Range | 2023-24
(Apr-Aug) | 2024-25
(Apr-Aug) | | Less than 2 per cent | 1 | 1 | | Between 2 to 4 per cent | 8 | 2 | | Between 4 to 6 per cent | 11 | 13 | | Greater than 6 per cent | 16 | 20 | # Accounted for the unification of Daman and Diu with Dadra & Nagar Haveli and the formation of Ladakh as a Union Territory (UT).
Sources: NSO; and RBI staff estimates. | Spatially, food inflation pressures have heightened – the number of states/UTs with food inflation higher than 6.0 per cent in the period April-August 2024 has increased to 20 vis-à-vis 16 in the corresponding period a year ago (Table II.1). CPI Fuel Group The deflation in fuel prices deepened from (-)0.8 per cent in February 2024 to (-)5.3 per cent in August 2024, reflecting the cumulative impact of the LPG price reduction in August 2023 and March 2024. Fuel deflation was also aided by softening of price pressures, on a y-o-y basis, in kerosene, reflecing the pass-through of lower international prices, as well as in firewood and chips, and dung cake. Electricity prices also moderated sharply from a record high of 13.5 per cent in August 2023, on a y-o-y basis, to 4.8-4.9 per cent in July-August 2024 (Chart II.19). Core CPI (CPI excluding Food and Fuel Groups) Core (CPI excluding food and fuel) disinflation continued during H1 of 2024-25 (April-August) as it softened to 3.1 per cent by May-June 2024. This sustained sequential softening observed for more than a year (since June 2023) was disrupted in July-August 2024 with core inflation averaging 3.4 per cent, primarily reflecting the impact of mobile tariff revisions. Exclusion-based measures of underlying inflation, which remove volatile items such as petrol, diesel, gold, and silver in addition to food and fuel, also witnessed similar movements during this period (Chart II.20 and Table II.2). While diffusion index for CPI excluding food, fuel, petrol, diesel, gold and silver indicated positive price increases across much of its consitutents, a vast majority of these price increases were less than 6 per cent (m-o-m saar) and 4 per cent (m-o-m saar), as indicated by the steep fall in threshold DIs to well below the 50 level mark. Threshold DIs for CPI core, however, exhibited a sustained pick-up during June-August 2024, indicating a likely bottoming out of muted price momentum (Chart II.21). Both core goods and services experienced significant easing of inflationary pressures in 2024-25 so far (April-August) with contribution from all sub-groups/groups (Chart II.22).
| Table II.2: Exclusion-based Measures of Inflation (y-o-y) | | Period | CPI excluding food and fuel (47.3) | CPI excluding food fuel petrol diesel (45.0) | CPI excluding food fuel petrol diesel gold silver (43.8) | | Aug-23 | 4.9 | 5.1 | 4.8 | | Sep-23 | 4.5 | 4.7 | 4.4 | | Oct-23 | 4.2 | 4.4 | 4.1 | | Nov-23 | 4.1 | 4.2 | 3.9 | | Dec-23 | 3.8 | 3.9 | 3.6 | | Jan-24 | 3.5 | 3.7 | 3.4 | | Feb-24 | 3.4 | 3.5 | 3.3 | | Mar-24 | 3.3 | 3.4 | 3.2 | | Apr-24 | 3.2 | 3.4 | 3.0 | | May-24 | 3.1 | 3.3 | 2.8 | | Jun-24 | 3.1 | 3.3 | 2.8 | | Jul-24 | 3.4 | 3.6 | 3.1 | | Aug-24 | 3.3 | 3.5 | 3.0 | Notes: (1) Figures in parentheses indicate weights in CPI.
(2) Derived as residual from headline CPI.
Sources: NSO; and RBI staff estimates. | Out of the 2.9 percentage points moderation in core inflation from its peak in January 2023 till August 2024, around 90 bps was contributed by the clothing and footwear sub-group. In addition, housing accounted for 42 bps, while household goods and services, and transport and communication contributed 38 bps and 33 bps, respectively (Chart II.23). Decomposing core inflation – CPI excluding food, fuel, petrol, diesel, gold, and silver inflation – into its goods (with a weight of 20.7 per cent in the headline CPI) and services (weight of 23.0 per cent) components shows a sequential softening of around 65 bps in core goods from 3.5 per cent in February 2024 to 2.9 per cent in August. The key drivers of this softening were clothing and footwear, transport and communication, household goods, and health items (Chart II.24a). 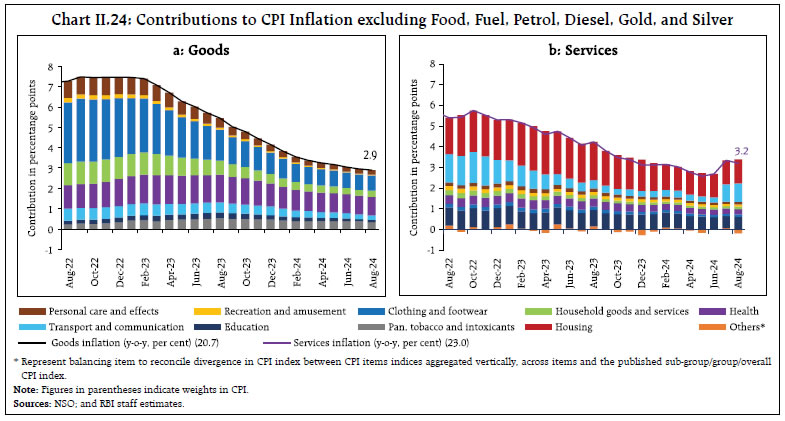 Core services inflation, on the other hand, fell from 3.2 per cent in February 2024 to 2.6 per cent in May, primarily driven by housing (house rent), transport (such as railway charges and porter fares), and education (tuition fee and other educational expenses) services. It rose to 3.3 per cent during July-August due to tariff hikes across major private mobile operators resulting in a rise in prices of communication services (Chart II.24b). An analysis of the determinants of house rent inflation indicate that demand and supply conditions and inflation expectations have a significant role in shaping house rent inflation (Box II.I). Box II.1: What Drives Housing (Rent) Inflation in India? CPI housing (rent10) inflation (y-o-y) has moderated sequentially during March-August 2024 (Chart II.1.1). An analysis of the determinants of housing (rent) inflation (seasonally adjusted annualised quarter-on-quarter rate, ΔHR) in an autoregressive distributed lag (ARDL) model reveals that inflation expectations – i.e., one-year ahead inflation expectations of Indian (urban) households from the Reserve Bank’s Inflation Expectations Survey of Households – has a positive and statistically significant impact on CPI housing (rent) inflation. Demand conditions represented by the unemployment rate (UMP) from the Periodic Labour Force Surveys11 (proxying aggregate demand) and the night light index12 gap variable (NLG)13 (proxying housing demand) – were also seen to have a positive and significant influence, suggesting that the shock to demand conditions induced by the onset of the pandemic has had an impact on house rentals. An increase in housing supply, measured by changes in the trend of the night light index (NLT), is seen to have a negative effect on housing rent inflation (Table II.1.1). 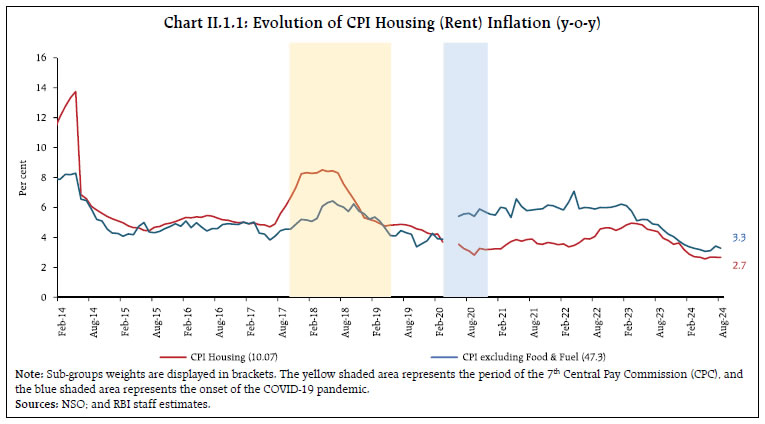
| Table II.1.1: Determinants of Housing (Rent) Inflation | | Dep: Δ HR | (1) | (2) | (3) | (4) | | Δ HR (-1) | 0.10** | 0.10** | 0.09** | 0.09** | | | (0.00) | (0.00) | (0.00) | (0.00) | | IE (-1) | 0.13* | 0.14* | 0.12* | 0.13* | | | (0.08) | (0.07) | (0.06) | (0.06) | | UMP (-1) | -0.12** | | -0.11** | | | | (0.00) | | (0.01) | | | NLG (-1) | | 0.06** | | 0.06* | | | | (0.04) | | (0.08) | | Δ NLT (-1) | -0.24** | -0.23** | -0.24** | -0.24** | | | (0.00) | (0.00) | (0.00) | (0.00) | | ΔHP (-1) # | | | 0.06 | 0.05 | | | | | (0.13) | (0.23) | | 7CPC | 0.16** | 0.15** | 0.16** | 0.16** | | | (0.00) | (0.00) | (0.00) | (0.01) | | Constant | 4.85** | 3.63** | 4.68** | 3.56** | | | (0.00) | (0.00) | (0.00) | (0.00) | | R-squared | 0.682 | 0.680 | 0.685 | 0.680 | | LM test for autocorrelation (p-value) | 0.131 | 0.159 | 0.075 | 0.054 | | ARCH LM test (p-value) | 0.991 | 0.876 | 0.812 | 0.645 | #Similar results were obtained on using the quarterly House Price Index published by RBI, instead of NHB-RESIDEX.
Notes: 1. Figures in parentheses indicate p-values. ** and * indicate significance at 5 and 10 per cent levels, resepectively.
2. Inflation (y-o-y) is calculated after obtaining quarterly averages of monthly CPI Housing indices.
3. The variable 7CPC represents an interactive dummy to capture the HRA adjustments linked to the 7th Central Pay Commission.
Source: RBI Staff Estimates. | The changes in housing price (ΔHP) as measured using RESIDEX14 from National Housing Bank (NHB) do not seem to have a significant impact on rent inflation. Housing prices, on the other hand, are also found to be affected by aggregate and housing demand, inflation expectations as well as housing supply, i.e., the same covariates explain housing prices and rent. References: Mohan, R., Hasan, S., Roy, S., and Sarkar, S. (2024). Deciphering the Drivers of CPI Housing Inflation in India. mimeo. | Trimmed mean measures15 also indicate an easing of underlying inflation pressures since March 2024, with weighted median inflation moderating from 3.3 per cent in March 2024 to 2.9 per cent in June (Table II.3). Other Measures of Inflation CPI inflation for agricultural labourers (CPI-AL) and rural labourers (CPI-RL) were substantially higher than the CPI headline inflation during March-August 2024 reflecting the impact of higher food inflation, which has a relatively higher weight in CPI-AL and CPI-RL. CPI inflation for industrial workers (CPI-IW), on the other hand, was below the headline CPI during the same period, primarily on account of double-digit fuel deflation, despite higher food inflation in CPI-IW vis-à-vis headline CPI. After remaining subdued till end of 2023-24, wholesale price index (WPI) inflation picked up during April-June 2024 with food inflation registering a sharp uptick along with fuel and non-food manufactured products moving out of deflation. Thereafter, WPI inflation softened in July, primarily due to favourable base effects. The softening continued in August on account of negative price momentum mainly coming from the food group. With overall WPI recording sequential increase since April 2024, inflation measured by deflators for gross value added (GVA) and gross domestic product (GDP) hardened in Q1:2024-25 (Chart II.25a). | Table II.3: Trimmed Mean Measures of Inflation (y-o-y) | | Month | 5% trimmed | 10% trimmed | 25% trimmed | Weighted Median | | Aug-23 | 5.7 | 5.6 | 5.3 | 5.2 | | Sep-23 | 4.7 | 5.0 | 4.9 | 4.7 | | Oct-23 | 4.5 | 4.9 | 4.7 | 4.4 | | Nov-23 | 4.6 | 4.8 | 4.5 | 4.1 | | Dec-23 | 4.8 | 4.7 | 4.2 | 4.1 | | Jan-24 | 4.7 | 4.5 | 3.9 | 3.7 | | Feb-24 | 4.6 | 4.4 | 3.7 | 3.6 | | Mar-24 | 4.7 | 4.4 | 3.6 | 3.3 | | Apr-24 | 4.6 | 4.2 | 3.5 | 3.0 | | May-24 | 4.5 | 4.2 | 3.4 | 2.9 | | Jun-24 | 4.3 | 3.9 | 3.4 | 2.9 | | Jul-24 | 3.8 | 3.7 | 3.3 | 3.0 | | Aug-24 | 3.9 | 3.7 | 3.3 | 3.0 | | Sources: NSO; and RBI staff estimates. | Similar sub-groups/items across CPI and WPI exhibited varying inflation movements. While WPI inflation in major food sub-groups (particularly cereals, pulses, milk, sugar, fruits and spices) ruled above corresponding CPI groups/subgroups, inflation in vegetables and egg prices, and clothing and footwear was higher in the CPI than in the WPI. Similarly, deflation in petrol was lower in the WPI vis-à-vis CPI, while the same was higher for diesel in the former (Chart II.25b). II.3 Costs Costs, as measured by WPI inflation in industrial raw materials and farm inputs, remained subdued during April-August 2024. While the prices of farm inputs remained in deflation, those of industrial inputs entered positive territory in June 2024, but turned negative again in August, mirroring movements in international commodity prices (Chart II.26). Prices of industrial inputs such as high-speed diesel (HSD), bitumen and petroleum coke were mostly in deflation during April-August 2024. The other contributory factors were non-food articles, particularly raw cotton and oilseeds, whose prices also recorded deflation during this period. Minerals price inflation, however, remained positive during April-August 2024, primarily driven by iron ore, due to increased global demand. Farm input prices remained in deflation, driven by those of high-speed diesel (HSD), electricity, and fodder and pesticides. 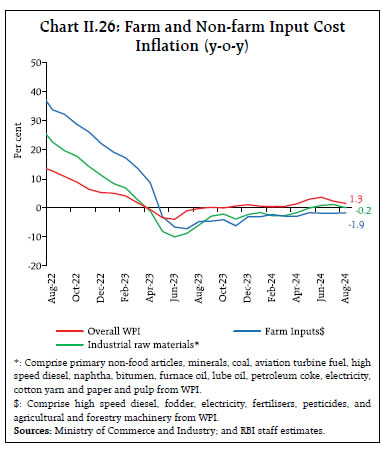 Moving from input costs to wage costs, nominal rural wage growth (y-o-y) decelerated to 4.9 per cent in July 2024 from 5.7 per cent in March 2024 driven by both non-agricultural and agricultural occupations (Chart II.27). On a month-on-month basis, however, both agricultural and non-agricultural wages sustained a steady growth of around 0.45 per cent and 0.4 per cent during the same period, respectively. The month-on-month increase in agricultural wage was mainly driven by ploughing/tilling workers, followed by loggers and woodcutters, plant protection workers, and general agricultural labourers, while the increase in non-agricultural wages was on account of masons, electricians, and light motor vehicle and tractor drivers in the rural sector. Despite the deceleration in nominal rural wages, real rural wages (deflated using CPI rural inflation) recorded a marginal growth of 0.8 per cent in July from 0.2 per cent in March 2024, primarily reflecting the sharp fall in CPI rural inflation in July. 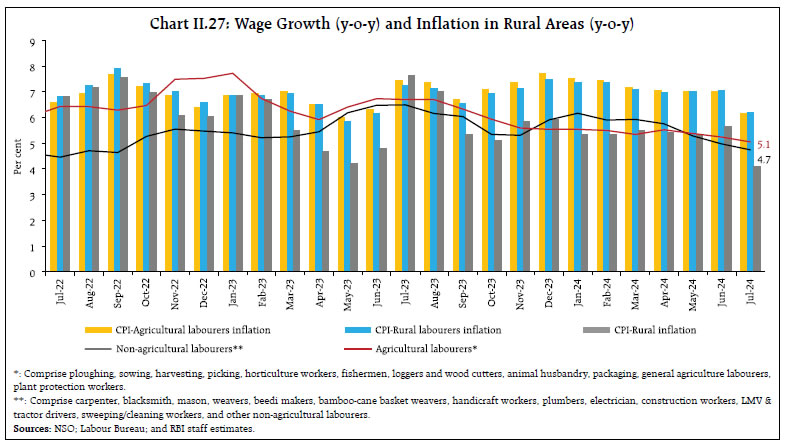 In the organised sector, staff cost growth (y-o-y) decelerated for manufacturing firms among listed companies in Q1:2024-25, while it remained steady for services firms. The share of staff cost in the value of production increased for manufacturing but stayed stable for services in Q1 (Chart II.28). Firms polled in the Reserve Bank’s enterprise surveys16 indicate that in Q3:2024-25, the cost of inputs are expected to soften for manufacturing while remaining elevated for services and infrastructure sectors. On the other hand, selling prices are expected to soften across manufaturing, services and infrastructure sectors in Q3:2024-25. The pace of salary outgo is expected to moderate for services and infrastructure in Q3:2024-25 while it is anticipated to rise for manufacturing (Chart II.29). One year ahead business inflation expectations17 declined to 4.05 per cent in August 2024 from 4.21 per cent in the previous month on account of moderation in cost pressures with ‘somewhat less than normal’ or lower sales and subdued profit margin expectations. As per the purchasing managers’ index (PMI), manufacturing firms, which had been reporting increasing input price pressures since March 2024, pointed to a moderation in the rate of input cost expansion during August-September 2024. In tandem with input prices, pace of output price increases across manufacturing also rose before decelerating in September 2024. This turned the input-output price gap for manufacturers marginally positive in September 2024. In case of services sector, the rate of expansion in input costs remained elevated during March-May 2024, before it saw a softening during June-September. The prices charged across services firms, which had been lagging behind input price increases during March-June 2024, quickened in July 2024 on the back of pent up pass-through of rising labour and material costs. Subsequently, with cost pressures moderating, the rate of expansion in prices charged receded in August-September 2024 (Chart II.30). II.4 Conclusion The disinflation process in H1 of 2024-25 so far (April-August) has been characterised by interruptions on account of persistent food inflation pressures from adverse weather events, despite steady softening of core inflation. Food inflation could see an easing in H2 of 2024-25, benefiting from normal monsoons and improvements in agricultural output on the back of a likely good kharif production and healthy rabi sowing, although occurrences of adverse weather events and recent uptick in global food prices, if sustained, could impinge upon the food inflation outlook. Core inflation pressures have remained muted with the continuing impact of disinflationary monetary policy stance and softening bias in international commodity prices. Recent pickup in global metals and crude oil prices and uncertainties on account of geopolitical developments need to be monitored. In the context of the apparent rigidities to the last mile of disinflation in the recent period, a steadfast commitment to alignment of inflation with the target is imperative to preserve and build upon the credibility gains in monetary policy achieved during the pre- and post-COVID flexible inflating targeting (FIT) period. A durable low inflation environment will strengthen the foundations of a sustained high growth trajectory. _________________________________________________________________________________
III. Demand and Output Domestic economic activity in H1:2024-25 was supported by a strong performance from the two main drivers of aggregate demand – private consumption and investment activity. Improved agriculture prospects, sustained buoyancy in services, consumer and business optimism, government’s continued thrust on capex, and healthy balance sheets of banks and corporates brighten the outlook. Geopolitical tensions, geoeconomic fragmentation, unseasonal rains and weather disturbances, and volatility in financial markets pose downside risks. Domestic economic activity remained resilient in H1:2024-25. Private consumption rebounded, driven by the turnaround in rural demand and sustained urban demand. Investment activity held firm despite lower government capex. Government consumption contracted (year-on-year, y-o-y) during Q1:2024-25. On the supply side, industry and services remained buoyant with construction, education, health and other services supporting growth. III.1 Aggregate Demand Aggregate demand conditions witnessed some moderation as real gross domestic product (GDP) growth decelerated to 6.7 per cent (y-o-y) in Q1:2024-25 from 7.8 per cent in the previous quarter (Table III.1 and Chart III.1). The momentum of GDP – quarter-on-quarter (q-o-q) seasonally adjusted annualised growth rate (saar) – slowed down in relation to the previous quarter (Chart III.1b). GDP Projections versus Actual Outcomes The Monetary Policy Report (MPR) of April 2024 had projected real GDP growth at 7.1 per cent for Q1:2024-25. Actual growth turned out to be lower, mainly on account of lower government consumption expenditure as election-related restrictions were in place (Chart III.2). 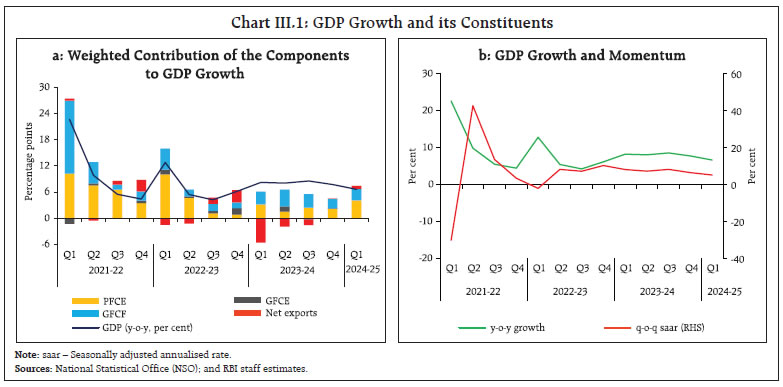
| Table III.1: Real GDP Growth | | (y-o-y, per cent) | | Item | 2022-23 | 2023-24 | Weighted Contribution* | 2022-23 | 2023-24 | 2024-25 | | (FRE) | (PE) | 2022-23 | 2023-24 | Q1 | Q2 | Q3 | Q4 | Q1 | Q2 | Q3 | Q4 | Q1 | | Private final consumption expenditure | 6.8 | 4.0 | 3.9 | 2.3 | 18.5 | 8.2 | 1.8 | 1.5 | 5.5 | 2.6 | 4.0 | 4.0 | 7.4 | | Government final consumption expenditure | 9.0 | 2.5 | 0.9 | 0.2 | 9.8 | 3.4 | 7.1 | 13.9 | -0.1 | 14.0 | -3.2 | 0.9 | -0.2 | | Gross fixed capital formation | 6.6 | 9.0 | 2.2 | 3.0 | 13.9 | 4.7 | 5.0 | 3.8 | 8.5 | 11.6 | 9.7 | 6.5 | 7.5 | | Exports | 13.4 | 2.6 | 3.0 | 0.6 | 19.1 | 11.7 | 10.9 | 12.4 | -6.6 | 5.0 | 3.4 | 8.1 | 8.7 | | Imports | 10.6 | 10.9 | 2.5 | 2.7 | 26.1 | 16.1 | 4.1 | -0.4 | 15.2 | 11.6 | 8.7 | 8.3 | 4.4 | | GDP at market prices | 7.0 | 8.2 | 7.0 | 8.2 | 12.8 | 5.5 | 4.3 | 6.2 | 8.2 | 8.1 | 8.6 | 7.8 | 6.7 | Notes: *: Component-wise contributions to growth do not add up to GDP growth because change in stocks, valuables and discrepancies are not included. FRE: First revised estimates; PE: Provisional estimates.
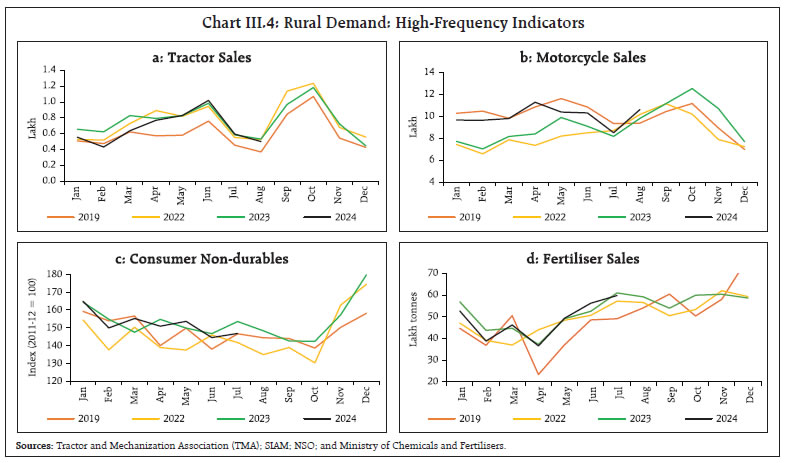
Sources: NSO; and RBI staff estimates. | III.1.1 Private Final Consumption Expenditure Private final consumption expenditure (PFCE) – the mainstay of aggregate demand – rebounded strongly, growing at 7.4 per cent in Q1:2024-25 and contributing 4.2 percentage points to overall GDP growth. Amongst the high frequency indicators (HFIs) of urban consumption, domestic air passenger traffic rose by 5.6 per cent in Q1:2024-25 and sustained its momentum in July-August 2024. Passenger vehicle sales posted positive y-o-y growth in Q1:2024-25 but contracted in July-August 2024. The index of industrial production (IIP) for consumer durables was robust at 10.6 per cent in Q1:2024-25 and 8.2 per cent in July 2024, indicating steady expansion in discretionary spending in urban areas (Chart III.3). As per the latest round of the Reserve Bank’s consumer confidence survey, consumer confidence (current situation index) improved in September 2024, along with an improvement in households' optimism on one year ahead economic conditions. Bank credit to households grew in double digits, despite the slowdown in unsecured personal loans and credit cards outstanding that set in after the November 16, 2023 measures (Chart III.3d). 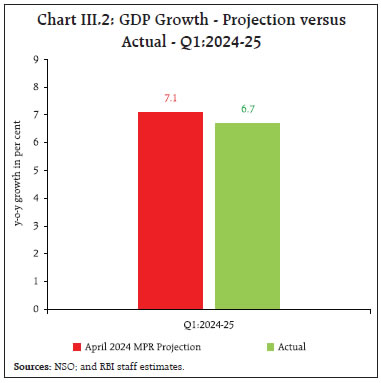 Rural demand is showing a gradual pickup. While motorcycle sales continued to record upbeat growth in April-August 2024, tractor sales expanded in June-July 2024 (Chart III.4). The demand for work under the Mahatma Gandhi National Rural Employment Guarantee Act (MGNREGA) contracted by 16.6 per cent in Q2:2024-25, reflecting an improvement in farm sector employment. Spending on fast moving consumer goods (FMCG) in the rural areas bodes well for rural demand. The positive outlook for agriculture, supported by above normal south-west monsoon (SWM) rainfall, higher cumulative kharif sowing and improved reservoir levels augurs well for sustaining the revival in rural demand. An examination of macroeconomic drivers of item group-wise consumption reveals that income effect boosts consumption demand while economic uncertainty dampens it. As consumption of necessary items have lower elasticity of substitution than discretionary items, they are more insulated from economic uncertainty (Box III.1). 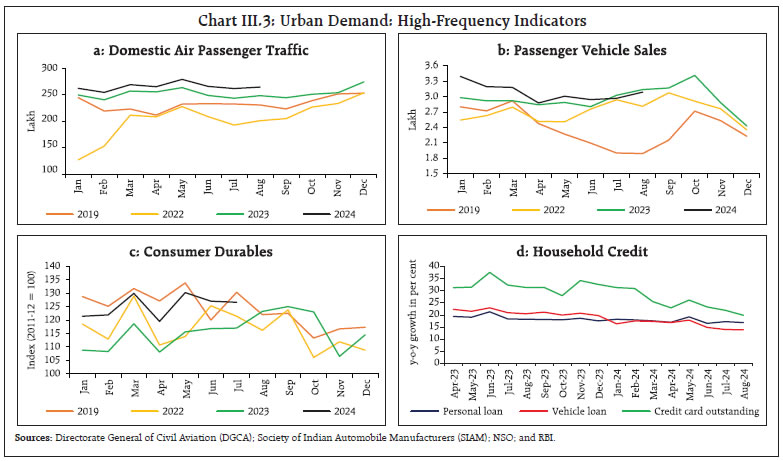
Box III.1: Consumption Switching? Unravelling the Drivers behind Changing Consumption Patterns in India There has been a slowdown in private final consumption expenditure (PFCE) in the post-pandemic period (average growth rate of 5.4 per cent) when compared with the pre-COVID period1 (average growth of 6.7 per cent). PFCE grew by a meagre 4.0 per cent in 2023-24 as adverse rainfall conditions weakened rural demand. Consumption, however, rebounded with a 7.4 per cent growth in Q1:2024-25. Drawing on the real business cycle literature (Kydland and Prescott, 1982), consumption switching is analysed at the aggregate level using a quantile regression framework, based on the following specification
Next, the precautionary motive is linked to consumption switching by looking at consumption growth at a broad commodity level. Following a nested Constant Elasticity of Substitution (CES) approach (Fernandez-Villaverde and Guerron-Quintana, 2020), intra-temporal choices of households are governed by elasticity of substitution among the necessary and discretionary group of commodities i.e. Using annual data for the period 2004-234 and group-level inflation, the effects of the drivers are derived using dynamic panel estimates. The estimates show that the elasticity of substitution among the necessary items is lower than for discretionary items. The interest rate adversely impacts the consumption of discretionary items. Income effects strengthen the consumption of all items, and the effect is marginally higher on discretionary consumption items. Policy uncertainty dampens discretionary consumption demand (Table III.1.1). Accommodative monetary policy helped offset the adverse effects of higher economic uncertainty, which led to lower consumption of discretionary items in the post-pandemic period, while essential spending remained largely unaffected. With the ongoing economic recovery, discretionary spending is expected to recover steadily as income strengthens. A watchful monetary policy restricts the spillover of price pressure to discretionary spending, facilitating a rebound of aggregate demand. | Table III.1.1: Dynamic Panel Estimates of Drivers of Consumption Growth | | | PFCE | PFCE | PFCE | PFCE | | (1) | (2) | (3) | (4) | | PFCE(-1) | -0.020* | -0.020* | -0.079* | -0.079* | | | (0.011) | (0.012) | (0.039) | (0.041) | | (πi − π) × 1D | -0.634** | -0.634*** | -0.674*** | -0.674** | | | (0.257) | (0.195) | (0.256) | (0.267) | | (πi − π) × 1N | -0.251 | -0.251 | -0.124 | -0.124 | | | (0.161) | (0.290) | (0.163) | (0.319) | | Interest Rate (-1) × 1D | -1.286*** | -1.286* | -0.272 | -0.272 | | | (0.467) | (762) | (0.508) | (580) | | Interest Rate (-1) × 1N | -0.076 | -0.076 | 0.335 | 0.335 | | | (0.608) | (0.282) | (0.645) | (0.270) | | GDP (-1) × 1D | 1.823*** | 1.823*** | | | | | (0.238) | (0.519) | | | | GDP (-1) × 1N | 1.059*** | 1.059*** | | | | | (0.292) | (0.407) | | | | GNDI (-1) × 1D | | | 1.257*** | 1.257*** | | | | | (0.166) | (0.299) | | GNDI (-1) × 1N | | | 0.712*** | 0.712* | | | | | (0.217) | (0.364) | | Uncertainty × 1D | -0.025 | -0.025** | -0.037** | -0.037*** | | | (0.019) | (0.013) | (0.018) | (0.011) | | Uncertainty × 1N | -0.001 | -0.001 | -0.017 | -0.017 | | | (0.026) | (0.005) | (0.026) | (0.014) | | | - | Robust | - | Robust | Standard errors in parentheses
* p < 0.10, ** p < 0.05, *** p < 0.01 | References: Baker, S. R., N. Bloom, and S. J. Davis (2016). Measuring Economic Policy Uncertainty, Quarterly Journal of Economics, 131(4), 1593-1636. Fernandez-Villaverde, Jesus and Pablo A. Guerron-Quintana (2020). Uncertainty Shocks and Business Cycle Research. Review of Economic Dynamics. 37, 118-146. Kydland, F. E., and Prescott, E. C. (1982). Time to Build and Aggregate Fluctuations. Econometrica, 50(6), 1345–1370. Patra, M. D., Mohan R., John J., and Bhattacharya I. (2023). Measuring Uncertainty: An Indian Perspective. RBI Bulletin, October, 169-178. |
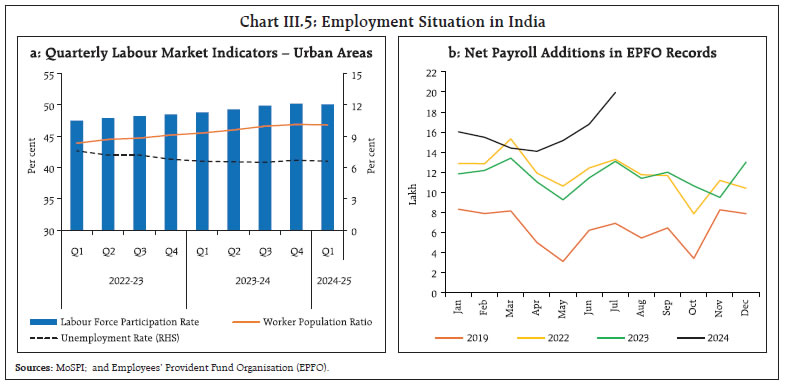 Employment conditions remained robust in Q1:2024-25, though labour force participation rate (LFPR) and employment rate (ER) under the Urban Periodic Labour Force Survey (PLFS) moderated marginally relative to the previous quarter. However, both indicators recorded the second highest reading since the survey’s inception. The unemployment rate in urban areas declined during Q1 to 6.6 per cent, one of the lowest in the PLFS series (Chart III.5a). The Employees’ Provident Fund Organisation (EPFO) payrolls data also point to strengthening of formal employment as net payroll additions rose by 47.2 per cent y-o-y in April-July 2024. The net payroll additions were higher than in previous years (Chart III.5b). III.1.2 Gross Fixed Capital Formation Gross fixed capital formation (GFCF) expanded by 7.5 per cent in Q1:2024-25 despite contraction in government capex, reflecting robust private sector investment. The share of GFCF in GDP at 34.8 per cent in Q1, is the highest since Q2:2012-13. Amongst the key underlying indicators, import of capital goods expanded strongly during April-August, led by electronic goods, transport equipment and electrical and non-electrical machinery (Chart III.6a). Construction activity gathered momentum on the back of an ebullient housing sector. Among the coincident indicators of construction activity, steel consumption recorded double digit growth in April-August 2024, but cement production posted a modest expansion during April-August mainly due to the heat wave in April and monsoon rains since June 2024 (Chart III.6c and d). Capacity utilisation (CU) in the manufacturing sector5 recorded a seasonal dip to 74.0 per cent in Q1:2024-25 from 76.8 per cent in Q4:2023-24. Seasonally adjusted capacity utilisation improved from 74.6 to 75.8 and is well above the long-term average of 73.8 per cent6 (Chart III.7). Stretched capacity utilisation necessitates new capacity additions to keep pace with underlying domestic demand. Funds raised for capex by private corporates during Q1:2024-25 through the different channels (banks/FIs, ECBs, IPOs) remained strong, indicating upbeat investment sentiment. The interest coverage ratio (ICR)7 of listed private manufacturing companies improved in Q1:2024-25, indicating comfortable debt servicing capacity and conducive conditions for expansion in capacity. Within the services sector, the ICR of IT companies remained stable while that of non-IT companies stayed above the threshold level of unity (Chart III.8).
III.1.3 Government Consumption Government final consumption expenditure (GFCE) contracted by 0.2 per cent (y-o-y) in Q1:2024-25, pulling down overall GDP growth (Table III.1). The Government of India’s (GoI) revenue expenditure excluding interest payments and major subsidies registered a modest increase of 3.1 per cent (y-o-y) during April-August 2024, whereas the capital expenditure contracted by 19.5 per cent during the same period8 (Chart III.9a). The revenue expenditure to capital outlay (RECO) ratio at 5.2 in April-August (4.1 a year ago) suggests some moderation in expenditure quality during the period. However, revenue deficit as per cent of gross fiscal deficit improved to 32.9 during the period (44.2 per cent a year ago) [Chart III.9b]. The Union Budget for 2024-25 reiterated the commitment towards fiscal prudence by budgeting a gross fiscal deficit (GFD) of 4.9 per cent of GDP, a drop of 66 basis points from the provisional actuals of 2023-24. This is in line with the medium-term target of achieving a GFD of less than 4.5 per cent of GDP by 2025-26. The quality of expenditure is budgeted to improve, with revenue expenditure to capital outlay ratio declining to an all-time low of 4.0. Moreover, capital expenditure is budgeted to increase to a two-decade high of 3.4 per cent of GDP in 2024-25 from 3.2 per cent in provisional actuals of 2023-24, which is expected to support growth during the year. On the receipts side, the central government’s gross tax revenues increased by a 12.1 per cent (y-o-y) during April-August 2024, driven by a rise in income tax revenue. Indirect tax revenue expanded by 10.0 per cent (y-o-y), aided by goods and services tax (GST) collections (centre plus states) and customs duty collections. Overall, the robust tax collection is reflective of buoyant economy and effective enforcement by the tax authorities (Chart III.10). Custom duty receipts recorded a robust y-o-y increase of 12.9 per cent, whereas union excise duties grew by 4.2 per cent (y-o-y). Overall, net tax revenue of the central government increased by 8.7 per cent during April-August 2024 (Table III.2). Non-tax revenue receipts recorded a growth of 59.6 per cent primarily on the back of a surplus transfer of ₹2.1 lakh crore from the Reserve Bank, which was significantly higher than ₹87,416 crore transferred last year (Chart III.11). Accordingly, the central government’s gross fiscal deficit (GFD) during April-August 2024 stood at 27.0 per cent of the budget estimates, substantially lower than a year ago. | Table III.2: Central Government’s Tax Collections | | Item | ₹ thousand crore | Per cent | | BE | Actuals | Per cent to BE | Growth Rate | | 2023-24 | 2024-25 | Apr-Aug 2023 | Apr-Aug 2024 | Apr-Aug 2023 | Apr-Aug 2024 | Apr-Aug 2023 | Apr-Aug 2024 | | A. Direct taxes | 1,823.3 | 2,207.0 | 609.8 | 695.6 | 33.4 | 31.5 | 26.2 | 14.1 | | Of which | | | | | | | | | | 1. Corporation tax | 922.7 | 1,020.0 | 238.9 | 224.6 | 25.9 | 22.0 | 15.1 | -6.0 | | 2. Income tax | 873.0 | 1,150.0 | 360.4 | 452.3 | 41.3 | 39.3 | 35.7 | 25.5 | | B. Indirect taxes | 1,537.6 | 1,633.2 | 579.4 | 637.1 | 37.7 | 39.0 | 7.8 | 10.0 | | Of which | | | | | | | | | | 1. Total GST | 960.5 | 1,066.8 | 392.7 | 432.5 | 40.9 | 40.5 | 10.6 | 10.2 | | 2. Custom duties | 233.1 | 237.7 | 83.5 | 94.3 | 35.8 | 39.7 | 27.8 | 12.9 | | 3. Union excise duties | 339.0 | 324.0 | 99.8 | 104.0 | 29.4 | 32.1 | -12.4 | 4.2 | | C. Gross tax revenue | 3,360.9 | 3,840.2 | 1189.2 | 1332.7 | 35.4 | 34.7 | 16.5 | 12.1 | | D. Assignment to States/UTs | 1,021.4 | 1,247.2 | 382.5 | 455.7 | 37.4 | 36.5 | 20.4 | 19.1 | | E. Net tax revenue | 2,330.6 | 2,583.5 | 803.9 | 873.8 | 34.5 | 33.8 | 14.8 | 8.7 | Note: BE: Budget Estimates.
Sources: Union Budget Documents; and CGA. | The consolidated GFD of state governments is budgeted at 3.1 per cent of GDP in 2024-25, marginally higher than 2.9 per cent in 2023-24 provisional accounts (PA). Growth in revenue receipts is budgeted to accelerate to 19.1 per cent. States’ capital spending is expected to rise by 21.0 per cent in 2024-25 on top of 23.4 per cent growth a year ago. The revenue deficit (RD) is expected to remain stable at 0.2 per cent of GDP (Table III.3 and Chart III.12).
| Table III.3: State Government Finances - Key Deficit Indicators | | (Per cent to GDP) | | | 2022-23 (A) | 2023-24 (PA) | 2024-25 (BE) | | Revenue Deficit | 0.2 | 0.2 | 0.2 | | Gross Fiscal Deficit | 2.7 | 2.9 | 3.1 | | Primary Deficit | 1.0 | 1.4 | 1.4 | Notes: A: Actuals; PA: Provisional Accounts; BE: Budget Estimates.
Data pertain to 31 States/UTs.
Sources: Budget Documents of State Governments; and Comptroller and Auditor General (CAG) of India. | As per the data available for April-July 2024-25, states’ GFD increased due to higher revenue expenditure and a contraction in grants from the GoI (Chart III.13a). Both tax and non-tax revenues, however, recorded robust growth (Chart III.13b). Meanwhile, on a y-o-y basis, capital expenditure declined. The Union Budget 2024-25 has made a provision of ₹1.5 lakh crore for long-term interest-free loans, which could assist States in boosting their capital spending. The Union Budget for 2024-25 allocated gross and net market borrowings via dated securities amounting to ₹14.01 lakh crore and ₹11.63 lakh crore, respectively. In the first half of the fiscal year, the central government’s gross market borrowings amounted to ₹7.40 lakh crore, accounting for 52.8 per cent of the annual budget estimates (Table III.4). The weighted average yield of these issuances during this period was 7.0 per cent, marginally lower than 7.2 per cent recorded in the previous year, while the weighted average maturity elongated to 20.7 years, up from 17.6 years. During H2, the Centre has planned gross market borrowings through dated securities of ₹6.61 lakh crore. Concurrently, States raised ₹3.86 lakh crore in gross market borrowings during H1:2024-25, against an indicative calendar amount of ₹5.18 lakh crore. 
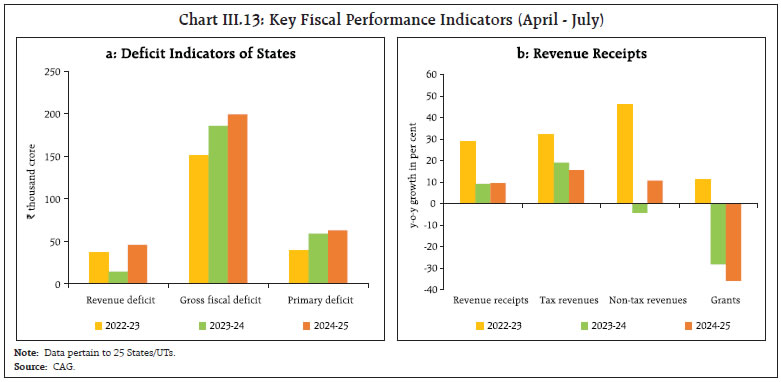
| Table III.4: Government Market Borrowings | | (₹ crore) | | | 2022-23 | 2023-24 | 2024-25 (April to September 30) | | Centre | States | Total | Centre | States | Total | Centre | States | Total | | Net borrowings | 11,08,261 | 5,18,830 | 16,27,091 | 11,80,456 | 7,17,140 | 18,97,596 | 5,74,399 | 2,63,271 | 8,37,670 | | Gross borrowings | 14,21,000 | 7,58,392 | 21,79,392 | 15,43,000 | 10,07,058 | 25,50,058 | 7,39,697 | 3,85,637 | 11,25,334 | | Sources: Government of India; and RBI staff estimates. | For Q3:2024-25, the indicative calendar has placed states’ gross market borrowings at ₹3.20 lakh crore. To meet the transitory mismatches between receipts and expenditures, the Ways and Means Advances (WMA) limit for the GoI was set at ₹1.5 lakh crore for H1:2024-25; it has been fixed at ₹50,000 crore for H2. Taking into account the recent expenditure trends, the WMA limits for States and Union Territories have been increased to ₹60,118 crore from the previous limit of ₹47,010 crore, effective from July 1, 2024.9 III.1.4 External Demand India’s external demand revived in H1:2024-25 (April-August), buoyed by a recovery in global trade. Merchandise exports (US$) expanded by 1.1 per cent (y-o-y) during April-August 2024, while merchandise imports rose by 7.1 per cent (y-o-y) during this period. Consequently, the merchandise trade deficit widened to US$ 116.7 billion from US$ 99.2 billion during the corresponding period a year ago (Chart III.14). As per the estimates released by the NSO, exports of goods and services increased by 8.7 per cent y-o-y in real terms in Q1:2024-25, and imports of goods and services grew by 4.4 per cent. 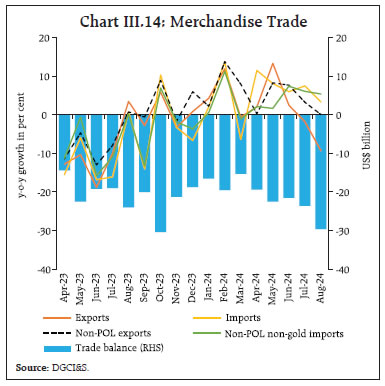 Merchandise exports growth, after experiencing a pickup in Q1:2024-25, contracted in Q2 (up to August). For H1:2024-25 (April-August), the growth in merchandise exports was mainly led by electronic goods, engineering goods, drugs and pharmaceuticals, readymade garments, and organic and inorganic chemicals. On the other hand, petroleum products, gems and jewellery, rice, marine products, and iron ore dragged down exports (Chart III.15). The expansion in merchandise imports in H1:2024-25 (April-August) was driven by higher imports of petroleum, oil and lubricants (POL), gold and non-POL non-gold commodities such as electronic goods, transport equipment, and silver. Import of pearls, precious and semi-precious stones, chemical material and products, coal, coke and briquettes, fertilisers, and dyeing materials contributed negatively to the overall import growth (Chart III.16). POL imports grew by 9.2 per cent (y-o-y) to US$ 76.4 billion in H1 (April-August), while non-POL non-gold imports rose by 4.5 per cent (y-o-y) to US$ 196.2 billion during this period. Services exports remained buoyant, with a growth of 9.8 per cent y-o-y in Q1:2024-25 and 10.9 per cent in July-August 2024 (Chart III.17). The growth in services exports was mainly driven by software, business, transportation and travel services, reflecting improving global demand for Indian services. Among the major exporters of services globally, India retained its position in the top ten exporting countries during January-June 2024. Services imports moved out of the contractionary zone, posting a 7.2 per cent y-o-y growth in Q1 and 12.1 per cent in July-August 2024 on the back of buoyant domestic demand. 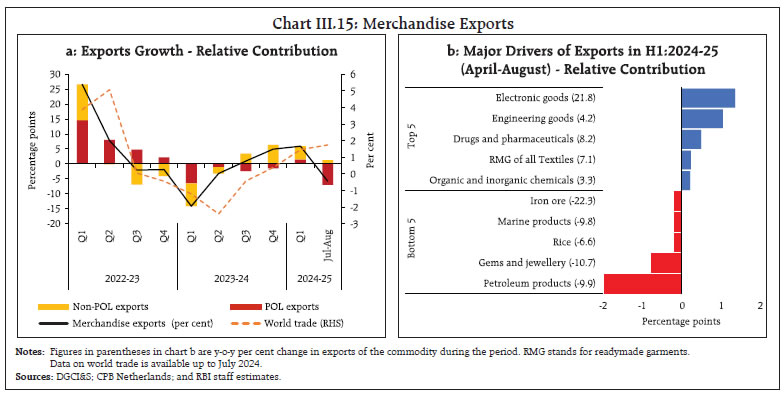 On a balance of payments basis, the current account deficit widened marginally to 1.1 per cent of GDP in Q1:2024-25 from a deficit of 1.0 per cent of GDP in Q1:2023-24 and a surplus of 0.5 per cent of GDP in Q4:2023-24, mainly due to higher merchandise trade deficit. For the fiscal year 2023-24, the current account deficit (CAD) narrowed to 0.7 per cent of GDP from 2.0 per cent in 2022-23, driven by a lower merchandise trade deficit, robust services exports and substantial inward remittances. 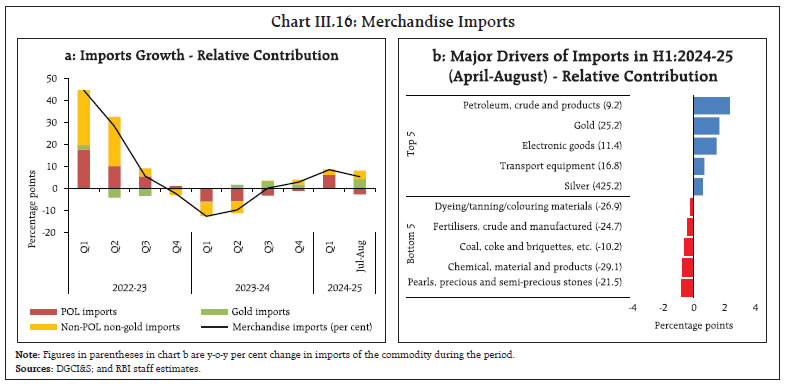
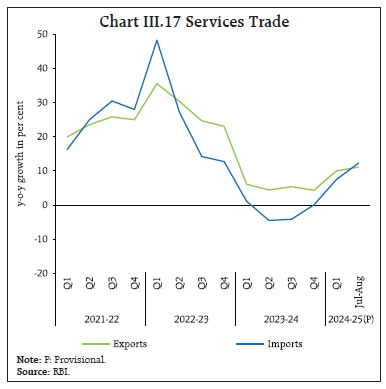 In the financial account, net FDI flows increased to US$ 4.9 billion in April-July 2024 from US$ 3.8 billion a year ago, on account of robust gross equity inflows (Chart III.18). Singapore, Mauritius, Netherlands, USA and Belgium were the major sources of FDI inflows, accounting for a share of 70.8 per cent. On the sectoral front, manufacturing, financial services, communication services, computer services and electricity and other generation, distribution and transmission attracted the majority of FDI equity inflows with a share of 77.3 per cent. Foreign portfolio investment (FPI) moderated in Q1:2024-25 mainly due to net outflows in equities, though debt inflows have remained robust after the announcement of inclusion of Indian government bonds in the J.P.Morgan’s benchmark emerging market index. FPI inflows, however, registered a turnaround in Q2:2024-25 with continued surge in debt inflows and a revival in equity flows. FPI inflows of US$ 20.1 billion were recorded in H1: 2024-25 as against net inflows of US$ 20.3 billion a year ago. 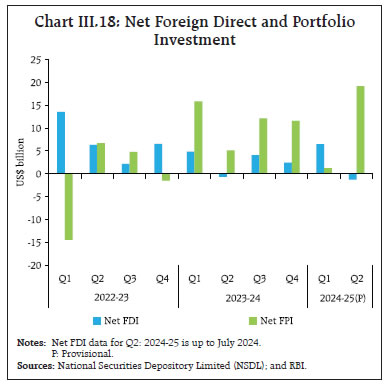 External commercial borrowing flows moderated to US$ 3.6 billion in April-August 2024 from US$ 4.3 billion a year ago. On the other hand, net accretions to non-resident deposits surged to US$ 5.8 billion in April-July 2024 from US$ 3.0 billion a year ago, led by higher inflows in all three accounts [foreign currency non-resident (FCNR), non-resident external (NRE) and non-resident ordinary (NRO) accounts]. As on September 27, 2024 India’s foreign exchange reserves amounted to US$ 704.9 billion, equivalent to 12.1 months of annualised merchandise imports as per BoP basis and 103.3 per cent of outstanding external debt at end-June 2024. III.2 Aggregate Supply Aggregate supply – measured by real gross value added (GVA) at basic prices – expanded by 6.8 per cent y-o-y in Q1:2024-25 (8.3 per cent a year ago)- a three-quarter high, supported by industry and services (Table III.5). The momentum of GVA improved over the previous quarter (Chart III.19). III.2.1 Agriculture Real GVA in agriculture, forestry and fishing slowed to 2.0 per cent in Q1:2024-25 (3.7 per cent a year ago) on account of muted growth in foodgrains production during rabi and summer seasons. The southwest monsoon (SWM) commenced at a sluggish pace in June; however, it gained momentum from July onwards. By July 2, 2024, monsoon rainfall had covered the whole country and precipitation turned into a surplus of 8 per cent by September 30, 2024 (Chart III.20a). Out of the 36 sub-divisions, 33 experienced normal or above-normal rainfall, reflecting a broadly equitable distribution (Chart III.20b). The robust progression of monsoon rains enabled increased acreage of kharif sowing, which saw a 1.9 per cent rise over the previous year and exceeded normal sowing levels by 1.7 per cent as of September 27, 2024. The area devoted to all major crops, barring cotton, was greater than in the previous year. Specifically, the area under rice – constituting nearly 37 per cent of the kharif sowing area – rose by 2.5 per cent from the previous year’s acreage. Similarly, the area covered by pulses and oilseeds sowing expanded by 7.4 per cent and 2.7 per cent, respectively (Chart III.20c). The enhanced rainfall also facilitated the replenishment of reservoir levels to 87 per cent of total capacity as of September 26, 2024, a marked improvement from the historically low levels recorded in June 2024 (Chart III.20d). With these elevated reservoir levels and the anticipated onset of La Niña later in the year, the outlook for rabi crop appears promising. As of September 30, 2024 the production-weighted rainfall index (PRN) stood at 107 per cent, surpassing the 93 per cent level recorded during the same period last year (Chart III.20e). The resurgence of rainfall in the North-Western states of India contributed to a higher PRN relative to the previous year. Furthermore, the crop-specific PRN exceeded both last year's position and the five-year average across all crops (Chart III.20f). | Table III.5: Real GVA Growth | | (y-o-y, per cent) | | Sector | 2022-23 | 2023-24 | Weighted Contribution | 2022-23 | 2023-24 | 2024-25 | | (FRE) | (PE) | 2022-23 | 2023-24 | Q1 | Q2 | Q3 | Q4 | Q1 | Q2 | Q3 | Q4 | Q1 | | Agriculture, forestry and fishing | 4.7 | 1.4 | 0.7 | 0.2 | 2.7 | 2.3 | 5.2 | 7.6 | 3.7 | 1.7 | 0.4 | 0.6 | 2.0 | | Industry | -0.6 | 9.3 | -0.1 | 2.0 | 4.0 | -5.5 | -2.8 | 1.7 | 5.0 | 13.6 | 10.8 | 8.3 | 7.4 | | Mining and quarrying | 1.9 | 7.1 | 0.0 | 0.2 | 6.6 | -4.1 | 1.4 | 2.9 | 7.0 | 11.1 | 7.5 | 4.3 | 7.2 | | Manufacturing | -2.2 | 9.9 | -0.4 | 1.7 | 2.2 | -7.2 | -4.8 | 0.9 | 5.0 | 14.3 | 11.5 | 8.9 | 7.0 | | Electricity, gas, water supply and other utilities | 9.4 | 7.5 | 0.2 | 0.2 | 15.6 | 6.4 | 8.7 | 7.3 | 3.2 | 10.5 | 9.0 | 7.7 | 10.4 | | Services | 9.9 | 7.9 | 6.1 | 5.0 | 16.4 | 9.4 | 7.5 | 7.3 | 10.4 | 6.9 | 7.5 | 7.0 | 7.7 | | Construction | 9.4 | 9.9 | 0.8 | 0.9 | 14.7 | 6.9 | 9.5 | 7.4 | 8.6 | 13.6 | 9.6 | 8.7 | 10.5 | | Trade, hotels, transport, communication | 12.0 | 6.4 | 2.1 | 1.2 | 22.1 | 13.2 | 9.2 | 7.0 | 9.7 | 4.5 | 6.9 | 5.1 | 5.7 | | Financial, real estate and professional services | 9.1 | 8.4 | 2.0 | 1.9 | 10.5 | 8.7 | 7.7 | 9.2 | 12.6 | 6.2 | 7.0 | 7.6 | 7.1 | | Public administration, defence and other services | 8.9 | 7.8 | 1.1 | 1.0 | 23.6 | 7.3 | 3.5 | 4.7 | 8.3 | 7.7 | 7.5 | 7.8 | 9.5 | | GVA at basic prices | 6.7 | 7.2 | 6.7 | 7.2 | 11.3 | 5.0 | 4.8 | 6.0 | 8.3 | 7.7 | 6.8 | 6.3 | 6.8 | Note: FRE: First revised estimates; PE: Provisional estimates.
Sources: NSO; and RBI staff estimates. |
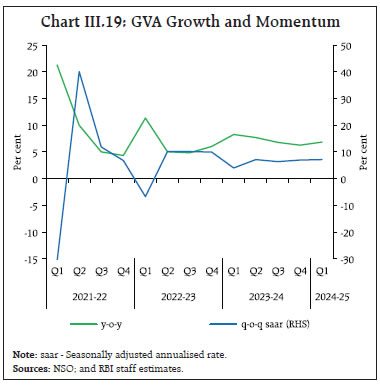

According to the final estimates of crop production for 2023-24, total foodgrain production at 3,323 lakh tonnes recoded an increase of 0.8 per cent over the final estimates of 2022-23 and 1.0 per cent over the third advance estimates of 2023-24. Among major crops, rice and wheat production increased on y-o-y basis by 1.5 per cent and 2.5 per cent, respectively, whereas coarse cereals, pulses, oilseeds, sugarcane and cotton recorded a decline in production during the year (Table III.6). The government announced an increase of 1.4–12.7 per cent in minimum support prices (MSP) for kharif 2024-25 crops, ensuring a return of at least 50 per cent over the cost of production (as measured by A2 plus FL10). This adjustment aligns with the Government’s recent efforts to recalibrate MSPs in favour of oilseeds, pulses, and nutri-cereals, aiming to foster crop diversification, rectify the demand-supply disparity, and advance sustainable agricultural practices. Procurement of rice during the kharif marketing season 2023-24 (up to September 30, 2024) at 525.4 lakh tonnes was 7.7 per cent lower than in the previous year. Despite this reduction, the stock of rice held by the Food Corporation of India at 408.8 lakh tonnes as of September 16, 2024 was the highest ever held by them compared to the corresponding date in the previous years and is 3 times the quarterly buffer norms. Rice allocation under the Open Market Sales Scheme (OMSS) fell way short of the target, partly owing to subdued demand for the variety of rice offered by the corporation (Chart III.21a). In contrast, wheat procurement during the rabi marketing season 2024-25 stood at 266.1 lakh tonnes, reflecting a 1.6 per cent increase over the previous year. The wheat stock of 246.8 lakh tonnes, however, fell short of the buffer requirement by 29.0 lakh tonnes (Chart III.21b). | Table III.6: Agriculture Production in 2023-24 | | (Lakh tonnes) | | Item | 2022-23 | 2023-24 | Variation in 2023-24 (Per cent) | | Final | Third AE | Final | Over Third AE 2023-24 | Over 2022-23 | | Foodgrains | 3296.9 | 3288.5 | 3323.0 | 1.0 | 0.8 | | Kharif | 1557.1 | 1566.8 | 1557.7 | -0.6 | 0.0 | | Rabi | 1578.4 | 1576.6 | 1600.1 | 1.5 | 1.4 | | Summer | 161.4 | 145.2 | 165.2 | 13.8 | 2.4 | | Rice | 1357.6 | 1367.0 | 1378.3 | 0.8 | 1.5 | | Wheat | 1105.5 | 1129.3 | 1132.9 | 0.3 | 2.5 | | Coarse Cereals | 573.2 | 547.3 | 569.4 | 4.0 | -0.7 | | Pulses | 260.6 | 244.9 | 242.5 | -1.0 | -7.0 | | Oilseeds | 413.6 | 395.9 | 396.7 | 0.2 | -4.1 | | Sugarcane | 4905.3 | 4425.2 | 4531.6 | 2.4 | -7.6 | | Cotton# | 336.6 | 325.2 | 325.2 | 0.0 | -3.4 | | Jute & Mesta## | 93.9 | 97.1 | 96.9 | -0.2 | 3.2 | Notes: #: Lakh bales of 170 kgs each; # #: Lakh bales of 180 kgs each.
AE: Advance estimates
Source: Ministry of Agriculture and Farmers’ Welfare. |
III.2.2 Industry Industrial GVA expanded by 7.4 per cent in Q1:2024-25 (5.0 per cent a year ago), primarily on account of stronger manufacturing activity than a year ago, despite some build-up of supply chain pressures due to the rise in global freight and container costs. Manufacturing GVA expanded by 7.0 per cent y-o-y during Q1 on top of 8.9 per cent growth in Q4. GVA in mining and electricity, gas, water supply, and other utility services increased at a pace of 7.2 per cent and 10.4 per cent y-o-y, respectively, during Q1 (Chart III.22). The index of industrial production (IIP) grew by 5.4 per cent in Q1:2024-25 and 4.8 per cent in July, with support from all constituents – mining, manufacturing, and electricity generation (Chart III.23 and Table III.7). Mining and quarrying recorded a growth of 7.9 per cent in Q1 and 3.7 per cent in July. Manufacturing recorded an expansion of 4.1 per cent in Q1 (5.1 per cent during the previous year) and 4.6 per cent in July, while electricity registered a robust expansion of 10.8 per cent in Q1 (1.3 per cent during the previous year) and 7.9 per cent in July. While the production of basic metals, electrical equipment, motor vehicles and other transport equipment recorded an upsurge in Q1 and July, food products, textiles, and leather and related products acted as a drag on growth. In terms of the use-based classification, primary, capital, intermediate, infrastructure and consumer durables rose during Q1 and July. Consumer non-durable goods, however, registered a contraction during this period. Electricity, gas, water supply and other utility services remained strong and posted a growth of 10.4 per cent y-o-y in Q1, reflecting underlying demand conditions. Electricity generation rose sharply by 7.2 per cent y-o-y during April-August 2024 (5.5 per cent a year ago), driven by thermal power generation which registered a growth of 7.8 per cent. Renewable energy sources, with a share of around 14.0 per cent in total electricity generation, registered a growth of 6.1 per cent during April-August 2024 (Chart III.24a). Region-wise, electricity demand remained strong in all regions during April-August 2024, with a sharp pick-up in demand from the northern region amidst extended spells of heatwaves, except a marginal moderation in western region. Electricity demand contracted in August 2024 owing to a high base (Chart III.24b). 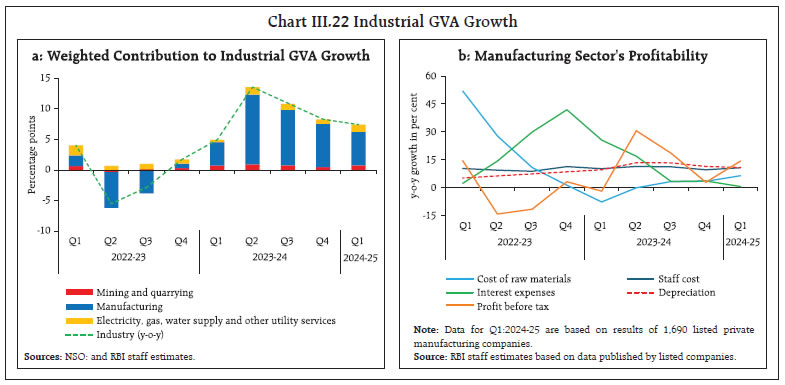
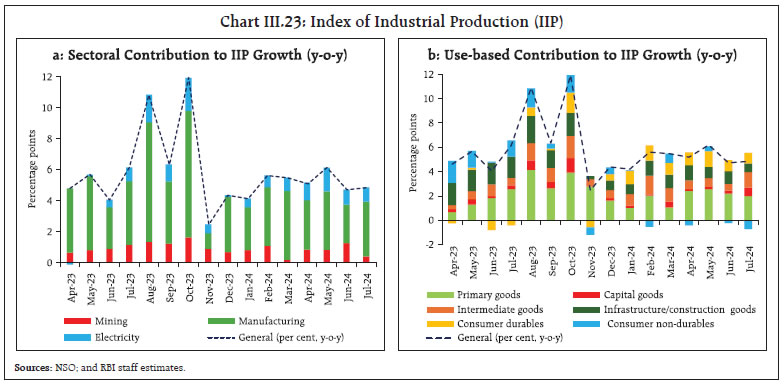
| Table III.7: Industrial Sector y-o-y growth | | (per cent) | | | Indicators | 2023-24 | 2024-25 | | Q1 | Q2 | Q3 | Q4 | Q1 | Jul | Aug | Sep | | 1 | PMI: Manufacturing | 57.9 | 57.9 | 55.5 | 57.5 | 58.2 | 58.1 | 57.5 | 56.5 | | | (>50 indicates growth over previous month) | | | | | | | | | | 2 | Index of Industrial Production (IIP) | 4.8 | 7.8 | 6.1 | 5.1 | 5.4 | 4.8 | | | | 3 | IIP: Manufacturing | 5.1 | 6.8 | 5.4 | 4.8 | 4.1 | 4.6 | | | | 4 | IIP: Primary goods | 3.6 | 9.3 | 8.1 | 3.9 | 6.9 | 5.9 | | | | 5 | IIP: Capital goods | 5.1 | 8.8 | 7.5 | 4.1 | 3.2 | 12.0 | | | | 6 | IIP: Infrastructure and construction goods | 13.2 | 12.8 | 6.5 | 7.1 | 7.3 | 4.9 | | | | 7 | IIP: Consumer durables | -2.7 | 1.1 | 5.3 | 11.2 | 10.6 | 8.2 | | | | 8 | IIP: Consumer non-durables | 6.8 | 7.0 | 2.5 | 0.7 | -0.5 | -4.4 | | | | 9 | Eight Core Industries (ECI) | 6.0 | 10.5 | 8.4 | 5.8 | 6.3 | 6.1 | -1.8 | | | 10 | ECI: Steel | 16.5 | 15.4 | 10.5 | 8.7 | 8.5 | 6.4 | 4.5 | | | 11 | ECI: Cement | 12.7 | 10.3 | 5.1 | 7.6 | 0.5 | 5.5 | -3.0 | | | 12 | Electricity demand | 1.5 | 13.9 | 9.9 | 8.1 | 10.2 | 4.0 | -6.5 | | | | Production of Automobiles | | | | | | | | | | 13 | Passenger vehicles | 7.0 | 5.6 | 5.0 | 9.7 | 5.8 | 1.2 | 0.7 | | | 14 | Two wheelers | 1.3 | -1.5 | 19.0 | 26.4 | 19.6 | 21.1 | 4.9 | | | 15 | Three wheelers | 24.4 | 19.6 | 13.4 | 8.4 | 9.4 | 6.0 | 9.0 | | | 16 | Tractors | -8.9 | -10.1 | -13.0 | -15.1 | 1.0 | 8.1 | -1.0 | | | Sources: MOSPI; Office of Economic Adviser; CEIC; NSO; SIAM; HSBC, S&P Global; and RBI staff estimates. |
 The manufacturing purchasing managers’ index (PMI) stayed in expansion mode all through H1:2024-25, though it eased to 57.4 in Q2 from 58.2 in Q1 with a moderation in new orders-both domestic and exports. The future output index moderated marginally but remained in expansion at 63.9 in H1 (Chart III.25a). III.2.3 Services Services remained the mainstay of the economy, with a contribution of over 70 per cent to GVA growth in Q1:2024-25. Services sector GVA growth accelerated to 7.7 per cent in Q1 from 7.0 per cent in Q4:2023-24, with the impetus from construction activity; financial, real estate and professional services; and public administration, defence and other services (Chart III.26a). High frequency indicators point to strong construction activity in H1;2024-25 (up to August) – steel consumption recorded a robust growth, while cement production remained subdued on account of heat waves, and an unfavourable base effect (Chart III.26b). 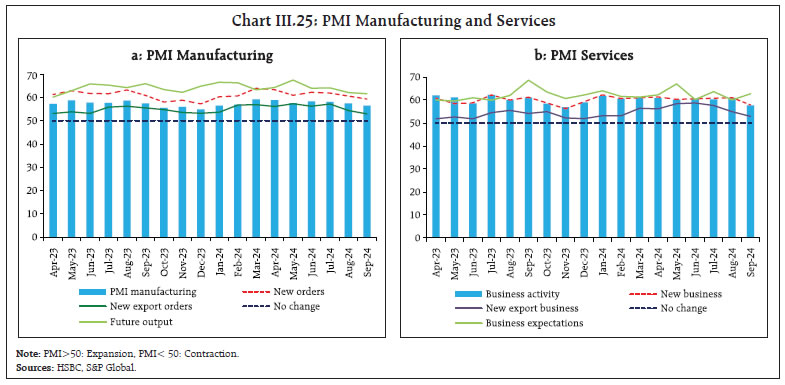 GVA growth of trade, hotels, transport, and communication accelerated to 5.7 per cent y-o-y in Q1:2024-25 (5.1 per cent in Q4:2023-24). GST collections and issuances of e-way bills – indicators of wholesale and retail trade – point towards robust economic activity. Domestic air passenger traffic improved in H1:2024-25, reflecting sustained growth in tourism and business-related travel. Indicators of transportation services displayed a mixed picture – commercial vehicle sales growth rebounded in Q1:2024-25 following a contraction in Q4:2023-24; the growth in toll collections remained subdued in Q1 before improving in Q2; port cargo and railway freight traffic recorded a modest growth of 5.0 per cent and 3.9 per cent, respectively, in H1; 2024-25 (up to August). Real GVA growth in financial, real estate and professional services rose by 7.1 per cent y-o-y in Q1:2024-25 and was a major contributor to service sector GVA growth (38.1 per cent) as well as to aggregate GVA growth (27.7 per cent). Bank credit and deposits expanded by 14.4 per cent (y-o-y) and 12.0 per cent, respectively, as on September 20, 2024 suggesting continued buoyancy in financial services. Moreover, the growth of insurance premia in both life and non-life segments remained healthy in H1 (April-August) (Table III.8). Nominal sales of non-IT services grew by 6.3 per cent during Q1:2024-25 as against 10.4 per cent during Q4:2023-24. The performance of the IT sector improved in Q1 after decelerating in the previous six quarters (Chart III.27). Real estate activity in Q1:2024-25 remained robust, with a moderation in unsold inventory as sales surpassed new launches for the third consecutive quarter (Chart III.28a). The growth in all-India housing prices moderated in Q1:2024-25; largely due to a drop in prices in Delhi (Chart III.28b). Public administration, defence, and other services (PADO) grew at an 8-quarter high of 9.5 per cent y-o-y in Q1:2024-25. The centre’s revenue expenditure, excluding interest payments and subsidies, contracted by 1.5 per cent in Q1 before expanding by 9.6 per cent during July-August. Healthy growth in other services like health, education and other personal services, however, helped in offsetting muted government consumption in Q1. 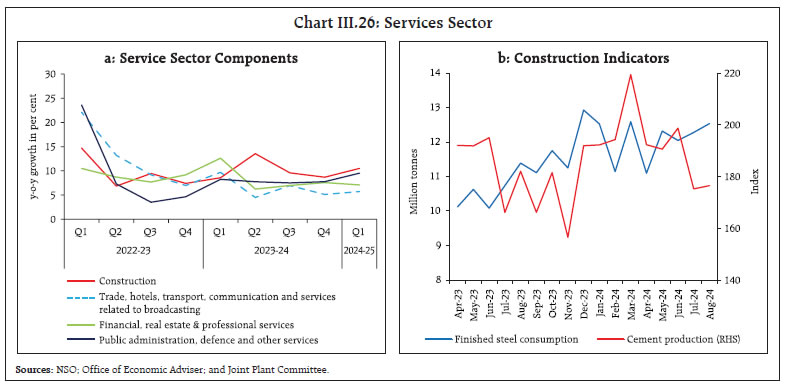
| Table III.8: Services Sector y-o-y growth | | (per cent) | | | Indicators | 2023-24 | 2024-25 | | Q1 | Q2 | Q3 | Q4 | Q1 | Jul | Aug | Sep | | 1 | PMI: Services (>50 indicates growth over previous month) | 60.6 | 61.1 | 58.1 | 61.2 | 60.5 | 60.3 | 60.9 | 57.7 | | | Construction | | | | | | | | | | 2 | Steel consumption | 12.1 | 17.6 | 14.5 | 10.7 | 15.0 | 14.4 | 10.0 | | | 3 | Cement production | 12.7 | 10.3 | 5.1 | 7.6 | 0.5 | 5.5 | -3.0 | | | | Trade, Hotels, Transport, Communication and Services related to Broadcasting | | | | | | | | | | 4 | Commercial vehicle sales | -3.5 | 6.9 | 3.5 | -3.8 | 3.5 | | | | | 5 | Domestic air passenger traffic | 19.1 | 23.0 | 9.1 | 5.2 | 5.6 | 7.6 | 6.7 | | | 6 | Domestic air cargo | -4.7 | -1.0 | 9.5 | 10.0 | 7.1 | 8.8 | 0.6 | | | 7 | International air cargo | 0.1 | 3.7 | 10.7 | 23.9 | 18.4 | 24.4 | 20.7 | | | 8 | Freight traffic | 1.1 | 4.8 | 6.4 | 8.4 | 5.0 | 4.5 | 0.0 | | | 9 | Port cargo | 1.9 | 2.9 | 10.1 | 3.1 | 3.9 | 6.0 | 6.7 | | | 10 | Toll collection: volume | 15.4 | 13.3 | 12.8 | 10.9 | 5.6 | 9.4 | 6.8 | 6.5 | | 11 | Petroleum consumption | 6.4 | 6.3 | 2.1 | 5.5 | 3.9 | 10.6 | -2.3 | -1.6 | | 12 | GST E-way bill | 15.8 | 15.0 | 17.1 | 16.3 | 16.0 | 19.2 | 12.9 | 18.5 | | 13 | GST revenue | 11.6 | 10.6 | 12.9 | 11.5 | 10.2 | 10.3 | 10.0 | 6.5 | | | Financial, Real Estate and Professional Services | | | | | | | | | | 14 | Credit outstanding | 16.2 | 15.3 | 15.6 | 16.3 | 13.9 | 15.1 | 15.0 | 14.4 | | 15 | Bank deposits | 12.9 | 12.3 | 12.6 | 12.9 | 10.6 | 11.0 | 11.3 | 12.0 | | 16 | Life insurance premium | -0.9 | -21.2 | 5.4 | 26.0 | 22.9 | 14.2 | 21.9 | | | 17 | Non-life insurance premium | 17.8 | 12.6 | 12.1 | 9.5 | 13.3 | 9.3 | 4.2 | | | Sources: CEIC; NSO; HSBC, S&P Global; MOSPI; IRDAI; and RBI staff estimates. |
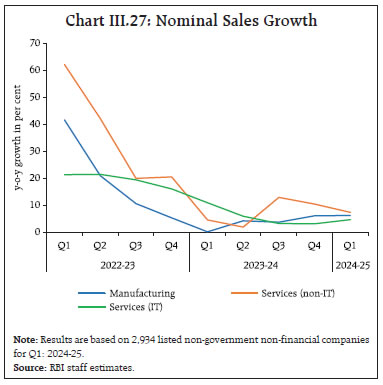 The services PMI remained in expansionary zone at 60.5 in Q1:2024-25 and 59.6 in Q2, slightly down from 61.2 in Q4:2023-24, supported by strong demand and new business activity (Chart III.25b). The composite PMI index declined marginally from 61.2 in Q4:2023-24 to 61.0 in Q1:2024-25, and further to 59.9 in Q2, PMI manufacturing and PMI services readings for India have remained the highest globally since July 2022 and April 2023, respectively. III.3 Conclusion Domestic economic activity has held up well in H1:2024-25, despite slowdown in government expenditure. Private consumption rebounded strongly, with rural demand augmenting sustained urban demand. Investment activity demonstrated resilience despite lower government capex in Q1:2024-25. Looking ahead, brighter agriculture prospects, sustained buoyancy in services, consumer and business optimism, the government’s continued thrust on capex and healthy balance sheets of banks and corporates should support economic activity. Geopolitical tensions and geo-economic fragmentation, volatility in global financial markets, unseasonal rains and weather disturbances pose downside risks to the domestic outlook. _________________________________________________________________________________
IV. Financial Markets and Liquidity Conditions Domestic financial markets exhibited orderly movements in contrast to volatile global market conditions during H1:2024-25. Money market rates evolved in line with liquidity shifts while long-term bond yields eased. Banks’ lending and deposit rates increased, reflecting ongoing monetary policy transmission. The Reserve Bank conducted two-way market operations while ensuring adequate liquidity to meet the productive requirements of the economy. Introduction During H1:2024-25, global financial markets sporadically turned volatile in response to changing perceptions on the future monetary policy trajectory, sparked by data releases. Global bond yields moderated in response to the improving inflation outlook and cooling labour markets. Global equity markets gained in H1 amidst intermittent bouts of sell-offs. The US dollar traded with a weakening bias and currencies of emerging market economies (EMEs) mirrored its movements, exacerbated by swings in capital flows. Since the second half of September, however, bond yields hardened and the dollar index firmed up reversing its earlier trend (see Chapter V for details). IV.1 Domestic Financial Markets In contrast to global developments, domestic financial markets remained relatively stable and resilient. Money market rates evolved in sync with liquidity shifts. Long-term government bond yields eased in response to domestic developments and global cues. Equity markets remained buoyant, with sporadic episodes of course corrections. The INR traded with a depreciating bias against the US dollar in H1 but remained among the least volatile major EME currencies. In the credit market, growth in bank credit outpaced deposit expansion although the wedge has narrowed more recently. IV.1.1 Money Market During H1:2024-25, liquidity conditions transitioned to surplus from deficit in H2:2023-24 (see Section IV.3 for details). As a result, overnight money market rates softened and generally remained within the Liquidity Adjustment Facility (LAF) corridor (Chart IV.1a). 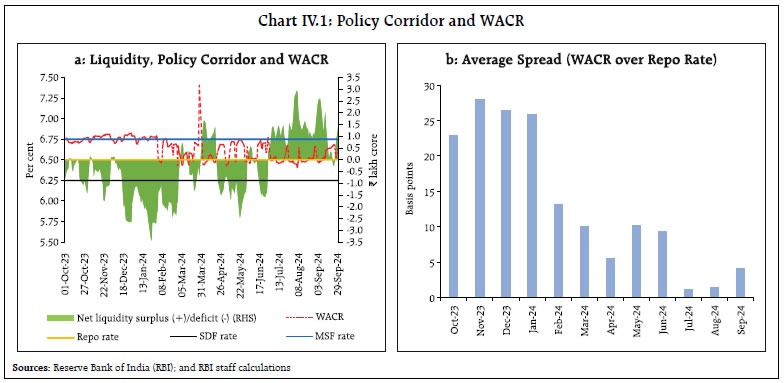 In response to the changing liquidity dynamics, the Reserve Bank conducted two-way operations under the LAF to ensure that the weighted average call rate (WACR) – the operating target of monetary policy – remained closely aligned with the policy repo rate. The WACR increased sharply during June 27-28 due to quarter-end liquidity tightness, also evident from a sudden spike in borrowings under the marginal standing facility (MSF). The WACR, which remained mostly above the repo rate until end-June 2024, moderated from July 2024 as liquidity conditions eased with a pick-up in government spending. At the end of H1 (September 30), however, the WACR increased by 15 bps on account of banks reducing their exposures in the uncollateralised market which incur higher Capital to Risk (Weighted) Assets Ratio (CRAR) requirements in the ensuing quarter.1 On an average basis, the WACR remained 5 basis points (bps) above the policy repo rate during H1, as compared with 21 bps in H2:2023-24 (Chart IV.1b). Volatility in the WACR, as measured by the coefficient of variation (CV), moderated to 1.61 per cent during H1 from 1.77 per cent during H2:2023-24. Movements in overnight rates in the collateralised segment, i.e., tri-party repo (TREPS) and market repo were broadly aligned with the WACR. 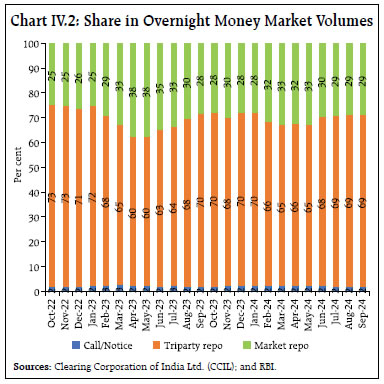 Money market activity was dominated by the collateralised segments, with their share in overnight money market volumes remaining unchanged at 98.0 per cent in H1 (Chart IV.2). Mutual funds (MFs) remained the major lenders in TREPS, although their share moderated to 65 per cent in H1 from 66 per cent in H2:2023-24. In the market repo segment, the share of MFs increased to 41 per cent in H1 from 33 per cent, with a concomitant decline in the share of foreign banks to 34 per cent from 43 per cent. On the borrowing side, public sector banks (PSBs) remained the dominant players in TREPS, with their share increasing to 47 per cent in H1 from 45 per cent in H2:2023-24. In market repo, however, their share reduced to 4 per cent from 9 per cent over the same period. In the longer-term segments of the money market, rates on commercial papers (CPs), certificates of deposit (CDs) and T-bills softened during H1 relative to H2:2023-24 due to improved liquidity in the banking system and reduced supply of shorter maturity T-bills (Chart IV.3). Rates on CPs issued by non-banking financial companies (NBFCs), however, remained elevated reflecting, inter alia, the increase in risk weights on bank lending to NBFCs announced by the Reserve Bank on November 16, 2023. The average spreads of T-bills, CDs and CPs over the MSF rate softened to zero, 49 bps and 61 bps, in H1 from 19 bps, 74 bps and 100 bps, respectively, in H2:2023-24. 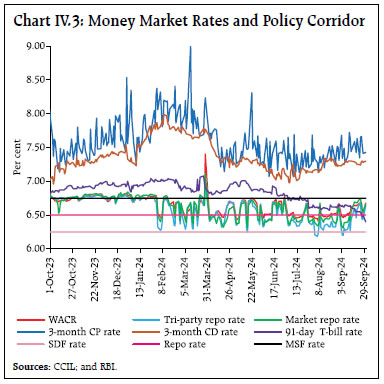 Fresh issuances of CDs moderated to ₹4.0 lakh crore in H1 from ₹5.5 lakh crore in H2:2023-24, mainly due to surplus liquidity conditions since July 2024. Within H1, CD issuances in the shorter tenor (up to 91-day) declined, with their share in total issuances reducing to 54 per cent in July 2024 from 84 per cent in May 2024. Concomitantly, the share of longer tenor CDs (181-365 days) increased to 45 per cent in July 2024 from 14 per cent in May 2024 (Chart IV.4). The persistent gap in credit and deposit growth prompted banks to explore alternative sources such as CDs of longer tenors to bridge the funding gap. Resource mobilisation through fresh issuances of CPs increased to ₹7.5 lakh crore during H1 from ₹6.7 lakh crore in H2:2023-24 (Chart IV.5a). Among fresh issuances, the average share of NBFCs increased to 32 per cent in H1 from 29 per cent in the corresponding period of the previous year. Thus, NBFCs have resorted to greater mobilisation of resources from the market in the wake of the November 2023 measures, as mentioned earlier. In the CP market, corporates were the major players with a share of 38 per cent in total issuances (Chart IV.5b).
| Table IV.1: Maturity Profile of CP Issuances | | (₹ lakh crore) | | Tenor | H1: 2023-24 | H2: 2023-24 | H1: 2024-25 | | 7- 30 days | 0.45 | 0.48 | 0.63 | | 31-90 days | 3.18 | 2.32 | 2.35 | | 91-180 days | 2.75 | 3.11 | 3.94 | | 181-365 days | 0.70 | 0.77 | 0.64 | | Total | 7.09 | 6.67 | 7.55 | | Outstanding (as at end-period) | 4.12 | 3.89 | 3.98 | | Sources: CCIL; F-TRAC; and RBI. | Among various maturity buckets, the 91-180 days segment had the largest share of fresh CP issuances [52 per cent in H1 (Table IV.1)]. IV.1.2 Government Securities (G-sec) Market During H1, G-sec yields softened (Chart IV.6). At the beginning of the financial year, yields hardened, tracking movements in US yields and the increase in crude oil prices. Thereafter, they eased during the first week of May with the softening of US yields and easing crude oil prices in the wake of the US Federal Open Market Committee’s (FOMC’s) announcement to reduce the pace of balance sheet runoff from June 2024. Yields eased further in the second and third week of May, buoyed by positive sentiments on the inclusion of Indian G-secs in global bond indices and the buyback of government paper. Yields remained largely stable during the month of June and July, moderating towards the end of July due to market reactions to a potential increase in the Liquidity Coverage Ratio (LCR) based on the draft guidelines on LCR issued by the RBI. Yields continued to moderate in August and September on lower inflation prints (for July and August) and the start of the policy easing cycle in the US. 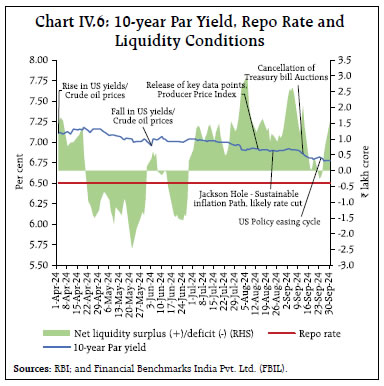 The yields on T-bills moderated during May and June amidst reduction in the supply of T-bills by ₹60,000 crore. The softening bias continued to prevail thereafter till September as liquidity continued to remain in surplus and also in the wake of the cancellation of treasury bill auctions scheduled for the second half of the month (Chart IV.7). The average trading volume in G-secs and T-bills increased in H1:2024-25 relative to H2:2023-24 (Chart IV.8). The weighted average yield (WAY) on traded maturities for G-secs and T-bills declined by 23 bps and 19 bps, respectively, in H1 from that in H2:2023-24. 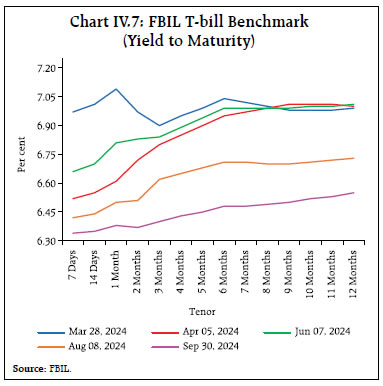
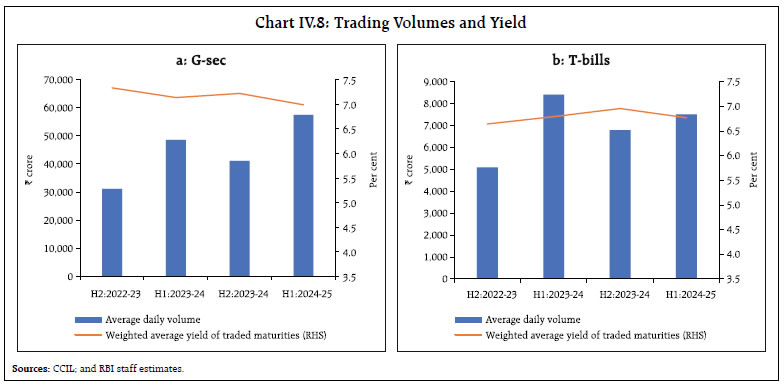 The overall dynamics of the yield curve are captured by its latent factors viz., level, slope and curvature2. Yields have softened across the term structure as reflected in the downward shift of the yield curve during H1 (Chart IV.9a), with the average level of yields softening by 29 bps while the slope of the yield curve increased by 26 bps due to the relatively higher decline in short-term rates (Chart IV.9b). The curvature, on the other hand, increased by 18 bps, reflecting the hardening bias in the mid-segment vis-à-vis the short and long term. In the Indian context, the level and curvature of the yield curve are found to have more information content on future macroeconomic outcomes than the slope, unlike in AEs (Patra et al, 2022)3. 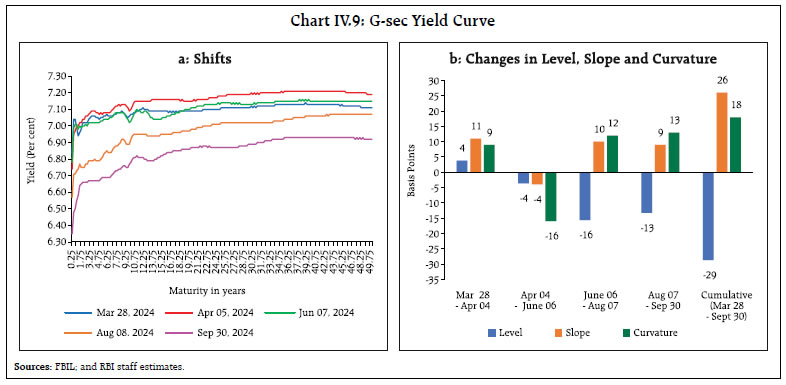 On a review of prevailing market conditions, the Reserve Bank, in consultation with the Government of India (GoI), announced that all securities under the market borrowing programme of the GoI shall be auctioned by the multiple price auction method, effective April 1, 2024. The return to multiple price auctions for all the securities after a gap of three years was aimed at encouraging better price discovery in the G-sec market. To facilitate debt consolidation, the Reserve Bank conducted six switch auctions on behalf of the GoI, amounting to ₹1.16 lakh crore during H1:2024-25. Even as the weighted average maturity (WAM) of the outstanding stock of G-secs increased to 12.96 years at end-September 2024 from 12.54 years at end-March 2024, the weighted average coupon (WAC) at 7.28 per cent was nearly identical to 7.29 per cent over the same period. In May and early June 2024, five buyback auctions were announced with a view to retiring some of the GoI's debt ahead of schedule, particularly in the backdrop of its improved cash position.4 The market response to the auctions, however, was tepid, with the Reserve Bank accepting offers aggregating only ₹0.3 lakh crore against the notified amount of ₹2.3 lakh crore. The weighted average spread of cut-off yields on state government securities (SGS) over GoI G-sec yields of comparable maturities was 31 bps in H1:2024-25 (Chart IV.10). The average inter-state spread on securities of 10-year tenor (fresh issuances) was 2 bps in H1 as against 4 bps in H2:2023-24. IV.1.3 Corporate Bond Market Corporate bond yields softened while spreads widened during H1:2024-25. Issuer-wise, the average yield on AAA-rated 3-year bonds issued by public sector undertakings (PSUs), financial institutions (FIs) and banks softened by 10 bps (to 7.53 per cent), while those by non-banking financial companies (NBFCs) and corporates declined by 14 bps (to 7.84 per cent) and 15 bps (to 7.80 per cent), respectively, in September over March 2024 (Chart IV.11a). Nevertheless, the risk premium (the spread of 3-year AAA corporate bond yields over 3-year G-sec yields) increased from 44 bps to 71 bps for PSUs, FIs and banks; from 80 bps to 102 bps for NBFCs; and from 77 bps to 97 bps for corporates, in H1:2024-25 due to sharper decline in G-sec yields (Chart IV.11b). The increase in risk premia was evident across tenors and the rating spectrum amidst moderation in corporate performance in Q1:2024-25 (Table IV.2). In contrast, the average 3-year credit default swap (CDS) spreads that are trading overseas for the State Bank of India and ICICI Bank reduced by 3 bps each in H1 over H2:2023-24. Primary issuances of listed corporate bonds in domestic markets declined to ₹3.3 lakh crore during H1 (up to August 2024) from ₹4.6 lakh crore during H2:2023-245 (Chart IV.12a). Overseas issuances at ₹29,029 crore during H1 were lower than ₹31,492 crore during H2:2023-24. Almost the entire resource mobilisation in the corporate bond market (99.0 per cent) was through the private placement route (up to August 2024). Outstanding investments by foreign portfolio investors (FPIs) in corporate bonds increased to ₹1.18 lakh crore at end-September 2024, from ₹1.08 lakh crore at end-March 2024, with the utilisation of the approved limits improving marginally to 16.4 per cent from 16.2 per cent over the same period (Chart IV.12b). Secondary market activity, however, picked up with daily average trading volume at ₹6,168 crore during H1 (up to end-July 2024) from ₹5,791 crore during H2:2023-24 (Chart IV.12c). From a regulatory perspective, the Securities and Exchange Board of India (SEBI) lowered the denomination of debt securities for private placements to ₹10,000 from ₹1 lakh with a view to encouraging retail participation and enhancing liquidity in the corporate bond market. | Table IV.2: Financial Markets - Rates and Spread | | | Interest Rates (per cent) | Spread (bps) (over corresponding risk-free rate) | | Instrument | September 2023 | March 2024 | September 2024 | September 2023 | March 2024 | September 2024 | | 1 | 2 | 3 | 4 | 5 | 6 | 7 | | Corporate Bonds | | | | | | | | (i) AAA (1-yr) | 7.68 | 7.97 | 7.92 | 53 | 77 | 117 | | (ii) AAA (3-yr) | 7.83 | 7.95 | 7.80 | 51 | 77 | 97 | | (iii) AAA (5-yr) | 7.69 | 7.74 | 7.70 | 37 | 54 | 86 | | (iv) AA (3-yr) | 8.46 | 8.55 | 8.55 | 113 | 137 | 172 | | (v) BBB-minus (3-yr) | 12.14 | 12.19 | 12.14 | 481 | 500 | 531 | Note: Yields and spreads are computed as monthly averages.
Source: FIMMDA. |
IV.1.4 Equity Market Despite transient surges in volatility, Indian equity markets maintained an upward trajectory in H1:2024-25, with the BSE Sensex surpassing the historic 80,000 mark in July 2024. Amidst these gains, market valuation, as measured by the trailing price-earnings ratio of the BSE Sensex, continued to remain above its long-term average and reached 24.8 at end-September 2024. Indian equities began the financial year positively, driven by strong domestic and global macroeconomic data and robust domestic corporate earnings. Thereafter, markets declined briefly amidst rising geopolitical tensions in the Middle-East. After the initial losses in May, the market capitalisation of Indian listed companies surpassed US$ 5 trillion in the wake of positive market sentiments from improved GoI finances and other domestic and global cues. In early June, the market exhibited large swings during the announcement of Lok Sabha election results, which drove the India VIX6 to its highest levels since the onset of the Russia-Ukraine war. Thereafter, markets recovered quickly amidst expectations of policy continuity, release of softer than-expected domestic as well as US inflation for May and India’s current account turning into a surplus in Q4:2023-24. In July, gains in IT sector stocks and dovish signals from the US Fed propelled the Sensex past the 80,000 mark before its correction later in the month on the budgetary announcement of changes in the capital gains tax structure. Indian financial markets faced a fresh bout of volatility in early August 2024 on account of a combination of factors: (i) elevated geopolitical tensions in the Middle-East; (ii) weaker-than-expected economic data from the US; and (iii) the Bank of Japan (BoJ) raising rates for the second time in 17 years. The BoJ's actions prompted a sudden and large unwinding of yen carry trade. The resulting US equity market meltdown led to heightened global market volatility and a significant churning of portfolio flows. Thereafter, markets recovered as expectations of a US Fed rate cut grew stronger after the release of dovish US FOMC minutes and the remarks of the US Fed Chairman at the Jackson Hole Economic Symposium hinting at the possibility of an imminent policy pivot. The resulting surprises on the future path of monetary policy have a profound impact on financial asset prices (Box IV.1). Domestic equities continued to rally in September amid a US Fed rate cut of 50 bps and reached new highs, with the weight of Indian equities surpassing that of China in a key global MSCI index. Box IV.1: Monetary Policy Surprises and Equity Markets Monetary policy surprises can be decomposed into ‘target’ and ‘path’ factors. The former reflects unexpected changes in the contemporaneous policy rate, while the latter represents surprises in its future trajectory. Intraday changes in 1-year MIBOR-linked OIS rates on policy announcement days are used as a measure of policy surprise (Lloyd, 2018).7 The target factor is the difference between the actual repo rate and the mean expectations of the repo rate from the Bloomberg Economists’ survey (Anderson 2010). The path factor is estimated as the residual of a regression of changes in OIS rate on the target factor: To assess the relative importance of target and path factors for movements in equity prices, BSE Sensex returns over two different, but narrow, time windows are regressed on the target and path factors: 
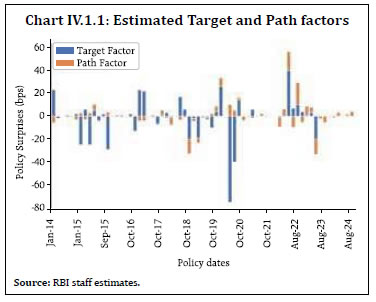 where the δ,t subscript represents changes/returns in alternative time windows (in minutes) with δ ∈ {30,60} being returns on policy day t. The windows thus constructed span 30 minutes (i.e., 10 minutes before and 20 minutes after the policy announcement) and 60 minutes (i.e., 15 minutes before and 45 minutes after) around the policy announcement. The findings indicate that Sensex returns are affected significantly by the surprise in the future path of monetary policy (path factor), and it is stronger for the 60-minute window vis-à-vis the 30 minutes window (Table IV.1.1). As expected, a positive path factor or an expected policy tightening in the future leads to negative equity returns as equity markets price in changes in longer-term borrowing costs. The results, therefore, underscore the impact of central bank communication on market movements and sentiments. | Table IV.1.1: Monetary Policy Announcement Impact on BSE Sensex | | Variables | 30 minutes | 60 minutes | | Intercept | -0.033 | -0.032 | | | (0.039) | (0.062) | | Target Factor | 0.192 | 0.727 | | | (0.621) | (1.230) | | Path Factor | -0.016* | -0.034** | | | (0.009) | (0.015) | | Observations | 67 | 67 | | Adjusted R2 | 0.041 | 0.138 | Notes: a) Significance level: ‘***’ 0.01 (1%), ‘**’ 0.05 (5%), ‘*’ 0.1 (10%).
b) Newey-West standard errors are presented in parentheses.
Source: RBI staff estimates. | References Anderson, M. (2010). Using intraday data to gauge financial market response to federal reserve and ECB monetary policy decision. International Journal of Central Banking, 6(2), 107-116. Gupta, M., Pawar, A., Kumar, S., Borad, A. & Seet, S. (2024). Equity Markets and Monetary Policy Surprises (Working Paper No. 3). Reserve Bank of India. Gurkaynak, R. S., Sack, B., & Swanson, E. T. (2004). Do actions speak louder than words? The response of asset prices to monetary policy actions and statements. Finance and Economics Discussion Series, 2004(66), 1–43. Lloyd, S. P. (2018). Overnight index swap market-based measures of monetary policy expectations. Staff Working Paper No. 709. | Overall, the BSE Sensex gained 14.5 per cent during H1:2024-25 to close at 84,300 at end-September 2024. The broader market indices continued to outperform the benchmark Sensex, with the BSE MidCap and the BSE SmallCap index increasing by 25.5 per cent and 32.4 per cent, respectively, during H1:2024-25 (Chart IV.13a). Amid bouts of volatility, India VIX averaged higher at around 14.8 during H1:2024-25 than 13.2 during H2:2023-24 (Chart IV.13b). Foreign Portfolio Investment (FPI) flows remained volatile in the early half of H1:2024-25, with FPIs turning net sellers during April and May 2024. Foreign investors, however, remained overall net buyers in equities during H1:2024-25. Support from domestic institutional investors (DIIs), on the other hand, remained robust. Overall, DIIs and FPIs were net buyers to the tune of ₹2.26 lakh crore and ₹0.82 lakh crore, respectively, in H1 (Chart IV.14a). In terms of systematic investment plan (SIP) contributions through mutual funds, monthly collections crossed the ₹20,000 crore mark for the first time in April 2024, followed by fresh highs in each of the subsequent months in H1 (up to August 2024). Primary market resource mobilisation in equity markets was placed at ₹1.58 lakh crore during H1 (up to August 2024) as against ₹1.32 lakh crore in H2:2023-24 (Chart IV.14b). Of the total resource mobilisation from the primary market, SME companies mobilised ₹3,858 crores (up to August 2024) through public issues. 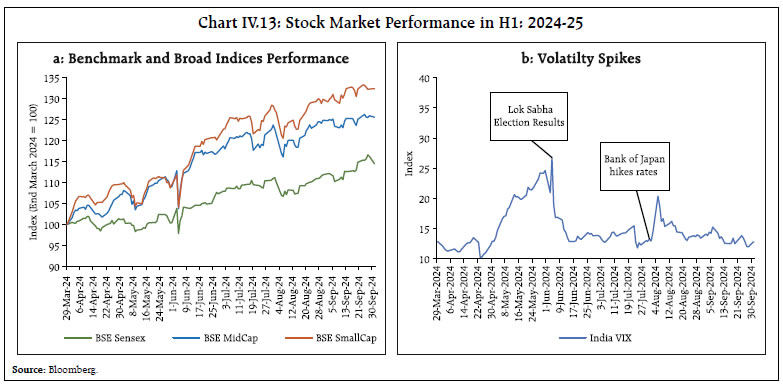
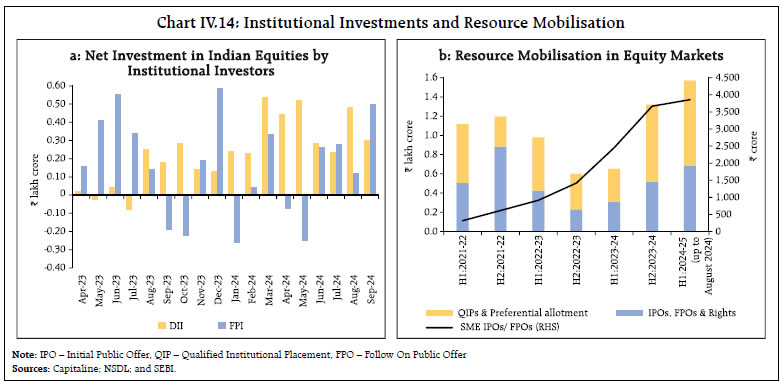 IV.1.5 Foreign Exchange Market The Indian rupee (INR) traded in a range-bound manner with a depreciating bias during the first half of 2024-25 (Chart IV.15a). The US dollar remained strong on the back of elevated US treasury yields between April and mid-July 2024 but depreciated thereafter due to strong market expectations of a potential rate cut by the US Fed, which was eventually corroborated by the 50 bps rate cut by the US Fed on September 18. The unwinding of yen carry trade in early-August exacerbated volatility in global financial markets, albeit briefly. Overall, the volatility of the INR – measured by the 1-month at the money (ATM) option implied volatility – fell marginally to an average of 2.2 per cent during H1 from 2.4 per cent during H2:2023-24 (Chart IV.15b). Between end-March and end-September 2024, the INR depreciated by 0.5 per cent against the US dollar, although it outperformed several EME peer currencies (Chart IV.16). In terms of the Reserve Bank’s 40-currency real effective exchange index, the INR appreciated by 0.1 per cent between March 2024 (average) and September 27, 2024 (Table IV.3). Forward premia remained stable in Q1:2024-25 but rose in Q2, particularly for longer maturities, due to increased expectations of a US rate cut. The 1-month forward premia averaged 1.18 per cent during H1:2024-25, marginally higher than 1.13 per cent in H2:2023-24, while the 12-month premia rose to 1.84 per cent in H1:2024-25 from 1.72 per cent in H2:2023-24 (Chart IV.17).
Table IV.3: Nominal and Real Effective Exchange Rate Indices (Trade-weighted)
(Base: 2015-16 = 100) | | Item | Index: | Appreciation (+) / Depreciation (-) (Per cent) | | September 27, 2024 (P) | September 27, 2024, over March (average) 2024 | | 40-currency REER | 104.7 | 0.1 | | 40-currency NEER | 90.2 | -2.1 | | 6-currency REER | 101.7 | 2.0 | | 6-currency NEER | 81.3 | -16.4 | | ₹/US$ (September 30) | 83.8 | -0.9 | P: Provisional.
Sources: RBI; and FBIL. | A composite view of all market segments suggest benign financial conditions in H1 (Box IV.2).
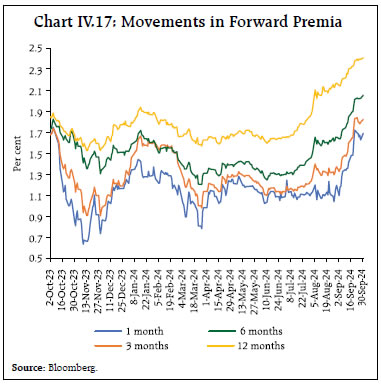
Box IV.2: Financial Conditions Index – A High-Frequency Approach A financial conditions index (FCI) is a summary measure that encapsulates the information content in a broad array of financial variables and helps to gauge the incipient stress in financial markets. Monetary policy actions impact financial conditions through channels of monetary transmission although financial conditions often change independently of policy decisions. The FCI is, thus, a valuable input for monetary policy in so far as it measures the impact of financial variables on real activity, over and above the direct effects of monetary policy (Hatzius et al., 2010). It can, therefore, serve as a guide on the effective stance of policy (Bowe et al., 2023). An FCI for India is constructed by using twenty financial market indicators at daily frequency for the period January 1, 2012 to September 30, 2024. The chosen indicators represent five market segments, namely (i) the money market; (ii) the G-sec market; (iii) the corporate bond market; (iv) the forex market; and (v) the equity market (Table IV.2.1). The money market segment includes indicators on liquidity conditions while the G-sec market segment is represented by latent factors viz., level, slope, and curvature of the sovereign yield curve. The corporate bond market segment is captured through credit risk indicators. Finally, indicators on return and volatility of currency and equities constitute the forex and equity market segments, respectively. All indicators are factored into the index in a manner such that an increase in these indicate a tightening of financial conditions. | Table IV.2.1: Variables for FCI | | Money Market | WAMMR spread over repo rate
WAMMR volatility
Net LAF / NDTL
3M CP (NBFC) over T-Bill | | G-sec Market | Yield Curve level
Yield Curve slope
Yield Curve curvature | | Corporate Bond Market | AAA 3yr spread
AAA 5yr spread
AA 3yr spread
AA 5yr spread | | Forex Market | India US 10yr yield differential
USD-INR 1M ATM volatility
Currency return
1M forward premia | | Equity Market | India VIX
PE level relative to 2yr moving average
BSE Sensex return
BSE Mid-Cap return
BSE Small-Cap return | The FCI is computed using a dynamic factor model (DFM): The standardized FCI along with the contribution of its constituent blocks is presented in Chart IV.2.1. The estimated FCI closely tracks the evolution of financial conditions in India over the years. The peaks in FCI are associated with major events like the taper tantrum, stress in the NBFC sector during the Infrastructure Leasing and Financial Services (IL&FS) episode and the COVID-19 pandemic. The major drivers of FCI, however, vary across events. While the forex market was the key factor during the taper tantrum, domestic factors were the primary drivers during the IL&FS and COVID-19 episodes. The exceptionally easy financial condition in the aftermath of the pandemic was driven by all market segments. Since mid-2023, financial conditions have remained benign even as the policy repo rate remained on pause at 6.5 per cent and the stance continued to focus on withdrawal of accommodation. Congenial financial conditions during this period were mainly driven by stable forex market conditions and the buoyant equity market, reflecting improved global investor confidence in India’s economic outlook. References: Bowe, F., Gerdrup, K.R., Maffei-Faccioli, N., and Olsen, H. (2023). A high-frequency financial conditions index for Norway. Staff Memo No. 1, Norges Bank. Hatzius, J., Hooper, P., Mishkin, F.S., Schoenholtz, K.L., and Watson, M.W. (2010). Financial Conditions Indexes: A Fresh Look After the Financial Crisis. NBER Working Paper No. 16150 | IV.1.6 Credit Market9 Growth in bank credit remained strong in H1:2024- 25, albeit with a slowing momentum. Non food bank credit of scheduled commercial banks (SCBs) decelerated to 14.4 per cent (y-o-y) as on September 20, 2024 from 15.3 per cent a year ago (Chart IV.18). Across bank groups, credit growth of private sector banks (PVBs) remained higher (16.4 per cent) than that of public sector banks (PSBs) (12.9 per cent), while foreign banks’ credit offtake picked up pace (Chart IV.19a). PSBs continued to account for the largest share of incremental credit, although their share declined vis-à-vis PVBs and foreign banks (Chart IV.19b). From a sectoral perspective, the overall growth (y-o-y) in bank credit was primarily driven by personal loans and services, although their share in total incremental credit moderated in H1:2024-25 (up to August) vis-à-vis the same period of the previous year10. Credit growth to the agriculture sector remained in double digits. Industrial credit growth, which was tepid during H1:2023-24, recorded an uptick in H1:2024-25 (up to August). Credit to services and personal loans segments, however, moderated, reflecting the impact of the regulatory measures11 undertaken by the Reserve Bank in November 2023 (Chart IV.20a). The share of agriculture and industry in SCBs’ incremental credit offtake rose to 16.1 per cent and 16.6 per cent, respectively, in August 2024 from 14.4 per cent and 9.6 per cent, respectively, in the previous year. In contrast, the incremental share of services and personal loans moderated over the same period (Chart IV.20b). Credit to agriculture and allied activities registered double digit growth, improving to 17.7 per cent (y-o-y) in August 2024 from 16.5 per cent a year ago (Chart IV.20a), driven by favourable monsoon and continued support from the Government through the price support scheme (PSS) for pulses & oilseeds and market intervention scheme (MIS) for perishable agricultural commodities. Credit to industry grew by 9.8 per cent in August 2024 from 5.3 per cent a year ago, primarily driven by a pickup in offtake to large industry (Chart IV.21a). Higher credit expansion in micro, small and medium industries further supported growth in this segment (Chart IV.21b). Among the major industrial sub-sectors, credit growth to chemicals and chemical products, food processing, infrastructure, and petroleum, coal products and nuclear fuels accelerated in August 2024.
Credit growth to services and personal loans segments at 15.6 per cent and 16.9 per cent, respectively, in August 2024 displayed gradual moderation (Chart IV.22a and IV.23a). Within the services sector, NBFCs were the main driver of overall growth. Increasing dependency of NBFCs on bank borrowings triggered regulatory concerns. Similarly, certain components showed higher growth in the personal loans segment, which led to concerns about incipient stress. To address the build-up of any potential risk, the Reserve Bank tightened lending norms in November 2023 as alluded to earlier. Consequently, total consumer loan growth in the sub-segments where risk weights were increased, moderated to 13.9 per cent while their share in incremental credit to the sector declined to 29.7 per cent in August 2024 (Chart IV.23b).
In tandem, growth in bank credit to NBFCs moderated to 12.2 per cent, bringing down its share to 26.9 per cent of incremental credit extended to services during the same period (Chart IV.22b). The asset quality of SCBs improved during 2024- 25 (up to June 2024), with the overall gross non-performing assets (NPA) ratio declining to 2.7 per cent in June 2024 from 3.7 per cent a year ago (Chart IV.24a). Asset quality improved across all the major sectors (Chart IV.24b). Growth in non-SLR12 investments of banks (comprising investments in CPs, bonds, debentures and shares of public and private corporates) increased to 4.8 per cent in H1:2024-25 from 4.1 per cent in H2:2023-24 (Chart IV.25a). The growth in adjusted non-food credit (i.e., non-food bank credit plus non-SLR investments by banks) was marginally lower at 14.1 per cent in Q2:2024-25 as compared to 14.4 per cent in Q2:2023-24 (Chart IV.25b).
Excess holdings of SLR securities by SCBs as on September 6, 2024 were 8.8 per cent of their net demand and time liabilities (NDTL), up from 8.6 per cent at end-September 2023 (Chart IV.26). Excess SLR holdings provide collateral buffers to banks for availing funds under the LAF as well as wholesale funding in the TREPS and market repo segments. They are also a component of the liquidity coverage ratio (LCR). IV.2 Monetary Policy Transmission Transmission to lending and deposit rates of banks continued in H1:2024-25, with the latter adjusting faster in the wake of persistent credit demand and the widening gap between credit and deposit growth. During H1:2024-25, the median 1-year marginal cost of funds based lending rate (MCLR) of SCBs increased by 10 bps, indicating a slightly higher cost of borrowing. During April-August 2024, the weighted average lending rates (WALRs) on fresh and outstanding rupee loans increased by 4 bps and 6 bps, respectively. In the current tightening cycle, i.e., May 2022 to August 2024, in which the policy repo rate was cumulatively increased by 250 bps, the WALR of SCBs on fresh and outstanding rupee loans increased by 190 bps and 119 bps, respectively. On the deposit side, the weighted average domestic term deposit rates (WADTDRs) on outstanding rupee deposits of SCBs increased by 4 bps in H1:2024-25 (up to August 2024); however, it moderated by 16 bps for fresh deposits. Banks have increased their rates on fresh retail deposits by 21 bps during the same period. The WADTDRs on fresh and outstanding rupee deposits of SCBs increased by 243 bps and 190 bps, respectively, during May 2022 to August 2024 (Table IV.4). | Table IV.4: Transmission from the Repo Rate to Banks’ Deposit and Lending Rates | | (Variation in basis points) | | Period | Repo Rate | Term Deposit Rates | Lending Rates | | WADTDR - Fresh Deposits | WADTDR- Outstanding Deposits | EBLR | 1-Yr. MCLR (Median) | WALR - Fresh Rupee Loans | WALR- Outstanding Rupee Loans | | Retail Deposits | Retail and Bulk Deposits | Retail and Bulk Deposits | | (1) | (2) | (3) | (4) | (5) | (6) | (7) | (8) | (9) | | Easing Phase | | | | | | | | | | Feb 2019 to Mar 2022 | -250 | -209 | -259 | -188 | -250 | -155 | -232 | -150 | | Tightening Period | | | | | | | | | | May 2022 to Aug 2024* | +250 | 186 | 243 | 190 | 250 | 170 | 190 | 119 | | Of which | | | | | | | | | | Apr 2023 to Aug 2024* | 0 | 12 | -2 | 77 | - | 40 | 9 | 19 | | Apr 2024 to Aug 2024* | 0 | 21 | -16 | 4 | - | 10 | 4 | 6 | Notes: Data on EBLR pertain to 32 domestic banks.
*: Latest data on EBLR and MCLR pertain to September 2024.
WALR: Weighted average lending rate; WADTDR: Weighted average domestic term deposit rate;
MCLR: Marginal cost of funds-based lending rate; EBLR: External benchmark-based lending rate.
Source: RBI. | Bank group-wise, the transmission to WALRs on fresh rupee loans of PSBs was higher than that of PVBs, while it was lower for outstanding loans (Chart IV.27a). The lending rates of PVBs remained above those of PSBs (Chart IV.27b). The maximum pass-through to lending rates was witnessed in the case of foreign banks, reflecting their higher share of low-cost and wholesale deposits of lower maturity. Moreover, the higher share of external benchmark-based lending rate (EBLR)-linked loans in foreign banks further facilitated monetary policy transmission13. 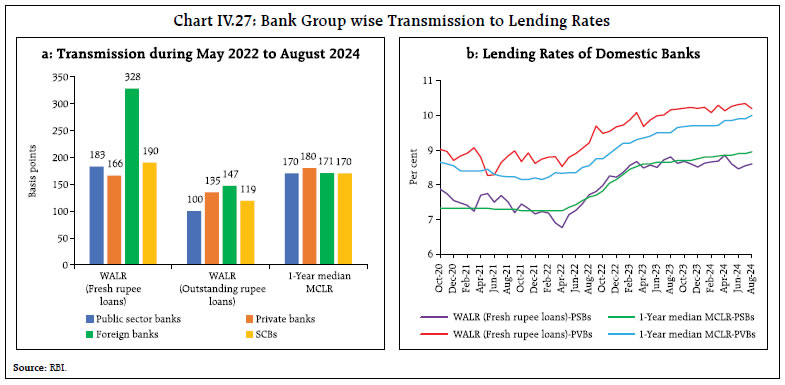
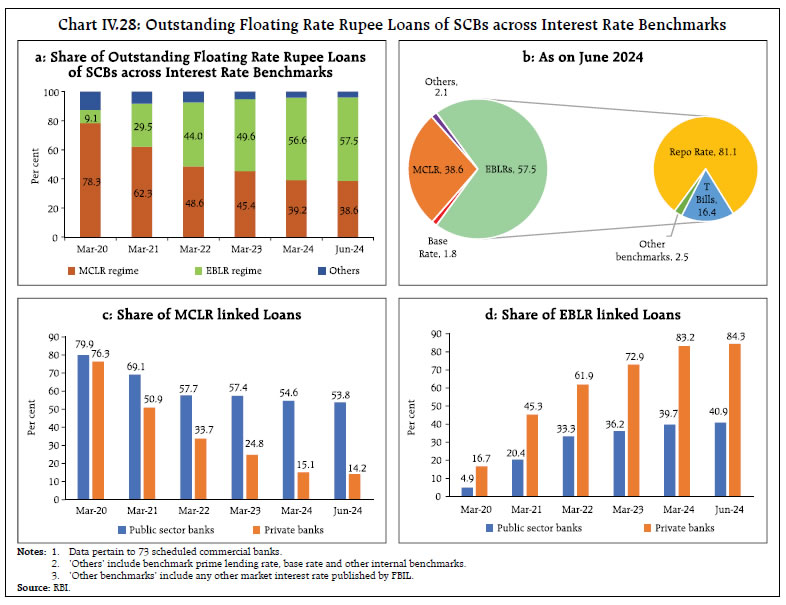 The share of EBLR-linked loans in total outstanding floating rate loans increased to 57.5 per cent at end-June 2024 from 56.6 per cent at end-March 2024. Concomitantly, the share of MCLR-linked loans declined to 38.6 per cent from 39.2 per cent over the same period (Chart IV.28a,b). The increasing share of EBLR-linked loans with shorter reset periods aided transmission to WALRs of SCBs in the current tightening cycle. There is still a significant proportion of loans linked to MCLR in the case of PSBs (Chart IV.28c). The share of EBLR-linked loans is higher among private banks (Chart IV.28d). The persistence of loans linked to MCLR and other legacy rates – based on internal benchmarks and having longer reset periods – are impediments to faster monetary policy transmission. During May 2022 to August 2024, the transmission to WALRs on fresh and outstanding loans has been broad-based across sectors (Chart IV.29a). The differential pace of transmission in various sectors is on account of the proportion of credit portfolios linked to fixed and floating interest rates in the particular sector and the varied spreads charged by banks. In the case of floating rate loans that are mandatorily linked to EBLR, the WALRs on fresh loans of domestic banks increased by 210 bps for education loans, 197 bps for vehicle loans, 164 bps for housing loans and 160 bps for MSME loans (Chart IV.29b). Banks have reduced their spreads (WALRs on fresh floating rate rupee loans over the policy repo rate), which moderated the extent of transmission (Table IV.5). | Table IV.5: Spread of WALR (Fresh Loans) over the Repo Rate for the Loans linked to External Benchmark | | (Per cent) | | Sectors | Apr-22 | Aug-24 | | Public sector banks | Private sector banks | Domestic banks | Public sector banks | Private sector banks | Domestic banks | | MSME Loans | 4.27 | 3.93 | 4.04 | 3.18 | 3.13 | 3.14 | | Personal Loans | | | | | | | | Housing | 2.91 | 3.32 | 3.21 | 2.11 | 2.44 | 2.35 | | Vehicle | 3.37 | 4.39 | 3.55 | 2.62 | 3.86 | 3.02 | | Education | 4.42 | 5.71 | 4.71 | 3.62 | 4.78 | 4.31 | | Other personal loans | 3.54 | 7.35 | 4.01 | 2.97 | 5.44 | 3.37 | Note: Other personal loans include loans other than housing, vehicle, education and credit card loans.
Sources: RBI; and RBI staff estimates. | The combination of sustained credit demand and persistent gap between credit and deposit growth prompted banks (especially PSBs) to increase their term deposit rates to bridge the funding gap (Chart IV.30a). Across bank groups, the pass-through to WADTDRs on fresh and outstanding deposit rates was higher for PSBs than PVBs (Chart IV.30b). Despite deregulation of interest rates by the Reserve Bank in October 2011, savings bank deposit rates have remained mostly sticky and unresponsive to evolving macro-financial conditions (Chart IV.30c). Given that savings deposit comprise about 30 per cent of total deposits, the overall transmission to deposit rates remains low if savings deposit rates remain immune to policy rate changes. Moreover. the decline in the share of current account and savings account (CASA) deposits in total deposits, along with the higher increase in term deposit rates vis-a-vis lending rates have exerted downward pressure on the net interest margins (NIMs) of banks (Chart IV.30d). Since Q3:2022-23, interest rates on various small savings instruments have been cumulatively increased in the range of 70-250 bps by the GoI (Chart IV.31). With these adjustments, the rates on most of the instruments are now aligned with the formula-based rates, except for those on public provident funds and post office recurring deposits. Competitive rates are now being offered on post office time deposits of shorter tenor (Table IV.6). IV.3 Liquidity Conditions and the Operating Procedure of Monetary Policy The Reserve Bank of India (RBI) Act, 1934 requires the RBI to place the operating procedure relating to the implementation of monetary policy and changes thereto from time to time, if any, in the public domain. During H1:2024-25, the monetary policy committee (MPC) kept the policy repo rate unchanged at 6.50 per cent and continued with the stance of withdrawal of accommodation to ensure that inflation progressively aligns to its target of 4 per cent, while supporting growth. In view of the changing liquidity dynamics, the Reserve Bank conducted two-way operations under the LAF to ensure orderly evolution of financial markets. | Table IV.6: Interest Rates on Small Savings Instruments – Q3:2024-25 | | Small Savings Schemes | Maturity (years) | Spread (Percentage point) $ | Average G-sec yield (%) of corresponding maturity (Jun 2024-Aug 2024) | Formula based rate of Interest (%) (applicable for Q3: 2024-25) | GoI Announced Rate of interest for Q3:2024-25 (in %) | Difference (Percentage point) | | (1) | (2) | (3) | (4) | (5) = (3) + (4) | (6) | (7) = (6) - (5) | | Savings Deposit | - | - | - | - | 4.00 | - | | Public Provident Fund | 15 | 0.25 | 7.09 | 7.34 | 7.10 | -0.24 | | Term Deposits | | | | | | | | 1 Year | 1 | 0 | 6.81 | 6.81 | 6.90 | 0.09 | | 2 Year | 2 | 0 | 6.81 | 6.81 | 7.00 | 0.19 | | 3 Year | 3 | 0 | 6.82 | 6.82 | 7.10 | 0.28 | | 5 Year | 5 | 0.25 | 6.83 | 7.08 | 7.50 | 0.42 | | Recurring Deposit Account | 5 | 0 | 6.82 | 6.82 | 6.70 | -0.12 | | Monthly Income Scheme | 5 | 0.25 | 6.79 | 7.04 | 7.40 | 0.36 | | Kisan Vikas Patra | 115 Months# | 0 | 7.09 | 7.09 | 7.50 | 0.41 | | NSC VIII issue | 5 | 0.25 | 7.01 | 7.26 | 7.70 | 0.44 | | Senior Citizens Saving Scheme | 5 | 1.00 | 6.83 | 7.83 | 8.20 | 0.37 | | Sukanya Samriddhi Account Scheme | 21 | 0.75 | 7.09 | 7.84 | 8.20 | 0.36 | $: Spreads for fixing small saving rates as per Government of India Press Release of February 2016.
#: Current maturity is 115 months.
Note: Compounding frequency varies across instruments.
Sources: GoI; FBIL; and RBI staff estimates. | Drivers and Management of Liquidity System liquidity transited from deficit in H2:2023-24 to surplus in H1:2024-25. Within H1, system liquidity was in deficit in Q1 with seasonal expansion in currency in circulation (CiC), build-up of government cash balances, and the increase in excess cash reserve ratio (CRR) balances held by banks. As a result, average daily net injection under the LAF (including MSF) stood at ₹0.5 lakh crore in Q1:2024-25. The liquidity dynamics changed in Q2 with the return of currency to the banking system, the Reserve Bank’s forex purchases and the pick-up in government spending after the elections. The Reserve Bank modulated excess liquidity through open market operations (OMOs) under the NDS-OM14 in Q2. Consequently, average daily net absorption under the LAF stood at ₹1.3 lakh crore in Q2 (Table IV.7). During H1:2024-25, average daily net absorption under the LAF at ₹0.4 lakh crore was sharply in contrast to an average daily net injection of ₹1.1 lakh crore during H2:2023-24. Consequently, average borrowings under the MSF declined to ₹8,004 crore in H1:2024-25 from ₹71,574 crore in H2:2023-24. Of the average total absorption under the LAF, placement of funds under the SDF was ₹0.84 lakh crore (73.2 per cent), while the remaining was absorbed through variable rate reverse repo (VRRR) auctions during H1. The Reserve Bank remained nimble and flexible in liquidity management and conducted two-way operations during H1 in view of the shifting liquidity dynamics. With system liquidity remaining in surplus during April 2024 (up to April 19), the Reserve Bank conducted one main and seven fine-tuning VRRR auctions (1-3 days maturity), cumulatively mopping up ₹2.3 lakh crore from the banking system. As liquidity turned into deficit since the latter half of April, five main and 17 fine-tuning variable rate repo (VRR) auctions were conducted, cumulatively injecting ₹15.5 lakh crore into the system to ease liquidity tightness in Q1:2024-2515. A 3-day VRR auction was conducted on June 28 (Reporting Friday) instead of the main operation as liquidity conditions were expected to improve significantly in the near term. As systemic liquidity turned into surplus at the beginning of July, the Reserve Bank switched to variable rate reverse repo (VRRR) auctions to absorb surplus liquidity. Overall, 49 VRRR auctions – 5 main and 44 fine-tuning operations of maturities ranging 1-7 days – were conducted during Q2 to absorb surplus liquidity (Chart IV.32). As liquidity turned into deficit in the latter half of September, the Reserve Bank conducted one main and 3 fine-tuning VRR operations, cumulatively injecting ₹2.1 lakh crore into the system during the second half of September to ease liquidity conditions. | Table IV.7: Liquidity – Key Drivers and Management | | (₹ crore) | | | 2023-24 | 2024-25 | | Q1 | Q2 | H1 | Q1 | Q2 | H1 | | Drivers | | (i) CiC [withdrawal (-) /return (+)] | 18,103 | 71,253 | 89,356 | -47,264 | 80,820 | 33,556 | | (ii) Net Forex Purchases (+)/ Sales (-) | 1,60,738 | -16,071 | 1,44,667 | -13,016 | 83,418 | 70,402 | | (iii) GoI Cash Balances [build-up (-) / drawdown (+)] | -2,37,937 | -1,79,913 | -4,17,850 | -97,774 | -52,720 | -1,50,494 | | (iv) Excess Reserves [build-up (-) / drawdown (+)] | -31,485 | -3,440 | -34,925 | -58,523 | 21,755 | -36,768 | | Management | | (i) Net OMO Purchases (+)/ Sales (-) | 0 | -8,480 | -8,480 | 0 | -24,040 | -24,040 | | (ii) Required Reserves [including both change in NDTL and CRR] | -33,712 | - 1,01,508 | -1,35,220 | - 30,413 | - 25,200 | -55,613 | | Memo Item | | | | | | | | Net Absorption (+)/ Injection (-) as at end-period | 1,29,194 | -40,636 | -40,636 | 37,004 | 1,54,395 | 1,54,395 | CiC: Currency in Circulation. GoI: Government of India
Note: (+) / (-) sign suggests accretion/depletion in banking system liquidity.
Data pertain to the last Friday of the respective period.
Source: RBI. | The fine-tuning VRRR auctions, on average, elicited better response from the banks than the fortnightly main operations in H1.16 Given the tepid response of banks in parking surplus liquidity for longer tenors as reflected in the lower bid-offer ratio in the main VRRR operations, the Reserve Bank conducted more fine-tuning operations in Q2.
| Table IV.8: Banking and Monetary Aggregates | | (y-o-y growth, per cent) | | Indicator | March 2023 | March 2024 | June 2024 | September 2024 | | Reserve money | 10.0 | 6.7 | 7.4 | 4.7 | | (Adjusted for CRR changes) | (7.6) | (6.7) | (7.4) | (6.8) | | Broad money (M3) | 9.0 | 11.2 | 9.7 | 10.8 | | Currency in circulation | 7.8 | 4.1 | 6.0 | 5.7 | | Aggregate deposits | 9.6 | 12.9 | 10.6 | 12.0 | | Demand deposits | 5.2 | 12.1 | 6.2 | 13.3 | | Time deposits | 10.2 | 13.7 | 11.8 | 11.3 | | Bank credit | 15.0 | 16.3 | 13.9 | 14.4 | Note: Data is as on last reporting fortnight of the quarter. Data on broad money, deposits and credit growth exclude the impact of merger of a bank with a non-bank.
Source: RBI. | As on September 20, 2024, reserve money (RM) expanded by 6.8 per cent (y-o-y) (adjusted for the first-round impact of the change in CRR) as against 6.7 per cent at end-March 2024. The growth in CiC accelerated to 5.7 per cent in September 2024 from 4.1 per cent at end-March 2024. Money supply (M3) growth decelerated to 10.8 per cent (y-o-y) as on September 20, 2024, from 11.2 per cent in end-March 2024 (Table IV.8). IV.4 Conclusion In contrast to volatile global financial markets, domestic market conditions remained stable in H1:2024-25. Money market rates evolved in tune with liquidity shifts, consistent with the monetary policy stance. Domestic long-term bond yields eased amidst an improving inflationary outlook and positive global sentiment on India’s prospects. Equity market scaled new highs, mainly supported by domestic investors. The INR traded with a depreciating bias but remained among the least volatile EME currencies during H1. Monetary transmission continued with credit growth continuing to outpace deposit expansion. Going forward, the Reserve Bank will remain agile and nimble in conducting market operations to ensure financial stability while providing liquidity to meet the productive requirements of the economy. _________________________________________________________________________________
V. External Environment Global growth remains resilient. Headline inflation decelerated at a sluggish pace as sticky services prices hindered strong disinflation in goods. Most central banks tread the path of monetary policy normalisation but with measured cuts and cautious pace, while others retain their restrictive stance. Fluctuating perceptions on the monetary policy trajectory imparted volatility to global financial markets. Stubborn services inflation, high public debt, geopolitical risks, potential escalation of trade tensions, and extreme weather events pose downside risks to the global growth outlook. Global economic activity remains resilient. World trade has firmed up, propelled by strong exports from Asia. Both headline and core inflation (headline excluding food and energy) continue to decelerate, albeit at a sluggish pace, with strong disinflation in goods hindered by persistence of higher-than-average services inflation. With inflation still above target for some inflation targeting advanced economies (AEs), central banks remain cautious while unwinding their restrictive stance. Some emerging market economies (EMEs), on the other hand, that had initiated pre-emptive tightening to curb inflation persistence at elevated levels have continued to normalise their monetary policies while others retain policy rates at restrictive levels. Global financial markets remain volatile in response to fluctuating perceptions on the monetary policy trajectory and how it impacts the growth-inflation trade-off. Equity markets have broadly gained notwithstanding intermittent bouts of sharp spikes in volatility. Sovereign bond yields have softened, while the US dollar has pared strength since April 2024. Off-late, however, both sovereign bond yields and US dollar index have inched up, reversing its earlier trend. Risks to the global growth outlook remain broadly balanced. V.1 Global Economic Conditions In 2024 so far, global economic activity has remained stable despite tight financial conditions and persistent geopolitical risks. High frequency indicators for Q3:2024 point to faltering momentum in manufacturing but a durable expansion in services sector activity. In its World Economic Outlook (WEO) update of July 2024, the International Monetary Fund (IMF) retained global growth projections at 3.2 per cent for 2024 while increasing it to 3.3 per cent for 2025.1 Amongst the AEs, the US economy grew by 3.0 per cent (quarter-on-quarter seasonally adjusted annualised rates (q-o-q, saar)) in Q2:2024, faster than in Q1 (1.6 per cent) (Table V.1). This improvement was driven by consumer spending, private inventory investment, and non-residential fixed investment, while imports also increased. Labour market conditions have been easing, with the unemployment rate picking up to 4.1 per cent in September (3.8 per cent in March). The US composite Standard and Poor's (S&P) global purchasing managers’ index (PMI) was robust at 54.0 in September 2024, though increasingly uneven as services activity exhibited solid expansion while manufacturing output declined. Real GDP growth in the euro area decelerated in Q2 to 0.8 per cent (q-o-q, saar) from 1.3 per cent in Q1 due to decline in gross fixed capital formation. Labour markets remained resilient, with the unemployment rate at 6.4 per cent in August, its lowest level since the start of the euro. The Eurozone composite PMI hit a seven-month low of 49.6 in September from 51.0 in August as downturn in manufacturing output deepened amidst a sustained reduction in new orders. | Table V.1: Real GDP Growth | | (Per cent) | | Country | Q3-2023 | Q4-2023 | Q1-2024 | Q2-2024 | 2023 | 2024 (P) | 2025 (P) | | Quarter-on-quarter, seasonally adjusted, annualised rate (q-o-q, saar) | | Canada | -0.3 | 0.1 | 1.8 | 2.1 | | | | | Euro area | 0.2 | 0.3 | 1.3 | 0.8 | | | | | Japan | -4.3 | 0.2 | -2.4 | 2.9 | | | | | South Korea | 3.0 | 1.8 | 5.3 | -0.9 | | | | | UK | -0.4 | -1.3 | 2.8 | 1.8 | | | | | US | 4.4 | 3.2 | 1.6 | 3.0 | | | | | Year-on-year | | Advanced Economies | | Canada | 0.7 | 1.0 | 0.6 | 0.9 | 1.2 | 1.3 | 2.4 | | Euro area | 0.0 | 0.2 | 0.5 | 0.6 | 0.5 | 0.9 | 1.5 | | Japan | 1.3 | 0.9 | -0.9 | -1.0 | 1.9 | 0.7 | 1.0 | | South Korea | 1.4 | 2.1 | 3.3 | 2.3 | 1.4 | 2.5 | 2.2 | | UK | 0.3 | -0.3 | 0.3 | 0.7 | 0.1 | 0.7 | 1.5 | | US | 3.2 | 3.2 | 2.9 | 3.0 | 2.5 | 2.6 | 1.9 | | Emerging Market Economies | | Brazil | 2.0 | 2.1 | 2.5 | 3.3 | 2.9 | 2.1 | 2.4 | | China | 4.9 | 5.2 | 5.3 | 4.7 | 5.2 | 5.0 | 4.5 | | India | 8.1 | 8.6 | 7.8 | 6.7 | 8.2 | 7.0 | 6.5 | | Indonesia | 4.9 | 5.0 | 5.1 | 5.1 | 5.0 | 5.0 | 5.1 | | Philippines | 6.0 | 5.5 | 5.8 | 6.3 | 5.5 | 6.0 | 6.2 | | Russia | 5.7 | 4.9 | 5.4 | 4.1 | 3.6 | 3.2 | 1.5 | | South Africa | -0.9 | 1.4 | 0.5 | 0.3 | 0.7 | 0.9 | 1.2 | | Thailand | 1.4 | 1.7 | 1.6 | 2.3 | 1.9 | 2.9 | 3.1 | | Memo: | | World | 2023 | 2024 (P) | 2025 (P) | | Year-on-year | | Output | 3.3 | 3.2 | 3.3 | | Trade volume | 0.8 | 3.1 | 3.4 | P: Projection. Note: India’s data correspond to fiscal year (April-March); e.g., 2024 pertains to April 2024-March 2025.
Sources: Official statistical agencies; Bloomberg; IMF WEO Update, July 2024 and RBI staff estimates. | GDP growth in the UK, despite moderating from 2.8 per cent (q-o-q, saar) in Q1:2024, remained resilient at 1.8 per cent in Q2 supported by increases in gross capital formation, government consumption and household spending. The unemployment rate increased to 4.3 per cent in April-July 2024 from the average of 4.0 per cent in 2023. The UK composite PMI posted 52.6 in September, down from 53.8 in August with slower upturns reflected in both the sectors. Japan’s GDP rebounded strongly and grew by 2.9 per cent in Q2:2024 (q-o-q, saar) vis-à-vis a contraction of 2.4 per cent in Q1, driven by robust private consumption and capital expenditure. The composite PMI (au Jibun Bank) remained elevated at 52.0 in September following a 15-month high of 52.9 in August, driven by resilient services activity. Amongst EMEs, China’s real GDP moderated to 4.7 per cent (y-o-y) in Q2:2024 from 5.3 per cent in Q1, amidst continued downturn in the real estate sector and tepid consumer demand. Secondary and tertiary industries also witnessed a slowdown in the second quarter. Nonetheless, the economy grew by 5.0 per cent in the first half of 2024 – propelled by monetary easing and regulatory relaxations for the real estate sector – meeting the official target of 5.0 per cent for 2024 so far. The composite PMI (Caixin) posted 50.3 in September, down from 51.2 in August due to slower expansions in both manufacturing and services sectors. Among other major EMEs, Brazil’s GDP growth accelerated to 3.3 per cent (y-o-y) in Q2:2024 vis-à-vis 2.5 per cent in Q1, driven by expansion in the services and industrial sectors. The labour market, however, remained tight as the unemployment rate continued to decline to 6.6 per cent in August 2024, its lowest level since 2014. The composite PMI was up from an eight-month low of 52.9 in August to 55.2 in September due to quicker upturn in services activity and a renewed expansion in factory production. The South African economy grew at a tardy pace of 0.3 per cent (y-o-y) in Q2:2024 (0.5 per cent in Q1) as financial industry expansion was offset by the decline in the transport, storage and communication industry. The composite PMI for South Africa rose from 50.5 in August to 51.0 in September signalling improved demand conditions. The Russian economy grew by 4.1 per cent (y-o-y) in Q2:2024 (5.4 per cent in Q1), partly driven by higher military and defence spending. The composite PMI, however, posted 49.4 in September, down from 52.1 in August. The ASEAN2 economies recorded resilient growth in Q2:2024 amidst higher new orders and increased activity. Southeast Asian economies are projected to grow at a robust pace3, driven by improved domestic and external demand conditions, stable prices, and increased tourism-related activities. In Q3:2024 so far, growth has decelerated marginally but remains healthy due to positive sentiments on future output amidst persistent price pressures. Among the BRICS economies barring South Africa, GDP growth for 2024 is projected to moderate marginally (Table V.2). The inflation scenario in these countries is expected to improve in 2024 for all, barring Russia where inflation has risen due to demand-supply imbalance. China is facing weak rise in prices amidst a property slump and subdued consumer confidence. Turning to high frequency indicators, the OECD composite leading indicators (CLIs) for September 2024 showed that most economies remained above the long-term trend (Chart V.1a). The global composite PMI remained in expansion zone for the eleventh consecutive month in September at 52.0 as strong expansion in the services sector offset weakness in manufacturing (Chart V.1b). The global manufacturing PMI, however, plunged to an eleven-month low of 48.8 in September as output, new orders and employment contracted. Global merchandise trade volume grew for the fourth consecutive month in July 2024, recording an expansion of 1.7 per cent (y-o-y). EMEs remained the major driver for the sixth consecutive quarter in Q2:2024, while trade volume continued to contract in AEs (Chart V.2a). In July 2024, however, trade volume marginally revived in AEs. The Freightos Baltic Global Index – the global ocean freight container pricing index that measures 40-feet container prices – remained elevated on y-o-y basis in September 2024 as attacks on commercial shipping continued in the Red Sea trade route (Chart V.2b). These attacks necessitated rerouting of maritime trade from the Suez Canal to around the Cape of Good Hope, leading to longer transit time, rise in freight costs and an uptick in war-risk premia. In September, however, the Freightos Baltic Global Index fell on m-o-m basis as demand moderated. Global trade value continued to expand in Q1:2024, with around 1 per cent growth in merchandise trade (q-o-q) on the back of higher exports from China, India, and the US.4 Trade in green energy and Artificial Intelligence related products increased strongly in Q1. The latest WTO trade barometer (September 2024) indicates that global merchandise trade volume continued to grow in Q3:2024. The global trade outlook for 2024 remains positive; however, persistent geopolitical tensions, rising shipping costs and emerging industrial policies could impact trade patterns. According to the IMF's WEO update of July 2024, global trade volume is estimated to grow by 3.1 per cent and 3.4 per cent in 2024 and 2025, respectively, with faster expansion in trade in emerging market and developing economies (EMDEs). | Table V.2: Select Macroeconomic Indicators for BRICS | | Real GDP growth rate (y-o-y, per cent) | Country | 2023 | 2024(P) | 2025(P) | General Government gross debt (per cent of GDP)# | Country | 2023 | 2024(P) | 2025(P) | | Brazil | 2.9 | 2.1 | 2.4 | Brazil | 84.7 | 86.7 | 89.3 | | Russia | 19.7 | 20.8 | 21.9 | | Russia | 3.6 | 3.2 | 1.5 | | India | 8.2 | 7.0 | 6.5 | India | 82.7 | 82.5 | 81.8 | | China | 5.2 | 5.0 | 4.5 | China | 83.6 | 88.6 | 93.0 | | South Africa | 0.7 | 0.9 | 1.2 | South Africa | 73.9 | 75.4 | 77.9 | | CPI inflation rate (y-o-y, per cent) | Country | 2023 | 2024(P) | 2025(P) | Current account balance (per cent of GDP) | Country | 2023 | 2024(P) | 2025(P) | | Brazil | 4.6 | 4.1 | 3.0 | Brazil | -1.3 | -1.4 | -1.5 | | Russia | 2.5 | 2.7 | 2.7 | | Russia | 5.9 | 6.9 | 4.5 | | India | 5.7 | 4.6 | 4.2 | India | -1.2 | -1.4 | -1.6 | | China | 0.2 | 1.0 | 2.0 | China | 1.5 | 1.3 | 1.4 | | South Africa | 5.9 | 4.9 | 4.5 | South Africa | -1.6 | -1.8 | -1.9 | | General Government net lending/ borrowing (per cent of GDP) | Country | 2023 | 2024(P) | 2025(P) | Forex reserves* (in US$ billion) | Country | 2022 | 2023 | 2024 | | Brazil | -7.9 | -6.3 | -5.5 | Brazil Russia | 324.7 | 355.0 | 369.2 | | Russia | -2.3 | -1.9 | -1.2 | | 582.0 | 598.6 | 602.0 | | India | -8.6 | -7.8 | -7.6 | India | 562.7 | 622.5 | 704.9 | | China | -7.1 | -7.4 | -7.6 | China | 3466,8 | 3610.0 | 3695.3 | | South Africa | -6.0 | -6.1 | -6.3 | South Africa | 60.6 | 62.5 | 63.2 | P: Projection.
*: Forex reserves for 2024 pertain to August 2024 for all countries except for Russia (July 2024) and India (September 2024).
#: Gross debt refers to the nonfinancial public sector, excluding Eletrobras and Petrobras, and includes sovereign debt held by the central bank.
Note: India’s data correspond to fiscal year (April-March) except data on forex reserves which are as per calendar year.
Sources: Official statistical agencies; WEO April 2024 database and July 2024 Update, IMF; and International Reserve and Foreign Currency Liquidity (IRFCL), IMF; and RBI. |
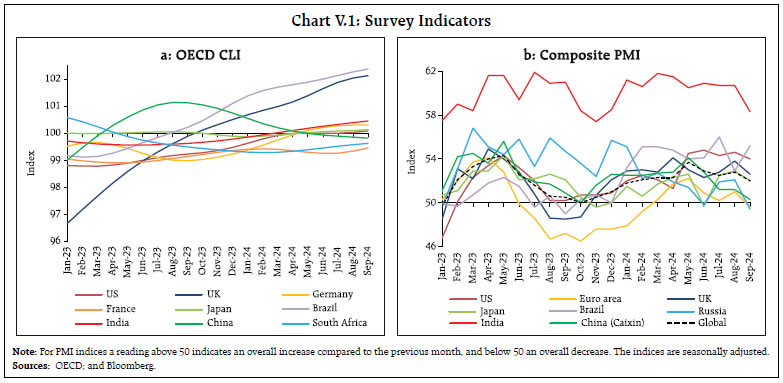
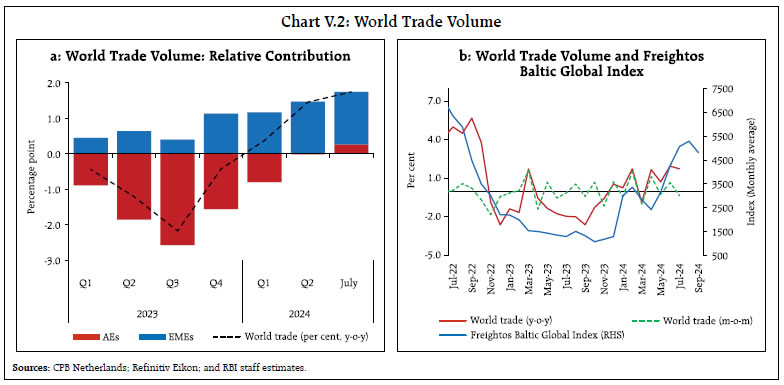 V.2 Commodity Prices and Inflation In Q2:2024, global commodity prices as measured by the Bloomberg commodity price index remained volatile but maintained the levels attained in Q1. Gains recorded in May were corrected towards the end of the month and early June due to a significant drop in crude oil prices. Prices softened by 0.6 per cent (q-o-q) in Q3 due to moderating energy and metal prices amidst weak demand from China (Chart V.3a). According to the Food and Agriculture Organization (FAO), global food prices edged up by 2.0 per cent (q-o-q) in Q2 and by 1.4 per cent in Q3, primarily due to increase in the prices of vegetable oil, dairy and meat, though partly offset by decline in sugar and cereals prices (Chart V.3b). Crude oil prices have moderated since the April 2024 MPR. Brent prices hovered above US$ 90 per barrel in the first half of April following heightened geopolitical tensions, but corrected over the rest of the period in Q2 (till early June) in the wake of weak demand and increased oil inventories. Crude oil prices fell to a low of US$ 76 per barrel in early June after the meeting of OPEC+, wherein eight members agreed to reverse some “voluntary” cuts from October 2024.5 Thereafter, with escalation of geopolitical tensions and larger than expected decline in US crude oil inventory, prices rose for a short while before again moderating in July over demand concerns, fuelled by lower-than-expected Chinese GDP growth and signs of cooling US labour market. Crude prices firmed up in August with tensions escalating in the Middle East, however, it began to soften in early September, prompting the postponement of the scheduled unwinding of the “voluntary” production cuts by eight OPEC+ members from October to December 2024. Notwithstanding the announcement, prices dropped below $70 per barrel on September 10 – the first time since December 2021 – but recouped some losses thereafter. Natural gas prices (according to the World Bank’s natural gas index) increased in Q2 and Q3 due to unplanned outages in Europe and increased demand for power generation in the US (Chart V.3c). 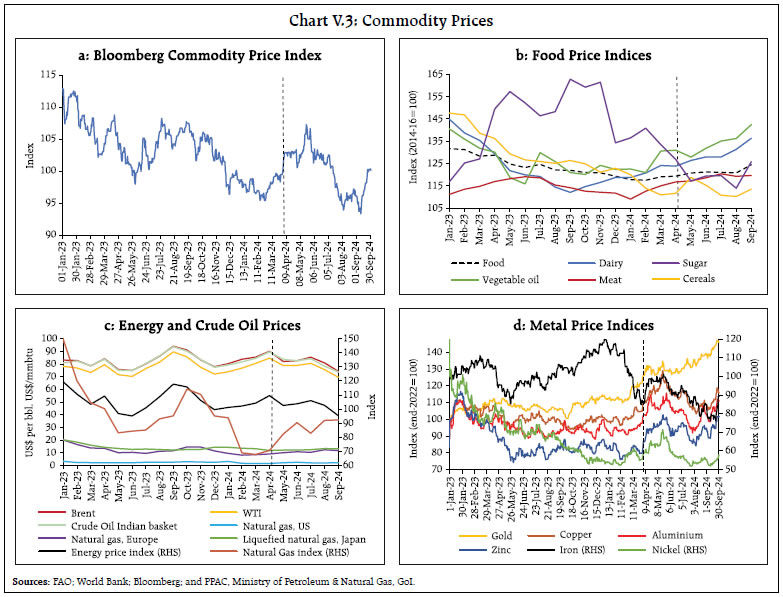 Base metal prices peaked in May, fuelled by economic stimulus undertaken by China, the largest consumer of base metals, but corrected later over a muted demand outlook. Overall, the prices of most base metals firmed up in Q2 and continued to rise in Q3 as positive sentiments from Chinese stimulus measures overwhelmed negative sentiments emanating from muted demand outlook. Gold prices (q-o-q) rallied in Q2 and Q3 by 5.5 per cent and 13.9 per cent, respectively, with prices surpassing their record highs in every successive month. Yellow metal prices surged in April over a potential escalation in geopolitical tensions that triggered safe-haven demand. Prices moderated briefly as tensions eased but firmed up again in May above April levels due to weakening US dollar and softening treasury yields. Prices corrected in late May and June over weak seasonal demand and a stronger US dollar, but rebounded in Q3 to touch record highs buoyed by improved odds of the US Fed’s rate cut, renewed weakening of the US dollar and safe haven flight (Chart V.3d). Consumer Price Inflation Consumer price inflation grudgingly eased further as sticky services prices posed a drag on the pace of disinflation. Nonetheless, inflation is already close to pre-pandemic levels for the median EMDEs owing to declining energy prices.6 Stronger nominal wage growth in some countries and escalating trade tensions pose upside risks to the disinflation momentum, causing monetary policy to remain restrictive. Notwithstanding the decline, inflation still ranges above the target in some inflation-targeting economies. According to the IMF's WEO Update, July 2024, global inflation is projected to fall from 6.7 per cent in 2023 to 5.9 per cent in 2024 and further to 4.4 per cent in 2025 (Table V.3). | Table V.3: Consumer Price Inflation | | (Y-o-y, Per cent) | | Country | InflationTarget | Q3:2023 | Q4:2023 | Q1:2024 | Q2:2024 | Jul-24 | Aug-24 | Sep-24 | | Advanced Economies | | Canada | 2.0 ± 1.0 | 3.7 | 3.2 | 2.9 | 2.8 | 2.5 | 2.0 | | | Euro area | 2.0 | 4.9 | 2.7 | 2.6 | 2.5 | 2.6 | 2.2 | 1.8 | | Japan | 2.0 | 3.0 | 2.6 | 2.5 | 2.4 | 2.7 | 2.8 | | | South Korea | 2.0 | 3.2 | 3.4 | 3.0 | 2.7 | 2.6 | 2.0 | 1.6 | | UK | 2.0 | 6.7 | 4.2 | 3.5 | 2.1 | 2.2 | 2.2 | | | US | | 3.5 | 3.2 | 3.3 | 3.2 | 2.9 | 2.5 | | | | (2.0) | (3.4) | (2.8) | (2.7) | (2.6) | (2.5) | (2.2) | | | Emerging Market Economies | | Brazil | 3.0 ± 1.5 | 4.6 | 4.7 | 4.3 | 4.0 | 4.5 | 4.2 | | | Russia | 4.0 | 5.2 | 7.2 | 7.6 | 8.2 | 9.1 | 9.1 | | | India | 4.0 ± 2.0 | 6.4 | 5.4 | 5.0 | 4.9 | 3.6 | 3.7 | | | China | | -0.1 | -0.3 | 0.0 | 0.3 | 0.5 | 0.6 | | | South Africa | 3.0-6.0 | 5.0 | 5.5 | 5.4 | 5.2 | 4.6 | 4.4 | | | Mexico | 3.0 ± 1.0 | 4.6 | 4.4 | 4.6 | 4.8 | 5.6 | 5.0 | | | Indonesia | 2.5 ± 1.0 | 3.0 | 2.7 | 2.8 | 2.8 | 2.1 | 2.1 | 1.8 | | Philippines | 3.0 ± 1.0 | 5.4 | 4.3 | 3.3 | 3.8 | 4.4 | 3.3 | 1.9 | | Thailand | 1.0-3.0 | 0.5 | -0.5 | -0.8 | 0.8 | 0.8 | 0.4 | 0.6 | | Turkey | 5.0 ± 2.0 | 56.1 | 62.7 | 66.8 | 72.3 | 61.8 | 52.0 | 49.4 | | Memo: | | | 2022 | 2023 | 2024(P) | 2025(P) | | World consumer price inflation | 8.7 | 6.7 | 5.9 | 4.4 | P: Projection.
Notes: 1. Japan's inflation pertains to CPI inflation in all items less fresh food - the Bank of Japan's target measure.
2. Figures in the parentheses for US are year-on-year change in personal consumption expenditure (PCE) price index.
3. Brazil’s inflation target for 2024 is 3.0 ± 1.5 per cent and was 3.25 ± 1.5 per cent for 2023.
4. Indonesia’s inflation target for 2024 is 2.5 ± 1.5 per cent and was 3.0 ± 1.5 per cent for 2023.
Sources: Central bank websites; IMF; and Bloomberg. | In the US, headline and core CPI inflation (y-o-y) decelerated from 3.5 per cent and 3.8 per cent, respectively, in March 2024 to 2.5 per cent and 3.2 per cent, respectively, in August. Inflation, in terms of the personal consumption expenditure (PCE) price index – the Fed’s preferred measure – softened at a tardy pace from 2.8 per cent in March to 2.2 per cent in August (Chart V.4a), while core PCE inflation eased from 3.0 per cent to 2.7 per cent over the same period (Chart V.4b). In the Euro area, CPI inflation moderated from 2.4 per cent in April to 1.8 per cent in September. Core inflation (inflation excluding energy, food, alcohol, and tobacco) remained stable at 2.7 per cent in September (same as in April), with a mild uptick during May- August. In the UK, CPI headline inflation decelerated sharply by 100 bps from 3.2 per cent in March to 2.2 per cent in August, with core inflation declining from 4.2 per cent to 3.6 per cent. In Japan, CPI inflation (all items less fresh food), the Bank of Japan (BoJ)’s inflation target metric, eased briefly during March and April but started firming up since May. In August, inflation at 2.8 per cent was well above the BoJ’s target of 2 per cent. Core inflation (inflation excluding both fresh food and energy), however, declined to 2.0 per cent in August from 2.4 per cent in April. 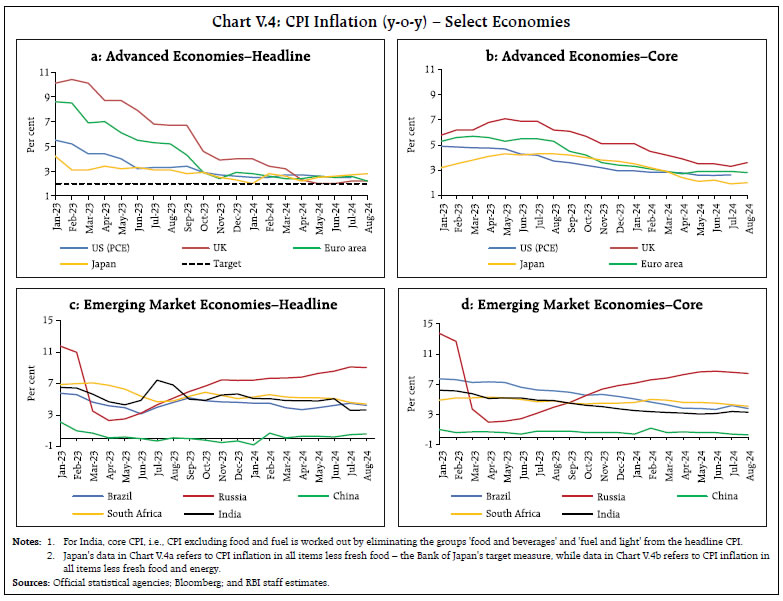 Amongst major EMEs, CPI inflation edged up in Brazil to 4.2 per cent in August from 3.9 per cent in March 2024 (Chart V.4c). In Russia, it accelerated from 7.7 per cent to 9.1 per cent over the same period due to western sanctions and an overheating economy. In South Africa, however, CPI inflation receded to 4.4 per cent in August from 5.3 per cent in March. China recorded positive inflation during March (0.1 per cent) to August (0.6 per cent) after it exited deflation in February. Similar to AEs, core inflation is also receding, albeit grudgingly in EMEs (Chart V.4d). V.3 Monetary Policy Stance Following the most aggressive and highly synchronised monetary policy tightening to counter multi-decadal high inflation in 2022-23, the strength and credibility of central bank policies were tested as they tried to curb inflation without hampering growth, necessitating a revamp of the monetary policy operating frameworks of some countries in the context of changing dynamics of policy trade-offs (Box V.1). In 2024, particularly during Q2 and Q3, monetary policy cycles diverged as central banks across AEs and EMEs responded to their own evolving growth-inflation dynamics. While continuing to emphasise on caution and data dependence for future decisions, central banks of major systemic AEs embarked on policy pivots even as some others have paused. Given their pre-emptive tightening at the onset of the inflation surge, some EME central banks continued with policy normalisation while few others continued with the restrictive stance. Box V.1: Recent Changes in Global Monetary Policy Operating Frameworks: Response to Evolving Macro-Economic Developments While successfully navigating through the two black swan events of the COVID-19 pandemic and the conflict in Europe, central banks worldwide had to quickly change gears from providing large-scale stimulus that resuscitated economic activity to battling decadal-high inflation to restore price stability. This prompted central banks to undertake synchronised and aggressive interest rate hikes in decades accompanied by ultra-hawkish stances even as they started to taper their bloated balance sheets. Monetary policy operating frameworks underwent significant refinements in two major systemic countries – the European Central Bank (ECB) and the Reserve Bank of Australia (RBA). The ECB, faced with mounting post-pandemic inflation pressures, recognised the imperative of moving from abundant excess liquidity to one of less ample liquidity. In response, it announced a new operational framework effective September 2024, wherein the main refinancing operations (MRO) rate is adjusted and anchored at 15 bps (as opposed to 50 bps earlier) above the deposit facility rate (DFR) while the rate on marginal lending facility (MLF) remains at 25 bps above the MRO rate (EP, 2024). This adjustment would retain the asymmetric corridor but narrow the corridor width to 40 bps from 75 bps, which would deter upward deviations and contain volatility as rate gets anchored closer to the DFR (Chart V.1.1) (ECB, 2024).7 Analogous to the ECB, the RBA also planned to shift from a system of excess to ample reserves in April 2024 (Kent, 2024). According to the RBA, the move towards ample reserves, that lies somewhere between the current ‘floor’ system with excess reserves and the pre-pandemic ‘corridor’ system with scarce reserves, eliminates (i) the need for precise estimation of demand for reserves; (ii) minimises risk of volatile money markets; and (iii) is more resilient to future balance sheet expansions during periods of financial stress. There are also instances of countries shifting to simpler mandates for monetary policy for better management of trade-offs. In February 2024, the RBA announced a switch towards a dual mandate of price stability and full employment with the clarification that, in practice, the dual mandate is not a substantial departure from the status quo (PoA, 2024). In this regard, the deleted ‘third goal’ of contributing to Australian people’s economic prosperity and welfare will henceforth be an “overarching objective”, rather than a policy objective for monetary policy. On a similar but more focussed move, the Reserve Bank of New Zealand (RBNZ) highlighted the necessity for a more precise and focused monetary policy target in June 2023. Recognising that the shift to a dual mandate in 2018 was a mistake, it recommended a shift back to the single mandate in order to remain focussed on price stability and enhance its policy credibility. The RBNZ amended the Remit for the Monetary Policy Committee (MPC) in December 2023, recommending that the MPC remain solely focussed on achieving an inflation target of 1-3 per cent over the medium-term, with added emphasis on the 2 per cent mid-point (RBNZ, 2023). 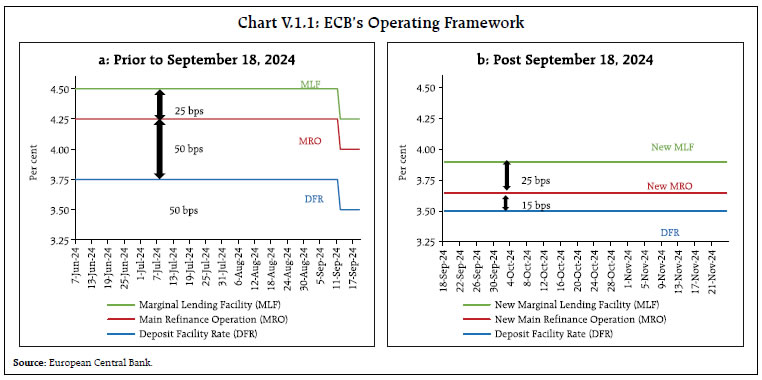 In the case of Japan, the pandemic served as a catalyst to emerge from the deflationary environment of several decades, despite undertaking large scale monetary stimulus through Quantitative and Qualitative Monetary Easing (QQE) along with Yield Curve Control (YCC). The surge in inflation led to a rise in inflation expectations and, therefore, the BoJ made a pivotal decision to exit its negative interest rate policy in March 2024, discontinuing QQE with YCC (Chart V.1.2) (Kazuo, 2024). It removed the long-standing target of controlling the 10-year Japanese Government Bonds (JGBs) rate and started targeting the uncollateralised overnight call rate. It also embarked on tapering of the bond buying programme in a predictable manner. 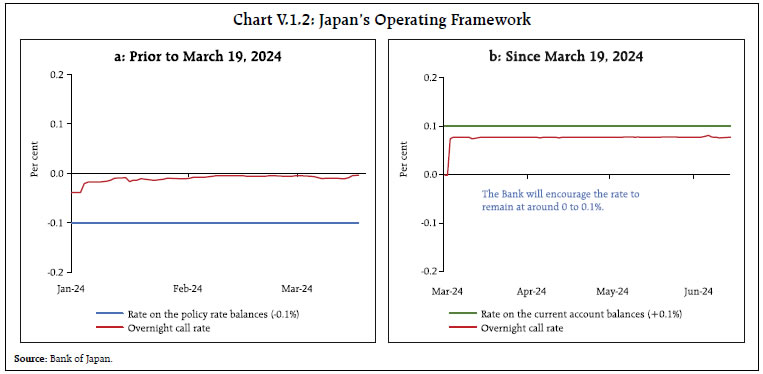 As countries prioritise inflation control, the role of central bank credibility and transparent communication gains prominence. With a view towards enhancing transparency and ensuring effective policy communication, the People's Bank of China (PBoC) announced changes in its monetary policy operating framework in June 2024 and placed greater emphasis on price-based regulatory measures involving interest rates (Gongsheng, 2024). The PBoC indicated that the seven-day reverse repo rate will be the central bank’s main short-term operational rate and consequentially, the roles of other rates on monetary policy instruments with different tenures may soften. It also pointed out that the existing corridor of the standing lending facility (SLF) acting as the ceiling and the rate on excess reserves (ERR) being the floor is relatively wide and may be narrowed, going forward. PBOC announced a new cash management tool of temporary overnight repo (ORR) and reverse repo operations (ORRR), with the interest rates fixed at the seven-day repo rate minus 20 bps and plus 50 bps, respectively (Chart V.1.3). The PBoC also intends to expand its policy toolkit by including the purchase and sale of China government bonds in the secondary market. Going ahead, the changes in the framework will be tested and reviewed in response to evolving macro-economic developments. 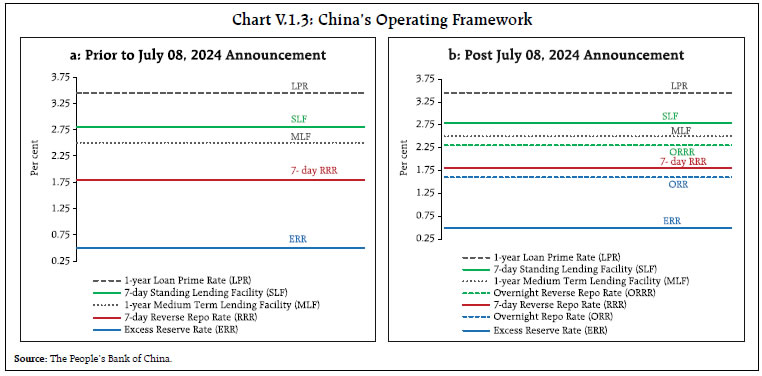 References: 1. European Central Bank (2024), Statement by the Governing Council, March 13. 2. European Parliament (2024), Briefing, A new operational framework for the European Central Bank, May 22. 3. Gongsheng, P., (2024), “China’s current monetary policy stance and evolution of monetary policy framework in the future”, Lujiazui Forum. 4. Kazuo, U., (2024), “On the Recent Changes in the Bank of Japan’s Monetary Policy Framework”, Peterson Institute for International Economics. 5. Kent, C., (2024). “The future system for monetary policy implementation”, Bloomberg Australia Briefing. 6. Parliament of Australia (2024), Treasury Laws Amendment (Reserve Bank Reforms) Bill 2023, February 12. 7. Reserve Bank of New Zealand (2023), Monetary Policy Remit amended, December 13. | The US Fed initiated a pause in policy tightening in September 2023 and continued to maintain the target range for the federal funds rate at 5.25-5.50 per cent in all its subsequent meetings. In September 2024, however, it lowered the target range for the federal funds rate by 50 bps to 4.75-5.00 per cent (Chart V.5a). As per the Summary of Economic Projections released in the September meeting, the Federal Open Market Committee (FOMC) participants expected the target range for the federal fund rates to be at 4.25-4.50 per cent by end 2024 and at 3.25-3.50 per cent by end 2025, indicating a further 50 bps rate cut in the remaining part of 2024 and 100 bps rate cut in 2025. The Fed also continued with its balance sheet normalisation policy. After continuing with the pause that ECB initiated in October 2023, it lowered its three key interest rates by 25 bps in June 2024, marking its first cut in the current easing cycle. It again announced a cut in its deposit facility rate (DFR) by 25 bps in September after keeping it unchanged in July. It reiterated that it would continue to remain data-dependant to determine the appropriate level and duration of restriction. Besides, the Asset Purchase Programme (APP) portfolio continues to shrink as principal payments from maturing securities are no longer reinvested. The Pandemic Emergency Purchase Programme (PEPP) portfolio is also set to decline by €7.5 billion per month, on average, with reinvestments ceasing entirely by the end of 2024. The Bank of England (BoE) continued with its status quo stance initiated in September 2023, followed by first cut of 25 bps in August as inflation risks abated, but paused in its September meeting. The BoE indicated that a gradual approach in removing policy restraint is warranted, emphasising that monetary policy will need to remain restrictive for sufficiently long until the risks for inflation to return sustainably to the 2 per cent target dissipate further. Amongst other major AEs, the RBA, the Central Bank of Iceland8, the Bank of Israel, the Norges Bank, and the Bank of Korea maintained status quo in all their meetings during Q2 and Q3 of 2024. After keeping its policy rate unchanged since September 2023, the Bank of Canada reduced it by 25 bps each in all its meetings starting June 2024. The RBNZ cut its official cash rate by 25 bps in August 2024, following a pause since July 2023. The Sveriges Riksbank slashed its policy rate by 25 bps each in May, August and September 2024 meetings, with a pause in the month of June. The Swiss National Bank also lowered its policy rate by 25 bps in its June and September meetings. The Czech National Bank reduced its key rate by 50 bps each in both May and June meetings and by 25 bps in its August and September meetings. In contrast, the BoJ raised its key rate by 15 bps in July, following a period of status quo in April and June. Moreover, the BoJ announced its plan to taper its outright purchase of JGBs at a predictable pace of 400 billion yen each quarter, reaching around 3 trillion yen by January- March 2026. The BoJ, however, maintained status quo in its September meeting. 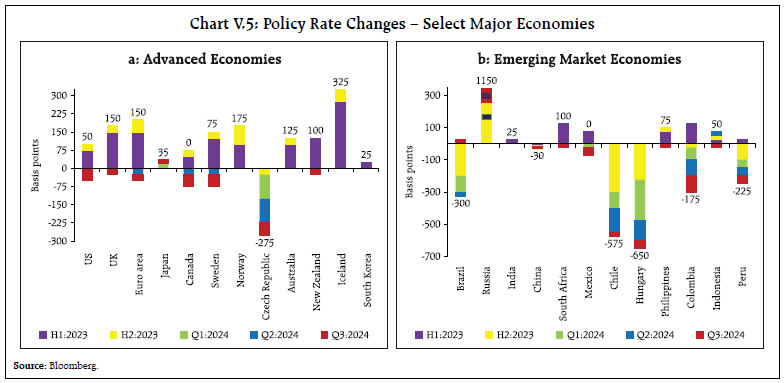 In the BRICS economies, the Banco Central do Brasil, continued to maintain its accommodative stance that started in August 2023 by cutting its Selic rate by 25 bps in May 2024, but paused thereafter in the months of June and July. In September, however, it pivoted by raising the Selic rate by 25 bps due to emerging upside risks to inflation. The South African Reserve Bank cut its repo rate by 25 bps in September 2024 for the first time after keeping it unchanged in May and July meetings. The People’s Bank of China (PBoC) reduced the one-year Loan Prime Rate (LPR) by 10 bps in July after keeping it unchanged in Q2:2024. It reduced the one-year Medium-term Lending Facility (MLF) rate by 20 bps in July and 30 bps in September. In September, it also announced a slew of stimulus measures to support the economy, recoup the housing sector and restore market confidence including reduction in reserve requirement ratio by 50 bps and seven-day reverse repo rate by 20 bps to 1.5 per cent. The Bank of Russia (BoR) maintained status quo in Q2:2024 but increased its policy rate by 200 bps and 100 bps in July and September, respectively, of 2024 as inflation remained elevated much above the target. Among Asian EMEs, the Bank of Thailand kept its benchmark rate unchanged in Q2 and Q3 of 2024. The Bank Indonesia cut its key rate by 25 bps in September 2024 following a hike in April while pausing in intermittent meetings, while the central bank of Philippines cut its policy rate by 25 bps in August 2024 after maintaining status quo in Q2. In Latin America, the central bank of Mexico maintained the policy rate in Q2 but announced two consecutive rate cuts of 25 bps each in August and September after the first rate cut in March 2024. The central bank of Colombia continued with monetary policy easing by paring its benchmark rate by 50 bps in each of its April, June, July and September meetings. Chile cumulatively lowered its policy rate by 175 bps to 5.50 per cent during April-September 2024 with an intermittent pause in July. Peru cut its reference rate by 25 bps each in April, May, August and September meetings but maintained status quo in its June and July meetings. Among European EMEs, Hungary lowered its policy rate by 50 bps each in its April and May meetings and by 25 bps in June, July and September while maintaining a pause in August. Poland maintained a pause in Q2 and Q3 of 2024 (Chart V.5b). V.4 Global Financial Markets Global financial markets remained in a state of flux during Q2 and Q3, responding somewhat unexpectedly to changing perceptions on the monetary policy trajectory and data releases.9 Markets turned buoyant during May-September 2024 as expectation of rate cuts gained momentum. Notwithstanding the gains, equity markets retreated intermittently since the last MPR – in April over continued restrictive monetary policy; in the beginning of August over a confluence of factors, including underwhelming data releases for the US and landmark rate hike by Japan; and in early September over increased risk-off sentiment amidst data releases. Overall, bond yields have moderated since the last MPR while the US dollar has pared gains. Consequently, EME currencies broadly appreciated in Q3:2024. Equity markets, in terms of the Morgan Stanley Capital International (MSCI) world index, gained 8.7 per cent since end-March, reflecting gains in both AEs and EMEs, with recurrent episodes of volatility (Chart V.6a). Among AEs, the US S&P 500 shed gains in April as strong consumer demand and high PCE inflation rekindled concerns about ‘higher for longer’ interest rates. It, however, rallied starting end-April till mid-July amidst easing geopolitical tensions and increased expectations of a rate cut over moderating inflation prints. Thereafter, market sentiment turned sour with incoming data sparking recessionary fears in the US on top of disorderly unwinding of yen carry trade consequent to the BoJ’s rate hike. After undergoing a sharp dip in late July and early August, US stock markets rebounded in August as investors moved back to riskier assets on dovish guidance from the BoJ and abatement of recessionary fears. In the first week of September, however, market underwent another correction upon the release of below expectations PMI data and labour market indicators but soon rallied overhauling the previous loss. Overall, the US S&P index rose by 9.7 per cent during April-September 2024. European stocks underperformed as bullish sentiments in other markets attracted investors interest. The UK’s stock indices modestly tracked the US markets in Q2, performing well following the Labour party’s landslide electoral performance but relatively underperformed in Q3. The Japanese market reflected domestic factors exhibiting a sharp correction post the BoJ’s rate hike causing yen appreciation and raising risks on exporters’ earnings’ outlook. EME equities gained since end-March, tracking global cues and lower domestic inflation prints (Chart V.6b). Chinese stocks, that were losing ground amidst flagging economic activity and the persistent downturn in real estate, rebounded sharply post the stimulus announcement on September 24, 2024. 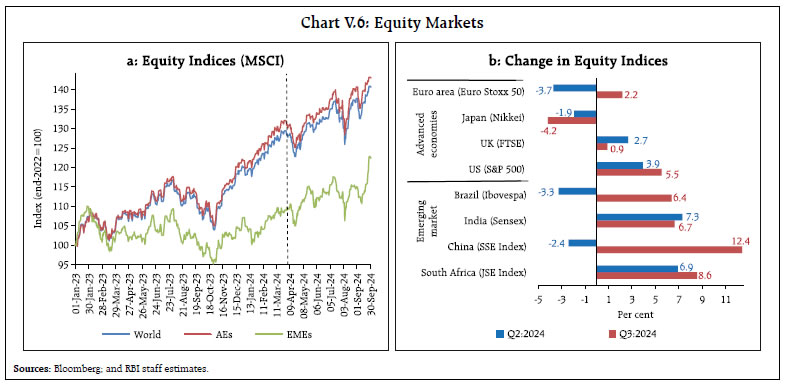
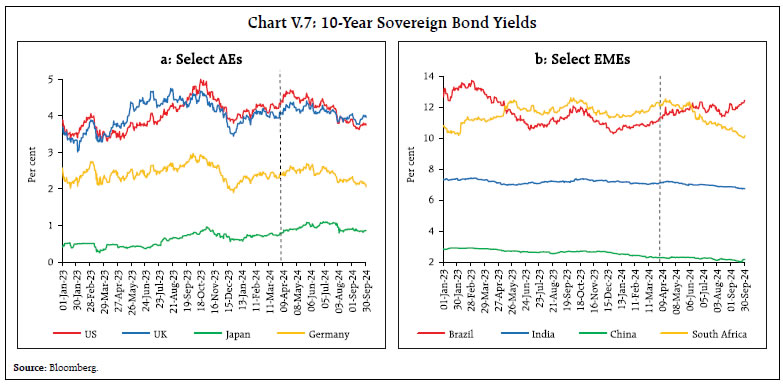 In tandem with Q1:2024, sovereign bond yields across major AEs continued to harden in April in response to expectations of a firmer future path of interest rates, sensitivity to rising fiscal risks and tight liquidity conditions. Beginning May, however, yields softened as incoming data signaled an improving inflation outlook for the US, raising the odds for an imminent rate cut. Illustratively, the US 10-year treasury yield rose by 48 bps in April but shed 78 bps between May-August over evolving perceptions of rate cuts. Subsequently, yields fell precipitously in August and early September, remaining below the 4 per cent mark in response to the release of underwhelming high-frequency indicators. Since mid-September, however, yields hardened as market expectations of the Federal Reserve rate cut for November shifted from 50 bps to 25 bps. Also, the yield curve inversion i.e. negative 10- minus 2-year spread that had persisted since July 2022, has reversed to become positive in September 2024. The UK 10-year bond yield broadly tracked the US market while the German 10-year yield softened in response to the ECB’s rate cut actions and forward guidance. Yield on 10-year JGBs rose by 33 bps between April and July, pushed up by the BoJ’s policy rate hike, including tapering of their bond purchase programme, but softened by 20 bps since August on a dovish stance (Chart V.7a). Bond yields in several EMEs exhibited a softening bias, driven by easing of domestic financial conditions as well as global cues (Chart V.7b). Bond yields in Brazil, however, hardened till July as investors trimmed their portfolios but remained volatile thereafter. In the currency markets, the US dollar remained range bound in Q2:2024, with an upward bias over changing bouts of optimism about policy easing and intermittent escalation of geopolitical and electoral risks increasing safe haven demand. Cooling labour market conditions, easing inflation and flagging high-frequency indicators of economic growth, however, led to a policy pivot by the Fed, causing a depreciation of the US dollar in Q3:2024 (Chart V.8a). However, in late September the dollar index, changed its course upon the release of better-than-expected labour market data. These movements were mirrored in the EME currencies, exacerbated by swings in capital flows (Chart V.8b). The MSCI Emerging Market Currency Index remained rangebound in Q2:2024 but rose by 4.0 per cent in Q3:2024. V.5 Conclusion Global growth remains resilient though flaring geopolitical tensions, flagging recovery in China, and extreme weather events pose downside risks to the outlook. Inflation remains vulnerable to weak progress in services disinflation, easing financial conditions, high public debt, strong wage growth, potential escalation of trade tensions and geoeconomic fragmentation. Even as most nations tread the path of policy normalisation, they remain cautious on rate cuts and the level of restrictiveness. Greater uncertainty about the evolving policy path is reflected in financial markets, which are buoyant yet volatile, reacting sharply to policy changes and economic data releases. Although prospects for EMEs are improving, they remain susceptible to external geopolitical risks and evolving financial conditions in advanced economies. _________________________________________________________________________________
ABBREVIATIONS | AE | Advance Estimates | | AEs | Advanced Economies | | APP | Asset Purchase Programme | | ARDL | Autoregressive Distributed Lag | | ASEAN | Association of Southeast Asian Nations | | ASISO | Automated Sweep-in and Sweep-out | | ATM | At the money | | bbl | Barrel | | BE | Budget Estimates | | BIES | Business Inflation Expectations Survey | | BoE | Bank of England | | BoJ | Bank of Japan | | BoR | Bank of Russia | | bps | Basis Points | | BRICS | Brazil, Russia, India, China and South Africa | | BSE | Bombay Stock Exchange | | CACP | Commission for Agricultural Costs and Prices | | CAD | Current Account Deficit | | CAG | Comptroller and Auditor General | | CASA | Current Account and Savings Account | | CCIL | Clearing Corporation of India Limited | | CDs | Certificates of Deposit | | CDS | Credit Default Swap | | CES | Constant Elasticity of Substitution | | CGA | Controller General of Accounts | | CI | Confidence Interval | | CiC | Currency in Circulation | | CII | Confederation of Indian Industry | | CLI | Composite Leading Indicator | | CMIE | Centre for Monitoring Indian Economy | | COVID-19 | Coronavirus Disease 2019 | | CPB | Central Planning Bureau | | CPC | Central Pay Commission | | CPI | Consumer Price Index | | CPI-AL | Consumer Price Index for Agricultural Labourers | | CPI-IW | Consumer Price Index for Industrial Workers | | CPI-RL | Consumer Price Index for Rural Labourers | | CPs | Commercial Papers | | CRAR | Capital to Risk (Weighted) Assets Ratio | | CRR | Cash Reserve Ratio | | CU | Capacity Utilisation | | CV | Coefficient of Variation | | DCA | Department of Consumer Affairs | | DFM | Dynamic Factor Model | | DFR | Deposit Facility Rate | | DGCA | Directorate General of Civil Aviation | | DGCI&S | Directorate General of Commercial Intelligence and Statistics | | DI | Diffusion Index | | DII | Domestic Institutional Investor | | EBIT | Earnings Before Interest and Taxes | | EBLR | External Benchmark Lending Rate | | ECB | European Central Bank | | ECI | Eight Core Industries | | EIA | Energy Information Administration | | EMEs | Emerging Market Economies | | EPFO | Employees’ Provident Fund Organisation | | EPU | Economic Policy Uncertainty | | ER | Employment Rate | | ERR | Excess Reserve Rate | | FAE | First Advance Estimates | | FAO | Food and Agriculture Organization | | FBIL | Financial Benchmarks India Pvt. Ltd | | FCI | Financial Conditions Index | | FCNR | Foreign Currency Non-Resident | | FDI | Foreign Direct Investment | | Fed | Federal Reserve | | FI | Financial Institution | | FICCI | Federation of Indian Chambers of Commerce & Industry | | FIMMDA | Fixed Income Money Market and Derivatives Association of India | | FIs | Financial Institutions | | FL | Family Labour | | FMCG | Fast Moving Consumer Goods | | FOMC | Federal Open Market Committee | | FPI | Foreign Portfolio Investment/Investor | | FPO | Follow on Public Offer | | FRBKC | Federal Reserve Bank of Kansas City | | FRE | First Revised Estimate | | FRL | Full Reservoir Level | | FRRR | Fixed Rate Reverse Repo | | F-TRAC | FIMMDA Trade Reporting and Confirmation System | | GDP | Gross Domestic Product | | GFCE | Government Final Consumption Expenditure | | GFCF | Gross Fixed Capital Formation | | GFD | Gross Fiscal Deficit | | GNDI | Gross National Disposable Income | | GoI | Government of India | | G-Secs | Government Securities | | GST | Goods and Services Tax | | GVA | Gross Value Added | | H1 | First Half of the Financial Year (April-September) | | H2 | Second Half of the Financial Year (October-March) | | HFI | High Frequency Indicator | | HSBC | Hong Kong and Shanghai Banking Corporation | | HSD | High-Speed Diesel | | ICICI | Industrial Credit and Investment Corporation of India | | ICR | Interest Coverage Ratio | | I-CRR | Incremental Cash Reserve Ratio | | IIF | Institute of International Finance | | IIP | Index of Industrial Production | | IL&FS | Infrastructure Leasing & Financial Services | | IMD | India Meteorological Department | | IMF | International Monetary Fund | | INR | Indian Rupee | | IOCL | Indian Oil Corporation Limited | | IPO | Initial Public Offering | | IRDAI | Insurance Regulatory and Development Authority | | IRF | Impulse Response Function | | IRFCL | International Reserves and Foreign Currency Liquidity | | ISRO | Indian Space Research Organisation | | IT | Information Technology | | JGB | Japanese Government Bond | | JSE | Johannesburg Stock Exchange | | LAF | Liquidity Adjustment Facility | | LCR | Liquidity Coverage Ratio | | LFPR | Labour Force Participation Rate | | LPG | Liquefied Petroleum Gas | | LPR | Loan Prime Rate | | MCLR | Marginal Cost of Funds Based Lending Rate | | MEP | Minimum Export Price | | MFs | Mutual Funds | | MGNREGA | Mahatma Gandhi National Rural Employment Guarantee Act | | MIBOR | Mumbai Interbank Offer Rate | | MIS | Market Intervention Scheme | | MLF | Marginal Lending Facility | | mmbtu | Metric Million British Thermal Unit | | MMO | Money Market Operations | | M-o-M | Month-on-Month | | MOSPI | Ministry of Statistics and Programme Implementation | | MPC | Monetary Policy Committee | | MPR | Monetary Policy Report | | MRO | Main Refinance Operation | | MSCI | Morgan Stanley Capital International | | MSF | Marginal Standing Facility | | MSME | Micro, Small and Medium Enterprises | | MSP | Minimum Support Price | | NBFCs | Non-Banking Financial Companies | | NCAER | National Council of Applied Economic Research | | NDS | Negotiated Dealing System | | NDS-OM | Negotiated Dealing System-Order Matching | | NDTL | Net Demand and Time Liabilities | | NEER | Nominal Effective Exchange Rate | | NIM | Net Interest Margin | | NPA | Non-Performing Asset | | NRE | Non-Resident External | | NRO | Non-Resident Ordinary | | NSC | National Savings Certificate | | NSDL | National Securities Depository Limited | | NSO | National Statistical Office | | NSSO | National Sample Survey Office | | OECD | Organisation for Economic Co-operation and Development | | OIS | Overnight Index Swaps | | OMOs | Open Market Operations | | OMSS | Open Market Sale Scheme | | OPEC | Organization of the Petroleum Exporting Countries | | ORR | Overnight Repo Rate | | ORRR | Overnight Reverse Repo Rate | | OTC | Over-the-Counter | | P | Provisional | | PA | Provisional Accounts | | PADO | Public Administration, Defence and Other Services | | PBoC | People’s Bank of China | | PCE | Personal Consumption Expenditure | | PDs | Primary Dealers | | PE | Provisional Estimates | | PEPP | Pandemic Emergency Purchase Programme | | PFCE | Private Final Consumption Expenditure | | PL | Personal Loans | | PLFS | Periodic Labour Force Survey | | PMI | Purchasing Managers’ Index | | POL | Petroleum, Oil and Lubricants | | POSOCO | Power System Operation Corporation Limited | | PPAC | Petroleum Planning & Analysis Cell | | PRN | Production-Weighted Rainfall Index | | PSBs | Public Sector Banks | | PSS | Price Support Scheme | | PSUs | Public Sector Undertakings | | PVBs | Private Sector Banks | | Q1 | First Quarter | | Q2 | Second Quarter | | Q3 | Third Quarter | | Q4 | Fourth Quarter | | QIP | Qualified Institutional Placement | | q-o-q | Quarter-on-Quarter | | QQE | Quantitative and Qualitative Monetary Easing | | RBA | Reserve Bank of Australia | | RBI | Reserve Bank of India | | RBNZ | Reserve Bank of New Zealand | | RD | Revenue Deficit | | RE | Revised Estimates | | RECO | Revenue Expenditure to Capital Outlay | | REER | Real Effective Exchange Rate | | RHS | Right Hand Side | | RL | Rural Labourers | | RM | Reserve Money | | RRR | Reverse Repo Rate | | S&P | Standard and Poor's | | SAAR | Seasonally Adjusted Annualised Rate | | SCBs | Scheduled Commercial Banks | | SDF | Standing Deposit Facility | | SEBI | Securities and Exchange Board of India | | SGS | State Government Securities | | SIAM | Society of Indian Automobile Manufacturers | | SIP | Systematic Investment Plan | | SLF | Standing Liquidity Facility | | SLR | Statutory Liquidity Ratio | | SME | Small and Medium-sized Enterprises | | SPDs | Standalone Primary Dealers | | SPF | Survey of Professional Forecasters | | SSE | Shanghai Stock Exchange | | SSI | Small Savings Instruments | | STU | Stocks-to-Use | | SVAR | Structural Vector Autoregression | | SWM | South-West Monsoon | | TBs/T-Bill | Treasury Bill | | TMA | Tractor and Mechanization Association | | TOP | Tomato, Onion, and Potato | | TREPS | Tri-party Repo | | UK | United Kingdom | | UMP | Unemployement Rate | | UNCTAD | United Nations Conference on Trade and Development | | US | United States | | US$ | US Dollar | | USA | United States of America | | UT | Union Territory | | VAR | Vector Auto Regression | | VAT | Value Added Tax | | VECM | Vector Error Correction Model | | VRR | Variable Rate Repo | | VRRR | Variable Rate Reverse Repo | | WAC | Weighted Average Coupon | | WACMR | Weighted Average Call Money Rate | | WACR | Weighted Average Call Rate | | WADR | Weighted Average Discount Rate | | WADTDR | Weighted Average Domestic Term Deposit Rate | | WALR | Weighted Average Lending Rate | | WAM | Weighted Average Maturity | | WAMMR | Weighted Average Money Market Rate | | WAY | Weighted Average Yield | | WEO | World Economic Outlook | | WMA | Ways and Means Advances | | WPI | Wholesale Price Index | | WTO | World Trade Organisation | | YCC | Yield Curve Control | | Y-o-Y | Year-on-Year | |