State-specific Fiscal Responsibility Legislations (FRLs) have established a foundation for prudent fiscal management across States over the past two decades. The introduction of direct benefit transfers, adoption of the national pension system and implementation of GST have also contributed to improving their finances. The health of State-owned electricity distribution companies remains a stress point. Future reforms in subnational finances can include adoption of a risk-based fiscal framework; provisions for counter-cyclical fiscal policy actions; a medium-term expenditure framework incorporating the ‘golden rule’ for government spending; and enhanced data dissemination and communication policies. 1. Introduction 3.1 The enactment of Fiscal Responsibility and Budget Management (FRBM) Acts/ Fiscal Responsibility Legislations (FRLs) by States paved the way for sub-national fiscal consolidation, starting 2004-05. It complemented the provision of debt and interest relief to States by the Central government. Since then the States have followed a series of reforms aimed at improving the sustainability, efficiency, and transparency of their finances. An assessment of these fiscal reforms is the theme of this chapter. Section 2 examines the performance of States in terms of adherence to fiscal rules. Section 3 highlights the major institutional reforms, followed by expenditure and tax reforms in Sections 4 and 5, respectively. Section 6 focuses on the reforms in financing patterns. Challenges encountered in the power sector are discussed in Section 7, while the agenda for future reforms is set out in Section 8. Section 9 puts forth concluding observations. 2. Review of Sub-national Fiscal Rules 3.2 Fiscal rules facilitate prudent fiscal management by bringing discipline in the conduct of public finances (Akin et al., 2017). Following the FRBM Act of 2003 by the Government of India, the States adopted their respective FRLs with the objective of designing and implementing a rule-based fiscal management system. The implementation of FRLs has incentivised formulation of fiscal policy strategies, creation of Medium-Term Fiscal Plans (MTFPs) and improvement in transparency. States have amended their FRLs periodically to adapt to changing needs. 3.3 Fiscal rules can be classified into four broad categories, based on the fiscal variables these rules impinge upon (Schaechter et al., 2012; Bova et al., 2015). The Budget Balance Rules (BBRs) aim at targeting either the overall fiscal balance or the cyclically adjusted fiscal balance. Debt rules set ceilings for public debt-to-GDP ratios. Expenditure rules restrict total or specific government spending. Revenue rules aim to control revenue through taxation limits or by ensuring minimum receipts. The FRBM Act of the Centre and FRLs of the States follow a deficit rule and set a debt-to-GDP ratio target. 2.1 Fiscal Management Principles 3.4 Internationally accepted fiscal management principles incorporate the features of transparency, stability, responsibility, fairness, and efficiency at their core. Transparency ensures clear policy objectives and access to information by public. Stability involves predictable policymaking and some certainty around its economic impact. Responsibility emphasises integrity in budget formulation and public finance management. Fairness considers financial implications for future generations, and efficiency pertains to the effective design and implementation of fiscal policy and asset/liability management (RBI, 2005). 3.5 Containing the fiscal deficit and revenue deficit within prescribed limits, maintaining the debt stock at a sustainable level, using borrowed funds for productive use and capping guarantees within an indicative ceiling are some of the fiscal management principles adopted by the States’ FRLs. The associated rules also require three documents to be laid before the legislatures at the time of presentation of the State budget: (i) Macro-economic Framework Statement containing an overview of the State economy, an analysis of growth and sectoral composition of GSDP, and an assessment related to State government finances and future prospects; (ii) Medium Term Fiscal Policy (MTFP) Statement, outlining the State government’s fiscal goals and three-year rolling targets, covering revenue-expenditure balance, use of capital receipts for productive assets, and estimated pension liabilities for the next ten years; and (iii) Fiscal Policy Strategy Statement covering the State’s fiscal policies for the upcoming year relating to taxation, expenditure, borrowings and other liabilities. The States’ FRLs also entail that the document should highlight strategic fiscal priorities; key fiscal measures; reasons for any significant deviations in policies related to taxation, subsidies, and expenditures; and provide an evaluation of current policies against the fiscal management principles. Currently, these Statements are disseminated by most of the major States either on their finance department websites or on other public platforms (Table III.1). 3.6 A review of the outcomes vis-à-vis the rolling targets specified in the MTFP Statements/ FRL Acts indicates that ten and nine major States could successfully achieve their fiscal deficit and debt ceiling goals, respectively, in 2021-22 (Chart III.1). Following the recommendation of the FRBM Review Committee (2017), the Finance Act, 2018, amended the Centre’s FRBM Act (2003) to set up well-defined escape clauses, which could be invoked only in the cases of (a) national security concerns, acts of war, major disasters, and significant agricultural collapse; (b) substantial structural reforms leading to unforeseen fiscal impacts; and (c) a decline in real output growth of at least 3 percentage points below the average of the previous four quarters (Datta et al., 2023). Subsequently, most major States invoked such escape clauses in their FRLs in the aftermath of the pandemic (Table III.1). | Table III.1: FRL Practices of States | | States releasing FRL documents in the public domain1 | Andhra Pradesh, Bihar, Chhattisgarh, Gujarat, Haryana, Himachal Pradesh, Jharkhand, Karnataka, Kerala, Madhya Pradesh, Maharashtra, Odisha, Punjab, Rajasthan, Tamil Nadu, Telangana, Uttar Pradesh, Uttarakhand, West Bengal. | | States having escape clause relating to natural calamity/internal security/exceptional circumstances | Andhra Pradesh, Bihar, Chhattisgarh, Goa, Gujarat, Himachal Pradesh, Haryana, Jharkhand, Karnataka, Madhya Pradesh, Maharashtra, Odisha, Punjab, Rajasthan, Tamil Nadu, Telangana, Uttar Pradesh, Uttarakhand, West Bengal. | | Source: Budget documents of State governments; and States’ FRL/FRBM Acts. |
2.2 Fiscal Transparency Principles 3.7 Fiscal transparency promotes government accountability and trust among stakeholders (Kopits and Craig, 1998). It boosts budget credibility and reliability by making budget information accessible (Sarr, 2015; Jena and Sikdar, 2019). Public scrutiny of available information enhances market confidence, prevents mismanagement and diversion of public funds, improves policy effectiveness, and encourages public engagement in budget processes, ultimately resulting in fiscal discipline, stability, and sustainable economic growth. 3.8 The Advisory Group on Fiscal Transparency (2001) recognised that State-level fiscal transparency in India lagged that of the Central government. Following its recommendation of minimum transparency standards, most of the States publish a document titled ‘Budget at a Glance’. The transparency measures enunciated in the Model FRL Act (RBI, 2005) require State governments to promote the disclosure of fiscal data such as any significant changes in accounting standards, policies and practices which are affecting or have the potential to affect the computation of fiscal indicators. A review of States’ FRL documents reveals that Himachal Pradesh, Jharkhand, Karnataka, Maharashtra, Odisha and Rajasthan explicitly report these disclosures in their budget documents.3 3.9 As a part of transparency measures, a few States have legislated the disclosure of estimated pension liabilities for the next ten years worked out on an actuarial basis to assess their likely pension burden, mode of financing and impact on deficit indicators. Currently, Andhra Pradesh, Bihar, Chhattisgarh, Gujarat, Haryana, Madhya Pradesh, Odisha and Rajasthan are disclosing such information.4 The disclosure of other sensitive information like contingent liabilities, off-budget borrowings, and employee details lack uniformity across States. 3.10 State governments resort to supplementary grants when expenditures under specific heads are anticipated to surpass the initially appropriated amounts. Most of the State FRLs stipulate disclosure of supplementary estimates on grants, and a review reveals that most States are compliant with this stipulation. The actual utilisation of these supplementary grants have been often short of the estimate, according to the CAG.5 2.3 Fiscal Marksmanship 3.11 Fiscal marksmanship examines the degree of correspondence between budgeted projections and the actual outcome of key fiscal indicators (Chakraborty, et al. 2020). The discrepancies between budgeted and actual numbers can reflect errors in assumptions or the occurrence of unexpected events. For State governments in India, poor fiscal marksmanship has been observed for the broader components of receipts and expenditures (Jena and Singh, 2021; Chakraborty et al., 2020). 3.12 The Public Expenditure and Financial Accountability (PEFA) framework can be used to evaluate the budgets of State governments. Established in 2001 by seven international development partners – the European Commission, the International Monetary Fund (IMF), the World Bank, and the governments of France, Norway, Switzerland, and the United Kingdom – the PEFA programme provides a standardised methodology and reference tool for Public Financial Management (PFM) diagnostic assessments. Among the 31 performance indicators encompassing a wide range of PFM activities grouped under seven pillars in the PEFA framework, those pertaining to Budget Reliability and Transparency of Public Finances are particularly relevant for this analysis (Table III.2 and Annex Table III.1). 3.13 Data spanning 20 major States focusing on key components of receipts and expenditure across two distinct periods – 2016-17 to 2018-19 (Period I) and 2019-20 to 2021-2022 (Period II) are evaluated for budget credibility using the PEFA framework. For overall revenue receipts, while three and five States could achieve “A” and “B” scores, respectively, in Period I, none of them could achieve “A” or “B” scores in Period II. The deterioration in budget forecasts could reflect the impact of the COVID-19 pandemic on economic activity and thereby on the finances of the States. Correspondingly, the number of States with “D” score increased from 11 in Period I to 16 in Period II (Table III.3). Component-wise, for States Goods and Services Tax (SGST) – the largest source of States’ own tax revenue – only three States received a “B” score while the remaining States received a “D” score in Period II. Among the other components, the number of States with a “D” score declined in Period II for stamp duty and registration fees; sales tax; and grants from the Centre. In contrast, the number of States with “D” scores increased for excise duties and non-tax revenue during this period. Apart from the economic uncertainty associated with the pandemic, deviations from budget estimates often result from volatility in Central transfers, impaired State budgeting mechanisms, insufficient staff and resources, and infrastructural bottlenecks at the departmental level (Srinivasan and Misra, 2021; Acharya and Bose, 2020). | Table III.2 PEFA Scoring Mechanism | | Score | Receipts | Expenditure | | A | Actual receipt falls within 97 per cent to 106 per cent of the budget estimate in at least two of the last three years. | Actual expenditure falls within 95 per cent to 105 per cent of the budget estimate in at least two of the last three years. | | B | Actual receipt falls within 94 per cent to 112 per cent of the budget estimate in at least two of the last three years. | Actual expenditure falls within 90 per cent to 110 per cent of the budget estimate in at least two of the last three years. | | C | Actual receipt falls within 92 per cent to 116 per cent of the budget estimate in at least two of the last three years. | Actual expenditure falls within 85 per cent to 115 per cent of the budget estimate in at least two of the last three years. | | D | Performance is below the “C” level. | | Source: https://www.pefa.org. |
| Table III.3: Fiscal Marksmanship of Revenue Receipts and its Components using PEFA | | Period | PEFA Score | | A | B | C | D | | Revenue Receipts | | I | JH, MP, OD | GO, GJ, KL, MH, TN | WB | AP, BR, CG, HR, HP, KA, PB, RJ, TL, UP, UK | | II | - | - | GJ, JH, KL, OD | AP, BR, CG, GO, HR, HP, KA, MP, MH, PB, RJ, TN, TL, UP, UK, WB | | States’ Own Tax Revenue | | I | JH, RJ | KL, MP, MH, OD, TN | BR, CG, GO | AP, GJ, HR, HP, KA, PB, TL, UP, UK, WB | | II | TL | JH, KL, MH | CG | AP, BR, GO, GJ, HR, HP, KA, MP, OD, PB, RJ, TN, UP, UK, WB | | Stamps and Registration Fees | | I | JH, KA | AP, KL, TN, WB | GJ | BR, CG, GO, HR, HP, MP, MH, OD, PB, RJ, TL, UP, UK | | II | BR | JH, MP, RJ, TL, WB | CG, PB | AP, GO, GJ, HR, HP, KA, KL, MH, OD, TN, UP, UK | | SGST | | II | - | JH, KL, MH | - | AP, BR, CG, GO, GJ, HR, HP, KA, MP, OD, PB, RJ, TN, TL, UP, UK, WB | | State Sales Tax/VAT | | I | JH, MP | MH, PB, TN | - | AP, BR, CG, GO, GJ, HR, HP, KA, KL, OD, RJ, TL, UP, UK, WB | | II | CG, MP | TL | BR, JH, KL, MH, PB, UK, WB | AP, GO, GJ, HR, HP, KA, OD, RJ, TN, UP | | Excise Duties | | I | JH, TL | KL, OD, TN, UK, WB | MP, MH, RJ | AP, CG, GO, GJ, HR, HP, KA, PB, UP | | II | JH, MH | GO, GJ, TN, TL | CG | AP, HR, HP, KA, KL, MP, OD, PB, RJ, UP, UK, WB | | Non-Tax Revenue | | I | OD | GO, UP, WB | BR, GJ, JH | AP, CG, HR, HP, KA, KL, MP, MH, PB, RJ, TN, TL, UK | | II | - | JH, OD | - | AP, BR, CG, GO, GJ, HR, HP, KA, KL, MP, MH, PB, RJ, TN, TL, UP, UK, WB | | Grants from the Centre | | I | - | GO, GJ | JH, KL | AP, BR, CG, HR, HP, KA, MP, MH, OD, PB, RJ, TN, TL, UP, UK, WB | | II | OD | JH, KL, MP, RJ, TN, WB | KA | AP, BR, CG, GO, GJ, HR, HP, MH, PB, TL, UP, UK | | Source: RBI staff estimates. | 3.14 The forecast deviations in States’ revenues can, in turn, impinge upon their actual expenditures relative to budget estimates (Jena, 2006). This effect is observed in revenue expenditure across several major sectors such as urban development, agriculture and allied activities, rural development and energy, with numerous States generally in category “D” in both the periods (Table III.4). The notable exceptions are medical and public health, social security and welfare, with an increasing number of States having improved their expenditure predictability in Period II compared to Period I. | Table III.4: Fiscal Marksmanship of Revenue Expenditure and its Components using PEFA | | Period | PEFA Score | | A | B | C | D | | Revenue Expenditure | | I | AP, KA, MP, RJ, TN, WB | CG, GO, GJ, HR, HP, KL, MH, UP, UK | BR, JH, OD, PB | TL | | II | KA, KL, RJ, TN, WB | CG, GJ, MP, OD, PB | GO, HR, HP, MH, TL, UK | AP, BR, JH, UP | | Education, Sports, Art and Culture | | I | GO, RJ | GJ, KA, KL, MP, PB, TN, TL, UP, UK, WB | AP, BR, CG, MH, OD | HR, HP, JH | | II | AP, GJ, KA | MP, OD, PB, RJ, TN, WB | CG, KL, MH, TL, UP, UK | BR, GO, HR, HP, JH | | Medical and Public Health | | I | GJ, KA, MH, OD | AP, BR, GO, HR, KL, MP, RJ, TN | HP, JH, PB, UP | CG, TL, UK, WB | | II | BR, CG, HR, TN | GO, GJ, KA, MP, MH, OD, PB, RJ, TL, UK | AP, KL | HP, JH, UP, WB | | Urban Development | | I | KA, WB | GJ | RJ | AP, BR, CG, GO, HR, HP, JH, KL, MP, MH, OD, PB, TN, TL, UP, UK | | II | - | - | CG, GJ, JH, KA, OD, RJ | AP, BR, GO, HR, HP, KL, MP, MH, PB, TN, TL, UP, UK, WB | | Social Security and Welfare | | I | HR, HP, KA, RJ. | MP, TN, TL | BR, GO, GJ, MH, OD, UK | AP, CG, JH, KL, PB, UP, WB | | II | AP, BR, HR, HP, KA, OD | JH, MP, PB, TN, WB | CG, MH, RJ | GO, GJ, KL, TL, UP, UK | | Agriculture and Allied Activities | | I | TN | AP, HP, KA, MP, OD, UK | KL, RJ | BR, CG, GO, GJ, HR, JH, MH, PB, TL, UP, WB | | II | TN | KA, RJ | GJ, HP, OD | AP, BR, CG, GO, HR, JH, KL, MP, MH, PB, TL, UP, UK, WB | | Rural Development | | I | OD | WB | CG, GJ, KA, UP | AP, BR GO, HR, HP, JH, KL, MP, MH, PB, RJ, TN, TL, UK | | II | CG, OD | KA, RJ, TL, WB | MP, UK | AP, BR, GO, GJ, HR, HP, JH, KL, MH, PB, TN, UP | | Energy | | I | GO, KA, UP | RJ, TN, TL | CG, HR, UK | AP, BR, GJ, HP, JH, KL, MP, MH, OD, PB, WB | | II | TL | CG, GO, GJ, TN, UK | AP, HR, RJ | BR, HP, JH, KA, KL, MP, MH, OD, PB, UP, WB | | Source: RBI staff estimates. | 3.15 For capital outlay, the number of States with “A” and “B” scores declined from Period I to Period II (Table III.5). In Period II, the number of States with a “D” score is much higher at 13 for capital outlay as against only four for revenue expenditure, suggesting that capital expenditure is often compromised in the face of shortfalls to comply with the fiscal rules. In addition, programme management and structural bottlenecks often hinder budget implementation and spending during the year (Saha and James, 2022). Within capital expenditure, there is a deterioration in fiscal marksmanship, as reflected by “D” scores in Period II, in almost all the areas except energy. | Table III.5: Fiscal Marksmanship of Capital Expenditure and its Components using PEFA | | Period | PEFA Score | | A | B | C | D | | Capital Outlay | | I | KA, MP, OD | GJ, HP, JH, KL, UK, WB | BR, TN | AP, CG, GO, HR, MH, PB, RJ, TL, UP | | II | JH, TL | MP | HP, KA, KL, TN | AP, BR, CG, GO, GJ, HR, MH, OD, PB, RJ, UP, UK, WB | | Medical and Public Health | | I | UK | BR, GJ, WB | MP | AP, CG, GO, HR, HP, JH, KA, KL, MH, OD, PB, RJ, TN, TL, UP | | II | - | - | TN | AP, BR, CG, GO, GJ, HR, HP, JH, KA, KL, MP, MH, OD, PB, RJ, TL, UP, UK, WB | | Water Supply and Sanitation | | I | - | GJ, UP | AP, BR, KA, MH, OD | CG, GO, HR, HP, JH, KL, MP, PB, RJ, TN, TL, UK, WB | | II | HP | KA, MP, UK | | AP, BR, CG, GO, GJ, HR, JH, KL, MH, OD, PB, RJ, TN, TL, UP, WB | | Urban Development | | I | HR, JH | KA | HP | AP, BR, CG, GO, GJ, KL, MP, MH, OD, PB, RJ, TN, TL, UP, UK, WB | | II | - | - | GJ, KA | AP, BR, CG, GO, HR, HP, JH, KL, MP, MH, OD, PB, RJ, TN, TL, UP, UK, WB | | Agriculture and Allied Activities | | I | HP | - | MP | AP, BR, CG, GO, GJ, HR, JH, KA, KL, MH, OD, PB, RJ, TN, TL, UP, UK, WB | | II | - | - | - | AP, BR, CG, GO, GJ, HR, HP, JH, KA, KL, MP, MH, OD, PB, RJ, TN, TL, UP, UK, WB | | Irrigation and Flood Control | | I | GJ, MH | - | BR, KA, MP, OD, RJ | AP, CG, GO, HR, HP, JH, KL, PB, TN, TL, UP, UK, WB | | II | KA | JH | HR | AP, BR, CG, GO, GJ, HP, KL, MP, MH, OD, PB, RJ, TN, TL, UP, UK, WB | | Transport | | I | BR | JH, TL | HP, KA, MH, OD | AP, CG, GO, GJ, HR, KL, MP, PB, RJ, TN, UP, UK, WB | | II | - | RJ, TN | CG, JH, KA, MP | AP, BR, GO, GJ, HR, HP, KL, MH, OD, PB, TL, UP, UK, WB | | Energy | | I | GJ, HR, KA, UP | - | RJ | AP, BR, CG, GO, HP, JH, KL, MP, MH, OD, PB, TN, TL, UK, WB | | II | BR, HP, KA | GJ | OD, UP | AP, CG, GO, HR, JH, KL, MP, MH, PB, RJ, TN, TL, UK, WB | | Source: RBI staff estimates. | 2.4 Enforcement of Compliance 3.16 To comply with fiscal policy rules, the FRLs of most of the States have a provision for disclosing an annual report detailing outcomes compared to targets, in line with the recommendations of the Group on Model Fiscal Responsibility Legislation at the State Level (RBI, 2005). Additionally, most State FRLs specify the release of monthly/ quarterly/half-yearly outcome reports which review the trends in receipts and expenditure in relation to the budget estimates. In case of non-achievement of targets, States are mandated to elicit the remedial measures required. These compliance reports are required to be placed before the State Legislature by the Minister in charge of Finance at specified intervals. At present, Andhra Pradesh, Haryana, Karnataka, Madhya Pradesh, Odisha, Punjab, Rajasthan and Tamil Nadu are releasing such review reports.6 In addition, some States have stipulated the constitution of an independent agency to monitor the compliance of the provisions of FRL. States like Karnataka, Kerala, Rajasthan and West Bengal have legislated the constitution of a Public Expenditure Review Committee to submit independent review reports.7, 8 3. Institutional Reforms 3.17 Institutional reforms have been pivotal in transforming India’s fiscal landscape. By reshaping Centre-State fiscal relations and governance structures, these reforms have empowered States to manage public finances more effectively and tailor development strategies to their unique needs. Key among these changes are the establishment of the NITI Aayog and the creation of State Institutions for Transformation (SITs). 3.1 Constitution of NITI Aayog 3.18 The Planning Commission, established in 1950, was replaced by the National Institution for Transforming India (NITI Aayog) in 2015. The NITI Aayog, unlike its predecessor, does not have resource allocation as part of its mandate. The role of intermediation of Annual Plans and transfer of Plan funds to State governments has now been conferred on the Ministry of Finance. NITI Aayog has a twin mandate: (i) to oversee the adoption and monitoring of the sustainable development goals (SDGs) in the country; and (ii) to promote competitive and cooperative federalism among States and UTs to align the policies and schemes of Central and State governments in these sectors. 3.2 Setting up of State Institutions of Transformation 3.19 State governments play a major role in creating an enabling environment for sustainable and inclusive growth. Levers of development like health, education, skill building, infrastructure, land administration and urbanisation are primarily driven by State governments. State Support Mission, an umbrella initiative by NITI Aayog, aims at fostering structured and institutionalised engagement with States and UTs to assist them in achieving socioeconomic goals by 2047. The mission has been strategically designed to support States/UTs in developing a roadmap aligned with national priorities and their core strengths (NITI Aayog, 2023). One of the critical components of the State Support Mission is to set up State Institutions for Transformation (SITs), where States/UTs can either establish new SITs or reconfigure existing institutions with support from NITI Aayog, including setting up bodies to replace their planning boards. So far, the NITI Aayog has collaborated with seven State governments – Assam, Gujarat, Karnataka, Maharashtra, Madhya Pradesh, Uttar Pradesh and Uttarakhand – to establish SITs tailored to meet the specific needs of each State (Annex Table III.2). They will play a pivotal role in fostering partnerships, mobilising resources, generating ideas, and creating synergies for the States to realise their goals. 3.3 Changing Dynamics of Transfers to States 3.20 After the abolition of the Planning Commission, the channel of central funding to the States was confined to Finance Commission transfers and Central grants through various Centrally Sponsored Schemes (CSS) administered by Central ministries. In order to compensate the States after the cessation of plan grants, the 14th Finance Commission (FC-XIV) raised the vertical share of taxes to 42 per cent from 32 per cent recommended by the 13th Finance Commission (FC-XIII), thus making tax devolution the primary vehicle for federal transfers. It was expected that the increase in unconditional transfers would provide adequate flexibility to the States to spend as per their needs, thus furthering fiscal federalism and conferring more fiscal autonomy on States. Accordingly, the average share of Finance Commission transfers9 in total Central transfers increased from 65 per cent in the period of FC-XIII to 70 per cent in the period of FC-XV (2020-21 to 2024-25) (Chart III.2a). During the same period, there has been an improvement in the quality of States’ expenditure (Chart III.2b). 4. Major Expenditure Reforms 3.21 One of the main pillars of fiscal reforms by States is expenditure rationalisation aimed at reducing unproductive expenditure and channelising resources to the priority areas. 4.1 Introduction of Direct Benefit Transfer 3.22 Direct Benefit Transfer (DBT) – the system of delivering welfare benefits directly to the targeted beneficiaries – was originally envisaged in 2013 under which welfare benefits were directly credited to the bank or postal accounts of the accurately identified targeted beneficiaries in 43 districts for 24 Central schemes (GoI, 2013). The full potential of DBT was unleashed with the JAM Trinity – Jan Dhan, Aadhaar, and Mobile – leveraging digital public infrastructure to directly transfer the benefits and social security payments of various government schemes to the bank account of the intended beneficiary (GoI, 2016). 3.23 State governments have also started disbursing benefits under their exclusive schemes through DBT (Annex Table III.3). Over the years, DBT has been applied to more than 2,000 schemes at the State level. States have leveraged DBT and other governance reforms to remove duplicate/fake beneficiaries and plug leakages. In Uttar Pradesh, DBT has been used to pay sugarcane prices to eligible farmers. States like Telangana and Andhra Pradesh are implementing Rythu Bandhu and Rythu Bharosa schemes, respectively, for farmers through DBT. Odisha’s Krushak Assistance for Livelihood and Income Augmentation (KALIA) scheme uses DBT to provide financial assistance to needy farmers to carry forward cultivation activities. Andhra Pradesh, Bihar, Chhattisgarh, Telangana, Uttarakhand and Uttar Pradesh are using the DBT route to implement various State government pension schemes. States like Gujarat, Maharashtra and Uttarakhand have adopted DBT for the disbursement of scholarships to students through online mode. In addition, almost all States are using the DBT route to deliver welfare benefits to women and girls under various schemes. The DBT Mission of the Government of India monitors and evaluates the performance of various States and UTs. States were assigned DBT scores, based on their performance on parameters like Aadhaar saturation, data reporting, savings-expenditure ratio and DBT per capita (Chart III.3).  3.24 DBT has generated significant monetary savings for State governments by reducing corruption, duplication, and leakages. For the beneficiaries, the expansion of DBT and integration with UPI has reduced delays in payments, empowered individuals and ensured higher consumption standards. DBT played an important role in extending financial support to vulnerable sections of society like small farmers, unorganised sector workers, migrant labour, women, and senior citizens during the pandemic. The DBT scheme is regarded as a ‘logistical marvel’ that has helped vulnerable sections (Caselli et al., 2022). DBT has the potential to provide social security or universal basic income, financially empower women and reduce subsidy leakages in public programs (Saini et al., 2017; Sabharwal et al., 2019; and Barnwal, 2016). 4.2 Pension Reforms 3.25 India’s pension reforms initiated in the 2000s led to the adoption of the National Pension System (NPS) – a defined contribution (DC) scheme – replacing the Old Pension Scheme (OPS) – a defined benefit (DB) plan by the Central and State governments. The OPS required pensions to be paid from current government revenue, thus creating a substantial fiscal burden. In contrast, the NPS accumulates funds through contributions from both employees and the government, reducing the fiscal stress on State finances. In India, most of the States – except West Bengal and Tamil Nadu – have implemented the NPS. 3.26 In order to encourage States to continue with the NPS, the Centre allowed extra borrowing limits to them equivalent to employer and employee shares of contributions to the scheme for the financial year 2023-24. Overall, an extra borrowing ceiling of ₹60,877 crore was allowed to 22 States in 2023-24 for NPS contribution (GoI, 2023). 3.27 The Andhra Pradesh government introduced a Guaranteed Pension Scheme (GPS) for its employees in 2023, which is a hybrid model with features of both DB and DC plans. In this context, the recently announced Unified Pension Scheme (UPS) of the Central government for its employees retains the “funded” nature of the NPS while incorporating a guaranteed pension component. The UPS balances the demand for a guaranteed pension by employees while maintaining the sustainability of public pension plans (Table III.6). 5. Tax Reforms 3.28 Reforming direct and indirect taxes at the national and sub-national levels is essential for boosting tax revenues and raising the tax ratio. 5.1 Introduction of GST 3.29 The introduction of the goods and services tax (GST) was a game changer for indirect taxation in India. After prolonged deliberation between the Centre and the States for nearly two decades, the GST regime was finally implemented on July 1, 2017. The primary motive of this ‘One Nation One Tax’ proposal was to reduce the cascading effects of indirect taxation, simplify compliance procedures and promote economic integration. The current GST structure in India has four tax slabs, viz., 5, 12, 18 and 28 per cent, with a few essential commodities being exempted. A compensation mechanism was worked out under which the Central government compensated the States for any shortfall in revenue due to transition to the GST regime for an initial period of five years. | Table III.6: Comparative Analysis of OPS, NPS and UPS | | Characteristics | Old Pension Scheme (OPS) | National Pension System (NPS) | Unified Pension Scheme (UPS) | | Type of Plan | Defined Benefit | Defined Contribution | Hybrid | | Pension Structure | Provides retirees with a predetermined pension (half of the last drawn salary). | Retirement benefits are determined based on contributions by employees and employers and the investment performance of the pension fund. | Assured pension of half the average basic pay over the last 12 months. A minimum pension of ₹10,000 per month is guaranteed after ten years of service. | | Minimum Service Required | Minimum service requirement of 20 years to be eligible for pension. | No minimum service length, but benefits improve with longer tenures. | Minimum 10 years of service for assured pension; full benefits with 25 years of service. | | Family Pension | Family pension of 50 per cent of the pension of the employee. | The amount of family pension depends on the type of the annuity purchased by the retiree. | Assured family pension of 60 per cent of the pension of the employee. | | Employee Contribution | Not required. | 10 per cent of basic salary and dearness allowance (DA). | 10 per cent of basic salary and DA. | | Government Contribution | Fully funded by the government. | 14 per cent of basic salary and DA (Increased from 10 per cent in 2019). | 18.5 per cent of basic salary and DA. | | Risk Factors | No risk to employees, the government bears the longevity risk. | Employees face investment and longevity risks. | The government bears investment and longevity risks. | | Portability and Flexibility | Tied to government service, limited portability. | High portability across sectors and jobs, flexible investment options (low to high risk). | High portability and flexibility like NPS. | | Inflation Protection | Linked to DA, revised semi-annually to account for inflation. | No inflation-linked adjustments, though investments may indirectly cover inflation. | Fully indexed to inflation via the All-India Consumer Price Index for Industrial Workers (AICPI-IW). | | Source: Central Civil Services Pension Rules (2021); PFRDA; PIB (2024), GoI. | 3.30 The GST has led to greater harmonisation and uniformity across States in terms of tax structure. Decisions pertaining to various aspects such as fixation of rates, exemption of certain goods and services as well as revenue sharing between States and Centre are decided by the GST Council, which comprises representatives of the Centre and States. The regime’s success in India can be attributed to the cooperative and consensus-based approach between Central and State governments. 5.2 Modernisation of Tax Administration 3.31 State governments have implemented several administrative reforms to boost the efficiency of tax collection (Annex Table III.4). These efforts include the development of Geographic Information Systems (GIS) for providing online access to property guidance values, compulsory e-stamping for non-registerable documents with updates of fair values of land parcels. States have adopted digital payment systems at liquor outlets to augment revenue. Centralised GST registration cells have been established along with mandatory e-invoicing for large taxpayers. E-governance measures such as e-registration, e-filing, and e-payment have streamlined compliance and reduced costs while addressing revenue leakages. Going forward, Indian States can further refine their taxation system by adopting the international best practices as well as utilising data analytics, machine learning and artificial intelligence (Govindharaj, 2023). 6. Borrowing Reforms 3.32 The steady shift towards market borrowings constitutes the most important reforms of financing of States in the last two decades. The share of market borrowings in the financing of GFD increased from a modest 17 per cent in 2005-06 to 79.0 per cent in 2024-25 (BE) (Chart III.4). The share of market borrowings peaked at 95 per cent of States’ deficit funding in 2019-20 but has since moderated due to an increase in the share of loans from the Centre in lieu of GST compensation and special assistance for capital expenditure. 3.33 For short-term cash management, the States continue to depend on financial accommodation provided by the Reserve Bank through ways and means advances (WMA), overdrafts (OD) and the special drawing facility (SDF) (Table III.7). 3.34 States are allowed to avail SDF against their net incremental annual investments in the Consolidated Sinking Fund (CSF) and the Guarantee Redemption Fund (GRF). Many of the States still need to catch up to the 5 per cent CSF threshold of their total outstanding liabilities suggested by the Working Group on State Government Guarantees (2024)10 (Chart III.5a). | Table III.7: Number of States/UTs which availed SDF/ WMA/ OD | | Year | SDF | WMA | OD | | 2010-11 | 8 | 6 | 4 | | 2011-12 | 8 | 9 | 6 | | 2012-13 | 10 | 9 | 8 | | 2013-14 | 13 | 13 | 8 | | 2014-15 | 13 | 12 | 10 | | 2015-16 | 12 | 12 | 9 | | 2016-17 | 12 | 14 | 6 | | 2017-18 | 11 | 13 | 7 | | 2018-19 | 9 | 14 | 10 | | 2019-20 | 16 | 13 | 9 | | 2020-21 | 18 | 15 | 8 | | 2021-22 | 17 | 14 | 9 | | 2022-23 | 17 | 11 | 10 | | 2023-24 | 16 | 14 | 11 | | Source: RBI. |
Similarly, some major States have GRFs below the recommended threshold level of 5 per cent of outstanding guarantees (Chart III.5b). 7. Power Sector Reforms 3.35 The weak financial health of State-owned electricity distribution companies (DISCOMs) constitutes a persisting challenge for State government finances. Despite multiple financial restructuring efforts, DISCOMs’ total outstanding debt has grown at an average annual rate of 8.7 per cent since 2016-17, rising from ₹4.2 lakh crore to ₹6.8 lakh crore in 2022-23 (2.5 per cent of GDP) (Power Finance Corporation, 2024) (Chart III.6).  3.36 State governments provide considerable support to DISCOMs through revenue subsidies, grants, and equity infusions, as well as by taking over annual losses. The recurrent need for bailouts of loss-making DISCOMs diverts valuable resources that could otherwise be invested in developmental initiatives. For instance, the Ujwal DISCOM Assurance Yojana (UDAY) required State governments to absorb 75 per cent of the DISCOM debt - 50 per cent in 2015-16 and 25 per cent in 2016-17. The implementation of the UDAY scheme by 16 States led to a sharp rise in their fiscal deficits, outstanding debt, and interest payments in 2015-16 and 2016-17 (Mishra et al., 2020). 3.37 The fifteenth finance commission allowed an additional borrowing space of 0.5 per cent of GSDP for States which would take up power sector reforms to enhance operational and economic efficiency to promote a sustained increase in paid electricity consumption. These reforms included reduction in: (i) operational losses; (ii) revenue gap; (iii) payment of cash subsidy by adopting direct benefit transfer; and (iv) tariff subsidy as a percentage of revenue. In 2021-22, twelve States were permitted to borrow ₹39,175 crore based on the stipulated reform criteria. In 2022-23, six states were allowed to borrow ₹27,238 crore. In 2023-24, States were eligible to borrow approximately ₹1,43,332 crore, as recommended by the Ministry of Power (GoI, 2023). States need to prioritise operational efficiency by minimising distribution losses, improving metering systems, ensuring timely tariff revisions, and incentivising the power sector to gradually reduce reliance on government subsidies. 8. Reforms: Way Ahead 3.38 While the implementation of FRLs has led to significant consolidation of debt and deficit indicators of States in the last two decades, there is scope for further improvement and refinement. First, some space for counter-cyclical fiscal policy could be considered in order to provide flexibility in the face of large exogenous shocks (IMF, 2022; Akin et al., 2017). A risk-based fiscal framework that considers state-level fundamentals may be more productive in achieving fiscal consolidation than a uniform approach. For instance, States with higher debt levels and slower growth rates may require stricter fiscal rules than States with lower debt levels (Chinoy, 2024). 3.39 Second, for better expenditure planning, the States could adopt a Medium-Term Expenditure Framework (MTEF) which links policymaking to budgeting by ensuring forward planning for fund availability and improving accountability (World Bank, 1998; Jena and Sikdar, 2019). Successful implementation of the ‘golden rule’, which requires that all current/revenue expenditures be financed from current revenue while capital expenditure is financed through borrowings, saw States achieving a revenue surplus in 2007-08 (Rao, 2018). Revisiting the ‘golden rule’ of public finance could ensure that capital expenditure is not compromised while States adhere to FRL targets. 3.40 Third, the enforcement mechanism can be made stronger through provisions of sanctions and penalties (Box III.1). 3.41 Fourth, recent economic, climatic and geopolitical uncertainties have exacerbated the fiscal risks, leading to large divergences of actual revenues and expenditures from the budgeted estimates. State governments need to regularly carry out an assessment of potential fiscal risks arising out of macroeconomic uncertainties, pension liabilities, unfinished or delayed Public Private Partnership projects, and contingent liabilities. The potential economic damage to critical infrastructure arising out of environmental phenomena like growing heatwaves, flooding and episodes of recurring cyclones should be regularly assessed and disclosed through a Fiscal Risk Statement as practiced by the government of Odisha (Box III.2).11 Box III.1: Sub-national Fiscal Rules: Cross-country Practices International experience reveals that subnational fiscal rules tend to have certain common features targeted at maintaining fiscal discipline, ensuring efficient resource allocation, and promoting economic stability (Chart 1). Within the common framework, there are significant variations across countries in terms of governance structure, regulatory framework, accounting principles, data transparency and reporting practices, and measures for monitoring and enforcement of compliance. Governance Structure Governance structure for fiscal management varies across countries. The United Kingdom, France and Ireland have a centralised structure of governance. Switzerland stands as a prime example of decentralised fiscal governance. In this system, cantons (i.e., member States) have the autonomy to create their own fiscal rules, which they also apply to their communes (i.e., municipalities). This approach allows for tailored financial management that incorporates features to account for regional differences. It fosters discipline through a strict no-bailout policy for communes and demonstrates that decentralisation can, in fact, promote prudent fiscal management. There are also countries which follow a middle path, where inter-governmental coordination plays a crucial role (Sutherland, 2005). South Africa, for instance, treats all levels of government as equal partners. Its National Treasury coordinates fiscal relations among national, provincial, and municipal levels, promoting consistent financial planning and management across all tiers (Saxena, 2022). European Union countries also adopt explicit voluntary coordination agreements between different tiers of the government to manage subnational finances (Balassone et. al, 2003). Regulatory Framework Colombia implemented a “traffic light” regulatory framework in the 1990s, mainly to prevent subnational overborrowing and excessive expenditure. This approach categorises subnational governments into red, yellow, or green zones based on their debt servicing capacity. Those in the red zone are prohibited from borrowing while those in the green zone can borrow within set limits. Yellow zone entities require central government approval for borrowing. This system is complemented by additional measures such as mandatory credit ratings for borrowers, limits on operating expenses, and insolvency regulations. On the other hand, countries with well-developed financial markets such as Canada and the United States rely more heavily on market discipline, coupled with a no-bailout policy (Saxena, 2022). This approach assumes that financial markets can effectively regulate subnational borrowing by adjusting interest rates based on the perceived risk of default. The no-bailout policy reinforces this by making it clear that the Central government will not rescue subnational entities from financial distress, encouraging responsible borrowing and spending. 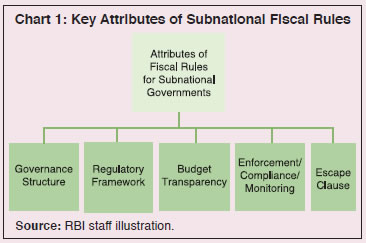 Transparency in Reporting Practices Transparency and standardisation in accounting practices, which are vital for effective fiscal management, vary significantly among countries. The Netherlands, for example, has established a system of accrual accounting agreed upon between central and local authorities (Sutherland, 2005). Similarly, in Finland, each municipality publishes accrual based annual financial statements (Saxena, 2022). Germany has implemented uniform reporting practices for both State and Central governments. Monitoring and Enforcement of Compliance Monitoring mechanisms are diverse, reflecting different governance structures and priorities. Some countries employ a separate agency to monitor compliance, whereas in others the national government is responsible for monitoring the sub-national finances. In the UK, a separate agency – the Audit Commission – audits local governments. Australia employs a Loan Council with representatives from central and sub-central governments to review and amend fiscal policies (Ter-Minassian, 2007). Some countries like Italy, the Slovak Republic, and the UK require subnational governments to report their financial results to the national legislature, ensuring a degree of central oversight (Sutherland, 2005). On non-compliance aspects, Ireland has a provision to remove defaulting authorities from office. Italy can impose limits on purchases and new hires. Spain requires non-compliant authorities to submit plans for correcting fiscal deficits. These sanctions serve as deterrents and corrective measures to maintain fiscal discipline (Ter-Minassian, 2007). Escape Clause Recognising the need for flexibility in the face of economic uncertainties, many countries have incorporated escape clauses in their fiscal frameworks. Subnational governments may temporarily deviate from fiscal rules under specific circumstances such as significant revenue shocks, local economic downturns, or natural disasters. Some countries like Canada, USA, Germany, and Netherlands provide access to “rainy day funds” or allow for temporary budget imbalances during economic cycles. Denmark insulates municipal finances from cyclical developments through centrally managed transfers (Sutherland, 2005; Ter-Minassian, 2007). Overall, sub-national governments have demonstrated diverse approaches tailored to their specific political structures, economic conditions, and historical contexts to adapt to the evolving macroeconomic and geopolitical situation. States in India could benefit from emulating some of the international best practices to strengthen their fiscal management. References: Balassone, F., Franco, D., and Zotteri, S. (2003). “Fiscal Rules for Sub-national Governments: What Lessons from EMU Countries?” Paper prepared for the Conference on “Rules-Based Macroeconomic Policies in Emerging Market Economies” jointly organised by the IMF and the World Bank, Oaxaca - Mexico, February 14-16 2002. Saxena, M. S. (2022). “How to manage fiscal risks from subnational governments”. International Monetary Fund, Fiscal Affairs Department, IMF How-To Note No. 2022/003. Sutherland, D., Price, R., and Joumard, I. (2005). “Fiscal Rules for Sub-central Governments: Design and Impact” (December 2005). OECD Working Paper No. 52, Available at SSRN: https://ssrn.com/abstract=870443. Ter-Minassian, T. (2007). “Fiscal Rules for Subnational Governments: Can they Promote Fiscal Discipline?”. OECD Journal on Budgeting, 6(3), 1-11. |
Box III.2: Transforming Fiscal Management – A Case Study of Odisha Odisha was one of the most fiscally stressed States in the early 2000s, with a debt-GSDP ratio of 57.3 per cent in 2002-03 – well above the consolidated debt-GDP ratio of 32.1 per cent for all States. The interest payments to revenue receipts ratio (IP/RR) was 34.2 per cent in 2002-03, imposing a significant strain on the State’s finances. Over the subsequent two decades, there has been a turnaround in the fiscal position of the State, with the debt-GSDP ratio declining to 16.0 per cent in 2023-24 – the lowest among the Indian States (Chart 1). This fiscal consolidation journey can be divided into four phases, each characterised by specific strategies and outcomes aimed at improving its financial condition. Phase 1: 2000-01 to 2004-05 (High Debt Era) During the pre-reform phase, in the absence of a rule-based fiscal policy, the State’s finances deteriorated sharply on account of rapid increases in salary and pensions, negative contributions from public sector undertakings, high subsidies, and poor recovery of loans and advances. As a result, revenue expenditure often exceeded revenue receipts (Chart 2). The public debt of Odisha increased at a higher rate than its GSDP, violating the condition of debt sustainability (Table 1).
Phase 2: 2005-06 to 2013-14 (Debt Consolidation through Rule-based Fiscal Policy) The enactment of the Odisha Fiscal Responsibility and Budget Management Act (OFRBMA), in 2005 marked a turning point for the State’s finances. Crucial tax reforms like the introduction of VAT, rationalisation of tax rates, broadening the tax base, enhancing enforcement, and use of IT-based tools in tax administration improved compliance and contributed to the revenue surplus witnessed since 2005-06 till date (Chart 3). During this phase, the debt position of the State turned sustainable, and the IP/RR ratio declined below the limit of 15 per cent placed by OFRBMA. Fiscal consolidation during this phase was achieved through a reduction in government expenditure, with developmental capital expenditure hovering at just around 2 per cent of GSDP (Dwivedi and Sinha, 2023). Phase 3: 2014-15 to 2019-20 (Prioritising Capital Expenditure) The Odisha FRBM (Amendment) Act, 2016 made it mandatory for the State to generate revenue surplus, contain the fiscal deficit within 3 per cent of GSDP, and maintain debt within 25 per cent of GSDP. The State has managed to stay within the limits prescribed by the Act. Revenue receipts moved upwards, with gains in both tax and non-tax sources (Chart 2). While the revenue account remained in surplus, the capital outlay of the State increased sharply during this phase mainly financed through higher borrowing (Chart 1). Phase 4: 2020-21 onwards (COVID-19 to Present times) During the challenging times of COVID-19, Odisha maintained prudent fiscal practices like periodic revision of the rates/user charges of various tax and non-tax sources and monthly reviews of revenue collection. Odisha is the only State to register a revenue surplus (1.7 per cent of GSDP) during the pandemic year of 2020-21, which increased to 6.5 per cent of GSDP in 2021-22 on account of higher realisation of non-tax revenue. Odisha’s non-tax revenue is steadily increasing, reflecting higher revenues from mining leases, with premiums linked to market prices over the lease period, rather than increased extraction. Enlarged fiscal space has enabled the State to undertake expenditure in critical sectors of the economy such as infrastructure development, incentivising MSMEs and companies for industrial cluster development across the State (Government of Odisha, 2023). Notably, the strong capex thrust observed during this period was accompanied by a steady decline in the debt level (Chart 1). The government of Odisha has undertaken various budget innovations to improve its fiscal management practices (Table 2). | Table 1: Key fiscal Indicators (Average) | | Period | Debt Sustainability Indicators of Odisha
(Per cent) | Nominal GSDP/GDP growth rate
(Per cent) | Real GSDP/GDP growth rate
(Per cent) | | D-G | R-G | IP/RR | IP/GSDP | PD/GSDP | Odisha GSDP | All India GDP | Odisha GSDP | All India GDP | | Phase 1 (2000-05) | 1.4 | -0.6 | 33.2 | 4.9 | 0.6 | 11.0 | 9.9 | 6.5 | 5.7 | | Phase 2 (2005-14) | -12.6 | -9.2 | 12.2 | 2.1 | -1.9 | 16.2 | 15.0 | 7.6 | 6.7 | | Phase 3 (2014-20) | 9.7 | -4.4 | 5.5 | 1.1 | 1.3 | 10.5 | 10.2 | 7.0 | 6.8 | | Phase 4 (2020-24) | -17.4 | -8.2 | 4.7 | 1.0 | 0.2 | 13.2 | 11.0 | 7.2 | 4.8 | Note: 1. D-G: Rate of growth of public debt (D) minus rate of growth of nominal GDP (G).
2. R-G: Nominal rate of interest (R) minus rate of growth of nominal GDP (G).
3. IP/RR: Interest payments (IP) as a per cent of revenue receipts (RR).
4. IP/GSDP: Interest payments (IP) as a per cent to GSDP.
5. PD/GSDP: Primary deficit (PD) as per cent of GSDP.
Source: RBI staff estimates. |
| Table 2: Budget Innovations by Odisha Government | | Year | Innovation Measures | | 2019-20 | • Introduction of gender budgeting and child budgeting to support gender equality and the development of children. | | 2020-21 | • Introduction of Nutrition Budget to improve nutritional outcomes.
• Introduction of Climate Budget to prepare for climate risk mitigation. | | 2021-22 | • Publication of Fiscal Risk Statement to provide a comprehensive assessment of the emerging risks for the State government finances.
• SDG-based budget policy document to provide an overview of how the State is approaching budget planning and management process for the SDGs.
• Launch of Budget Execution Technique Automation (BETA) to ensure effective online monitoring of monthly and quarterly expenditure pattern. | | 2022-23 | • Launch of Budget Stabilisation Fund to build up sufficient resources for mitigation of financial risks. | | Source: Budget documents of Odisha government. | Overall, strategic revenue and expenditure management have strengthened Odisha’s public finances, with unwavering commitment to the principles laid out in the Odisha FRBM Act. The State’s debt-to-GSDP ratio at 16.0 per cent (March 2024) is well-below its FRBM ceiling of 25 per cent, which provides the State government scope to step up its capital spending to support higher growth. Going forward, the State government has indicated that its fiscal policy would be guided by the principle of long-term fiscal sustainability, keeping in view the need for higher capital spending to stimulate economic growth (Government of Odisha, 2022-23). References: Dwivedi, H. K., and Sinha, S. K. (2023). “Is Expenditure by States for Development Compromised to Ensure Compliance of Fiscal Targets? A Study of Indian States.” Arthaniti: Journal of Economic Theory and Practice, 22(1), 67-85. FRBM Amendments – June 2005; May 2006; February 2012; November 2016. Government of Odisha (2023). “Odisha Budget – An Insight 2022-2023”. Government of Odisha (2023). “Status Paper on the Public Debt of Odisha”. | 3.42 Fifth, data transparency deserves more attention in the years ahead. State governments could consider reporting of the assumptions underlying the budget estimates and medium-term fiscal targets, including assumptions regarding GSDP growth and elasticities of taxes, along with an analysis of the deviation of past estimates with the actuals. In addition, the States may disclose critical information on emerging areas like their expenditures on climate adaptation and mitigation, and research and development. Transparency on the projections for pension liabilities along with the number of employees has assumed importance in the recent period. Disclosure of information on transfers to urban and rural local bodies would aid an improved understanding of local government finances. 3.43 Sixth, there is scope for expansion of institutional coverage of State government data. Currently, data on finances of various State government-owned entities and parastatal bodies are scarce, with only a handful of States occasionally releasing partial information. States could release an annual survey on the financial position of State-owned entities, State public sector enterprises, and entities funded by the States. 3.44 Finally, comprehensive and up to date information on State governments’ policies and actions should be easily accessible to all users through an appropriate data dissemination and communication policy. States may leverage social media for better reach to citizens and for garnering feedback and public sentiments. 9. Concluding Observations 3.45 A review of fiscal reforms during the last two decades at the subnational level reveals a mixed picture of progress and challenges. The implementation of State-specific FRLs has established a foundation for prudent fiscal management and fiscal stability across States. Major expenditure reforms like the introduction of DBT have generated significant savings for State governments over time while also improving the delivery of benefits by reducing corruption, duplication, and leakages. Pension reform like the adoption of NPS has mitigated the risk of unfunded liabilities. The successful implementation of GST has strengthened the spirit of cooperative federalism in India. On the other hand, the weak financial health of the State-owned electricity distribution companies remains a stress point for State government finances. States need to prioritise operational efficiency and incentivise the power sector to gradually reduce the reliance on government subsidies. 3.46 Subnational finances can be strengthened through a risk-based fiscal framework with a provision for counter-cyclical fiscal policy actions subject to well-defined escape clauses and adoption of a medium-term expenditure framework incorporating the ‘golden rule’ for government spending. Independent monitoring of fiscal management of States; enhanced assessment and disclosure of fiscal risks; expansion of institutional coverage of State government data; and formulation of an appropriate data dissemination and communication policy are other deliverables which can strengthen their fiscal frameworks.
| Annex III.1: Abbreviations used for States | | Abbreviation | Name of State | Abbreviation | Name of State | | AP | Andhra Pradesh | MP | Madhya Pradesh | | BR | Bihar | MH | Maharashtra | | CG | Chhattisgarh | OD | Odisha | | GO | Goa | PB | Punjab | | GJ | Gujarat | RJ | Rajasthan | | HR | Haryana | TN | Tamil Nadu | | HP | Himachal Pradesh | TL | Telangana | | JH | Jharkhand | UP | Uttar Pradesh | | KA | Karnataka | UK | Uttarakhand | | KL | Kerala | WB | West Bengal |
| Annex III.2: State Institutions for Transformation | | S. No. | State | Institution | | 1 | Assam | The State Planning Board of Assam was renamed as the State Innovation and Transformation Aayog (SITA) by the State Cabinet on November 9, 2016. SITA plays an advisory role to the government of Assam. | | 2 | Gujarat | Gujarat State Institution for Transformation (GRIT), formed on September 10, 2024, will advise the State government on promoting good governance, innovative technologies, and balanced economic growth. It will recommend mechanisms to mobilise financial resources for development through asset monetisation, international financial institutions, CSR Trust Funds, and other sources. | | 3 | Karnataka | The Karnataka State Planning Board was renamed the Karnataka State Policy and Planning Commission (KSPPC) in 2024. KSPPC’s major goals and activities include evidence-based policy and strategy formulation, decentralised planning, and outcome-based budgeting. | | 4 | Maharashtra | The Maharashtra Institution for Transformation (MITRA) was formed in November 2022 to function as the State’s think tank for comprehensive data analysis and to make studied decisions on various sectors. | | 5 | Madhya Pradesh | The Madhya Pradesh State Planning Commission was renamed Madhya Pradesh Rajya NITI Aayog (MPRNA) in August 2023 to act as a think tank of the State government, with the aim of creating a bright future for the State. | | 6 | Uttar Pradesh | The Uttar Pradesh State Planning Commission was reconstituted and re-named as the State Transformation Commission (STC) in September 2022 to act as a think tank and to formulate policies. | | 7 | Uttarakhand | The State Institute for Empowering and Transforming Uttarakhand (SETU) was established in July 2022 as a dedicated think tank for effective policy planning, innovation, optimum resource utilisation, coordination, networking, and community participation, as well as for monitoring and evaluating processes. | | Source: State government websites. |
| Annex III.3: List of Major Schemes Undertaken by the States under DBT | | S. No. | Name of States | Major Schemes under DBT | | 1. | Andhra Pradesh | Amma Vodi, YSR kapu Nestam, YSR Cheyuta, Annadata Sukhibhava, NTR Bharosa Pension. | | 2. | Bihar | Bihar Satabdi Mukhyamantri Balika Poshan Yojna, Laxmi Bai Social Security Scheme, Mukhyamantri Kanya Uttan Yojna, Bihar State Disability Pension. | | 3. | Chhattisgarh | Mukhyamantri Pension Yojana, Mahtari Vandan Yojana, Tendupata Yojana, Ukti Bij Sambardhan Yojana. | | 4. | Gujarat | Mukhyamantri Balseva Yojana, Mukhyamantri Kisansahay Yojana, Chief Minister’s Scholarship Programme, Mukhyamantri Garib Kalyan Package, Vrushkheti Yojana, Mukhayamantri Yuva Swavalamban Yojana. | | 5. | Haryana | Aapki Beti Hamari Beti, Mukhyamantri Parivarsamridhi Yojana, Bhavantarbharpai Yojana, Mukhyamantri Parivarsamridhi Yojana. | | 6. | Himachal Pradesh | Rajya Krishi Yantrikaran Programme, Mukhyamantri Krishi Yantrikaran Programme, Mukhyamantri Awas Yojana, Mukhyamantri Swavlamban Yojana. | | 7. | Karnataka | Gruha Lakshmi, Yuvanidhi, Sandhya Suraksha Yojana, Anna Bhagya Scheme. | | 8. | Madhya Pradesh | Mukhyamantri Ladli Behena Yojana, Mukhyamantri Udhyam Kranti Yojana, Pratibha Kiran, Mukhya Mantri Jan Awas Yojana. | | 9. | Maharashtra | Rajarshi Chhatrapati Shahu Maharaj Fee Reimbursement Scheme, Rajarshi Chhatrapati Shahu Maharaj Shikshan Shulkh Shishyavrutti Yojna, Eklavya Scholarship. | | 10. | Odisha | Biju Swasthya Kalyan Yojana, Fisheries State Plan, Kalia, Mukhyamantri Maschyajibi Kalyan Yojana, Mukhyamantri Kalakar Sahayata Yojana. | | 11. | Punjab | Balri Birth Gift Scheme, Olympian Sardar Balbir Singh Sr. Scholarship Scheme for Outstanding and Budding Sports Persons, Shagun Scheme. | | 12. | Tamil Nadu | Chief Minister’s Uzhavar Pathukappu Thittam, Magalir Urimai Thogai Scheme, Chief Minister’s Accident Relief Fund Scheme. | | 13. | Telangana | Rythu Bandhu, Rythu Bima, Asara Monthly Pension Scheme, Kalyana Lakshmi/ Shaadi Mubarak. | | 14. | Uttarakhand | Mukhyamantri Bal Poshan Yojana-Bal Palash, Urja, Mukhyamantri Vatsalya Yojana, Kishan Pension Scheme, Mukhyamantri Swarojgar Yojana, Disability Pension Scheme. | | 15. | Uttar Pradesh | Mukhyamantri Pragatisheel Pashupalak Protsahan Yojana, Mukhyamantri Gramodyog Rojgar Yojana, Vishwakarma Shram Samman Yojana, Sant Ravi Das Shiksha Protsahan Yojana. | Note: This Table is not an exhaustive list of schemes covered under Direct Benefit Transfer by the States. It only highlights some of the major initiatives at State level using DBT.
Source: DBT websites of various States. |
| Annex III.4: Fiscal Reforms by States | | State | Revenue Reforms | Expenditure Reforms | | Haryana | • Launch of MSME GST facilitation cell and start-up facilitation cell for assisting new taxpayers in Gurugram and Panchkula with GST registration and compliance.
• Introduction of QR code-based Track and Trace system in 14 distilleries and bottling plants to monitor alcohol production and prevent excise duty evasion.
• Implementation of One Time Settlement Scheme for recovery of outstanding dues from pre-GST cases (January-March 2024). | • Launch of “Haryana Mines & Geology Information System” portal in December 2023 for real-time vehicle tracking and weight management for mineral transportation. | | Himachal Pradesh | • Implementation of GST Revenue Enhancement and Capacity Building Project.
• Amendment of Excise Policy for liquor sales to enhance tax revenues.
• Introduction of milk cess on liquor sales.
• Proposed introduction of the Himachal Pradesh Mines and Minerals Policy 2024.
• Allowed stone crushers to utilise muck from hydel projects, paying 75 per cent of the royalty on minerals. | • Shift towards electric vehicles, e-office system and video conferencing to reduce costs.
• Instructions to reduce vehicle purchases, with limits on fuel and LTA allowances for government employees.
• Rationalisation of government schemes and posts to reduce revenue expenditure, with a focus on filling only functional positions, prioritising cost-efficient contractual and outsourcing arrangements. | | Jammu & Kashmir | • Strengthening compliance with the GST regime by facilitating easy and smooth tax payments through the GSTN portal.
• Enhancement in dealer registration to widen tax base.
• Promoting fairness in revenue generation through transparent auction process.
• Ensuring effective energy disbursal through Feeder and Consumer Metering in Electricity.
• Asset monetisation focusing on optimum resource use by leveraging opportunities in tourism and mining. | • Austerity measures across all departments to promote savings.
• Acquisitions through the Government e-Marketplace (GeM) to ensure transparency.
• Expensive loans prepaid to reduce interest burdens. The full implementation of Net Borrowing Ceiling (NBC) enables comprehensive management of both on-budget and off-budget loans.
• Mid-term debt strategy as a roadmap for sustainable debt management.
• Efforts to reduce ways and means advance (WMA) and overdrafts (OD) to improve fiscal viability. | | Karnataka | • Training provided to tax officials to develop legal expertise, analytical perspective, and technical skills to explore new tax avenues and combat fraudulent registrations.
• For non-tax revenue sources, user charges/ fees revised for services that had not been updated for many years. | • Efforts to reduce salary and pension expenses by cutting down redundant cadre/ staff due to technological advancements.
• Efforts to weed out ineligible families from the BPL list to reduce the subsidy burden, ensuring that benefits reach only to the deserving families.
• Efforts to reduce unproductive administrative expenditure by implementing recommendations from the 2nd Administrative Reforms Committee. | | Kerala | • Revenue reforms focused on tax revision, leakage prevention, and modernisation of the GST Department. | • Prioritised resource mobilisation for economic recovery and development. | | Odisha | • Adoption of mandatory online electronic auctions to complete mining lease transfers before expiry, with a new premium payment policy requiring lessees to pay a percentage of production value along with royalties.
• Establishment of a separate Directorate of Minor Minerals under the Revenue & Disaster Management Department for sustainable management and enhanced revenue collection from minor minerals.
• Establishment of a Budget Stabilisation Fund in 2022-23 to mitigate risks from mining revenue volatility.
• Adoption of Excise Policy for the year 2023-24 to generate additional revenue. | • Introduction of E-Budgeting for reducing paper usage and promoting digital infrastructure for budget documentation.
• Implementation of SNA-SPARSH model for efficient fund flow in Centrally Sponsored Schemes (CSS), ensuring timely fund release through integration with PFMS, IFMS, and RBI’s e-Kuber system.
• Introduction of the Just-in-Time Funding System (JITFS) to transfer funds directly to beneficiary accounts, eliminating intermediate bank accounts and improving transparency.
• Establishment of a Cash Management Unit (CMU) to forecast cash flow and consolidate government cash balances. | | Punjab | • Revision of user fee which is expected to generate revenue of ₹500 to ₹800 crore annually.
• Department of Transport imposed green tax and rationalised fare rates to increase revenue.
• Increased VAT on petrol and diesel in 2023-24 to boost receipts by approximately ₹500 crore.
• Tax Intelligence Unit set up to curb tax evasions with support from IIT Hyderabad. | • Constituted Finance Monitoring Committees (FMCs) in each Administrative Department for better oversight. FMCs focus on revenue enhancement, rationalisation of schemes, and efficiency in spending.
• Established Debt Management Unit to diversify debt issuance and reduce debt-to-GSDP ratio by 3 percentage points by 2025-26.
• Department of Finance has issued guidelines for better financial resource management in 2024-25. | | Tamil Nadu | • Increase in Special fee on the import of Indian-made foreign spirits and foreign liquor.
• Increase in stamp duty and registration fees for select instruments (July 2023).
• Establishment of a dedicated Service Tax cell in the Commercial Taxes Department for better enforcement.
• Use of advanced IT systems to improve tax collection through database triangulation.
• Creation of Special task force to identify and recover dormant or idle government funds outside the treasury. | • Just-in-time release of funds through the Tamil Nadu Public Fund Tracking System, ensuring efficient fund management.
• Digital payment adoption with 86 per cent of payments made online in 2023-24.
• Encouraged PPP projects for major infrastructure developments.
• Restructuring of Tamil Nadu Generation & Distribution Corporation Limited (TANGEDCO) for better focus on energy segments, including green energy. | | Source: As received from State governments. |
|