Deposit growth of urban co-operative banks (UCBs) recovered in 2023-24 and credit growth remained steady. The financial performance of UCBs improved on the back of higher profitability, strengthened capital buffers and lower gross non-performing assets (GNPA) ratio. The GNPA ratio of state co-operative banks (StCBs) and district central co-operative banks (DCCBs) declined, but remained elevated relative to commercial banks. 1. Introduction V.1 Co-operative banks play a vital role in India’s financial ecosystem, particularly in promoting financial inclusion and supporting rural development. Over the years, various reforms have been initiated to strengthen the co-operative banking sector – expanding the regulatory powers of the Reserve Bank under the Banking Regulation (BR) Act to address issues relating to dual regulation of the sector; greater freedom to co-operative banks to raise capital; and deposit insurance reforms to strengthen depositors’ confidence in the sector. The Reserve Bank introduced a prompt corrective action (PCA) framework in July 2024 for urban co-operative banks (UCBs) in Tier 2 to 4 and enhanced monitoring for Tier 1 UCBs, which will be effective from April 1, 2025. V.2 Against this backdrop, the rest of the chapter focuses on the performance of urban and rural co-operative banks during the period under review1. Section 2 discusses the evolving structure of the co-operative banking sector, followed by evaluation of profitability, asset quality and capital adequacy of UCBs in Section 3. Section 4 examines the financial performance of short-term and long-term rural co-operatives. This is followed by an overall assessment in Section 5. 2. Structure of the Co-operative Banking Sector V.3 The co-operative banking structure, comprising UCBs and rural credit co-operatives (RCCs), supplements the commercial banking institutions by focusing on serving the marginalised borrowers and promoting financial inclusion in villages and small towns. UCBs are classified as scheduled or non-scheduled, based on whether they are included in the second schedule of the Reserve Bank of India Act, 19342 and their geographical outreach (single-state or multi-state). RCCs are classified into short-term and long-term institutions. During the period under review, there were 1,472 UCBs and 1,07,961 RCCs3 (Chart V.1). In terms of number of institutions, more than 97 per cent of total co-operative sector are primary agricultural credit societies (PACS), although in terms of assets, their share is only 17.8 per cent in the total co-operative segment and 25.3 per cent in RCCs. 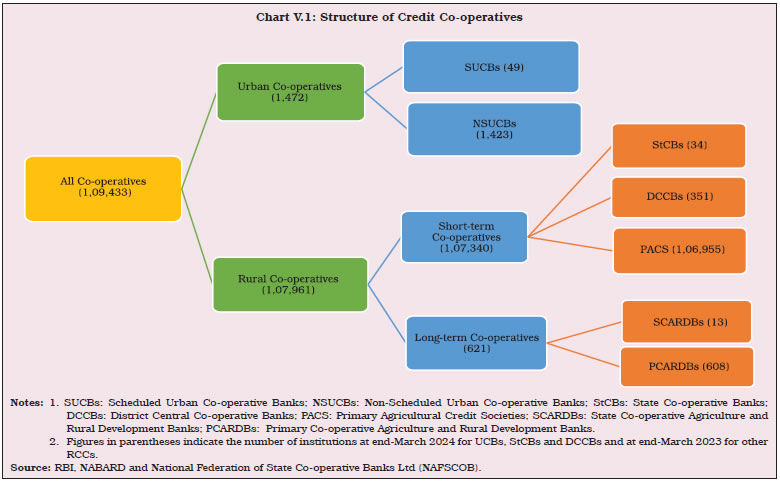 V.4 UCBs are regulated and supervised by the Reserve Bank. State co-operative banks (StCBs) and district central co-operative banks (DCCBs) are registered under the provisions of State Cooperative Societies Act of the State concerned and are regulated by the Reserve Bank. They are supervised by National Bank for Agriculture and Rural Development (NABARD) under Sec 35 (6) of the BR Act. V.5 The consolidated assets of the co-operative banking sector at end-March 2023 stood at ₹22.9 lakh crore, accounting for around 9.5 per cent of scheduled commercial banks’ (SCBs’) assets, down from 11.2 per cent at end-March 2014. RCCs comprise 70.4 per cent of the assets of the total co-operative sector (rural and urban co-operatives combined) (Chart V.2).
| Table V.1 Share in Credit Flow to Agriculture | | (Per cent) | | | Rural Credit Co-operatives | Regional Rural Banks | Commercial Banks | | 1 | 2 | 3 | 4 | | 2016-17 | 13.4 | 11.6 | 75.0 | | 2017-18 | 12.9 | 12.1 | 74.9 | | 2018-19 | 12.1 | 11.9 | 76.0 | | 2019-20 | 11.3 | 11.9 | 76.8 | | 2020-21 | 12.1 | 12.1 | 75.8 | | 2021-22 | 13.0 | 11.0 | 76.0 | | 2022-23 | 11.0 | 11.2 | 77.8 | | 2023-24 | 9.5 | 11.1 | 79.4 | | Source: NABARD (ENSURE portal). | V.6 Rural co-operatives were set up with the primary objective of lending to agriculture. In 2023-24, their share in total credit to agriculture declined for the second consecutive year to less than 10 per cent due to increasing reach of commercial banks via technology and branch expansion (Table V.1). 3. Urban Co-operative Banks V.7 The number of UCBs surged in the 1990s on the back of a liberal licensing policy. Over the years, nearly a third of the newly licensed banks became financially unsound. Starting 2004-05, the Reserve Bank initiated a process of consolidation, including amalgamation of unviable UCBs with their viable counterparts, closure of non-viable entities and suspension of issuance of new licences. As a result, the number of UCBs declined steadily over the last two decades from 1,926 to 1,472 (Chart V.3). V.8 Since 2004-05, the sector has witnessed 156 mergers, including six in 2023-24, of which three were in Maharashtra, two were in Telangana and one was in Gujarat. Maharashtra accounted for majority of the mergers in the last two decades, followed by Gujarat and Andhra Pradesh (Chart V.4a). During 2023-24, licences of 24 UCBs were cancelled, raising the total number of cancellations to 70 since 2015-16. 94.3 per cent of the cancellations have been in the non-scheduled category (Chart V.4b). 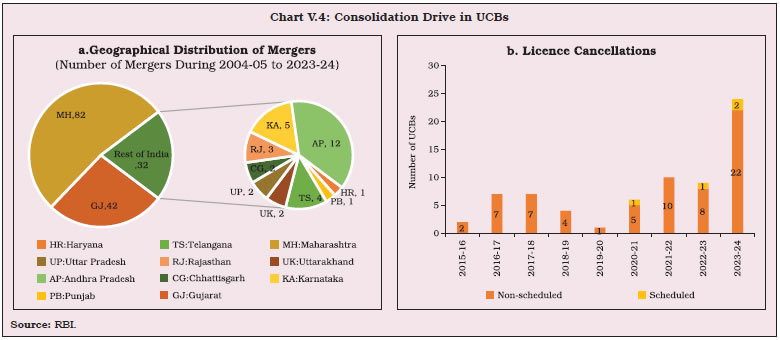 V.9 In line with the recommendations of the Expert Committee on Urban Co-operative Banks (Chairman: Shri. N.S. Vishwanathan), the Reserve Bank adopted a four-tiered regulatory framework for UCBs in 2022-234. At end-March 2024, the share of UCBs in Tier 1 declined, while that of Tier 2 increased year-on-year (y-o-y), partly reflecting a growing deposit base. Tier 3 UCBs, with nearly 5 per cent share in the total number of UCBs, dominated the sector with more than one-third share in deposits, advances as well as total assets (Table V.2). 3.1. Balance Sheet V.10 During 2023-24, the consolidated balance sheet of UCBs exhibited a muted growth of 4 per cent, albeit higher than 2.3 per cent in the previous year. The balance sheet size of UCBs relative to SCBs fell for the seventh successive year to 2.5 per cent at end-March 2024 from 3.8 per cent at end-March 2017, dragged down by subdued deposit growth on the liabilities side and loans on the asset side (Chart V.5). 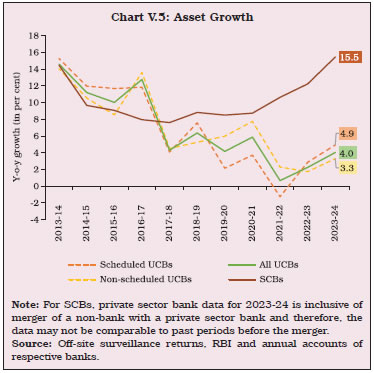 V.11 Deposit growth of all UCBs exhibited a marginal improvement to 4.1 per cent during 2023-24, remaining well below 13.4 per cent growth in SCBs (Chart V.6a). The pace sustained in H1:2024-25 with 4.4 per cent growth in deposits of UCBs. Credit growth of UCBs was steady at 5.0 per cent in 2023-24, less than a third of the expansion of 16.0 per cent recorded by SCBs (Table V.3 and Chart V.6b). The credit growth of UCBs, however, accelerated to 6.2 per cent at end-September 2024. Deposit and credit growth of UCBs has trailed that of SCBs in recent years reflecting, inter alia, the decline in the number of UCBs and their branch network (Chart V.6c). SCBs, on the other hand, have been leveraging technology as well as the business correspondents (BCs) model extensively to expand their reach. | Table V.2: Tier-wise Distribution of Urban Co-operative Banks | | (At end-March 2024) | | (Amount in ₹ crore, share in per cent) | | Tier Type | No. of Banks | Deposits | Advances | Total Assets | | Number | Share | Amount | Share | Amount | Share | Amount | Share | | 1 | 2 | 3 | 4 | 5 | 6 | 7 | 8 | 9 | | 1 | 850 | 57.7 | 63,627 | 11.5 | 41,842 | 12.1 | 88,669 | 12.5 | | 2 | 538 | 36.5 | 1,71,039 | 30.8 | 1,03,498 | 29.8 | 2,17,142 | 30.7 | | 3 | 78 | 5.3 | 1,93,105 | 34.8 | 1,16,143 | 33.5 | 2,39,240 | 33.8 | | 4 | 6 | 0.4 | 1,27,698 | 23.0 | 85,420 | 24.6 | 1,62,618 | 23.0 | | All UCBs | 1,472 | 100 | 5,55,469 | 100 | 3,46,903 | 100 | 7,07,669 | 100 | Notes: 1. Data are provisional.
2. Components may not add up to the whole due to rounding off.
Source: Off-site surveillance returns, RBI. |
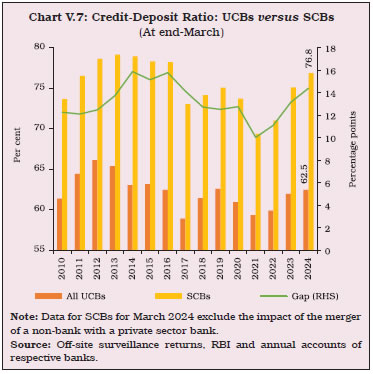
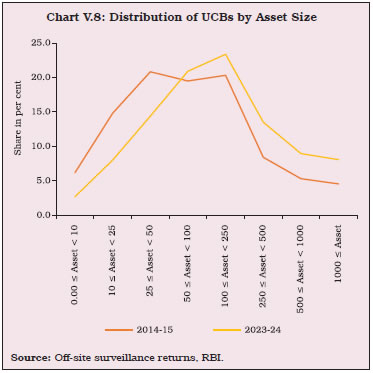
V.12 The credit-deposit (C-D) ratio of UCBs increased for the third consecutive year in 2023-24 to 62.5 per cent (Chart V.7). The share of borrowings in total liabilities of UCBs was 0.8 per cent at end-March 2024, less than a tenth of that of SCBs (9.0 per cent). V.13 The distribution of the number of UCBs in terms of assets and deposits has been shifting rightwards over the years and has turned from bi-modal to unimodal (Chart V.8). In 2014-15, more than 40 per cent of UCBs were in the asset classes ₹25 crore to ₹50 crore and ₹100 crore to ₹250 crore; in 2023-24, 44.3 per cent of UCBs were in the asset classes ₹50 crore to ₹250 crore. In terms of advances, the modal class was ₹25 crore to ₹50 crore at end-March 2024, with more than 80 per cent of UCBs with total advances less than ₹250 crore (Table V.4). | Table V.3: Balance Sheet of Urban Co-operative Banks | | (At end-March) | | (Amount in ₹ crore) | | | Scheduled UCBs | Non-Scheduled UCBs | All UCBs | All UCBs (y-o-y growth in per cent) | | 2023 | 2024 | 2023 | 2024 | 2023 | 2024 | 2022-23 | 2023-24 | | 1 | 2 | 3 | 4 | 5 | 6 | 7 | 8 | 9 | | Liabilities | | | | | | | | | | 1) Capital | 4,256 | 4,293 | 10,459 | 10,831 | 14,715 | 15,124 | 3.2 | 2.8 | | | (1.4) | (1.3) | (2.8) | (2.8) | (2.2) | (2.1) | | | | 2) Reserves and Surplus | 22,287 | 25,298 | 25,958 | 29,435 | 48,245 | 54,732 | 12.7 | 13.4 | | | (7.3) | (7.9) | (6.9) | (7.6) | (7.1) | (7.7) | | | | 3) Deposits | 2,39,982 | 2,54,479 | 2,93,484 | 3,00,991 | 5,33,466 | 5,55,469 | 1.5 | 4.1 | | | (78.3) | (79.1) | (78.6) | (78.0) | (78.4) | (78.5) | | | | 4) Borrowings | 5,776 | 5,082 | 465 | 297 | 6,241 | 5,380 | 10.3 | -13.8 | | | (1.9) | (1.6) | (0.1) | (0.1) | (0.9) | (0.8) | | | | 5) Other Liabilities and Provisions | 34,280 | 32,571 | 43,250 | 44,392 | 77,530 | 76,963 | 0.5 | -0.7 | | | (11.2) | (10.1) | (11.6) | (11.5) | (11.4) | (10.9) | | | | Assets | | | | | | | | | | 1) Cash in Hand | 1660 | 1759 | 4224 | 4434 | 5884 | 6193 | -6.4 | 5.3 | | | (0.5) | (0.5) | (1.1) | (1.1) | (0.9) | (0.9) | | | | 2) Balances with RBI | 12,770 | 13,778 | 3,592 | 4,545 | 16,362 | 18,323 | -0.4 | 12.0 | | | (4.2) | (4.3) | (1.0) | (1.2) | (2.4) | (2.6) | | | | 3) Balances with Banks | 21,011 | 24,701 | 45,718 | 47,715 | 66,729 | 72,415 | -4.9 | 8.5 | | | (6.9) | (7.7) | (12.2) | (12.4) | (9.8) | (10.2) | | | | 4) Money at Call and Short Notice | 2,554 | 2,367 | 886 | 919 | 3,440 | 3,286 | -31.1 | -4.5 | | | (0.8) | (0.7) | (0.2) | (0.2) | (0.5) | (0.5) | | | | 5) Investments | 83,254 | 86,626 | 1,07,412 | 1,07,188 | 1,90,666 | 1,93,814 | 1.6 | 1.7 | | | (27.2) | (26.9) | (28.7) | (27.8) | (28.0) | (27.4) | | | | 6) Loans and Advances | 1,51,663 | 1,59,553 | 1,78,828 | 1,87,350 | 3,30,491 | 3,46,903 | 5.0 | 5.0 | | | (49.5) | (49.6) | (47.9) | (48.5) | (48.6) | (49.0) | | | | 7) Other Assets | 33,668 | 32,939 | 32,957 | 33,795 | 66,625 | 66,734 | 2.4 | 0.2 | | | (11.0) | (10.2) | (8.8) | (8.8) | (9.8) | (9.4) | | | | Total Liabilities/ Assets | 3,06,581 | 3,21,723 | 3,73,616 | 3,85,946 | 6,80,197 | 7,07,669 | 2.3 | 4.0 | | | (100) | (100) | (100) | (100) | (100) | (100) | | | Notes: 1. Data for 2024 are provisional.
2. Figures in parentheses are proportion to total liabilities / assets (in per cent).
3. Components may not add up to the whole due to rounding off.
Source: Off-site surveillance returns, RBI. |
| Table V.4: Distribution of UCBs by Size of Deposits, Advances and Assets | | (At end-March 2024) | | (Amount in ₹ crore) | | | Deposits | Advances | Assets | | No. of UCBs | Amount | No. of UCBs | Amount | No. of UCBs | Amount | | 1 | 2 | 3 | 4 | 5 | 6 | 7 | | 0 ≤ X < 10 | 83 | 495 | 183 | 1,093 | 40 | 251 | | 10 ≤ X < 25 | 164 | 2,914 | 241 | 4,096 | 118 | 2,072 | | 25 ≤ X < 50 | 240 | 8,879 | 282 | 9,921 | 212 | 7,839 | | 50 ≤ X < 100 | 300 | 21,543 | 258 | 18,084 | 308 | 22,489 | | 100 ≤ X < 250 | 322 | 52,648 | 256 | 39,538 | 344 | 55,860 | | 250 ≤ X < 500 | 156 | 55,565 | 135 | 47,284 | 199 | 70,093 | | 500 ≤ X < 1000 | 116 | 79,450 | 65 | 45,585 | 132 | 92,885 | | 1000 ≤ X | 91 | 3,33,976 | 52 | 1,81,301 | 119 | 4,56,181 | | Total | 1,472 | 5,55,469 | 1,472 | 3,46,903 | 1,472 | 7,07,669 | Notes: 1. Data are provisional.
2. ‘X’ indicates amount of deposits, advances and assets.
Source: Off-site surveillance returns, RBI. | V.14 During 2023-24, UCBs’ investment growth remained largely unchanged, widening the wedge with SCBs (Chart V.9). V.15 90 per cent of UCBs’ investments were in SLR instruments, as compared with 83 per cent for SCBs. During 2023-24, the SLR investments of UCBs in central government securities contracted (Table V.5). Over the years, the share of state government securities in total SLR investments of UCBs has been rising. 3.2. Financial Performance and Profitability V.16 The operating profits of UCBs fell during 2023-24 as total expenditure expanded at a faster pace than total income. However, net profits (before as well as after tax) were higher due to decline in provisions and contingencies on the back of improved asset quality. Non-interest income fell due to decline in dividend income, loss on sale of fixed assets and reduced profits on forex operations. The growth in non-interest expenditure of UCBs decelerated, partly on account of moderation in staff expenses (Table V.6 and Appendix Table V.1). The share of non-interest income in total income was higher in larger SUCBs and inversely related to their profitability (Box V.1). | Table V.5: Investments by Urban Co-operative Banks | | (Amount in ₹ crore) | | | Amount Outstanding (At end-March) | Variation (%) | | 2022 | 2023 | 2024 | 2022-23 | 2023-24 | | 1 | 2 | 3 | 4 | 5 | 6 | | Total Investments (A + B) | 1,87,612 | 1,90,666 | 1,93,814 | 1.6 | 1.7 | | | (100.0) | (100.0) | (100.0) | | | | A. SLR Investments (i to iii) | 1,67,802 | 1,71,715 | 1,74,352 | 2.3 | 1.5 | | | (89.4) | (90.1) | (90.0) | | | | (i) Central Govt. Securities | 1,04,762 | 1,06,716 | 1,06,223 | 1.9 | -0.5 | | | (55.8) | (56.0) | (54.8) | | | | (ii) State Govt. Securities | 62,613 | 64,695 | 67,741 | 3.3 | 4.7 | | | (33.4) | (33.9) | (35.0) | | | | (iii) Other approved Securities | 427 | 304 | 388 | -28.8 | 27.6 | | | (0.2) | (0.2) | (0.2) | | | | B. Non-SLR Investments | 19,809 | 18,951 | 19,462 | -4.3 | 2.7 | | | (10.6) | (9.9) | (10.0) | | | Notes: 1. Data for 2024 are provisional.
2. Figures in parentheses are proportion to total investments (in per cent).
3. Components may not add up to the whole due to rounding off.
Source: Off-site surveillance returns, RBI. |
| Table V.6: Financial Performance of Scheduled and Non-Scheduled Urban Co-operative Banks | | (Amount in ₹ crore) | | | Scheduled UCBs | Non-Scheduled UCBs | All UCBs | All UCBs Variation (%) | | | 2022-23 | 2023-24 | 2022-23 | 2023-24 | 2022-23 | 2023-24 | 2022-23 | 2023-24 | | 1 | 2 | 3 | 4 | 5 | 6 | 7 | 8 | 9 | | A. Total Income [i+ii] | 22,460 | 24,172 | 29,921 | 31,054 | 52,381 | 55,226 | 1.8 | 5.4 | | | (100.0) | (100.0) | (100.0) | (100.0) | (100.0) | (100.0) | | | | i. Interest Income | 19,473 | 21,476 | 28,125 | 29,232 | 47,598 | 50,708 | 2.1 | 6.5 | | | (86.7) | (88.8) | (94.0) | (94.1) | (90.9) | (91.8) | | | | ii. Non-interest Income | 2,987 | 2,696 | 1,796 | 1,821 | 4,783 | 4,518 | -0.8 | -5.5 | | | (13.3) | (11.2) | (6.0) | (5.9) | (9.1) | (8.2) | | | | B. Total Expenditure [i+ii] | 17,820 | 19,785 | 24,592 | 25,999 | 42,411 | 45,784 | -0.5 | 8.0 | | | (100.0) | (100.0) | (100.0) | (100.0) | (100.0) | (100.0) | | | | i. Interest Expenditure | 11,093 | 12,838 | 16,382 | 17,451 | 27,475 | 30,289 | -4.3 | 10.2 | | | (62.3) | (64.9) | (66.6) | (67.1) | (64.8) | (66.2) | | | | ii. Non-interest Expenditure | 6,727 | 6,947 | 8,209 | 8,548 | 14,936 | 15,495 | 7.5 | 3.7 | | | (37.7) | (35.1) | (33.4) | (32.9) | (35.2) | (33.8) | | | | of which : Staff Expenses | 2,955 | 2,999 | 4,259 | 4,370 | 7,214 | 7,368 | 2.7 | 2.1 | | C. Profits | | | | | | | | | | i. Amount of Operating Profits | 4,641 | 4,387 | 5,329 | 5,055 | 9,970 | 9,441 | 12.9 | -5.3 | | ii. Provision and Contingencies | 2,899 | 1,200 | 2,671 | 1,904 | 5,570 | 3,104 | 15.9 | -44.3 | | iii. Provision for taxes | 468 | 751 | 852 | 858 | 1,319 | 1,609 | 16.9 | 21.9 | | iv. Amount of Net Profit before Taxes | 1,742 | 3,187 | 2,658 | 3,151 | 4,400 | 6,338 | 9.3 | 44.0 | | v. Amount of Net Profit after Taxes | 1,274 | 2,435 | 1,807 | 2,293 | 3,080 | 4,729 | 6.4 | 53.5 | Notes: 1. Data for 2023-24 are provisional.
2. Figures in parentheses are proportion to total income/expenditure (in per cent).
3. Components may not add up to the whole due to rounding off.
Source: Off-site returns, RBI. |
Box V.1: Determinants of Non-Interest Income in Scheduled Urban Co-operative Banks While interest income is the core of banking activity, diversification through non-interest earnings can help yield higher risk-adjusted profits (Ahamed, 2017). The share of non-interest income in total income of SUCBs in India increased from 10.7 per cent in 2014-15 to 16.7 per cent in 2019-20 before moderating to 13.3 per cent in 2022-23. Using annual panel data for 47 SUCBs for the period 2014-15 to 2022-23, two fixed effects panel regression models are estimated to explore the determinants of the share of non-interest income in total income. Bank specific explanatory variables, such as, asset size, return on assets (RoA) and cost to income ratio and macroeconomic control variables (nominal GDP growth) have been incorporated in Model I. In Model II, an interaction dummy [Dummy Tier123*ROA (-1)] has been introduced to assess the differential impact of profitability of Tier 4 SUCBs on share of non-interest income. Dummy Tier123 takes the value 1 for SUCBs with deposit base of less than ₹10,000 crore, i.e., Tier 1 to 3 SUCBs, and value 0 for Tier 4 SUCBs (deposits > ₹10,000 crore). The regression estimates indicate that SUCBs with larger asset size have a higher share of non-interest income. Higher profitability (RoA) seems to dampen the share of non-interest income (Table V.1.1). Moreover, as profitability increases, the decline in the share of non-interest income for Tier 1 to 3 SUCBs is less, as compared to Tier 4 SUCBs (Model II). Overall, the empirical analysis suggests that as banks grow in size, they are able to diversify towards non-traditional activities, which boosts their non-interest income. | Table V.1.1: Determinants of SUCBs’ Non-Interest Income | | Explanatory Variables | Share of Non-interest income | Share of Non-interest income | | | (1) | (2) | | Share of Non-interest income (-1) | 0.00361 | 0.00193 | | | (0.128) | (0.128) | | GDP growth rate | -0.119* | -0.117* | | | (0.0606) | (0.0603) | | Cost to income ratio (-1) | -3.143 | -3.235 | | | (6.719) | (6.720) | | Log total assets (-1) | 4.285*** | 4.613*** | | | (1.551) | (1.599) | | ROA (-1) | -0.431* | -2.953** | | | (0.243) | (1.428) | | Dummy Tier123*ROA (-1) | | 2.522* | | | | (1.392) | | Constant | -19.09 | -21.45 | | | (15.36) | (15.60) | | Observations | 376 | 376 | | R-squared | 0.513 | 0.514 | Notes: 1. Robust standard errors in parentheses.
2. *** p<0.01, ** p<0.05, * p<0.1
Source: RBI staff estimates. | Reference: Ahamed, M. M. (2017). Asset Quality, Non-Interest Income, and Bank Profitability: Evidence from Indian Banks, Economic Modelling, 63, 1-14. | V.17 Reflecting higher net profits, UCBs’ return on assets (RoA), return on equity (RoE) and net interest margin (NIM) improved during 2023-24. During H1:2024-25, UCBs’ profitability improved further (Table V.7). V.18 UCBs’ profitability, which dipped in 2019-20 due to losses incurred by a large UCB, has recovered since then with an improvement in asset quality (Chart V.10 a and b). | Table V.7: Select Profitability Indicators of UCBs | | (Per cent) | | | Scheduled UCBs | Non-Scheduled UCBs | All UCBs | | 2022-23 | 2023-24 | 2022-23 | 2023-24 | 2022-23 | 2023-24 | Sep-24 | | 1 | 2 | 3 | 4 | 5 | 6 | 7 | 8 | | Return on Assets | 0.42 | 0.78 | 0.49 | 0.60 | 0.46 | 0.68 | 0.84 | | Return on Equity | 5.08 | 8.68 | 5.17 | 5.98 | 5.13 | 7.12 | 8.4 | | Net Interest Margin | 2.77 | 3.35 | 3.17 | 4.02 | 2.99 | 3.70 | 3.42 | Note: Data for 2023-24 are provisional.
Source: Off-site surveillance returns, RBI. | 3.3. Soundness V.19 The number of instances of penalty imposition on co-operative banks (including UCBs) increased by 22 per cent to 215 during 2023-24 from 176 in the previous year. However, the amount of penalty imposed declined by 13.8 per cent (Table IV.16 in Chapter IV). The Deposit Insurance and Credit Guarantee Corporation (DICGC) settled claims of ₹1,432 crore during 2023-24, which pertained entirely to co-operative banks placed under liquidation/ all-inclusive directions (AID). 3.4. Capital Adequacy V.20 In July 2022, the revised regulatory framework (effective from April 1, 2023) for UCBs increased the minimum regulatory capital requirement for Tier 2 to Tier 4 UCBs to 12 per cent, while keeping it at 9 per cent for Tier 1 UCBs. At end-March 2024, 42.3 per cent of the UCBs belonged to upper tiers (Tier 2 to Tier 4), while more than 90 per cent maintained CRARs above 12 per cent (Table V.8 and Appendix Table V.2). V.21 During 2023-24, the consolidated CRAR of UCBs improved on the back of higher Tier I capital, driven inter alia by increased profitability due to lower provisions and regulatory permission to include revaluation reserves in Tier I capital5 (Table V.9). Additionally, UCBs’ efforts to raise long-term subordinate bonds strengthened their capital base. | Table V.8: CRAR-wise Distribution of UCBs | | (At end-March 2024) | | (Number of banks) | | CRAR (in per cent) | Scheduled UCBs | Non-Scheduled UCBs | All UCBs | | 1 | 2 | 3 | 4 | | CRAR < 3 | 1 | 28 | 29 | | 3 <= CRAR < 6 | 1 | 13 | 14 | | 6 <= CRAR < 9 | 0 | 14 | 14 | | 9 <= CRAR < 12 | 2 | 85 | 87 | | 12 <= CRAR | 45 | 1,283 | 1328 | | Total | 49 | 1,423 | 1,472 | Note: Data are provisional.
Source: Off-site surveillance returns, RBI. | V.22 Reflecting sharper accretion to capital from 2021-22 onward, UCBs’ CRAR was higher than that of SCBs at end-March 2024 (Chart V.11). The CRAR remained stable at 17.5 per cent at end-September 2024.
| Table V.9: Component-wise Capital Adequacy of UCBs | | (At end-March) | | (Amount in ₹ crore) | | | Scheduled UCBs | Non-Scheduled UCBs | All UCBs | | 2023 | 2024 | 2023 | 2024 | 2023 | 2024 | | 1 | 2 | 3 | 4 | 5 | 6 | 7 | 8 | | 1 | Capital Funds | 23,367 | 25,964 | 30,715 | 33,238 | 54,081 | 59,202 | | | i) Tier I Capital | 18,016 | 20,125 | 26,762 | 29,086 | 44,778 | 49,210 | | | ii) Tier II Capital | 5,351 | 5,839 | 3,953 | 4,152 | 9,304 | 9,992 | | 2 | Risk-weighted Assets | 1,50,776 | 1,57,866 | 1,70,247 | 1,80,672 | 3,21,024 | 3,38,538 | | 3 | CRAR (1 as % of 2) | 15.5 | 16.4 | 18.0 | 18.4 | 16.8 | 17.5 | | | Of which: | | | | | | | | | Tier I | 11.9 | 12.7 | 15.7 | 16.1 | 13.9 | 14.5 | | | Tier II | 3.5 | 3.7 | 2.3 | 2.3 | 2.9 | 3.0 | Note: Data for 2024 are provisional.
Source: Off-site surveillance returns, RBI. | 3.5. Asset Quality V.23 The asset quality of UCBs, measured by the gross non-performing assets (GNPA) ratio, improved for the third consecutive year, although remaining well above that of SCBs (Chart V.12a). At end-September 2024, the GNPA ratio of UCBs was 9.6 per cent as compared to 10.9 per cent at end-September 2023. Among UCBs, NSUCBs had higher GNPA ratios. As the decline in GNPAs outpaced falling provisions, the provision coverage ratio (PCR) improved and is likely to increase further with the phased harmonisation of UCBs’ provisioning norms for standard advances6 (Table V.10). V.24 At end-March 2024, large borrowal accounts, i.e., accounts with exposures of ₹5 crore and above, constituted 24.3 per cent of UCBs’ total lending and 31.1 per cent of their GNPAs. These accounts exhibited varied behaviour between SUCBs and NSUCBs. 43 per cent of SUCBs’ lending was concentrated in these accounts, while NSUCBs’ exposure to these borrowers was less than 10 per cent. The large borrowers accounted for 15.3 per cent of NSUCBs’ NPAs, and 63.0 per cent of SUCBs’ NPAs. For the sector as a whole, special mention accounts-1 (SMA-1) declined during the year but SMA-2 increased, mainly led by SUCBs (Chart V.12b). 3.6. Priority Sector Lending V.25 The revised guidelines for priority sector lending set higher targets for UCBs to be achieved in a phased manner7. The target for end-March 2023 and end-March 2024 was 60 per cent of the adjusted net bank credit (ANBC) or CEOBE. While the UCBs had met the target comfortably at end-March 2023, they missed it at end-March 2024 (Chart V.13). | Table V.10: Non-Performing Assets of UCBs | | (At end-March) | | | Scheduled UCBs | Non-Scheduled UCBs | All UCBs | | 2023 | 2024 | 2023 | 2024 | 2023 | 2024 | | 1 | 2 | 3 | 4 | 5 | 6 | 7 | | Gross NPAs (₹ crore) | 10,016 | 8,422 | 19,188 | 16,988 | 29,204 | 25,411 | | Gross NPA Ratio (%) | 6.6 | 5.3 | 10.7 | 9.1 | 8.8 | 7.3 | | Net NPAs (₹ crore) | 2,298 | 1,960 | 4,386 | 1,953 | 6,684 | 3,913 | | Net NPA Ratio (%) | 1.6 | 1.3 | 2.7 | 1.1 | 2.2 | 1.2 | | Provisioning (₹ crore) | 7,718 | 6,462 | 14,802 | 15,035 | 22,520 | 21,497 | | Provisioning Coverage Ratio (%) | 77.1 | 76.7 | 77.1 | 88.5 | 77.1 | 84.6 | Note: Data for 2024 are provisional.
Source: Off-site surveillance returns, RBI. |
V.26 During 2023-24, the share of MSMEs, particularly small enterprises, in total priority sector lending declined. UCBs’ lending to micro enterprises exceeded the target of 7.5 per cent. Although lending to weaker sections declined, UCBs met the target of 11.5 per cent. The share of renewable energy in total advances increased, albeit marginally (Table V.11). 4. Rural Credit Co-operatives V.27 Rural credit co-operatives (RCCs) came into existence as institutional mechanisms to provide adequate and affordable credit for farming and allied activities. They play an important role in rural credit delivery due to their grass root level presence in the hinterland. RCCs differ from their urban peers in terms of their area of operations, reach, performance and composition of liabilities. At end-March 2024, there were 34 state co-operative banks (StCBs) with 2,140 branches and 351 district central co-operative banks (DCCBs)8 operating through 13,759 branches. At end-March 2023, 1,06,955 primary agriculture credit societies (PACS) were spread over 6.5 lakh villages and long-term RCCs comprised of 13 state co-operative agriculture and rural development banks (SCARDBs) with 692 branches and 608 primary co-operative agriculture and rural development banks (PCARDBs). | Table V.11: Composition of Credit to Priority Sectors by UCBs | | (At end-March) | | (Amount in ₹ crore) | | | 2023 | 2024 | | Amount | Share in Total Advances (%) | Amount | Share in Total Advances (%) | | 1 | 2 | 3 | 4 | 5 | 6 | | 1 | Agriculture [(i)+(ii)+(iii)] | 15,404 | 4.7 | 16,329 | 4.7 | | | (i) Farm Credit | 11,470 | 3.5 | 12,328 | 3.6 | | | (ii) Agriculture Infrastructure | 902 | 0.3 | 1,224 | 0.4 | | | (iii) Ancillary Activities | 3,032 | 0.9 | 2,777 | 0.8 | | 2 | Micro and Small Enterprises [(i) + (ii) + (iii) + (iv)] | 1,24,658 | 37.7 | 1,29,069 | 37.2 | | | (i) Micro Enterprises | 52,849 | 16.0 | 56,533 | 16.3 | | | (ii) Small Enterprises | 48,903 | 14.8 | 48,495 | 14.0 | | | (iii) Medium Enterprises | 22,281 | 6.7 | 23,492 | 6.8 | | | (iv) Advances to KVI (Including ‘Other Finance to MSMEs’) | 625 | 0.2 | 549 | 0.2 | | 3 | Export Credit | 319 | 0.1 | 723 | 0.2 | | 4 | Education | 3,187 | 1.0 | 3,226 | 0.9 | | 5 | Housing | 29,286 | 8.9 | 29,268 | 8.4 | | 6 | Social Infrastructure | 1,151 | 0.3 | 1,038 | 0.3 | | 7 | Renewable Energy | 972 | 0.3 | 1,419 | 0.4 | | 8 | ‘Others’ category under Priority Sector | 30,121 | 9.1 | 25,326 | 7.3 | | 9 | Total (1 to 8) | 2,05,269 | 62.1 | 2,06,399 | 59.5 | | | of which, Loans to Weaker Sections under Priority Sector | 45,565 | 13.8 | 42,743 | 12.3 | Notes: 1. Data for 2024 are provisional.
2. Percentages are with respect to the total credit of UCBs.
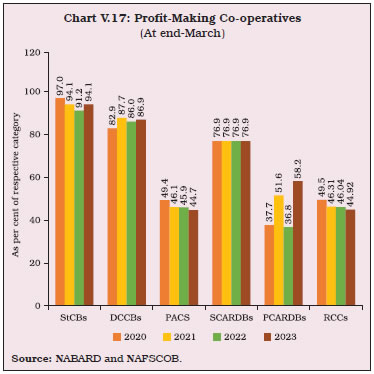
Source: Off-site surveillance returns, RBI. | V.28 While UCBs primarily depend on deposits to raise funds, RCCs rely heavily on borrowings. Deposits constituted 78.4 per cent of UCBs’ total liabilities at end-March 2023 as compared with 54.2 per cent for RCCs. On the other hand, borrowings were around 33 per cent of total liabilities of RCCs and less than 1 per cent of UCBs’ liabilities at end-March 2023. V.29 The owned funds9 to liabilities ratio of UCBs has increased over time and surpassed that of RCCs at end-March 2023 due to higher reserves of the former. Amongst RCCs, SCARDBs continue to have the highest share of owned funds in total liabilities (Chart V.14a). The asset quality of UCBs remained better than RCCs, with the latter dragged down by the deteriorating GNPA ratio of long-term co-operatives (Chart V.14b). V.30 RCCs, consisting of short-term and long-term institutions, expanded their operations further in 2022-23. Their share in the total assets of the co-operative sector (urban and rural co-operatives combined) increased to 70.4 per cent from 69.2 per cent a year ago (Chart V.15). 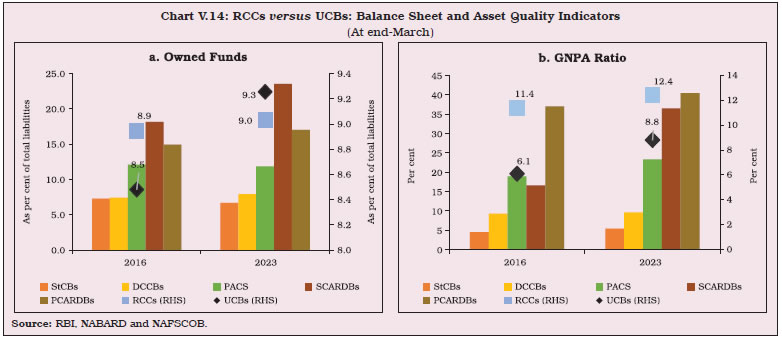 V.31 Amongst RCCs, the short-term institutions provide crop loans and working capital loans to farmers and rural artisans. The long-term co-operatives - SCARDBs and PCARDBs - provide funding for investment in agriculture, including land development, farm mechanisation and minor irrigation, rural industries and housing. SCARDBs borrow from institutions, such as, the NABARD for direct lending as well as lending through PCARDBs. The RCC sector is dominated by short-term institutions and their share in total assets increased to 96.3 per cent at end-March 2023 from 94.4 per cent at end-March 2016 (Chart V.16a). While the reliance of both short-term and long-term credit co-operatives on borrowings is higher than UCBs, the depositor base of long-term credit co-operatives is especially small. The financial performance of short-term rural co-operatives has been relatively better than their long-term counterparts (Chart V.16b). RCCs face challenges from a non-diversified lending portfolio focussed on agriculture, high non-performing assets, low recoveries and high operating costs. 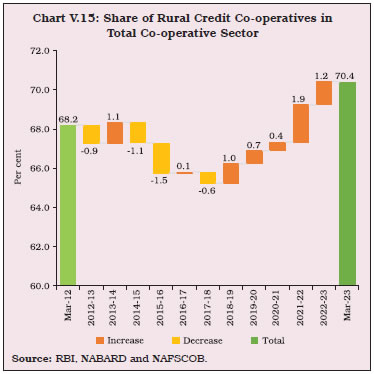 V.32 Despite the drag from the PACS, the RCC sector remained profitable for the fourth consecutive year (Table V.12). In 2022-23, the number of profit-making PCARDBs increased significantly on account of sharp increase in income (both interest and non-interest) and contraction in total expenditure (Chart V.17). 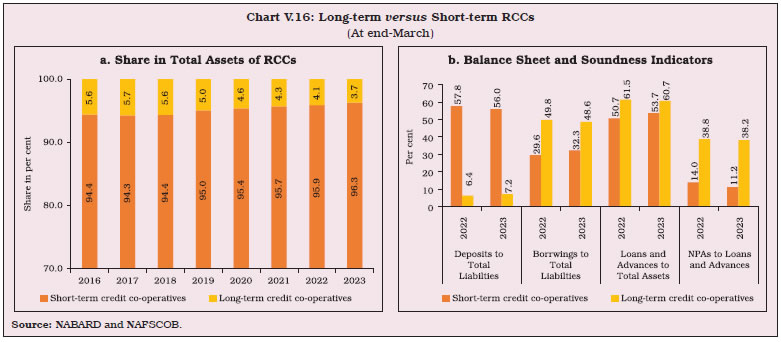
| Table V.12: A Profile of Rural Credit Co-operatives | | (At end-March 2023) | | (Amount in ₹ crore) | | | Short-term | Long-term | Rural Credit Co-operatives | | StCBs | DCCBs | PACS | SCARDBs (P) | PCARDBs (P) | Mar-22 | Mar-23 | | 1 | 2 | 3 | 4 | 5 | 6 | 7 | 8 | | A. Number of Co-operatives | 34 | 351 | 1,06,955 | 13 | 608 | 1,05,268 | 1,07,961 | | B. Balance Sheet Indicators | | | | | | | | | i. Owned Funds (Capital + Reserves) | 30,318 | 55,216 | 48,565 | 6,545 | 5,527 | 1,35,460 | 1,46,171 | | ii. Deposits | 2,42,327 | 4,33,358 | 1,97,239 | 2,621 | 1,720 | 8,33,844 | 8,77,263 | | iii. Borrowings | 1,54,970 | 1,47,207 | 2,01,329 | 12,559 | 16,712 | 4,55,373 | 5,32,778 | | iv. Loans and Advances | 2,65,580 | 3,70,851 | 2,00,491 | 20,770 | 15,773 | 7,66,470 | 8,73,466 | | v. Total Liabilities/Assets | 4,51,840 | 6,97,304 | 4,09,377^ | 27,794 | 32,445 | 14,98,292 | 16,18,761 | | C. Financial Performance | | | | | | | | | i. Institutions in Profits | | | | | | | | | a. No. | 32 | 305 | 47,794 | 10 | 351 | 48,461 | 48,492 | | b. Amount of Profit | 2,517 | 2,879 | 2,142 | 448 | 525 | 6,754 | 8,512 | | ii. Institutions in Loss | | | | | | | | | a. No. | 2 | 46 | 37,357 | 3 | 252 | 39,081 | 37,660 | | b. Amount of Loss | 60 | 998 | 3,586 | 40 | 305 | 5,506 | 4,989 | | iii. Overall Profits (+)/Loss (-) | 2,458 | 1,881 | -1,444 | 408 | 220 | 1,248 | 3,523 | | D. Non-performing Assets | | | | | | | | | i. Amount | 14,296 | 35,722 | 44,042^^ | 7,571 | 6,371 | 1,16,718 | 1,08,002 | | ii. As percentage of Loans Outstanding | 5.4 | 9.6 | 23.3 | 36.5 | 40.4 | 15.2 | 12.4 | | E. Recovery-to-Demand Ratio* (Per cent) | 91.7 | 76.5 | 78.9 | 42.8 | 39.1 | - | - | Notes: 1. P: Data are provisional.
2. *: This ratio captures the share of outstanding demand amount (amount due) that has been recovered at end-June 2022.
3. Data for financial year 2022-23 are available in respect of 603 of 608 reported PCARDBs.
4. ^: Working capital.
5. ^^: Total overdues.
Source: NABARD and NAFSCOB. |
 4.1. Short-term Rural Credit Co-operatives V.33 Short-term RCCs - StCBs at state level, DCCBs at district level and PACS at the village level - primarily meet crop loan and working capital requirements of dairy farmers and fishery units. Over time, their scope has widened to cover non-farm sector activity, and term lending to allied sectors and microfinance. Short-term RCCs operate in a two-, three- or mixed-tier structure10. In the two-tier structure, StCBs lend through their own branches as well as through PACS. In the three-tier structure, StCBs work as the apex bank for all DCCBs, which constitute the intermediate tier and provide loans to affiliated societies. In states with the mixed-tier structure, StCBs operate through their own branches in some districts and through DCCBs in the remaining districts. Deposits are the major source of funds for StCBs and DCCBs. On the other hand, PACS rely heavily on borrowings; the share of deposits has declined over the years (Chart V.18). 4.1.1. State Co-operative Banks V.34 StCBs, the apex institutions in the rural co-operative structure, provide credit for a range of agricultural and non-agricultural purposes. They also provide liquidity and technical assistance to the other two tiers. Agricultural loans constituted more than 45 per cent of their total loan portfolio. Balance Sheet Operations V.35 In 2023-24, StCBs’ balance sheet grew by over 8 per cent for the fourth consecutive year, driven by credit on the assets side and borrowings and deposits on the liabilities side. At end-March 2024, the C-D ratio increased to 114.7 per cent (compared to 76.8 per cent in the case of SCBs) from 109.6 per cent (75.1 per cent in the case of SCBs) at end-March 2023. The share of current account and savings account (CASA) deposits declined to 18.6 per cent at end-March 2024 from 19.5 per cent at end-March 2023, resulting in an increase in interest expenditure. Deposit growth improved but trailed that in borrowings (Table V.13). V.36 Credit growth of scheduled StCBs decelerated in 2023-24, while deposits recovered from the contraction in the previous year (Table V.14). Profitability V.37 During 2023-24, growth of interest expenditure of StCBs accelerated to 24.9 per cent, outpacing that of interest income; their net interest income (NII) declined by 5.7 per cent. Net profit, however, increased by 9.5 per cent due to growth in non-interest income and contraction in operating expenses (Table V.15). | Table V.13: Liabilities and Assets of State Co-operative Banks | | (Amount in ₹ crore) | | | At end-March | Variation (%) | | 2023 | 2024P | 2022-23 | 2023-24 | | 1 | 2 | 3 | 4 | 5 | | Liabilities | | | | | | 1. Capital | 9,774 | 10,531 | 5.5 | 7.7 | | | (2.2) | (2.2) | | | | 2. Reserves | 20,544 | 22,861 | 14.3 | 11.3 | | | (4.5) | (4.7) | | | | 3. Deposits | 2,42,327 | 2,56,819 | 0.6 | 6.0 | | | (53.6) | (52.6) | | | | 4. Borrowings | 1,54,970 | 1,73,116 | 25.2 | 11.7 | | | (34.3) | (35.5) | | | | 5. Other Liabilities | 24,226 | 24,940 | -4.1 | 2.9 | | | (5.4) | (5.1) | | | | Assets | | | | | | 1. Cash and Bank Balances | 21,237 | 22,661 | 12.6 | 6.7 | | | (4.7) | (4.6) | | | | 2. Investments | 1,48,666 | 1,55,826 | 5.5 | 4.8 | | | (32.9) | (31.9) | | | | 3. Loans and Advances | 2,65,580 | 2,94,577 | 11.2 | 10.9 | | | (58.8) | (60.3) | | | | 4. Accumulated Losses | 1,348 | 1,146 | -0.4 | -15.0 | | | (0.3) | (0.2) | | | | 5. Other Assets | 15,009 | 14,057 | -12.4 | -6.3 | | | (3.3) | (2.9) | | | | Total Liabilities/Assets | 4,51,840 | 4,88,266 | 8.3 | 8.1 | | | (100.00) | (100.00) | | | Notes: 1. Figures in parentheses are proportion to total liabilities/assets (in per cent).
2. Y-o-y variations could be slightly different because absolute numbers have been rounded off to ₹1 crore.
3. Components may not add up to the total due to rounding off.
4. P: Provisional.
Source: NABARD. |
| Table V.14: Select Balance Sheet Indicators of Scheduled State Co-operative Banks | | (At end-March) | | (Amount in ₹ crore) | | | 2020 | 2021 | 2022 | 2023 | 2024 | | 1 | 2 | 3 | 4 | 5 | 6 | | Deposits | 1,87,456 | 1,97,751 | 2,11,784 | 2,04,432 | 2,15,540 | | | (69.6) | (5.5) | (7.1) | (-3.5) | (5.4) | | Credit | 1,94,310 | 2,06,322 | 2,28,194 | 2,55,750 | 2,78,147 | | | (47.9) | (6.2) | (10.6) | (12.1) | (8.8) | | SLR Investments | 54,181 | 67,788 | 77,677 | 74,721 | 77,525 | | | (63.5) | (25.1) | (14.6) | (-3.8) | (3.8) | | Credit plus SLR Investments | 2,48,492 | 2,74,110 | 3,05,871 | 3,30,471 | 3,55,671 | | | (51.0) | (10.3) | (11.6) | (8.0) | (7.6) | Notes: 1. Data pertain to last reporting Friday of March of the corresponding year.
2. Figures in brackets are growth rates in per cent over previous year.
Source: Form B under Section 42 of RBI Act. |
| Table V.15: Financial Performance of State Co-operative Banks | | (Amount in ₹ crore) | | | 2022-23 | 2023-24P | Percentage Variation | | 2022-23 | 2023-24 | | 1 | 2 | 3 | 4 | 5 | | A. Income (i+ii) | 27,648 | 32,401 | 10.8 | 17.2 | | | (100.00) | (100.00) | | | | i. Interest Income | 26,654 | 30,974 | 10.3 | 16.2 | | | (96.4) | (95.6) | | | | ii. Other Income | 994 | 1,427 | 26.9 | 43.6 | | | (3.6) | (4.4) | | | | B. Expenditure (i+ii+iii) | 25,191 | 29,710 | 11.1 | 17.9 | | | (100.00) | (100.00) | | | | i. Interest Expended | 19,043 | 23,793 | 15.1 | 24.9 | | | (75.6) | (80.1) | | | | ii. Provisions and Contingencies | 1,920 | 1,979 | -19.2 | 3.0 | | | (7.6) | (6.7) | | | | iii. Operating Expenses | 4,227 | 3,938 | 12.7 | -6.8 | | | (16.8) | (13.3) | | | | Of which, | | | | | | Wage Bill | 2,060 | 2,077 | -0.2 | 0.8 | | | (8.2) | (7) | | | | C. Profits | | | | | | i. Net Interest Income | 7,611 | 7,181 | -0.3 | -5.7 | | ii. Operating Profits | 3,990 | 4,205 | 35.4 | 5.4 | | iii. Net Profits | 2,458 | 2,691 | 7.4 | 9.5 | Notes 1. Figures in parentheses are proportion to total income/expenditure (in per cent).
2. Y-o-y variations could be slightly different because absolute numbers have been rounded off to ₹1 crore in the table.
3. Components may not add up to the total due to rounding off.
4. P: Provisional.
Source: NABARD. | V.38 94 per cent of StCBs (i.e. 32 StCBs out of 34) reported profits during 2023-24, as against 91 per cent in 2021-2211. Profits were dominated by western and southern region StCBs (Chart V.19 and Appendix Table V.3). Asset Quality V.39 The asset quality of StCBs improved for the third consecutive year, with the GNPA ratio declining from 6.7 per cent at end-March 2021 to 4.9 per cent at end-March 2024. Although the slippages were higher, the GNPA ratio declined due to robust credit growth. The NPAs under the doubtful category shrank after growing for six consecutive years. The PCR increased on account of greater provisions made against NPAs and hence net NPA ratio also improved (Table V.16). V.40 During 2023-24, the GNPA ratio of 70 per cent of StCBs declined, led by the western and northern region. The GNPA ratio reduced for all regions, except for the marginal increase in the eastern region (Appendix Table V.3). Capital Adequacy V.41 The consolidated CRAR of StCBs declined at end-March 2024, as growth in capital funds trailed the increase in risk weighted assets (Chart V.20). Two StCBs had CRAR less than the regulatory minimum requirement of 9 per cent. | Table V.16: Soundness Indicators of State Co-operative Banks | | (Amount in ₹ crore) | | | At end-March | Percentage Variation | | 2023 | 2024P | 2022-23 | 2023-24 | | 1 | 2 | 3 | 4 | 5 | | A. Total NPAs (i+ii+iii) | 14,296 | 14,537 | -0.3 | 1.7 | | i. Sub-standard | 4,609 | 4,974 | -14.4 | 7.9 | | | (32.2) | (34.2) | | | | ii. Doubtful | 8,292 | 8,237 | 10.0 | -0.7 | | | (58) | (56.7) | | | | iii. Loss | 1,395 | 1,326 | -0.7 | -4.9 | | | (9.8) | (9.1) | | | | B. Gross NPA Ratio (%) | 5.4 | 4.9 | - | - | | C. Net NPA Ratio (%) | 2.1 | 2.0 | - | - | | D. Provision Coverage Ratio (%) | 67.2 | 68.5 | - | - | | E. Recovery to Demand Ratio (%) | 91.7 | 92.4 | - | - | Notes: 1. Figures in parentheses are shares in total NPAs (in per cent).
2. P: Provisional.
3. Recovery-to-demand ratio captures the share of outstanding demand amount (amount due) that has been recovered at end-June 2022 and 2023 for 2022-23 and 2023-24, respectively.
Source: NABARD. |
4.1.2. District Central Co-operative Banks V.42 DCCBs mobilise funds through public deposits, borrowings from StCBs and refinance from the NABARD. Due to their extensive branch network, they have better access to CASA deposits, which accounted for 41.7 per cent of their total deposits at end-March 2024 (compared to 18.6 per cent for StCBs). More than 75 per cent of the total advances and 96 per cent of the agricultural advances of DCCBs are towards PACS/ societies. Balance Sheet Operations V.43 Deposit growth of DCCBs accelerated to 10.0 per cent in 2023-24, exceeding that of StCBs’ (6.0 per cent). The C-D ratio of DCCBs increased from 85.6 per cent at end-March 2023 to 86.7 per cent at end-March 2024 due to higher growth in advances (Table V.17). Profitability V.44 Growth in NII of DCCBs decelerated from 14.5 per cent during 2022-23 to 5.4 per cent during 2023-24, as interest expenditure rose faster than interest income (Table V.18). Consequently, net profit growth moderated sharply to 0.7 per cent in 2023-24 from 38.5 per cent in the previous year, which had benefited from a low base (contraction in 2021-22). | Table V.17: Liabilities and Assets of District Central Co-operative Banks | | (Amount in ₹ crore) | | | At end-March | Percentage Variation | | 2023 | 2024P | 2022-23 | 2023-24 | | 1 | 2 | 3 | 4 | 5 | | Liabilities | | | | | | 1. Capital | 26,486 | 28,661 | 8.2 | 8.2 | | | (3.8) | (3.7) | | | | 2. Reserves | 28,729 | 31,701 | 8.5 | 10.3 | | | (4.1) | (4.1) | | | | 3. Deposits | 4,33,358 | 4,76,610 | 5.0 | 10.0 | | | (62.1) | (62.3) | | | | 4. Borrowings | 1,47,207 | 1,61,728 | 14.5 | 9.9 | | | (21.1) | (21.1) | | | | 5. Other Liabilities | 61,524 | 66,876 | 7.0 | 8.7 | | | (8.8) | (8.7) | | | | Assets | | | | | | 1. Cash and Bank Balances | 33,767 | 38,705 | 5.2 | 14.6 | | | (4.8) | (5.1) | | | | 2. Investments | 2,47,942 | 2,65,692 | 5.1 | 7.2 | | | (35.6) | (34.7) | | | | 3. Loans and Advances | 3,70,851 | 4,13,161 | 10.2 | 11.4 | | | (53.2) | (54) | | | | 4. Accumulated Losses | 8,357 | 9,405 | 7.8 | 12.5 | | | (1.2) | (1.2) | | | | 5. Other Assets | 36,388 | 38,615 | -2.3 | 6.1 | | | (5.2) | (5) | | | | Total Liabilities/Assets | 6,97,304 | 7,65,577 | 7.4 | 9.8 | | | (100.00) | (100.00) | | | Notes: 1. Figures in parentheses are proportion to total liabilities/assets (in per cent).
2. P: Provisional.
Source: NABARD. | V.45 During 2023-24, there were 312 profit-making DCCBs and 39 loss-making entities. While the number of loss-making DCCBs declined in 2023-24, cumulative losses of DCCBs increased by 40.6 per cent. Madhya Pradesh, Uttar Pradesh, Punjab and Bihar accounted for 64.1 per cent of the loss-making DCCBs. On the other hand, the western and southern regions added the maximum to the total profits of DCCBs (Appendix Table V.4). | Table V.18: Financial Performance of District Central Co-operative Banks | | (Amount in ₹ crore) | | | 2022-23 | 2023-24P | Percentage Variation | | 2022-23 | 2023-24 | | 1 | 2 | 3 | 4 | 5 | | A. Income (i+ii) | 46,309 | 52,408 | 11.1 | 13.2 | | | (100.00) | (100.00) | | | | i. Interest Income | 43,967 | 49,989 | 10.8 | 13.7 | | | (94.9) | (95.4) | | | | ii. Other Income | 2,342 | 2,420 | 17.9 | 3.3 | | | (5.1) | (4.6) | | | | B. Expenditure (i+ii+iii) | 44,428 | 50,515 | 10.2 | 13.7 | | | (100.00) | (100.00) | | | | i. Interest Expended | 27,600 | 32,731 | 8.6 | 18.6 | | | (62.1) | (64.8) | | | | ii. Provisions and Contingencies | 5,639 | 5,733 | 15.3 | 1.7 | | | (12.7) | (11.3) | | | | iii. Operating Expenses | 11,189 | 12,051 | 11.6 | 7.7 | | | (25.2) | (23.9) | | | | Of which, Wage Bill | 6,942 | 7,430 | 9.7 | 7.0 | | | (15.6) | (14.7) | | | | C. Profits | | | | | | i. Net Interest Income | 16,367 | 17,257 | 14.5 | 5.4 | | ii. Operating Profits | 6,933 | 7,107 | 17.6 | 2.5 | | iii. Net Profits | 1,881 | 1,894 | 38.5 | 0.7 | Notes: 1. Figures in parentheses are proportion of total liabilities/assets (in per cent).
2. P: Provisional.
Source: NABARD. | Asset Quality V.46 Asset quality of DCCBs improved for the fourth consecutive year, with the GNPA ratio declining from 12.6 per cent at end-March 2020 to 8.9 per cent at end-March 2024. The GNPA ratio of DCCBs, however, remained higher than that of StCBs (Chart V.21 and Table V.19). The GNPA ratio declined in 15 of the 20 states/UTs with DCCBs. The central and western regions – particularly Madhya Pradesh and Maharashtra - have the highest GNPA ratio, and the southern region has the highest recovery-to-demand ratio (Appendix Table V.4). Capital Adequacy V.47 The consolidated CRAR and Tier I capital ratio of DCCBs declined at end-March 2024 to a four-year low (Chart V.22). However, the number of DCCBs with CRAR less than the minimum regulatory requirement of 9 per cent declined from 41 at end-March 2023 to 39 at end-March 2024. 90 per cent of the DCCBs with CRAR less than 9 per cent were concentrated in six states /UTs, viz., Madhya Pradesh, Uttar Pradesh, Punjab, Jammu and Kashmir, Maharashtra and West Bengal. 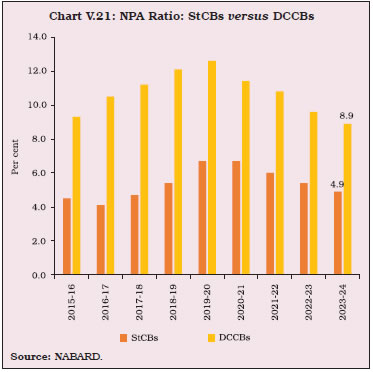
| Table V.19: Soundness Indicators of District Central Co-operative Banks | | (Amount in ₹ crore) | | | At end-March | Percentage Variation | | 2023 | 2024P | 2022-23 | 2023-24 | | 1 | 2 | 3 | 4 | 5 | | A. Total NPAs (i+ii+iii) | 35,722 | 36,958 | -1.7 | 3.5 | | i) Sub- standard | 12,541 | 13,433 | -6.5 | 7.1 | | | (35.1) | (36.3) | | | | ii) Doubtful | 20,739 | 20,912 | 2.2 | 0.8 | | | (58.1) | (56.6) | | | | iii) Loss | 2,442 | 2,612 | -6.8 | 7.0 | | | (6.8) | (7.1) | | | | B. Gross NPA Ratio (%) | 9.6 | 8.9 | - | - | | C. Net NPA Ratio (%) | 3.9 | 3.4 | | | | D. Provision Coverage Ratio (%) | 78.4 | 83.9 | | | | E. Recovery-to-Demand Ratio (%) | 76.5 | 76.8 | - | - | Notes: 1. Figures in parentheses are proportion to total NPAs (in per cent).
2. Recovery-to-demand ratio captures the share of outstanding demand amount (amount due) that has been recovered at end-June 2022 and 2023 for 2022-23 and 2023-24, respectively.
3. P: Provisional.
Source: NABARD. |
4.1.3. Primary Agricultural Credit Societies V.48 PACS form the lowest tier in the rural co-operative ladder with individuals as member shareholders. At end-March 2023, PACS served 16.03 crore members and 4.9 crore borrowers; with 45.6 per cent members and 57.3 per cent of the borrowers being small farmers. The borrower-to-member ratio – a metric to gauge credit penetration of PACS – increased to 30.7 per cent at end-March 2023 after declining sharply to 28.6 per cent at end-March 2022. The improvement in the ratio reflected both a decrease in the number of members and an increase in the number of borrowers (Appendix Table V.5). More than 80 per cent of PACS’ loans were for short duration and were extended towards agriculture. The western region - with 29.1 per cent share in total number of PACS - dominates the sector. However, the southern region’s deposits and loans and advances dominated with a share of 79.0 per cent and 46.2 per cent, respectively. V.49 The NABARD is implementing the centrally sponsored scheme for computerisation of about 67,930 functional PACS across the country over a period of 5 years to enable them to capture records of all credit and non-credit operations digitally. The total budget of the scheme at ₹2,516 crore is shared between Government of India, State governments and NABARD. The project comprises development of cloud-based common software with cyber security, uploading and building a National Level Data Repository (NLDR), training and other support services. This initiative will pave the way for seamless integration of PACS with the core banking solutions of DCCBs and StCBs, resulting in improved efficiency and transparency. V.50 The asset quality and recovery-to-demand ratio of PACS improved significantly in 2022-23; the high GNPA ratio, however, remains a cause of concern (Table V.12). The total resources of PACS increased during 2022-23 due to higher borrowings and increase in total reserves. On the assets side, the outstanding loans and advances expanded sharply due to nearly 20 per cent growth in short-term loans (Appendix Table V.6). V.51 In 2022-23, 44.7 per cent of the total number of PACS were profit making, with their consolidated profits increasing by 18.3 per cent to ₹2,142 crore. The consolidated losses of loss-making PACS decreased by 4.3 per cent to ₹3,585 crore and the sector, as a whole, recorded losses of ₹1,443 crore in 2022-23. At the regional level, only the western region posted net profits, while the southern region registered the highest losses (Appendix Table V.7). 4.2. Long-term Rural Credit Co-operatives V.52 Long-term RCCs were set up with the primary objective of offering long-term finance for agricultural development and comprise SCARDBs at the state level and PCARDBs at the district/taluka level. Currently, they operate in a unitary structure in five states/UTs (Gujarat, Jammu and Kashmir, Puducherry, Tripura and Uttar Pradesh) where SCARDBs operate through their branches located in different parts of the state and customers are linked to the bank by virtue of their direct membership of the bank. Six states, viz., Haryana, Karnataka, Kerala, Punjab, Rajasthan and Tamil Nadu have a federal structure, i.e., SCARDBs work as an apex entity of all the affiliated PCARDBs operating at the district/taluka level, which, in turn, enrol members and offer loans to them. Two states (Himachal Pradesh and West Bengal) have a mixed structure where SCARDBs operate through PCARDBs as well as through their branches. V.53 At end-March 2023, there were 13 SCARDBs and 608 PCARDBs with a total membership of 1.08 crore members, of which 36 per cent were borrowing members. The business model of SCARDBs and PCARDBs depends on borrowings, where SCARDBs borrow primarily from the NABARD, while PCARDBs get financial assistance from SCARDBs (Chart V.23a). SCARDBs have lower accumulated losses and higher share of loans and advances in total assets (Chart V.23b). V.54 In January 2024, the Ministry of Cooperation launched the project for computerisation of 1,851 units of long-term RCCs in 11 states and 2 UTs. The project aims at providing computer hardware along with Enterprise Resources Planning (ERP) based common software to enhance the operational efficiency, accountability and transparency in RCCs’ functioning. 4.2.1. State Co-operative Agriculture and Rural Development Banks V.55 At end-March 2023, SCARDBs operated in 13 states/UTs, with 46.7 per cent of branches in Uttar Pradesh. Borrowings constituted 45.2 per cent of the total liabilities of SCARDBs; more than 80 per cent of these borrowings were from the NABARD, given their limited deposit base. After expanding for two years, the consolidated balance sheet of SCARDBs contracted in 2022-23 due to decline in loans and advances. On the liabilities side, SCARDBs’ borrowings decreased along with deceleration in deposit growth (Appendix Table V.8). V.56 Notwithstanding the reduction in their balance sheet, NII of SCARDBs increased by 25.3 per cent in 2022-23, as interest income expanded more than interest expenditure. The increase in NII as well as non-interest income contributed to a sharp increase in net profit, albeit on a low base (Appendix Table V.9). V.57 The GNPA ratio increased during 2022-23, even as the recovery ratio improved (Appendix Table V.10). The southern region had the lowest GNPA ratio and the highest recovery ratio (Appendix Table V.11). 4.2.2. Primary Co-operative Agriculture and Rural Development Banks V.58 At end-March 2023, there were 608 PCARDBs in 8 states/UTs. The consolidated balance sheet of PCARDBs contracted during the year on account of decrease in loans and advances on the assets side and borrowings on the liabilities side (Appendix Table V.12). V.59 During 2022-23, the income of PCARDBs expanded by 18.8 per cent, while their expenditure contracted, leading to net profits. The increase in income was contributed by both interest and non-interest income, while the fall in operating expenses, particularly the wage bill, led to decline in total expenses (Appendix Table V.13). Of the eight states/UTs having PCARDBs, five posted consolidated net losses. V.60 The GNPA ratio of PCARDBs declined marginally during 2022-23 on account of reduction in sub-standard and doubtful categories. However, the GNPA ratio remained elevated at over 40 per cent, as the loss category loans expanded further (Appendix Table V.14). In contrast to the trend in other regions, the GNPA ratio of the northern region increased. This region continued to have the highest GNPA ratio and the lowest recovery-to-demand ratio during 2022-23. On the other hand, the southern region had the lowest GNPA ratio and the highest recovery-to-demand ratio (Appendix Table V.15). 5. Overall Assessment V.61 During 2023-24, UCBs exhibited an improvement in capital buffers, profitability and asset quality. Their credit and deposit growth, however, remained subdued relative to commercial banks. Assurance functions, viz., risk management, internal audit and compliance functions are effective gatekeepers for efficient risk management. To this end, the Reserve Bank has undertaken several initiatives to promote sound governance practices in UCBs, including, inter alia, the introduction of four-tiered regulatory framework, engaging directly with the Directors on Boards of UCBs and heads of Assurance functions of UCBs through conferences for conveying the supervisory expectations. Significant efforts are also being undertaken to address the IT and cyber security risks in UCBs. V.62 Among rural credit co-operatives, StCBs have consistently outperformed others and improved their asset quality along with higher profits in 2023-24. Going forward, the co-operative sector must stay vigilant about cyber threats and economic uncertainties and adapt to technological advancements to remain relevant in the fast-changing world.
|