Contents 1. Foreword 1.1 Over the past few years, digital payments in India have witnessed a phenomenal growth buoyed by the spectacular progress of Unified Payments Interface (UPI) and the plethora of digital payment options available. From the nascent digital payment ecosystem, comprising mostly of traditional card based digital payments, it has transformed to an ecosystem offering a bouquet of digital payment options catering to every need of the Indian consumer – instant payment systems (UPI, IMPS), small value payment systems (PPI, UPI Lite), large value payment (RTGS), bill payment (BBPS), bulk payment (NACH), offline payment (UPI Lite X), government payments (NACH, APBS), toll payments (NETC) and many more. 1.2 Retail digital payments in India have grown from 162 crore transactions in the financial year 2012-13 to over 16,416 crore transactions in the financial year 2023-24 i.e., approximately 100-fold increase over 12 years. The remarkable growth in payment infrastructure and payment performance is also apparent in the Digital Payment Index published by RBI, which has witnessed more than four-fold rise in the last six years (445.50 for March 2024, base 100 as of March 2018). 1.3 Throughout the development of the payments’ ecosystem, the Reserve Bank has devoted equal attention to its safety and security as well as protection of consumers. Payment safety measures such as two factor of authentication have been promoted, which incidentally, is still not mandatory in many advanced countries. The facility to switch on / off and set / modify transaction limits for all types of card transactions ensures that consumers have complete control over their payment options. Tokenisation of cards has within a period of two years seen large-scale adoption by consumers with over 91 crore card-on-file tokens created as on December 31, 2024. Master Directions on Cyber Resilience and Digital Payment Security Controls for Payment System Operators (PSOs), aimed to enhance safety and security of payment systems by providing a framework for overall information security preparedness with emphasis on cyber resilience, which cover baseline cyber and information security measures for PSOs and ensure safe and secure digital payment transactions have also been issued. 1.4 While domestic payment systems have become cheap and fast, cross-border payments remain expensive and slow. The Reserve Bank is focusing on interlinking the fast payment systems (FPS) with that of other countries to offer a seamless and less-costly cross-border payment experience. This mechanism and methodology of addressing the challenges in enhancing cross-border payments (i.e. high cost, low speed, limited access and limited transparency) has also been recognised by the international standard setting bodies (FSB, CPMI, etc.). Last year the Unified Payments Interface of India (UPI) and PayNow of Singapore were interlinked through extensive collaboration between RBI and Monetary Authority of Singapore. Recent data shows that the cost of sending a remittance has come down noticeably. 1.5 When it comes to payment systems, the Reserve Bank has always endeavoured to stay ahead of the curve. It has been the policy of the Bank to encourage innovation in the payment sector. RBI regularly engages with the PSOs and attempts to provide a nurturing environment. Fuelled by innovation and regulatory support, our payment systems have become one of the most modern across the globe. Sd/- T. Rabi Sankar
Deputy Governor
January 27, 2025 2. Overview 2.1 Payments form the backbone of any economic activity. They are increasingly being recognised as a means of achieving financial inclusion by ensuring that economic benefits reach all segments of society. The legal foundation for regulating payment systems evolved from the Payments and Settlement Systems Act, 2007 (PSS Act). The Reserve Bank of India (RBI) regulates, supervises, and licenses payment system operators, ensuring safety, security, efficiency, and effectiveness of the payment ecosystem as well as protecting the interests of the consumers. The Board for Regulation and Supervision of Payment and Settlement Systems (BPSS), chaired by the RBI Governor, formulates policies for the regulation and supervision of all types of payment and settlement systems, sets standards for existing and future systems, authorises payment and settlement systems, determines criteria for membership to these systems and decides on continuation, termination and rejection of membership. The BPSS meets quarterly and reports annually to the RBI Central Board. 2.2 Digital Payments in India have grown exponentially in the last decade. While in CY-2013 there were 222 crore digital transactions valued at ₹772 lakh crore, it has increased 94 times in volume and more than 3.5 times in value to over 20,787 crore transactions valued at ₹2758 lakh crore in CY-2024. In the last five years alone, digital payments in India have increased 6.7 times in volume and 1.6 times in value. This amounts to a five-year CAGR of 45.9% in terms of digital payments volume and 10.2% in terms of digital payments value. 2.3 The payments landscape in India consists of diverse options offered by banks and non-banks. During the last decade, the payment landscape has witnessed rapid expansion in terms of availability, user adoption and acceptance infrastructure. 2.4 Unified Payments Interface (UPI), launched in 2016 by the National Payments Corporation of India (NPCI), has emerged as the most used and preferred payment channel, and has revolutionized India's payment ecosystem by consolidating multiple bank accounts into one mobile interface. UPI's real-time, user-centric functions democratize payments and extend digital payments to previously unreached segments. Since its launch in 2016, UPI has seen multiple enhancements. Key being UPI lite for small value transactions, UPI lite X for offline payments and UPI123 Pay for feature phone users. UPI processes over 16 billion transactions a month. 2.5 Reserve Bank of India has been working towards enhancing cross-border payments by linking UPI with fast payment systems of other countries. Such linkages aid in addressing the issues of high cost, low speed, limited access and lack of transparency in cross-border remittance payments. The fast payment systems of India (UPI) and Singapore (PayNow) were linked in February 2023. RBI has also joined Project Nexus, a multilateral international initiative to enable instant cross-border retail payments by interlinking domestic fast payment systems of multiple countries. Payments to merchants using Indian UPI apps via QR codes has been enabled in Bhutan, France, Mauritius, Nepal, Singapore, Sri Lanka, and the UAE. 2.6 This report highlights the growth of various payment systems over the last five years. Factors that have contributed to the significant expansion in both high-value and retail payments have been identified. Analysis on the impact of 24X7 availability of RTGS and NEFT has shown that not only the transaction ticket size for both systems has decreased; the volatility in RTGS’s ticket size has also decreased substantially, making the system more stable. 2.7 Analysis of the growth Charts of NPCI operated retail payment systems is also presented in the report. Analysis over a five year period is presented for UPI, IMPS, AePS-Fund Transfer, BHIM Aadhar Pay, National Automated Clearing House (NACH) Credit and Debit, National Electronic Toll Collection (NETC) – both transactions as well as infrastructure and Bharat Bill Payment System (BBPS). 2.8 The report also covers the growth of Cards (credit and debit) and PPI payment systems. At end-December 2024, the number of credit cards has more than doubled to around 10.80 crore as compared to December 2019, when there were 5.53 crore cards in circulation. In contrast, number of debit cards have remained relatively stable, with a marginal increase from 80.53 crore in December 2019 to slightly more than 99.09 crore in December 2024. A bank group-wise analysis is presented to further disaggregate these dynamic growth patterns in the card infrastructure. A similar growth trajectory is witnessed in card transactions as well. 2.9 The report also analyses inward and outward remittances to and from India and other countries. The analyses derive from World Bank's report on global remittances for 2023 which underscores India's pre-eminence as the top recipient with $125 billion, significantly ahead of other countries like Mexico and China, reflecting the substantial contribution of its diaspora to the economy and foreign exchange reserves. The report also highlights that the cost of sending remittances to South Asia remains the lowest globally, although it still exceeds the Sustainable Development Goals' target. Within this framework, India's strategic position is further highlighted by its diverse cost efficiencies across different remittance corridors, with the Malaysia to India corridor being the most cost-effective. 2.10 A detailed disaggregated level analysis on the trends in growth of UPI payments has also been presented. A comparative analysis of growth in UPI Person-to-Person (P2P) and Person-to-Merchant (P2M) transactions for different value buckets shows that with the increased onboarding of merchants and growth in UPI payment acceptance infrastructure, the growth in UPI P2M transactions far outstrips UPI P2P transactions. 2.11 Chapter 3 of the report provides an overview of the Payment Systems in India. Chapter 4 covers the major regulatory developments related to Indian Payment Systems. Chapter 5 analyses the growth in UPI transactions including UPI P2P and P2M, as well as other products related to UPI like UPI Lite, UPI IPO, etc. Chapter 6 analyses the trend in volume and value of transactions of different payment systems over the last five years, cross border payments and inward and outward remittances to and from India. Chapter 7 highlights major global trends in Payment Systems. 3. Payment Systems in India 3.1 Legal basis 3.1.1 Payments underpin all economic activity in the country and are now increasingly viewed as a means of achieving financial inclusion and ensuring equitable distribution of economic benefits. This has been made possible by the amalgamation of technological innovation and robust regulatory frameworks, leading to widespread adoption of digital payment solutions, transforming the nation's financial landscape. 3.1.2 This section briefly discusses the evolution of legal framework underlying the payment systems of the country and where it stands today. The legal basis for payment systems in India has evolved over the years, reflecting the changing dynamics of the financial sector and advancements in technology. 3.1.3 The tale of payments and settlements is as old as history of exchange of goods and services among humans. But, as societies grew in complexity so did their needs around money and payments. Society moved from simple bartering to developing currency notes and coins in myriad forms. Later, increasing mobility of people spurred the trade among different societies and it necessitated the development of more efficient payment mechanisms which did not require carrying vast quantities of coins. Thus, the language changed from ‘promise to pay’ to ‘an order to pay’. These pay orders are very similar to present day drafts or cheques. The most important category of credit instruments that evolved in India were local language bills of exchange (called Hundis). Given the immature legal framework of the period, such informal letters would have been difficult to enforce. 3.1.4 Subsequently, as the banking system evolved, a legal framework was provided by enactment of the Negotiable Instruments Act in 1881 (NI Act), which formalised the usage and characteristics of instruments like the cheque, bill of exchange and promissory note. The NI Act provided and still provides the legal framework for non-cash paper payment instruments in India. 3.1.5 With the advent of computers and expansion of banking services across the country, foundation for a more comprehensive electronic payment system was laid out in the form of Electronic Funds Transfer (EFT). However, there was no statute specifically designed to facilitate and oversee EFTs when it was started. The services were arranged by drawing up contracts between the parties to govern their mutual rights and obligations. There was a need for a separate law dealing comprehensively with payment system which covered certain transactional issues like payment finality, rights and obligations of the parties involved in electronic funds transfer, netting aspects, etc. 3.1.6 Hence, India enacted a separate law for Payment and Settlement Systems which has enabled an orderly development of the payment eco-system in the country. The Payments and Settlement Systems Act, 2007 (PSS Act) for the first-time recognised payments as a function different from a bank's core functions, such as lending and accepting deposits. The Board for Regulation and Supervision of Payment and Settlement Systems (BPSS) is a central authority that has been established by RBI under the provisions of PSS Act, with the ability to regulate and supervise payment and settlement systems. 3.1.7 Key features and provisions of the Payments and Settlement Systems Act, 2007 are as under: -
RBI has the authority to regulate and supervise payment systems in India. It can prescribe standards, guidelines, and procedures for the proper and efficient management of payment systems. -
The PSS Act empowers RBI to issue licenses / authorisations to payment system operators. These operators include entities involved in operating and maintaining various types of payment systems, such as Clearing Corporation of India Ltd. (CCIL) (Financial Market Infrastructure - Central Counterparty), National Payments Corporation of India (NPCI) (retail payments organisation), card payment networks, cross-border in-bound money transfer operators, ATM networks, Prepaid Payment Instrument (PPI) issuers, Instant Money Transfer Operators, Trade Receivables Discounting System (TReDS) platform providers and Bharat Bill Payment Operating Units (BBPOUs), Payment Aggregators, etc. -
RBI is responsible for overseeing and monitoring payment systems to ensure their smooth functioning, safety, security and efficiency. It has the authority to call for any information and documents, as well as inspect the systems and take corrective actions when necessary. -
The PSS Act provides for the finality of settlement in payment systems. Once a settlement is made in accordance with the prescribed procedures, it is considered final and irrevocable. -
The Act also includes provisions related to the protection of consumers using payment systems. It outlines the rights and liabilities of payment system operators. -
The Act specifies offences related to the violation of the provisions contained in the PSS Act, Regulations, Orders and Directions and prescribes penalties for non-compliance. These penalties may include fines and imprisonment. -
The act also provides for creation of a committee of its central board known as the Board for Regulation and Supervision of Payment and Settlement Systems (BPSS), to exercise its powers and perform its functions and discharge its duties under this statute. 3.1.8 In addition to the PSS Act, other regulations and guidelines formulated by the RBI, in terms of provisions of PSS Act, also contribute to the legal framework for payment systems. The RBI periodically issues circulars, notifications, and guidelines by exercising its powers conferred by the Act, to address emerging issues and promote the development of secure and efficient payment systems in the country. 3.2 The Board for Payment and Settlement Systems 3.2.1 The Board for Regulation and Supervision of Payment and Settlement Systems (BPSS), chaired by Governor, is a Committee of the Central Board of RBI and it is the highest policy making body on payment systems in RBI. The BPSS is empowered for formulating policies, setting standards, authorising and determining criteria for membership for regulating and supervising all payment and settlement systems in the country. The Department of Payment and Settlement Systems (DPSS) of RBI serves as the Secretariat to the BPSS and executes its directions. 3.2.2 BPSS started functioning from March 07, 2005 and with the promulgation of the PSS Act and BPSS Regulations, 2008, it has been functioning under the contours of PSS Act. As per regulation 9 of the BPSS Regulations, 2008, BPSS is ordinarily required to meet at least once in three months. BPSS submits a report on activities of the payment systems to the Central Board of RBI on an annual basis. 3.2.3 BPSS consists of the following members, namely, (a) Governor is the Chairperson of BPSS; (b) Deputy Governors, out of whom the Deputy Governor in-charge of the DPSS, is the Vice-Chairperson of BPSS; and (c) Not more than three Directors of the Central Board nominated by the Governor. Two Executive Directors (presently one) nominated by the Chairperson and the Principal Legal Adviser in RBI are permanent invitees to the meetings of BPSS. Further, person/s with experience in the fields of payment and settlement systems may be invited by BPSS to attend its meetings either as permanent or as ad-hoc invitee/s. 3.3 Payment Systems Landscape 3.3.1 The payment system landscape in India consists of diverse options offered by banks and non-banks participants. During the last couple of decades, the payment landscape has witnessed rapid expansion in terms of acceptance infrastructure, availability and most importantly the number of users using digital payment modes. This chapter discusses various such options currently available to consumers.  Real Time Gross Settlement (RTGS) – Introduced in March 2004, it is India’s Large Value Payment System (LVPS), owned and operated by RBI. As the name suggests, transactions are settled in real-time on transaction by transaction and on a gross basis. RTGS also facilitates settlement of Multilateral Net Settlement Batch (MNSB) files for other ancillary payment systems, such as those operated by CCIL and NPCI. Since December 2020, RTGS is available on 24x7x365 basis. India is one of the few countries with such facility. During the calendar year (CY)-2024, there were 29.53 crore transactions worth ₹1938.21 lakh crore through the RTGS ecosystem. National Electronic Fund Transfer (NEFT) – Introduced in the year 2005, it is a retail payment system owned and operated by RBI. It enables the transfer of funds from one financial institution to another on Deferred Net Settlement (DNS) basis i.e., settlement in batches. Since December 2019, it operates on a 24x7x365 basis in 48 half-hour batches. As of December 2024, NEFT had 235 direct members and 1928 sub-members. During CY-2024, there were 926.84 crore transactions worth ₹432.79 lakh crore through the NEFT ecosystem. Cards – Typically, card payments were the most reliable and widely used option for digital payments across various jurisdictions. However, with the introduction of UPI and its phenomenal growth in recent times, card usage has seen a significant shift. While the use of debit cards has declined, credit cards have grown more than 15% on a year-on-year basis in recent years. With effect from January 1, 2019, RBI has mandated the use of only EMV Chip and PIN based debit and credit cards. During CY-2024, there were 447.23 crore and 173.90 crore payment transactions worth of ₹20.37 lakh crore and ₹5.16 lakh crore through credit and debit cards respectively. Cheque Truncation System (CTS) - RBI introduced CTS in 2008 with an aim to substantially improve cheque clearing timeline. CTS enables use of the image of cheque for payment processing thereby eliminating the need for physical movement of cheques, with associated benefits of reduced turnaround time for clearing of cheques, particularly more so in case of outstation cheques. This helped improve cheque collection time from more than a week to just one to two days. Further, CTS 2010 standards for cheque design were introduced to reduce the risks in an image-based clearing system. During CY-2024, there were 62.59 crore cheques worth of ₹71.80 lakh crore processed by CTS. Prepaid Payment Instruments (PPIs) - In 2009, RBI issued guidelines to ensure orderly development of the PPI ecosystem. These are instruments that facilitate purchase of goods and services, financial services, remittance facilities, etc. against the value stored therein and can be issued in the form of smart cards, payment wallets, and in any such form / instrument which can be used to access the PPI and use the amount therein. No PPI shall be issued in the form of paper vouchers. During CY-2024, there were 698.88 crore transactions worth ₹2.23 lakh crore through the PPI ecosystem. Immediate Payment Service (IMPS) - Introduced in 2010, it is an instant payment, electronic funds transfer service that is available on 24x7x365 basis to facilitate inter-bank (account to-account, account-to-wallet and wallet-to-account) fund transfers. It can be accessed on multiple electronically enabled channels such as mobile, internet, ATM and SMS. India was the fourth country after South Korea, UK and South Africa to introduce such a payment system. During CY-2024, there were 593.83 crore transactions worth ₹70.71 lakh crore processed through IMPS. Aadhar enabled Payment System (AePS) – It is a bank-led payment service that was started in 2011 to enhance financial inclusion in the country. It enables bank customers to use their Aadhaar number as identification to access their Aadhaar-enabled bank account and perform basic banking transactions such as balance enquiry, cash deposit, cash withdrawal, and remittances through Business Correspondents (BCs). The biometric based authentication is done by Unique Identification Authority of India (UIDAI) while NPCI does the switching, clearing and settlement of financial transactions. In CY-2024, 2.4 crore transactions were conducted through AePS (Fund Transfer) and BHIM Aadhaar Pay, amounting to a total value of ₹7.1 thousand crore. National Automated Clearing House (NACH) – Launched in 2016, it is a centralised electronic clearing system operated by NPCI. It facilitates automatic clearing of inter-bank, high volume electronic transactions, which are repetitive and periodic in nature. The NACH system was developed to unify and standardise interoperability of all electronic transactions with rules and compliances across all banking and transaction related services. It has two variants – NACH (Credit) and NACH (Debit). It facilitates distribution (one to many) of subsidies, dividends, interest, salary, pension, etc. based on Account No. and Bank Code and also collect (many to one) from consumers for bill payments pertaining to telephone, electricity, water, loans, investments in mutual funds, insurance premium, etc., based on customer mandate. ABPS (Aadhar Bridge Payment System) is an important ancillary payment system built over NACH system. It enables payment based on Aadhar, India’s unique identity number, and is a key system for government benefit transfers. Since August 2021, NACH was made available on all days of the week. In CY-2024, 321.91 crore transactions with a total value of ₹5.14 lakh crore were processed through APBS. Meanwhile, NACH Credit recorded 165.01 crore transactions worth ₹16.33 lakh crore, and NACH Debit saw 190.17 crore transactions amounting to ₹20.69 lakh crore. Unified Payments Interface (UPI), launched in 2016, is a mobile-based, 24x7x365 fast payment system which enables users to send / receive money and make person to person (P2P) or person to merchant (P2M) payments instantly through a Virtual Payment Address (VPA), mobile number or by scanning a Quick Response (QR) code. The unique feature of VPA based transaction is the secure aspect of UPI architecture as it removes the need for sharing account or bank details to the remitter. It can be used over smart phones (app based), feature phones (USSD based - *99# and UPI123Pay) and at merchant location (app based). UPI is now one of the most preferred payment solutions in India, with over 16 billion transactions every month. In CY-2024, UPI recorded 17,220.80 crore transactions with a total value of ₹246.83 lakh crore. Bharat Bill Payment System (BBPS) – launched in August 2016, BBPS offers anytime and anywhere interoperable bill payment service to customers using multiple payment modes as well as through a network of physical agent locations for a variety of services, including electricity, water, gas, telephone, DTH, and insurance, etc. The recent cross-border bill payment facility in BBPS enables Non-Resident Indians to undertake utility, education and other bill payments on behalf of their families in India. In CY-2024, BBPS handled 217.47 crore transactions amounting to a total value of ₹7.68 lakh crore. Trade Receivables Discounting System (TReDS) - TReDS platforms facilitate financing of trade receivables of Micro, Small & Medium Enterprises (MSMEs) from corporate and other buyers, including Government Departments and Public Sector Undertakings (PSUs). It is a platform for uploading, accepting, discounting, trading and settling invoices / bills of MSMEs and facilitating both receivables (factoring) as well as payables factoring (reverse factoring). In CY-2024, TReDS platforms recorded 45.05 lakh invoices uploaded with a total value of ₹1.69 lakh crore. Of these, 42.86 lakh invoices were financed amounting to ₹1.60 lakh crore. National Electronic Toll Collection (NETC) - NETC offers an interoperable nationwide toll payment solution including clearing house services for settlement and dispute management. FASTag is a device that employs Radio Frequency Identification (RFID) technology for making toll payments directly while the vehicle is in motion. It can be affixed on the windscreen of the vehicle and enables a customer to make the toll payments directly from the underlying payment account which is linked to FASTag. Use of FASTag has revolutionized toll payments in India. In CY-2024, NETC processed 405.93 crore transactions, amounting to a total value of ₹69.99 thousand crore.
3.4 Payment System Statistics | Transaction Volume (in Lakh)* | | | 2024 | H1-2024 | H2-2024 | Daily Average | | Total Payments | 2084927.34 | 968808.02 | 1116119.32 | 5696.52 | | Paper-based Instruments | 6259.35 | 3208.90 | 3050.45 | 17.10 | | Digital Payments | 2078667.99 | 965599.12 | 1113068.87 | 5679.42 | | RTGS | 2952.90 | 1464.87 | 1488.03 | 8.07 | | Retail Payments | 2081974.44 | 967343.15 | 1114631.29 | 5688.45 | | Retail Digital Payments | 2075715.09 | 964134.25 | 1111580.84 | 5671.35 | | AePS (Fund Transfers) | 3.76 | 1.92 | 1.84 | 0.01 | | IMPS | 59383.40 | 32488.78 | 26894.62 | 162.25 | | NACH | 67709.35 | 32445.60 | 35263.75 | 185.00 | | NEFT | 92684.34 | 43526.24 | 49158.10 | 253.24 | | UPI | 1722080.18 | 789706.74 | 932373.44 | 4705.14 | | BHIM Aadhaar Pay | 235.96 | 117.83 | 118.13 | 0.64 | | NETC (linked to bank account) | 1617.71 | 791.37 | 826.35 | 4.42 | | Credit Cards | 44723.01 | 20463.70 | 24259.31 | 122.19 | | Debit Cards | 17389.59 | 9208.27 | 8181.32 | 47.51 | | Prepaid Payment Instruments | 69887.79 | 35383.81 | 34503.98 | 190.95 | | Transaction Value (in ₹ crore)* | | | 2024 | H1-2024 | H2-2024 | Daily Average | | Total Payments | 283034223.49 | 136442436.65 | 146591786.83 | 773317.55 | | Paper-based Instruments | 7180913.79 | 3708208.84 | 3472704.95 | 19619.98 | | Digital Payments | 275853309.70 | 132734227.81 | 143119081.88 | 753697.57 | | RTGS | 193821267.31 | 93092224.42 | 100729042.88 | 529566.30 | | Retail Payments | 89212956.18 | 43350212.23 | 45862743.95 | 243751.25 | | Retail Digital Payments | 82032042.39 | 39642003.39 | 42390039.00 | 224131.26 | | AePS (Fund Transfers) | 206.77 | 119.14 | 87.63 | 0.56 | | IMPS | 7070902.52 | 3545347.11 | 3525555.41 | 19319.41 | | NACH | 4215078.14 | 2013610.56 | 2201467.58 | 11516.61 | | NEFT | 43278676.46 | 21079662.55 | 22199013.91 | 118247.75 | | UPI | 24682520.82 | 11663789.32 | 13018731.50 | 67438.58 | | BHIM Aadhaar Pay | 6895.29 | 3228.19 | 3667.10 | 18.84 | | NETC (linked to bank account) | 2425.14 | 1223.04 | 1202.10 | 6.63 | | Credit Cards | 2036614.45 | 960385.12 | 1076229.33 | 5564.52 | | Debit Cards | 515510.52 | 260422.51 | 255088.00 | 1408.50 | | Prepaid Payment Instruments | 223212.28 | 114215.84 | 108996.44 | 609.87 | *Note – 1. Digital retail payments include NEFT, IMPS, NACH (credit, debit and APBS), card payment transactions (excl. cash withdrawal), PPI payment transactions (excl. cash withdrawal), UPI (including BHIM & USSD), BHIM Aadhaar Pay, AePS fund transfer and NETC (linked to bank accounts).
2. Retail payments include Digital retail payments and Paper-based Instruments
3. Digital Payments include retail digital payments and RTGS
4. Total payments include Digital payments and Paper-based Instruments
5. Daily average is the average transaction volume/value of CY-2024 |
| Payment System Infrastructures (in lakh) | | | Jun-24 | Dec-24 | | Credit Cards | 1038.13 | 1080.56 | | Debit Cards | 9624.24 | 9909.48 | | PPI Wallets | 11375.61 | 8904.25 | | PPI Cards | 3675.69 | 4381.40 | | Bank owned ATMs and CRMs | 2.21 | 2.19 | | White Label ATMs | 0.35 | 0.36 | | Micro ATMs | 15.18 | 14.67 | | PoS Terminals | 89.67 | 100.01 | | Bharat QR | 61.64 | 63.83 | | UPI QR | 5769.48 | 6334.39 | 4. Major Regulatory Developments in Payment Systems in India 4.1 Regulation of Intermediaries in Payment Ecosystem 4.1.1 With the rapid expansion of digital payments in India, a variety of non-bank intermediaries have emerged. These entities facilitate payment collection from the customers for merchants across face-to-face transactions, e-commerce, and export/import scenarios. Recognizing the critical role these intermediaries play in facilitating customers’ payments to merchants and handling funds to be paid to merchants, regulatory oversight has been implemented for the various modes. 4.1.2 Payment Aggregators (PAs) were brought under regulatory domain of RBI in March 2020 and designated as Payment System Operators (PSOs). These regulations were, however, applicable to PAs processing online or e-commerce transactions. These regulations do not cover offline PAs who handle proximity/face-to-face transactions and play a significant role in the spread of digital payments. Keeping in view the similar nature of activities undertaken by online and offline PAs (who handle proximity/face-to-face transactions), it was announced in the RBI’s Bi-Monthly Monetary Policy Statement of September 2022 to apply the current regulations to offline PAs as well. This measure is expected to bring in synergy in regulation covering activities and operations of PAs apart from convergence on standards of data collection and storage. 4.1.3 Further, keeping in view the developments that have taken place in the area of cross-border payments, all entities facilitating cross-border payment transactions for import and export of goods and services were also brought under direct regulation of the RBI with effect from October 31, 2023. Such entities shall be treated as Payment Aggregator-Cross Border (PA-CB). 4.1.4 The regulations primarily mandate that non-bank intermediaries that handle customers’ funds to be directed to merchants, obtain authorisation as a Payment Aggregator from the Reserve Bank of India (RBI). In addition, as part of sound regulatory practice, they establish baseline technology recommendations, corporate governance standards, customer grievance redressal mechanisms, and risk management practices. To ensure proper management of funds by these entities on behalf of their merchants, the regulations stipulate the use of specially designated accounts. 4.2 Card-on-File Tokenisation (CoFT) 4.2.1 Tokenisation is the process of substituting actual card details with an alternative code known as a ‘token’. This token serves as a unique identifier for a customer’s card, enabling successful transactions. It is distinct for each device (device tokenisation) or merchant (card-on-file tokenisation), ensuring that merchants do not store customers’ actual card data. Additionally, this process safeguards customers’ card details in the event of a security breach. 4.2.2 The Reserve Bank of India (RBI) permitted device tokenisation in January 2019 and card-on-file tokenisation (CoFT) in September 2021. Since then, tokenisation has witnessed exponential growth, with over 91 crore tokens issued up to December 2024. These tokens have facilitated over 320 crore transactions, amounting to nearly ₹11 lakh crore. The adoption of tokens for e-commerce transactions has eliminated the need for merchants and Payment Aggregators to store actual card data. As a result, nearly 98% of e-commerce transactions are now processed without using the actual card data. 4.2.3 Building on the success of tokenisation, several enhancements have been introduced to further improve customer convenience. These enhancements allow customers to tokenize their cards across multiple prominent merchants simultaneously, with their consent. 4.3 Arrangements with Card Networks for issue of Credit Cards 4.3.1 The authorised card networks tie-up with banks / non-banks for issuance of credit cards. The choice of network for a card issued to a customer is decided by the card issuer (bank / non-bank) and is linked to the arrangements that the card issuers have with card networks in terms of their bilateral agreements. It was, however, observed that the existing agreements between card networks and their issuers did not support customer choice. These agreements often favoured card networks that offered the most financial incentives to the card issuer, without allowing customers to choose their preferred network. 4.3.2 Consequently, the RBI released a draft circular on July 5, 2023 on Arrangements with Card Networks for issue of Debit, Credit, and Prepaid Cards on RBI website requiring card issuers, both banks and non-banks, to offer cards on multiple networks. This initiative also included provisions for customers to select their preferred card network. Additionally, the draft circular prohibited card issuers from entering into exclusive agreements that would restrict their ability to partner with various card networks. 4.3.3 Basis the existing arrangements and the feedback received, the final circular was issued on March 6, 2024 and made applicable only for credit card issuance; credit card issuers were not to enter into arrangement or agreement with card networks that restrain them from availing the service of other card networks. Further, card issuers with more than 10 lakh active credit card issuance shall provide their eligible customers with an option to choose from multiple card networks. 4.4 Expanding the Scope of Trade Receivables Discounting System (TReDS) 4.4.1 The Trade Receivables Discounting System (TReDS) was launched by the Reserve Bank of India (RBI) in 2014 after comprehensive consultations with stakeholders and the public. The system’s objective was to streamline the financing of trade receivables for MSMEs from corporates, government departments, and Public Sector Undertakings (PSUs) via a network of financiers. The goal was to increase the volume of transactions for discounting invoices and bills of exchange on the platform, thereby ensuring competitive pricing and prompt payments. 4.4.2 As TReDS has evolved into a significant discounting provider, with monthly bills discounted reaching ₹17,000 crore, regulatory reviews have led to several enhancements. Based on the experience gained, certain enhancements were made in June, 2023. These improvements are designed to boost the liquidity in the financier market by expanding the pool of financier participants, permitting financiers to insure their exposures to encourage bidding by them for payables of low rated buyers, fostering secondary markets for transfer of Factoring Units, displaying bids to other bidders to promote transparent and competitive bidding, and facilitating the settlement of bills not discounted through the TReDS platform. 4.5 Expanding the scope and reach of e-RUPI vouchers 4.5.1 e-RUPI, a digital voucher launched in August 2021, rides on the Unified Payments Interface (UPI) system of National Payments Corporation of India (NPCI). It is a person-specific and purpose-specific digital voucher issued by banks on behalf of Central and State Governments and to a limited extent on behalf of corporates. The vouchers were earlier permitted to be issued by banks for Government use cases (limit of ₹1 lakh) and to a limited extent for corporates (limit of ₹10,000/-). Keeping in view the benefits for users and beneficiaries alike, the scope and reach of e-RUPI vouchers was expanded in September 2023 by (a) enhancing the limit for vouchers issued for corporate use cases from ₹10,000 to ₹50,000/- and (b) Enabling issuance of e-RUPI vouchers for individual use cases with a purpose-specific limit of ₹10,000/- and is non-reloadable; (c) Reloading of e-RUPI vouchers for Corporate use-cases is permitted, on par with Government use-cases. 4.6 Payments Infrastructure Development Fund (PIDF) – Extension of Scheme and Inclusion of PM Vishwakarma Scheme beneficiaries 4.6.1 The Payments Infrastructure Development Fund (PIDF) was launched on January 1, 2021 as a time-bound initiative of three-year period aimed at enhancing the payment acceptance infrastructure by incentivising their deployment in tier-3 to tier-6 centres with a focus on the north-eastern states. The Reserve Bank of India (RBI) contributed an initial ₹250 crore, accounting for half of the fund, while the remainder was sourced from card-issuing banks and card networks within the country. The scope of PIDF was subsequently expanded to the beneficiaries of street vendors under the PM SVAnidhi Scheme and Union Territories of Jammu & Kashmir and Ladakh. 4.6.2 By November 2024, the PIDF had subsidized the deployment of 51.56 lakh physical devices, such as Point of Sale (POS) machines, soundbox devices, etc. and 3.51 crore digital devices, including QR codes. Drawing on the scheme’s successful implementation, the RBI decided to extend it for an additional two years, until December 31, 2025. Moreover, merchants identified under the PM Vishwakarma Scheme were also included as beneficiaries for deployment under the PIDF. 4.6.3 In response to technological advancements in payment acceptance infrastructure, the scheme was further enhanced to include contemporary devices like soundbox devices and Aadhaar-enabled biometric devices as eligible for subsidy. For devices deployed in special focus areas—namely, the North Eastern States, and the Union Territories of Jammu & Kashmir (now State) and Ladakh—the subsidy rate was increased from 75% to 90% of the total cost, regardless of the device type. These strategic measures are anticipated to significantly boost the deployment of payment acceptance infrastructure in the designated regions. 4.7 Enablement of offline digital payments and enhancement of per transaction limit 4.7.1 Traditionally, digital payments require either telecom or internet connectivity to successfully execute transactions. To increase use of digital payment irrespective of the availability of internet or telecom connectivity, RBI had introduced the framework for facilitating small value digital payments in offline mode in January 2022. 4.7.2 The framework facilitated growth of offline transit payment and led to the introduction of payment products like the UPI Lite X. UPI Lite X would not only enable retail digital payments in situations where internet / telecom connectivity is weak or not available, it will also ensure speed with minimal transaction declines. While the overall limit for an offline digital wallet has been increased from ₹2,000 to ₹5000, the upper limit of an offline payment transaction was enhanced from ₹200 to ₹500 and further to ₹1000. This is expected to provide further traction to small value digital payments in offline mode including transit and UPI Lite X payments. 4.7.3 The UPI Lite was launched by NPCI in February 2022 with the primary objective to process the low value transactions in UPI by reducing the load on banks’ CBS. Considering that most of the UPI LITE accounts remained inactive due to insufficient balance, automatic top up on UPI Lite wallet was permitted in August 2024. 4.8 Operationalisation of pre-sanctioned credit lines on UPI 4.8.1 UPI transactions are permitted between deposit accounts at banks, sometimes intermediated by pre-paid instruments including wallets. The scope of UPI was expanded by permitting linkage of RuPay credit card to UPI for making payments. Subsequently, it has been expanded by permitting transfer to / from pre-sanctioned credit lines issued by scheduled commercial banks, in addition to deposit accounts. In other words, UPI network will facilitate payments financed by credit from banks. This can reduce the cost of such offerings and help in development of unique products for Indian markets. 4.8.2 Considering the fact that Small Finance Banks (SFBs) leverage a high-tech, low-cost model to reach the last mile customer and can play an enabling role in expanding the reach of credit on UPI, it was announced in the Statement on Development and Regulatory policies dated December 06, 2024, to permit SFBs also to extend pre-sanctioned credit lines through the UPI. 4.9 Processing of e-Mandates for recurring transactions - Enhancement of limit for specified categories 4.9.1 The framework for processing of e-mandates for recurring transactions was introduced in August 2019 to balance the safety and security of digital transactions with customer convenience. The limit for execution of e-mandates without Additional Factor of Authentication (AFA) was earlier kept uniform for all categories at ₹15,000/-. The system has stabilised, but in categories such as subscription to mutual funds, payment of insurance premium and credit card bill payments, where the transaction sizes are more than ₹15,000, a need to enhance the limit was expressed as adoption had been lagging. It was, therefore, decided to exempt the requirement of AFA for transactions up to ₹1 lakh for the following categories, viz., subscription to mutual funds, payment of insurance premium and payments of credit card bills. The other existing requirements such as pre and post-transaction notifications, opt-out facility for user, etc. shall continue to apply to these transactions. 4.10 Enhancing UPI transaction limit for Specified Categories 4.10.1 The transaction limit for UPI was capped at ₹1 lakh, except a few categories like Capital Markets (AMC, Broking, Mutual Funds, etc.), Collections (Credit card payments, Loan re-payments, EMI), Insurance, etc. where the transaction limit is ₹2 lakh. In December 2021, the transaction limit for UPI payments for Retail Direct Scheme and for IPO subscriptions was increased to ₹5 lakh. To encourage the use of UPI for medical and educational services, the limit for payments to these categories has now been enhanced from ₹1 lakh to ₹5 lakh per transaction. 5. In Focus – UPI and its enhancements 5.1 Unified Payments Interface (UPI) has propelled India to the forefront in provision of digital payment solution as ‘public good’. This public good approach has the potential to be adopted by other economies, whatever stage of development they are at. UPI and its features bears lessons on democratisation of the payment system to the smallest value and penetration of digital payments to previously unreached segments. 5.2 Implemented by the National Payments Corporation of India (NPCI) in April 2016, the Unified Payments Interface (UPI) has brought forth a new paradigm in India’s payment landscape. By seamlessly amalgamating multiple bank accounts into a unified mobile interface, UPI empowers users with real-time, user-centric transaction capabilities. The unique feature of Virtual Payment Address (VPA) based transaction obviates the need for sharing account or bank details for initiating the transaction. This innovation has not only exponentially accelerated digital payment adoption across the nation but has also become India’s payment method of choice, boasting a staggering volume of over sixteen billion transactions per month. In essence, UPI serves as a robust conduit for both person-to-person and person-to-merchant transactions, allowing for not just instantaneous money transfers but also scheduled payments, all from a single platform. The growth of UPI payments 5.3 UPI has been the most significant contributor to the growth of digital payments in India. Its contribution to digital payments volume surged from 34% in CY-2019 to an impressive 83% in CY-2024, with a remarkable CAGR of 74% over five years. In contrast, share of other payment systems like RTGS, NEFT, IMPS, credit cards, debit cards, etc. in digital payments volume declined from 66% to 17% during the same period. The growth in the share of UPI transactions is depicted in Chart 1 below. 5.4 At a macro level, the volume of UPI transactions increased from 375 crore in CY-2018 to 17,221 crore in CY-2024, whereas the total value of transactions surged from ₹5.86 lakh crore in CY-2018 to ₹246.83 lakh crore in CY-2024. This amounts to five year compounded annual growth rate (CAGR) of 89.3 per cent and 86.5 per cent in terms of volume and value, respectively. 5.5 The adoption of UPI, and its subsequent growth, can be put into perspective with the help of Technology Acceptance Model (TAM), which hypothesizes ‘perceived usefulness’ and ‘perceived ease of use’ to be the fundamental determinants of user acceptance1. In other words, when the technology is beneficial and user-friendly, it surpasses adoption barriers, leading to its widespread adoption. That a fast payment system like UPI with features like instant transfer of funds (24/7), use of two factor of authentication, use of virtual payment address / mobile number / Quick Response (QR) codes, facilitation of P2P2 and P2M3 transactions, etc. will be immensely useful to the users was an easy conviction, but subsequent enhancements (discussed later in the chapter) have further added to the usefulness and ease of use, which has resulted in UPI becoming single largest retail payment system in terms of volume of transactions in the country. Comparative Analysis of P2P and P2M Transactions 5.6 Both P2P and P2M transactions leverage UPI's secure and real-time payment capabilities, making it easier for individuals and businesses to execute financial transactions without relying on traditional, time-consuming methods. The growth trajectories of UPI P2P and P2M transactions have a lot of similarities as well as differentiating factors, as can be seen from Chart 2. 5.7 It can be inferred from Chart 2 that while during 2022, the UPI P2M transaction volume has surpassed the UPI P2P transaction volumes since 2023, however, in value terms, the UPI P2P transaction value is still higher than UPI P2M transaction values. Further analysis on UPI P2P and P2M transactions is presented in next sections. 5.8 Further, the distribution of UPI transactions for P2P and P2M value bucket-wise, shows that the P2M transactions grew at the faster rate than P2P in terms of volume and there is variation in the growth across various bucket size (Table 1). | Table 1 – CAGR of UPI transactions for P2P and P2M transactions bucket-wise | CAGR
(CY-2019 to CY-2024) | UPI P2P
(below ₹500) | UPI P2P
(₹500 to ₹2000) | UPI P2P
(above ₹2000) | UPI P2M
(below ₹500) | UPI P2M
(₹500 to ₹2000) | UPI P2M
(above ₹2000) | | Volume | 56% | 49% | 57% | 99% | 101% | 109% | | Value | 56% | 44% | 63% | 92% | 102% | 123% | 5.9 An analysis of Person-to-Person (P2P) and Person-to-Merchant (P2M) transaction data across various value buckets size viz. low (below ₹500), medium (₹500 to ₹2000), and high (above ₹2000) has been carried out. The daily dataset spans last five years, providing a robust foundation for trend analysis (Chart 3). Low-Value Transactions 5.10 In the low-value transaction bucket (transaction value below ₹500), both P2P and P2M transactions have experienced substantial growth. P2P transactions, in terms of volume, increased from 394.26 crore in CY-2019 to 3649.91 crore in CY-2024, with a five-year CAGR of 56%. However, P2P transactions showed stagnation after June 2022. In contrast, P2M payment transactions exhibited remarkable growth, rising from 291.54 crore in CY-2019 to 9112.72 crore in CY-2024, with a higher five-year CAGR of 99%, indicating broader acceptance of UPI for small retail transactions and bill payments. Medium-Value Transactions 5.11 For medium-value transaction bucket (per transaction value of ₹500 and above and less than ₹2000), the growth story is somewhat similar in both P2P and P2M but P2M transactions have a wider gap in their increase. P2P payment transactions rose from 195.70 crore in CY-2019 to 1420.57 crore in CY-2024, while P2M payment transactions experienced faster growth, increasing from 33.68 crore in CY-2019 to 1106.24 crore in CY-2024. This indicates a growing comfort among consumers in utilizing UPI for medium-sized transactions, especially in retail settings. High-Value Transactions 5.12 In high-value transactions bucket (per transaction value of ₹2000 and above), there is a notable difference in growth rates between P2P and P2M transactions. P2P payment transactions grew from 151.75 crore in CY-2019 to 1452.81 crore in CY-2024, marking a 5-year CAGR of 57 per cent. In contrast, P2M payment volume increased from 12.02 crore transactions in CY-2019 to 478.55 crore in CY-2024, with a 5-year CAGR of 109 per cent. This surge suggests increased consumer trust in UPI, making it more common for high-value purchases and potentially even B2B transactions. 5.13 Thus, it can be inferred that UPI transactions are increasingly leaning towards P2P payments in terms of volume. This shift may indicate businesses finding digital platforms, especially UPI, more efficient and traceable, appealing for high volume transactions. Similarly, high-value transactions also show a strong consumer preference for P2M payments, boasting a five-year CAGR of 99.65%. The rise in UPI QR Code and Bharat QR code, with a CAGR of 70% and 19% respectively during the last four-year period, contributes to these trends in deployment of payment acceptance infrastructure.
Enhancements to UPI: 5.14 UPI’s functionality and user convenience has been continuously improving over the years, e.g. with the start of ‘UPI 2.0 program’ in 2018, and the process continues to the present day. Reserve Bank of India is continually evolving its role in the payments ecosystem, and now is also increasingly acting as a catalyst for innovation, as can be seen from numerous enhancements enabled in UPI for facilitating user access and convenience, without compromising on safety and security. While promoting innovation, focus is also on ensuring a well-regulated ecosystem that addresses risks and challenges, while simultaneously ensuring that benefits of advancements in the payments ecosystem reach a wider segment of the population. The enhancements introduced since the launch of UPI in 2016 are discussed below chronologically: 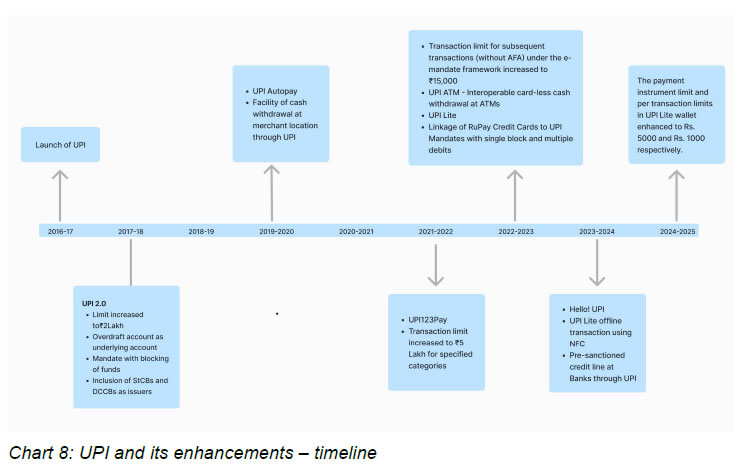 5.14.1 In 2018, enhancements were introduced to give an impetus to digital payments. These included increasing the per transaction limit to ₹2.0 lakh, allowing mandates with fund blocking, accepting overdraft accounts as funding account, processing domestic leg of foreign inward remittance, and incorporating State Cooperative Banks (StCBs) and District Central Cooperative Banks (DCCBs) as issuers through sub-membership. [2017-18]. 5.14.2 In August 2019, a framework was established to enable e-mandates on cards and Prepaid Payment Instruments (PPIs) for digitizing recurring payments. This framework, which includes safety measures like Additional Factor of Authentication during e-mandate registration, modification and revocation as well as first transaction and simple / automatic subsequent successive transaction, was later extended to cover UPI-based transactions in January 2020 (UPI Autopay). Similarly, the facility of cash withdrawal at merchant locations was also extended to UPI. [2019-20] 5.14.3 UPI for Feature Phones – UPI123Pay: It was introduced to onboard over 40 crore feature phone users to digital payments by availing UPI features. It provides options like IVR, missed call, app-based functionality, and proximity sound-based payments to facilitate seamless digital transactions. [2021-22] 5.14.4 Increase in UPI Transaction Limit for Specified Categories: The UPI transaction limit was raised from ₹2 lakh to ₹5 lakh to promote increased participation of retail customers in financial markets, including investments in G-secs through the Retail Direct Scheme and payments for Initial Public Offerings (IPOs) [2021-22] 5.14.5 Processing of e-Mandates for Recurring Transactions: The per transaction limit for subsequent transactions (without Additional Factor of Authentication) undertaken under the e-mandate framework for processing of recurring transactions done using cards, PPIs and UPI was enhanced from ₹5,000/- to ₹15,000/- per transaction. [2022-23] 5.14.6 Interoperable Card-less Cash Withdrawal (ICCW) at ATMs – UPI ATM-ICCW enables bank’s customers to withdraw funds from any enabled ATM without a card. Under this facility, UPI is used for customer authentication during ICCW transactions at ATM with the settlement facilitated through the National Financial Switch (NFS) / ATM networks. [2022-23] 5.14.7 UPI Lite ‘On-device Wallet’: Small value transactions in UPI through an on-device wallet in UPI App were permitted to facilitate safe and secure payments, wherein users can transfer a maximum of ₹2,000 to UPI Lite, with the wallet subsequently debited for transaction of up to ₹200, provided sufficient balance is available. UPI Lite provides superior user experience using near real-time small value payments without the necessity of entering UPI PIN. Since small value payments are made from the wallet that is in the device of the user, and not from the bank account, the number of transactions that reach the bank account reduce, thus reducing the load on banks’ CBS. The upper limit for offline payment transaction was later enhanced to ₹500 in August 2023. [2022-23] 5.14.8 Linking of Rupay Credit Cards to UPI: RuPay credit cards were allowed to be linked to UPI, expanding the range of financial products for payment processing and providing additional convenience for customers on the UPI platform. [2022-23] 5.14.9 Processing Mandates with Single-Block-and-Multiple-Debits: The UPI introduced a single-block-and-multiple-debits feature, allowing customers to create payment mandates by blocking funds for specific purposes. This builds trust in transactions, ensuring timely payments for merchants while securing funds in customer’s account until the actual delivery of goods or services. [2022-23] 5.14.10 Hello! UPI: An innovative payment mode viz. ‘Conversational Payments’ was enabled on UPI, which enables users to engage in a conversation with an AI-powered system to initiate and complete transactions in a safe and secure environment. This channel is made available in both smartphones and feature phones-based UPI channels, thereby helping in the deepening of digital penetration in the country. [2023-24] 5.14.11 UPI Lite X: To promote the use of UPI-Lite, offline transaction using Near Field Communication (NFC) technology, called UPI Lite X, was also enabled. This feature not only allows retail digital payments in situations where internet / telecom connectivity is weak or not available, but also ensures faster transactions, with minimal declines. [2023-24] 5.14.12 The scope of UPI was expanded by enabling transfer to / from pre-sanctioned credit lines at banks (subsequently extended to Small Finance banks), in addition to deposit accounts. In other words, UPI network will facilitate payments financed by credit from banks. This can reduce the cost of such offerings and help in development of unique products for Indian markets. [2023-24] 5.14.13 Enhancement in limits for UPI Lite: Given the increasing levels of average ticket size for P2P and P2M transactions and also to support banks’ CBS load management, the UPI Lite wallet’s overall limit and per transaction limit were enhanced to ₹5,000 and ₹1,000 respectively. [2024-25] Growth of UPI Lite 5.15 As can be seen from Chart 7, when Paytm and PhonePe introduced UPI Lite on February 15, 2023 and May 02, 2023, respectively, a sustained increase in the UPI Lite payments volume and value was observed. In the month of December 2024, on an average there were 20.41 lakh UPI Lite transactions performed per day amounting to an average value of ₹20.02 crore per day. The ticket size in December 2024 for such transactions is typically very small, i.e., approximately ₹98 on average for each transaction. Comparing this ticket size with a year before, it can be observed that it has increased from ₹87 in December 2023, i.e., there has been an y-o-y increase of 13% in ticket size. Trends in UPI P2M transactions – Merchant category wise 5.16 The UPI P2M transactions can be categorized into different Merchant categories. Next, the trends in the transaction volume and value in these merchant categories were analysed. The categories were formed by clubbing the data of several merchant category codes into relevant broader groups. For better smoothing, the six-month moving average data has been taken. 5.17 As can be seen in the chart above for share of UPI P2M volume, ‘Food and Beverages’ accounted for the highest per cent share in UPI P2M transactions followed by ‘Retail and Shopping’ and then ‘Utilities and Services’. Further, while the share of ‘Food and Beverages’ increased from 21.8% to 49.1% in total UPI P2M transactions between June 2021 and December 2024, the share of ‘Retail and Shopping’ has declined from 39.5% to 22.3%. On the other hand, the share of ‘Utilities and Services’ has declined from 18.3% to 10.4% during the same period.  5.18 Moreover, an analysis of the share of UPI P2M value data suggests that ‘Retail and Shopping’ accounted for the highest per cent share in UPI P2M transactions followed by ‘Financial Services’, ‘Food and Beverages’ and ‘Utilities and Services’. Further, while the share of ‘Financial Services’ has decreased from 28.8% to 26.0% in total UPI P2M transactions between June 2021 and December 2024, the share of ‘Food and Beverages’ has remained stagnant from 14.9% to 15.7% and the share of ‘Utilities and Services’ has declined from 18.1% to 14.8% during the same period. However, the share of ‘Retail and Shopping’ has increased from 24.8% to 28.0% during the same period. UPI one-time mandate functionality for subscribing to an IPO 5.19 One Time Mandate functionality for payments towards an IPO was started in 2019. Utilizing UPI for initial public issue applications represents an advancement towards modernizing traditionally offline procedures by transitioning them to an online format. To participate, an investor must establish a UPI ID and associated PIN via any UPI-compatible mobile app offered by Self Certified Syndicate Banks (SCSBs). This UPI ID serves the dual purpose of securing fund blockage in the bank account and facilitating payment during the public issue stages. Upon receiving a request to block the bid amount, the investor can authorize the action by inputting their UPI PIN in the mobile application. If the investor is successfully allotted shares, the blocked funds are automatically transferred to the Escrow Bank. On the other hand, in instances of non-allotment, these funds will be unblocked by the SCSBs. The incorporation of UPI in the public issue framework substantially enhances user convenience, streamlines the process, and shortens the time required for public issues to be listed. In all, there are 30 UPI apps live on IPO, seven sponsor banks and 51 customer banks that are eligible to act as issuer banks on the platform.  5.20 The IPO payment through UPI received massive response from the investors. As can be visualised from the above graph, the peak of value of transactions for IPOs executed through UPI coincides with the peak of total issue size of IPOs for a particular month. 5.21 The introduction of above mentioned enhancements on an ongoing basis have enriched product offering, facilitated user access catering to diverse payment needs of the economy and have helped in expansion of usage and user base of UPI. As a result, UPI is enjoying global attention, from both developed economies as well as emerging economies, and many countries are taking a closer look at UPI with a view to implementing similar solutions in their respective countries. 6. Analysis of Payment Systems Data Total Payment Transactions 6.1 The total payment system has witnessed remarkable growth over the last five years. The volume of transactions increased significantly from 3,248 crore in CY-2019 to 20,849 crore in CY-2024, registering a robust compound annual growth rate (CAGR) of 45.0%. Meanwhile, the value of payments grew from ₹1,775 lakh crore in CY-2019 to ₹2,830 lakh crore in CY-2024, with a CAGR of 9.8%. Total Digital Payment Transactions 6.2 Digital payment transactions have experienced exponential growth over the last five years. The transaction volume surged from 3,140 crore in CY-2019 to 20,787 crore in CY-2024, achieving an impressive compound annual growth rate (CAGR) of 45.9%. The value of digital payments also increased significantly, rising from ₹1,695 lakh crore in CY-2019 to ₹2,759 lakh crore in CY-2024, reflecting a CAGR of 10.2%. This growth highlights the rapid digital transformation in India's payment ecosystem, driven by increased adoption of digital payment modes. Large Value Payment Systems - CCIL and RTGS Trends in growth of CCIL transactions over the years 6.3 Between 2020 and 2024, the Indian financial markets witnessed significant trends in government securities, forex clearing, and rupee derivatives, each reflecting the undercurrents of economic forces and central bank interventions. The steady ascent of G-Sec Value from ₹1014.12 lakh crore in 2020 to ₹1811.88 lakh crore in 2024 underscores a resilient demand for government debt, bolstered by the RBI's liquidity provisions through open market operations amid the economic tumult wrought by the pandemic. Additionally, the growing G-Sec value through these years could signal investors' confidence in the government's fiscal stewardship and the RBI's commitment to maintaining orderly market conditions. 6.4 Concurrently, the Forex Clearing Value swelled from ₹465.92 lakh crore in 2020 to ₹885.31 lakh crore in 2024. 6.5 This trend reflects the expanding volume of international trade as India's economy integrates further into the global marketplace, necessitating more robust forex clearing mechanisms. On another front, the Rupee Derivatives Value soared from ₹24.17 lakh crore in 2020 to ₹83.35 lakh crore in 2024. Real Time Gross Settlement (RTGS) Trends in growth of RTGS transactions over the years 6.6 RTGS system is primarily meant for large value transactions, with a minimum amount of ₹2 lakh. The RTGS system has shown significant growth in the last five years. The volume of RTGS transactions doubled from 14.82 crore in CY-2019 to 29.53 crore in CY-2024, with a compound annual growth rate (CAGR) of 14.78 per cent. The value of RTGS transactions, on the other hand, increased by 39.6% from ₹1388.67 lakh crore in CY-2019 to ₹1938.21 lakh crore in CY-2024, with a CAGR of 6.90 per cent. Retail Payment Systems (all other domestic payment systems) National Electronic Funds Transfer (NEFT) System Trends in growth of NEFT transactions over the years 6.7 The NEFT system, another payment system owned and operated by the Reserve Bank of India (RBI), serves as a robust framework for one-to-one electronic fund transfers between bank accounts maintained with NEFT-enabled bank branches in India. Working on a deferred net settlement basis, the system processes transactions in batches at specified intervals (every half-an-hour) on a 24x7x365 basis. Over the past five years, NEFT has witnessed remarkable growth, becoming an indispensable tool for low-value and medium-value transactions. From 2019 to 2024, NEFT transaction volume witnessed an impressive rise, growing more than three times from 262.2 crore to 926.8 crore and achieving a CAGR of 28.73 per cent. The transaction value experienced a substantial growth of nearly 1.9 times from ₹232.97 lakh crore to ₹432.79 lakh crore registering a CAGR of 13.19 per cent. NPCI Operated Fast Payment Systems Unified Payment Interface (UPI) 6.8 Over the past five years, India's Unified Payments Interface (UPI) has experienced a meteoric rise, fundamentally reshaping the landscape of digital transactions in the country. Developed by the National Payments Corporation of India (NPCI) and overseen by the Reserve Bank of India (RBI), UPI is an instant payment system that facilitates both inter-bank peer-to-peer (P2P) and person-to-merchant (P2M) transactions. Utilizing an open-source application programming interface (API), UPI has proven to be a game-changer in the digital payments arena. The volume of UPI transactions surged from 1078.75 crore in the CY-2019 to a staggering 17220.80 crore in CY-2024, reflecting a compound annual growth rate (CAGR) of 74.03 per cent. The value of these transactions skyrocketed from ₹18.37 lakh crore to ₹246.83 lakh crore during the same period, boasting a CAGR of 68.14 per cent. Immediate Payment Services (IMPS) 6.9 Since its inception in 2010 by the National Payments Corporation of India (NPCI), the Immediate Payments Service (IMPS) has evolved into a vital component of India's digital payments ecosystem. Operating on a real-time inter-bank payment framework that is accessible around the clock, IMPS supports a myriad of transaction channels including mobile devices, internet, ATMs, and even bank branches. Over the last five years, IMPS has recorded staggering growth, both in transaction volume and value, indicating a strong adoption curve. The number of transactions conducted through IMPS swelled from 238.31 crore in CY-2019 to 593.83 crore in CY-2024. During the same period, the value of transactions multiplied from ₹21.82 lakh crore to ₹70.71 lakh crore. These Charts equate to a CAGR of 20.03 per cent and 26.51 per cent for volume and value, respectively. AePS – Fund Transfer and BHIM Aadhaar Pay 6.10 Launched in 2010 by the NPCI, the Aadhaar Enabled Payment System (AePS) is designed to broaden financial inclusion and facilitate interoperability throughout the country. It offers two key services—AePS for fund transfers and cash withdrawals, and BHIM Aadhar Pay—that empower customers to conduct transactions using Aadhaar-linked bank accounts at merchant locations. These transactions are authenticated using Aadhaar number and biometric verification, thus providing a secure and accessible platform for financial interactions.  6.11 These platforms have seen exponential growth over the past five years, a testament to their increasing importance in the financial landscape. The volume of transactions carried out through AePS (Fund Transfers) and BHIM Aadhar Pay skyrocketed from 92.61 lakh in CY-2019 to 239.72 lakh in CY-2024. Similarly, the value of these transactions surged from ₹1610.55 crore to ₹7102.06 crore over the same period. These Charts equate to a CAGR of 21 per cent in terms of volume and 35 per cent in terms of value. Moreover, cash withdrawal through AePS has also surged from 39 crore cash withdrawals amounting to ₹1.06 lakh crore in CY-2019 to 114 crore amounting to ₹2.91 lakh crore in CY-2024. This equated to five year CAGR of 24% in volume and 23% in value for cash withdrawals through AePS. National Automated Clearing House (NACH) – Credit and Debit 6.12 Over the past five years, NACH Credit (which includes Aadhaar Payments Bridge System (APBS)), a system designed for bulk and repetitive payments like distribution of salaries, pensions, subsidies, dividends, etc. has exhibited remarkable growth. Data reveals that the volume of transactions conducted through NACH Credit expanded at a compound annual growth rate (CAGR) of 12.81 per cent, rising from 266.49 crore in CY-2019 to 486.92 crore in CY-2024. The value of these transactions surged at an even faster CAGR of 15.29 per cent, going from ₹10.54 lakh crore to ₹21.46 lakh crore during the same period. 6.13 NACH Debit, a system engineered to facilitate recurring payments like loan repayments, insurance premiums, mutual fund investments, and utility bills, has undergone significant expansion over the past five years. Data indicates that the volume of NACH Debit transactions grew at a CAGR of 26.71 per cent, escalating from 58.23 crore in CY-2019 to 190.17 crore in CY-2024. Simultaneously, the value of these transactions increased at a CAGR of 27.97 per cent, rising from ₹6.03 lakh crore to ₹20.69 lakh crore within the same period. National Electronic Toll Collection (NETC) 6.14 National Electronic Toll Collection (NETC), an initiative by the National Payments Corporation of India (NPCI), was conceived with the intent of instituting a unified, secure, and convenient toll payment mechanism across the nation. Utilizing Radio-Frequency Identification (RFID) technology, NETC enables the deployment of FASTag, a specialized adhesive label that can be affixed to a vehicle's windshield. Upon approaching toll plazas, vehicles equipped with FASTag experience an expedited passage as the toll fees are automatically debited from the payment instrument linked to FASTags, thus eliminating the need for manual cash transactions. 6.15 The NETC system in India has seen a transformative period of growth from December 2019 to December 2024. This growth is manifested across various operational metrics: the number of toll plazas, transaction volumes and value, and the number of outstanding FASTags. However, it's notable that the average value per transaction (AVPT) has decreased during this period. The pandemic's short-term effects included a dip in transaction volumes and values temporarily owing to travel restrictions. However, its long-term impact has accelerated the transition towards digital, contactless payments. Policy measures, such as facilitating multiple payment systems and waiving off additional authentication requirements, have further bolstered NETC's growth. NETC Infrastructure 6.16 The infrastructure of NETC has expanded significantly over the last five years, particularly in terms of the number of toll plazas, which increased from 638 to 1669 from December 2019 to December 2024. This expansion, which corresponds to a CAGR of 21.21 per cent, has substantially increased the system's reach and convenience for motorists. Complementing this, is the surge in the number of outstanding FASTags, which rose steeply from around 1.17 crore in December 2019 to an astonishing 10.32 crore in December 2024, representing a CAGR of 54.64 per cent. Bharat Bill Payment System (BBPS) 6.17 Launched in 2014 by the National Payments Corporation of India (NPCI), the Bharat Bill Payment System (BBPS) has become an indispensable, interoperable platform for recurring bill payments across a wide range of categories, including electricity, gas, telecom, water, education, and more. The platform is engineered to offer a uniform bill payment experience, featuring a centralized customer grievance redressal mechanism and a variety of digital payment options accessible at any time and from anywhere. Over the last five years, BBPS has experienced astounding growth. 6.18 The volume of transactions has soared from 12.56 crore in CY-2019 to 217.47 crore in CY-2024. In a similar vein, the value of these transactions has also magnified 41 times, from ₹0.19 lakh crore to ₹7.68 lakh crore, corresponding to a compound annual growth rate (CAGR) of 76.89 per cent and 110.22 per cent for volume and value, respectively. Cards and PPI 6.19 As of December 2024, the financial landscape in India is characterized by the widespread adoption of credit and debit cards, with an astounding 109.9 crore cards circulating throughout the country. This comprises 10.8 crore credit cards and 99.1 crore debit cards, both of which have exhibited divergent growth trajectories over the past five years. Credit Cards 6.20 The credit card landscape in India has seen a marked transformation, with distinct strategies adopted by different types of banks. The credit card issued by Public Sector Banks (PSBs) increased from 122.6 lakh as at end-December 2019 to 257.61 lakh as at end-December 2024, a more than 110 per cent jump. Private Sector Banks (PVBs), who hold a 71 per cent market share with 766 lakh cards in December 2024, have leaned into digital solutions and co-branded cards to cater to urban and affluent customers. Meanwhile, Foreign Banks have seen a decline both in numbers—from 65.79 lakh cards to 45.94 lakh—and in market share, dropping from 11.9 per cent to 4.3 per cent between December 2019 and December 2024, possibly due to high fees and conservative lending policies. Small Finance Banks (SFBs) have entered the arena with 10.97 lakh cards as at end-December 2024, targeting the underserved and focusing on financial inclusivity.  6.21 Credit cards have seen a meteoric rise in transactions as well, with the volume of transactions catapulting from 208.67 crore in CY-2019 to 447.23 crore in CY-2024. The value of these transactions has also risen sharply from ₹7.13 lakh crore to ₹20.37 lakh crore during the same period. These numbers correspond to a 5-year CAGR of 16.47 per cent in volume and 23.37 per cent in value, driven largely by online spending that accounted for nearly half of all credit card transactions in the last financial year. Debit Cards  6.22 The debit card sector tells a similar but distinct story. Public Sector Banks, although dominant, have seen a reduction in their market share from 69.7 per cent with 56.1 crore cards in December 2019, to 64.5 per cent with 63.9 crore cards in December 2024. Private Sector Banks have upped their game, moving from 17.12 crore cards (21.3 per cent share) as at end-December 2019 to 24.76 crore cards (25 per cent share) as at end-December 2024, leveraging value-added services and technological infrastructure. Thus, while the Public Sector Banks saw a 14% rise in debit card issuance over the past five years, the significantly steeper 45% growth in debit cards issued by the Private Sector Banks during the same period has resulted in a decline in the Public Sector Banks' overall market share. Payment Banks and Small Finance Banks have notably expanded their footprint. Payment Banks’ market share decreased marginally from 7.03 per cent with 5.66 crore cards to 7 per cent with 6.94 crore cards, and Small Finance Banks surged from 1.4 per cent market share with 1.16 crore cards to 3.1 per cent with 3.03 crore cards (between December 2019 and December 2024), targeting underserved demographics with low-cost, accessible services.  6.23 In contrast to credit cards, debit cards have experienced a decline in transactions, with transaction volume decreasing from 495.32 crore in CY-2019 to 173.90 crore in CY-2024. Their value declined from ₹6.83 lakh crore to ₹5.16 lakh crore, translating to a relatively modest 5-year CAGR of (-)18.89 per cent in volume and (-)5.48 per cent in value. 6.24 In summary, credit and debit cards have evolved at different paces to cater to distinct financial needs and preferences of the Indian populace. Credit cards have become the go-to option for online expenditures, while debit cards primarily facilitate cash access and basic transactions. Despite their distinct roles, both are increasingly facing competition from emerging technologically advanced payment methods. Prepaid Payment Instruments (PPI)  6.25 Within the digital payment ecosystem of India, Prepaid Payment Instruments (PPIs) have gained significant traction as a versatile and secure medium for financial transactions. Comprising mobile wallets and prepaid cards, PPIs have been leveraged for a broad array of applications, such as bill settlements, e-commerce purchases, remittances, and toll payments. Data underscores this surge, indicating a 6.25 per cent compound annual growth rate (CAGR) in the volume of PPI transactions—from 516.22 crore in CY-2019 to 698.88 crore in CY-2024. Likewise, the value of these transactions escalated at a 0.48 per cent CAGR, ballooning from ₹2.18 lakh crore in CY-2019 to ₹2.23 lakh crore in CY-2024. Contrastingly, the outstanding number of PPIs have declined. As at end-December 2019, there were a total of 176 crore PPIs which included 166 crore wallets and 10 crore cards; this changed to 133 crore PPIs as at end-December 2024 with 89 crore wallets and 44 crore cards. Cross-Border Payments Inward and Outward Remittance 6.26 According to World Bank data, India remains the top recipient of global foreign remittances, with a record $129 billion inflow in CY-2024 (estimate), nearly double that of Mexico, the second-highest recipient with $68 billion. This underscores India's significant position in the global remittance market, driven by its vast diaspora contributing to foreign exchange reserves and economic stability. On the outflows, the United States consistently leads global remittance outflows, sending $93 billion in 2023, significantly more than other countries like Saudi Arabia and Switzerland, each contributing around $38 billion. The United Arab Emirates (UAE) also ranks high in outflows, maintaining its position as a major sender.
Cost of Remittance 6.27 In 2023, the cost of sending remittances to South Asia, and particularly to India, highlights a notable trend in the global remittance landscape, reflecting both progress and persisting challenges in achieving cost efficiency. South Asia continues to offer the lowest remittance transaction costs worldwide, with an average of 5.8 percent for sending $200 (Migration and Development Brief 40, June 2024). This rate represents 80 basis point reduction from the global average of 6.4 percent in the same period. However, it still exceeds the Sustainable Development Goals (SDG) target of a three percent ceiling, underscoring a critical area for improvement. 6.28 Within the regional context, India emerges as a focal point due to its significant variance in remittance costs across different corridors. The corridor from Malaysia to India is notably the most cost-effective, boasting an impressively low rate of 2.2 percent in 2023:Q4 (2.9 percent in 2022:Q4), well below the SDG benchmark. This contrast starkly with the higher costs observed in other corridors, particularly those leading into South Asia, where costs in the fourth quarter of 2023 spanned from 11.7 to 13.6 percent. The United Arab Emirates to Bangladesh corridor with a peak cost of 13.6 percent in Q4 of 2023 and it increased substantially from 5 percent cost of remittances in the previous year Q4. 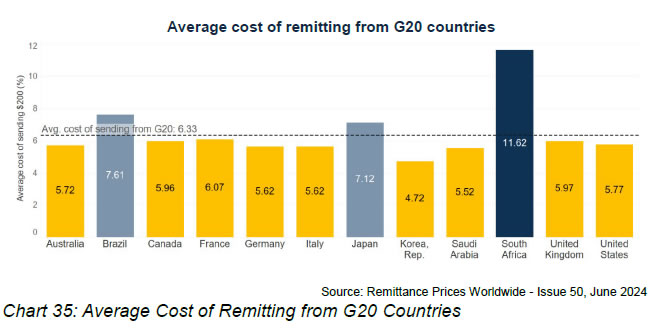
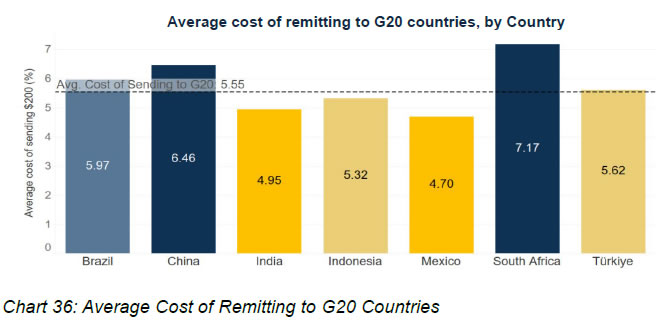 6.29 The overall trend points to a gradual decrease in the cost of sending remittances to India, excluding the Singapore to India corridor, which has not followed this downward trajectory. This reflects ongoing efforts towards making remittance transfers more affordable, in alignment with global objectives to enhance financial inclusivity for migrant communities. 7. Global Trends in Payment Systems 7.1 Enhancing cross-border payments was a G20 priority during the Saudi Arabian Presidency in 2020. The G20 endorsed a cross-border payment roadmap developed by the Financial Stability Board (FSB) and Committee on Payments and Market Infrastructures (CPMI) and other international organisations, which aimed to address the key frictions for cross-border payments – high cost, low speed, limited access and transparency. 7.2 A comprehensive plan, consisting of 19 building blocks, focusing on enhancing payment infrastructure, standardizing data practices, and fostering regulatory cooperation across jurisdictions was adopted. Out of the 19 building blocks, three priority themes have been identified namely:- -
Payments System Interoperability and Extension: Connecting different national and regional payment systems for smoother cross-border flows. -
Legal, Regulatory & Supervisory Frameworks: Harmonizing regulations and supervisory practices across jurisdictions to streamline processes. -
Cross-border Data Exchange & Messaging Standards: Implementing standardized data formats (like ISO 20022) to facilitate seamless information exchange. 7.3 In India, the National Electronics Funds Transfer (NEFT) System and the Real Time Gross Settlement (RTGS) System were made operational on a 24x7x365 from December 2019 and December 2020 respectively. The Indian RTGS system has been using ISO 20022 compliant messaging standards since 2013 when the Next Generation RTGS was implemented. Simultaneously, while the NEFT system infrastructure has been migrated to ISO 20022 standards, the participant ecosystem is on its way towards migrating. Both these steps are in line with the G20 roadmap for enhancing cross border payments. 7.4 In the last two decades, domestic payments ecosystem across jurisdictions have been revolutionised with the introduction of real-time national payment systems, especially the fast payment systems (FPSs). There are more than 70 domestic FPSs across the world. Naturally, FPS interlinking arrangements between different jurisdictions have emerged to be one of the most promising and viable solutions for enhancing cross-border payments and achieve the G20 targets. By shortening the transaction chain through use of payment service providers instead of the traditional correspondent banking model, the interlinking arrangements can offer increased speed and efficiency at low cost. 7.5 In recent times, an increasing number of countries have started exploring interlinking arrangements with other jurisdictions. While some of the linkages are direct i.e., bilateral arrangements between two countries, others are multilateral arrangements involving multiple countries in hub and spoke model through a common intermediary (the hub), which takes care of clearing and settlement responsibilities. 7.6 The following section discusses some of the recent initiatives on India’s FPS (UPI) Interlinkage – -
With a view to enable convenient, safe, instant, and cost-effective cross-border funds transfers between India and Singapore, their respective FPS, UPI and PayNow were interlinked in February 2023. The linkage enables users of the two systems to make instant and low-cost cross-border (P2P) payments / remittances on a reciprocal basis. Funds are remitted across the border in near real-time, and transfer amount is displayed upfront on a real-time basis along with the applicable charges. The arrangement makes extensive use of open banking APIs to ensure regulatory compliance, flexibility in settlement arrangements, fetching forex rates and reduction in transaction times, among other benefits. -
The UPI-PayNow interlinkage ticks all the G20 targets with cost of fund transfers substantially less than the prescribed ceiling of 3% for a US$ 200 transaction, near real-time speed of transactions, a large user base and several payment system providers (PSPs) facilitating ease of access and ensuring transparency. -
In July 2023, RBI and the Central Bank of the UAE (CBUAE) signed an MoU for cooperation on interlinking their payment systems. Under this MoU, inter alia, the two central banks agreed to cooperate on linking their Fast Payment Systems – UPI of India with Instant Payment Platform of UAE called Aani. The legal agreement between the operators, viz. NPCI International Payments Limited (NIPL) and Al Etihad Payments (AEP) was signed on February 13, 2024. Project implementation work is in progress. -
RBI and Nepal Rastra Bank (NRB) are actively working on the linkage of UPI platform of India and National Payments Interface (NPI) of Nepal for enabling cross-border payments. In June 2023, NIPL and Nepal Clearing House Limited signed an MoU for the purpose. A Terms of Reference was also signed between RBI and NRB on February 15, 2024 to this effect. Technical integration of the UPI and NPI systems have been completed and CUG testing is going on. -
Project Nexus: To enhance cross-border payments, the BIS Innovation Hub, Singapore had developed Nexus as multilateral network connecting domestic instant payment system (IPS) networks of participating countries. The network has been envisioned as a central hub which can connect the FPS of multiple countries enabling faster cross-border payments. It is designed to accommodate the inherent differences of individual IPSs instead of mandating homogeneity requirements. The project aims to support the G20 targets of improving the cost, speed, access and transparency of cross-border payments. -
India joined Project Nexus, a multilateral international initiative, conceptualised by the Innovation Hub of the Bank for International Settlements (BIS), to enable instant cross-border retail payments by interlinking domestic fast payment systems (FPSs). This will facilitate multilateral linkage of fast payment systems of four ASEAN Nations (Malaysia, Philippines, Singapore and Thailand) and India. An agreement to this effect was signed at the BIS on June 30, 2024. -
UPI has also been facilitated to be accepted in foreign countries at merchant locations through scanning of QR codes. This faclitates person to merchant (P2M) transactions through QR codes at merchant locations for the Indian citizens travelling to other countries using their UPI powered mobile apps; and foreigners travelling to India using their FPS apps through QR codes in India. -
The acceptance of UPI through QR codes has been enabled in Bhutan, France, Mauritius, Nepal, Singapore, Sri Lanka and the UAE. In case of Mauritius, the arrangement enables Mauritian travellers to use their Fast Payment System apps for making merchant payments through QR codes in India as well. -
UPI as Fast Payment System infrastructure in other countries: For deployment of UPI like solution, NPCI International Payment Limited (NIPL) has signed agreement with Peru, Namibia and Trinidad & Tobago. The project implementation work has been initiated by NIPL. Furthermore, based on approval granted by RBI, NIPL has signed MoUs with Jamaica, Guyana and Maldives as well. 7.7 Various efforts have been taken to internationalise domestic card network, i.e. RuPay -
Acceptance of Indian RuPay Cards has been enabled in Bhutan, Nepal, Singapore, Maldives, Mauritius and the UAE for use at ATM and PoS terminals. Issuance of RuPay cards is live in Bhutan and Mauritius; the arrangements enable acceptance of Mauritius and Bhutan RuPay cards in India as well. -
Further, Indian RuPay cards in co-badging arrangement with Discover Financial Services, Diners Club International, Japan Credit Bureau, Pulse, and China Union Pay are accepted in 200+ countries across the globe. -
As per the MoU signed between RBI and CBUAE in July 2023, CBUAE has developed its domestic card scheme 'JAYWAN' based on RuPay technology stack. Soft launch of the JAYWAN card was done in February 2024. Parallelly, discussions between the operators are going on for enabling bilateral acceptance of RuPay and JAYWAN in each other's jurisdiction, once the full-scale roll out of JAYWAN cards is complete. References: 1. https://www.ecb.europa.eu/press/blog/date/2023/html/ecb.blog231031~85a4bcdee0.en.html Extending the benefits of digital technologies to cross-border payments by Fabio Panetta 2. Singapore and Thailand Launch World's First Linkage of Real-time Payment Systems (mas.gov.sg) 3. CPMI Report on “Interlinking payment systems and the role of application programming interfaces: a framework for cross-border payments” 4. Press release: BIS's Project Nexus prototype successfully links Eurosystem, Malaysia and Singapore payments systems; partners in Indonesia, Malaysia, the Philippines, Singapore and Thailand to work towards wider payments connectivity 5. G20 Roadmap for Enhancing Cross-border Payments Priority actions for achieving the G20 targets – 23 February 2023 – Financial Stability Board 6. World Bank Group, Global Knowledge Partnership on Migration and Development (KNOMAD). Migration and Development Brief 40, June 2024, https://documents1.worldbank.org/curated/en/099714008132436612/pdf/IDU1a9cf73b51fcad1425a1a0dd1cc8f2f3331ce.pdf 7. The World Bank (IBRD & IDA, World Bank Group), Remittance Prices Worldwide - Issue 50, June 2024 https://remittanceprices.worldbank.org/
Annex Payment Systems Data points | CCIL Operated Systems* | | Period | Volume
(in Lakh) | Value
(In INR Cr) | | H1:2019 | 17.37 | 61619191.08 | | H2:2019 | 18.00 | 65368427.64 | | H1:2020 | 14.23 | 71478412.33 | | H2:2020 | 15.00 | 78942181.41 | | H1:2021 | 15.03 | 95915153.43 | | H2:2021 | 16.95 | 103514205.61 | | H1:2022 | 18.52 | 117730244.52 | | H2:2022 | 20.80 | 131179082.73 | | H1:2023 | 21.88 | 131601975.84 | | H2:2023 | 21.18 | 128674890.12 | | H1:2024 | 22.77 | 131955276.21 | | H2:2024 | 22.47 | 146099224.45 | | *: Includes settlement data of government securities, forex clearing and Rupee derivatives. |
| RTGS | | Period | Volume
(in Lakh) | Value
(In INR Cr) | | H1:2019 | 722.90 | 74273079.05 | | H2:2019 | 759.38 | 64593880.17 | | H1:2020 | 653.45 | 53055638.95 | | H2:2020 | 811.13 | 52259545.98 | | H1:2021 | 945.73 | 58569258.98 | | H2:2021 | 1057.78 | 66058377.49 | | H1:2022 | 1177.07 | 69870277.35 | | H2:2022 | 1187.47 | 74585743.04 | | H1:2023 | 1287.01 | 79818957.85 | | H2:2023 | 1318.11 | 84356372.83 | | H1:2024 | 1464.87 | 93092224.42 | | H2:2024 | 1488.03 | 100729042.88 |
| AePS (Fund Transfers) | | Period | Volume
(in Lakh) | Value
(In INR Cr) | | H1:2019 | 5.50 | 267.29 | | H2:2019 | 4.51 | 215.37 | | H1:2020 | 4.61 | 229.76 | | H2:2020 | 5.69 | 314.69 | | H1:2021 | 6.12 | 374.49 | | H2:2021 | 5.19 | 299.53 | | H1:2022 | 3.37 | 197.55 | | H2:2022 | 3.16 | 182.12 | | H1:2023 | 1.99 | 136.87 | | H2:2023 | 1.90 | 125.98 | | H1:2024 | 1.92 | 119.14 | | H2:2024 | 1.84 | 87.63 |
| IMPS | | Period | Volume
(in Lakh) | Value
(In INR Cr) | | H1:2019 | 10678.71 | 1000751.95 | | H2:2019 | 13152.15 | 1181379.16 | | H1:2020 | 12122.13 | 1130831.34 | | H2:2020 | 17616.11 | 1553002.29 | | H1:2021 | 19353.43 | 1740946.53 | | H2:2021 | 24027.46 | 2087405.30 | | H1:2022 | 27652.45 | 2574463.66 | | H2:2022 | 28217.46 | 2752293.82 | | H1:2023 | 28848.21 | 3041463.21 | | H2:2023 | 29158.29 | 3177454.93 | | H1:2024 | 32488.78 | 3545347.11 | | H2:2024 | 26894.62 | 3525555.41 |
| NACH Cr | | Period | Volume
(in Lakh) | Value
(In INR Cr) | | H1:2019 | 13,198.87 | 5,02,901.88 | | H2:2019 | 13,450.22 | 5,50,714.76 | | H1:2020 | 17,270.42 | 6,97,153.87 | | H2:2020 | 14,226.94 | 5,99,230.40 | | H1:2021 | 14,641.70 | 6,86,668.87 | | H2:2021 | 14,893.76 | 6,65,000.52 | | H1:2022 | 17,803.28 | 7,95,800.03 | | H2:2022 | 17,468.33 | 8,79,899.40 | | H1:2023 | 18,711.86 | 9,49,947.29 | | H2:2023 | 21,441.71 | 9,28,384.35 | | H1:2024 | 23470.55 | 10,47,365.42 | | H2:2024 | 25221.38 | 10,98,914.86 |
| NEFT | | Period | Volume
(in Lakh) | Value
(In INR Cr) | | H1:2019 | 12688.79 | 12366781.70 | | H2:2019 | 13529.27 | 10929870.03 | | H1:2020 | 13676.02 | 10778363.75 | | H2:2020 | 15787.30 | 13071125.80 | | H1:2021 | 17528.76 | 13328506.43 | | H2:2021 | 20480.11 | 14349675.52 | | H1:2022 | 23149.08 | 16173849.99 | | H2:2022 | 26331.19 | 16621292.40 | | H1:2023 | 29762.13 | 18163580.76 | | H2:2023 | 36109.23 | 19149497.58 | | H1:2024 | 43526.24 | 21079662.55 | | H2:2024 | 49158.10 | 22199013.91 |
| UPI | | Period | Volume
(in Lakh) | Value
(In INR Cr) | | H1:2019 | 44163.46 | 791180.30 | | H2:2019 | 63711.91 | 1045457.87 | | H1:2020 | 74485.60 | 1276589.49 | | H2:2020 | 114323.55 | 2111159.45 | | H1:2021 | 153050.66 | 2891273.56 | | H2:2021 | 234280.75 | 4266339.65 | | H1:2022 | 319438.81 | 5657624.38 | | H2:2022 | 420958.09 | 6936869.05 | | H1:2023 | 518384.84 | 8319970.37 | | H2:2023 | 657702.67 | 9967664.56 | | H1:2024 | 789706.74 | 11663789.32 | | H2:2024 | 932373.44 | 13018731.50 |
| BHIM Aadhar Pay | | Period | Volume
(in Lakh) | Value
(In INR Cr) | | H1:2019 | 40.28 | 544.03 | | H2:2019 | 42.31 | 583.85 | | H1:2020 | 76.63 | 993.20 | | H2:2020 | 79.58 | 1233.32 | | H1:2021 | 81.37 | 2000.09 | | H2:2021 | 119.73 | 3023.16 | | H1:2022 | 133.56 | 4073.83 | | H2:2022 | 102.40 | 3177.13 | | H1:2023 | 83.80 | 3040.60 | | H2:2023 | 90.29 | 2906.43 | | H1:2024 | 117.83 | 3228.19 | | H2:2024 | 118.13 | 3667.10 |
| NACH Dr | | Period | Volume
(in Lakh) | Value
(In INR Cr) | | H1:2019 | 2714.63 | 290240.74 | | H2:2019 | 3108.61 | 312501.43 | | H1:2020 | 3429.38 | 321278.82 | | H2:2020 | 5008.72 | 451903.17 | | H1:2021 | 5091.00 | 464329.23 | | H2:2021 | 5343.13 | 516811.84 | | H1:2022 | 5924.45 | 565273.89 | | H2:2022 | 6781.16 | 638589.90 | | H1:2023 | 7486.64 | 727935.79 | | H2:2023 | 8201.44 | 834788.45 | | H1:2024 | 8975.05 | 966245.14 | | H2:2024 | 10042.37 | 1102552.72 |
| Credit card | | Period | Volume
(in Lakh) | Value
(In INR Cr) | | H1:2019 | 9666.20 | 337036.62 | | H2:2019 | 11200.98 | 375674.84 | | H1:2020 | 8584.73 | 275056.63 | | H2:2020 | 9349.87 | 337490.58 | | H1:2021 | 9712.30 | 370969.46 | | H2:2021 | 11851.96 | 516912.38 | | H1:2022 | 12966.60 | 608820.72 | | H2:2022 | 14707.44 | 720672.96 | | H1:2023 | 15507.36 | 794340.29 | | H2:2023 | 17812.47 | 940362.21 | | H1:2024 | 20463.70 | 960385.12 | | H2:2024 | 24259.31 | 1076229.33 |
| Debit card | | Period | Volume
(in Lakh) | Value
(In INR Cr) | | H1:2019 | 23653.25 | 319939.25 | | H2:2019 | 25878.53 | 363427.67 | | H1:2020 | 20069.53 | 278586.31 | | H2:2020 | 21522.66 | 362669.45 | | H1:2021 | 19624.63 | 340221.99 | | H2:2021 | 21243.13 | 398614.14 | | H1:2022 | 19141.91 | 372893.71 | | H2:2022 | 17304.08 | 369047.54 | | H1:2023 | 13795.29 | 317648.00 | | H2:2023 | 11460.35 | 302289.05 | | H1:2024 | 9208.27 | 260422.51 | | H2:2024 | 8181.32 | 255088.00 |
| Prepaid Payment Instrument (PPI) | | Period | Volume
(in Lakh) | Value
(In INR Cr) | | H1:2019 | 24883.53 | 108861.39 | | H2:2019 | 26738.01 | 109104.26 | | H1:2020 | 23569.77 | 88092.44 | | H2:2020 | 26639.97 | 101188.16 | | H1:2021 | 27257.54 | 121085.76 | | H2:2021 | 34757.41 | 143951.86 | | H1:2022 | 37071.13 | 149087.99 | | H2:2022 | 37018.85 | 143777.37 | | H1:2023 | 38482.54 | 137963.03 | | H2:2023 | 39336.18 | 146007.13 | | H1:2024 | 35383.81 | 114215.84 | | H2:2024 | 34503.98 | 108996.44 |
|