| I. Macroeconomic Outlook The domestic economic outlook remains resilient supported by improved consumption demand and strong macroeconomic fundamentals. Inflation is expected to align with the target on account of favourable food inflation outlook. Heightened trade tensions, volatile financial markets, geopolitical strife, and climate risks weigh heavily on the outlook. Monetary policy aims to facilitate conducive macroeconomic conditions that reinforce price stability and sustained economic growth. I.1 Key Developments since the October 2024 MPR Since the release of the Monetary Policy Report (MPR) in October 2024, global economic activity has remained resilient in 2024 although below historical average, with high frequency indicators hinting at slowdown in growth momentum in 2025. Escalating trade tensions led by a slew of tariff impositions impart uncertainty to the growth outlook. Headline inflation though decelerating, has remained above the target in many economies owing to the lacklustre and uneven pace of disinflation. The decline in headline inflation on account of subdued core inflation (i.e., CPI excluding food and fuel) augurs well, although persistent high services inflation weighs heavily on the outlook. The divergence in monetary policy pathways across countries has continued. As compared to the highly synchronous tightening phase, there is now a hesitant and guarded rate cut cycle under progress. Financial markets have been on edge due to shifting expectations of monetary policy and fears of tariff wars. Geopolitical uncertainties, ratcheting up of trade tensions and withdrawal of portfolio investors caused retreat in equities from the highs in January 2025. The sell off further intensified since March due to fears of trade war. Sovereign bond yields in advanced economies (AEs) hardened in Q4:2024 but have softened thereafter due to growth slowdown concerns. Gold prices continued to strengthen and reached new heights every month in 2025 till March. The US dollar index firmed in Q4:2024 due to delayed expectations of rate easing by the US Federal Reserve and anticipated policies of the new US administration but has retreated since mid-January 2025 amidst weaker growth expectations and heightened trade policy uncertainty. Global commodity prices softened somewhat in Q4:2024 but increased sharply in Q1:2025, largely on account of metals and agricultural prices. Brent crude oil prices rose sharply from late December 2024 till mid-January 2025, reflecting sanctions on Russia's energy sector, threats of tariff imposition, and cold weather conditions. It has softened since then following a moderation in geopolitical risk premium and improved supply response from Organization of the Petroleum Exporting Countries plus (OPEC+). Of late, energy and metal prices have softened after the tariff imposition owing to uncertain global economic outlook. Turning to the domestic economy, the second advance estimates (SAE) released by the national statistical office (NSO) estimated real gross domestic product (GDP) growth at 6.5 per cent year-on-year (y-o-y) in 2024-25 on the back of robust growth in private final consumption expenditure. On the supply side, real gross value added (GVA) expanded by 6.4 per cent, y-o-y, driven by agriculture and services sectors. Real GDP growth for Q3:2024-25 was placed at 6.2 per cent y-o-y, driven by robust private and government consumption expenditure. Headline consumer price index (CPI) inflation, which averaged 4.6 per cent during H1:2024-25, increased to 6.2 per cent in October 2024 but has since been easing with February 2025 inflation print at a seven month low of 3.6 per cent, driven by sharp decline in vegetable prices inflation. Core inflation which averaged 3.3 per cent in H1:2024-25, however, inched up to an average of 3.8 per cent in H2:2024-25 (up to February). On the contrary, food inflation which remained elevated at an average of 8.5 per cent during October- December 2024, decelerated to 3.8 per cent in February 2025. The deflation in fuel inflation, however, moderated. After retaining the policy repo rate at 6.5 per cent since February 2023, the Monetary Policy Committee (MPC) has embarked on monetary easing in H2:2024-25. It changed the stance from withdrawal of accommodation to neutral in October 2024, and cut the policy repo rate by 25 basis points (bps) to 6.25 per cent in its February 2025 meeting. In December 2024, the Reserve Bank reduced the cash reserve ratio (CRR) maintained by banks by 50 bps. Monetary Policy Committee Meetings: October 2024 - March 2025 When the MPC met in October 2024, the global economy exhibited resilience, although intense geopolitical conflicts, geoeconomic fragmentation, financial market volatility and elevated public debt continued to pose downside risks. Inflation was softening but the growing divergence in growth-inflation dynamics across countries resulted in varying monetary policy responses. Domestically, real GDP registered a growth of 6.7 per cent, y-o-y, in Q1:2024-25, mainly driven by private consumption and investment. The outlook for agriculture remained positive, with above average rainfall, better kharif sowing and healthy reservoir levels. Manufacturing activity gained momentum due to improved domestic demand, lower input costs and a supportive policy environment while services sector growth remained robust. Investment activity was expected to stay buoyant due to resilient bank credit growth, higher capacity utilisation, healthy balance sheet of banks and government’s thrust on infrastructure spending. Real GDP growth for 2024-25 was projected at 7.2 per cent. Headline inflation fell sharply from 5.1 per cent in June to 3.6 per cent and 3.7 per cent in July and August, respectively. Deflation in fuel further deepened but core inflation edged up. After a transient spike in the near term, headline inflation was expected to moderate. Considering the major upside risks on account of unexpected weather events and worsening of geopolitical conflicts, the projection of CPI inflation for 2024-25 was retained at 4.5 per cent. By a majority of 5-1, the MPC decided to keep the policy repo rate unchanged at 6.5 per cent emphasising the need to remain vigilant of the evolving inflation outlook. Keeping in view the well-balanced growth-inflation dynamics, the MPC also unanimously decided to change the stance from ‘withdrawal of accommodation’ to ‘neutral’ to provide flexibility to monitor and assess the outlook on inflation and growth and act in accordance with the evolving situation while remaining unambiguously focused on achieving a durable alignment of inflation with the target, while supporting growth. At the time of the December 2024 meeting, the global economy was steady even as inflation was easing. However, geopolitical risks and policy uncertainty, particularly trade policies, resulted in heightened volatility in financial markets. On the domestic front, real GDP growth of 5.4 per cent in Q2:2024-25 was much lower than expected as expansion in private consumption and investment decelerated, although government spending recovered during the quarter, Real GVA growth was tempered by deceleration in growth of industrial activity reflecting subdued performance of manufacturing companies, contraction in mining activity and lower electricity demand. Real GDP growth for 2024-25 was projected at 6.6 per cent. Headline CPI inflation increased to 6.2 per cent in October breaching the upper tolerance band, driven by an unanticipated rise in food prices. Core inflation also registered an uptick in October. CPI inflation projection for 2024-25 was revised upwards to 4.8 per cent. The MPC emphasised on the importance of maintaining price stability as a foundation for long-term high economic growth and remained committed towards restoring the growth-inflation balance in the overall interest of the economy. It decided by a majority of 4-2 to keep the policy repo rate unchanged at 6.5 per cent and voted unanimously to continue with the neutral stance. In the run up to the February 2025 meeting, the global economic landscape remained challenging with global growth being below the historical average although high frequency indicators showed signs of resilience along with expansion in world trade. The pace of disinflation was marred by services price inflation. Strengthening dollar exerted pressure on emerging market currencies and imparted volatility in financial markets. On the domestic front, real GDP growth, as per the first advance estimates (FAE) of the NSO, was estimated to grow at 6.4 per cent in 2024-25, underpinned by a recovery in private consumption. Looking ahead, improved rabi prospects and recovery in industrial activity was expected to support growth in 2025-26. Real GDP growth for 2025-26 was projected at 6.7 per cent. Headline inflation softened sequentially in November and December from its October high driven by the moderation in food inflation, which was aided by easing of vegetable prices. Core inflation remained subdued and fuel deflation continued. Inflationary pressures were expected to moderate in the near term, due to good kharif production, easing in vegetable prices and favourable rabi crop prospects while continued uncertainty in global financial markets, volatility in energy prices and adverse weather events posed upside risks. CPI inflation projection for 2024-25 was retained at 4.8 per cent. Also, assuming a normal monsoon next year, CPI inflation for 2025-26 is projected at 4.2 per cent. The MPC noted that inflation is on a declining trajectory largely due to favourable outlook on food prices and impact of past monetary policy measures and is further expected to moderate in 2025-26, gradually aligning with the target. Therefore, the evolving growth-inflation dynamics opened up space to support growth. Accordingly, the MPC unanimously voted to reduce the policy repo rate by 25 bps to 6.25 per cent. The MPC also decided to continue with the neutral stance so as to retain the flexibility to respond to the evolving macroeconomic environment. | Table I.1 Monetary Policy Committee Meetings and Policy Rate Voting Patterns | | Country | Policy Meetings: October 2024 - March 2025 | | Total meetings | Meetings with full consensus | Meetings without full consensus | Variation in policy rate (basis points) | | Brazil | 4 | 4 | 0 | 350 | | Chile | 4 | 4 | 0 | -50 | | Colombia | 4 | 0 | 4 | -75 | | Czech Republic | 4 | 2 | 2 | -50 | | Hungary* | 6 | 3 | 2 | 0 | | India | 3 | 1 | 2 | -25 | | Japan | 4 | 2 | 2 | 25 | | South Africa | 3 | 1 | 2 | -50 | | Sweden | 4 | 4 | 0 | -100 | | Thailand | 3 | 1 | 2 | -50 | | UK | 4 | 0 | 4 | -50 | | US | 4 | 3 | 1 | -50 | Note: *: Total number of meetings happened is six. However, the minutes of last meeting (March 25, 2025) is not published to date.
Sources: Central bank websites. | The MPC’s voting pattern reflects the diversity in individual members’ assessments, expectations and policy preferences - a characteristic also reflected in voting patterns of other central banks (Table I.1). While most AEs and emerging market economies (EMEs) undertook policy easing, concerns on slower pace of disinflation compounded by developments on the geopolitical front and trade fragmentation suggested shallow rate cut cycle amidst policy uncertainties. Few exceptions like Japan and Brazil which continued with monetary tightening to keep inflation around their respective targets. Macroeconomic Outlook Chapters II and III analyse macroeconomic developments relating to inflation and economic activity during H2:2024-25 (October 2024 - March 2025). Turning to the baseline assumptions, international crude prices exhibited declining pattern during October-December 2024, hovering around US$ 74 per barrel on account of relatively modest growth in global oil demand as well as robust supply from non-OPEC countries. Anxiety over the impact of sanctions over Russia and speculation of increased restrictions on Iran, along with fears of potential supply disruptions, triggered an upswing in prices in early January to around US$ 84 per barrel. Since then, prices gradually declined in February and fell to its lowest levels in recent times in March 2025 primarily due to announcement of production increase by OPEC along with reduced geopolitical risk premiums and adequate inventory. Geopolitical developments continue to impart significant uncertainty to the outlook (Charts I.1a and I.1b). The spread between global petroleum product prices and crude prices softened (Chart I.1c). Considering these factors, the baseline assumption for crude price (Indian basket) is reduced to US$ 70 per barrel during 2025-26 (Table I.2). | Table I.2: Baseline Assumptions for Projections | | Indicator | MPR October 2024 | MPR April 2025 | | Crude Oil (Indian Basket) | US$ 80 per barrel during H2: 2024-25 | US$ 70 per barrel during 2025-26 | | Exchange rate | ₹83.50/US$ during H2: 2024-25 | ₹86/US$ during 2025-26 | | Monsoon | Normal for 2025-26 | Normal for 2025-26 | | Global growth | 3.2 per cent in 2024
3.3 per cent in 2025 | 3.1 per cent in 2025
3.0 per cent in 2026 | | Fiscal deficit (per cent of GDP) | To remain within BE 2024-25
Centre: 4.9
Combined:7.3 | To remain within BE 2025-26
Centre: 4.4
Combined: 7.1 | | Domestic macroeconomic/ structural policies during the forecast period | No major change | No major change | Notes: 1. The Indian basket of crude oil represents a derived numeraire comprising sour grade (Oman and Dubai average) and sweet grade (Brent) crude oil.
2. The exchange rate path assumed here is for the purpose of generating the baseline projections and does not indicate any ‘view’ on the level of the exchange rate. The Reserve Bank is guided by the objective of containing excess volatility in the foreign exchange market and not by any specific level of and/or band around the exchange rate.
3. BE: Budget estimates.
4. Combined fiscal deficit refers to that of the Centre and States taken together.
Sources: RBI estimates; Budget documents; International Monetary Fund (IMF); and Organisation for Economic Cooperation and Development (OECD). | Second, the nominal exchange rate of the Indian rupee (₹) saw two-way movements in the range of ₹83.8-87.6 per US dollar during H2:2024-25 with a depreciating bias in 2025 till early March. The strengthening of US dollar since early October 2024 resulted in depreciation of EME currencies including rupee and increased volatility in financial markets. Since mid-January, however, the dollar has retreated with high frequency indicators pointing towards lacklustre growth and elevated policy uncertainty. Accordingly, EME currencies have recovered, albeit not fully. Taking into consideration the uncertainty around US dollar movements, fluctuations of global capital flows and international crude oil prices, the baseline assumption for the exchange rate is revised to ₹86 per US dollar as against ₹83.50 in the October 2024 MPR. 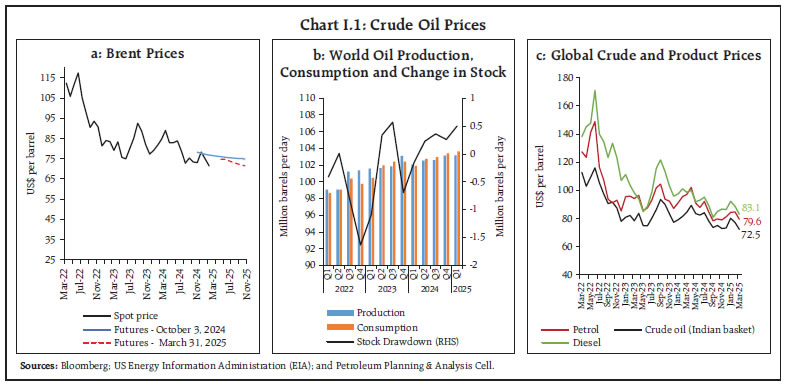 Third, global growth was projected at 3.1 per cent in 2025 and 3.0 per cent in 2026 by the Organisation for Economic Cooperation and Development (OECD) in its Economic Outlook Interim Report released in March 2025. The global disinflation continues, with inflation expected to decline to 4.2 per cent in 2025 and to 3.5 per cent in 2026, according to World Economic Outlook in its January 2025 update by International Monetary Fund (IMF) (Chart I.2). Global trade growth (goods and services combined) is projected to decelerate from 3.4 per cent in 2024 to 3.2 per cent in 2025 before rebounding to 3.3 per cent in 2026. The recent reciprocal tariff announcements by the US administration and associated policy uncertainty, however, poses headwinds to global growth and inflation.
I.2 The Outlook for Inflation In H2:2024-25 so far (up to February), headline inflation breached the upper tolerance band briefly in October 2024, but has since eased on the back of declining food inflation. In the March 2025, round of the Reserve Bank’s households survey1, the three months and one year ahead inflation expectations of urban households’ decreased by 40 bps and 50 bps, reaching 8.9 per cent and 9.7 per cent, respectively, as compared to the January 2025 round. The proportion of respondents expecting the general price level to increase by more than the current rate declined for both horizons vis-à-vis the previous round (Chart I.3). In this context, it is pertinent to note that various economic agents form their inflation expectations based on different factors (Box I.1). 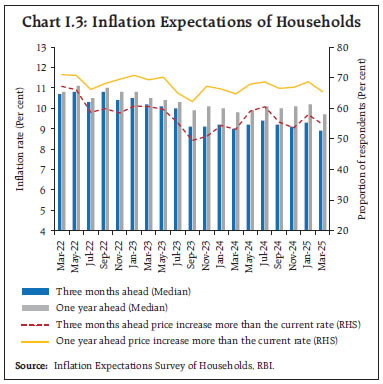
Box I.1: What Affects Inflation Expectations of Economic Agents? Anchoring inflation expectations is paramount in monetary policy formulation, particularly in an inflation-targeting framework. Empirical evidence suggests that positive changes in interest rates cause inflation expectations to decline (Goncalves et al., 2025). However, monetary responses of different agents vary, i.e., different categories of respondents respond differently to changes in monetary policy. An increase in the repo rate was found to have a sobering impact on inflation expectations of the financial and business sector agents but have a contrary impact for trade unions (Mlangeni and Buthelezi, 2023). To examine this phenomenon in the Indian context, a vector error correction model (VECM) is used to explore the relationship between key indicators and inflation expectations of different economic agents such as financial sector employees, daily workers, and self-employed workers, using the bi-monthly inflation expectations data from January 2017 to January 2025 with the following specification: where xt is the vector of endogenous variables, α is the adjustment coefficient and βt is the cointegrating vector (which defines the long-term relationship between the variables) and ϵt is the error term. The model is defined as follows: where Yt is one year ahead inflation expectations of financial sector employees, daily workers, and the self-employed, wacr is the weighted average call rate representing monetary policy; inflation is CPI inflation; govt_share is the share of government expenditure in GDP and ln_crude_oil represents natural logarithm of global crude oil prices which is an average of Brent, West Texas Intermediate (WTI) spot and Dubai Fateh. The unit root test suggests that all variables are integrated of order 1. Using appropriate lag length criteria, Johansen Cointegrating test finds a cointegrating relationship among the variables. The results suggest that monetary policy changes have a differential impact on inflation expectations of various groups. Inflation expectations are found to be negatively associated with the change in the policy interest rate in the long-run for financial sector employees and the self-employed. Also, financial sector employees are found to have a higher adjustment factor as compared to other groups, which suggest faster reaction to any deviation in actual inflation from the long-run steady state. Past inflation impacts positively in the formation of inflation expectations for all groups suggesting persistence. In contrast, crude oil prices are found to impact inflation expectations of self-employed and daily workers only (Table 1). Overall, the findings suggest that the formation of inflation expectations of different economic agents are governed by diverse factors corroborating cross-country experience. | Table 1: Long Run Estimates of VEC Model | | Variable | Financial sector employees | Daily workers | Self employed | | wacr(-1) | -0.297* | -0.260 | -0.407* | | | (0.113) | (0.136) | (0.121) | | inflation(-1) | 0.443** | 0.529*** | 0.526*** | | | (0.095) | (0.115) | (0.102) | | govt_share(-1) | 0.053 | -0.229** | -0.059 | | | (0.056) | (0.067) | (0.060) | | ln_crude_oil | 1.248 | 4.127*** | 3.901*** | | | (0.509) | (0.617) | (0.546) | | constant | 2.451 | -5.017 | -5.977 | | | (1.987) | (2.409) | (2.131) | | Error Correction, α | -0.904** | -0.278* | -0.417* | | | (0.132) | (0.094) | (0.125) | | R-squared | 0.503 | 0.158 | 0.193 | | Johansen cointegration test for no. of C.E. | 2 | 2 | 2 | | Observations | 49 | 49 | 49 | Standard errors in parentheses.
* p < 0.10, ** p < 0.05, *** p < 0.01
C.E. denotes cointegrating equations
Source: RBI staff estimates. | References: 1. Goncalves, M., Rodrigues, M., and Genta, F (2025). “Monetary Policy and Inflation Expectations: High- Frequency Evidence from Brazil”, IMF Working Paper WP/25/48. 2. Mlangeni, T., and Buthelezi, E. M (2023). “Monetary policy and inflation expectations: impact and causal analysis of heterogeneous economic agents’ expectations in South Africa”, Journal of Applied Economics, 27:1. |
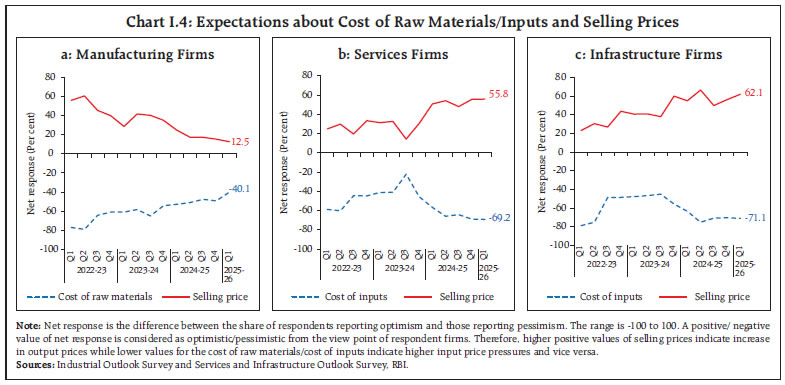 Manufacturing firms polled in the January-March 2025 round of the Reserve Bank’s industrial outlook survey expect pressures from cost of raw materials to ease and growth in selling price to moderate in Q1:2025-26 vis-à-vis the previous quarter (Chart I.4a).2 Both services sector companies and infrastructure firms expect higher input cost pressures and higher output prices in Q1:2025-26 (Charts I.4b and I.4c).3 In the Purchasing Managers Index (PMI) surveys for March 2025, input prices increased for manufacturing firms and declined for services firms vis-à-vis the previous month while output prices declined for both. Professional forecasters surveyed by the Reserve Bank in March 2025 projected CPI inflation to decline from 5.6 per cent in Q3:2024-25 to 3.9 per cent in Q4. They expect it to remain around 3.9-4.0 per cent till Q3 of 2025-26 before increasing to 4.5 per cent in Q4:2025-26 (Chart I.5a and Table I.3).4 Core inflation (i.e., CPI excluding food and beverages, pan, tobacco and intoxicants, and fuel and light) is expected to be at 4.0 per cent during Q4:2024-25, thereafter, it is expected to remain around 4.2-4.3 per cent till Q3:2025-26 and at 4.5 per cent in Q4. Long-run inflation expectations of professional forecasters – measured by their 5 and 10 years ahead expectations – are at 4.5 per cent and 4.3 per cent, respectively, in the current round (Chart 1.5 b). Looking ahead, the inflation outlook will be conditioned by several factors, both global and domestic. Food inflation may continue to ease due to robust kharif harvest arrivals which, coupled with promising rabi crop, bode well for inflation outlook. The Union Budget proposals on agriculture and the commitment to fiscal consolidation further strengthens the inflation outlook. However, lingering uncertainty in global financial markets, volatility in energy prices, adverse weather events, rising global supply chain pressures and continuing geopolitical strife remain key risks. 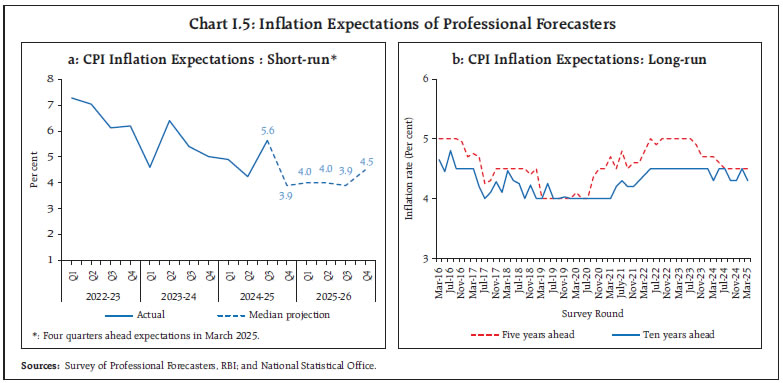 Taking into account the initial conditions, signals from forward-looking surveys and estimates from time-series and structural models5, CPI inflation is projected to average 4.0 per cent in 2025-26 – 3.6 per cent in Q1, 3.9 per cent in Q2, 3.8 per cent in Q3 and 4.4 per cent in Q4, with risks evenly balanced (Chart I.6 and Table I.3). The 50 per cent and the 70 per cent confidence intervals for headline inflation in Q4:2025-26 are 2.8-6.0 per cent and 1.9-6.9 per cent, respectively. For 2026-27, assuming a normal monsoon, and no further exogenous or policy shocks, structural model estimates indicate that inflation will average 4.3 per cent with 4.5 per cent in Q1, 4.3 per cent in Q2, 4.4 per cent in Q3 and 4.3 per cent in Q4. The 50 per cent and the 70 per cent confidence intervals for headline inflation in Q4:2026-27 are 2.6- 6.0 per cent and 1.7-6.9 per cent, respectively. | Table I.3: Projections - Reserve Bank and Professional Forecasters | | (Per cent) | | | 2024-25 | 2025-26 | 2026-27 | | Reserve Bank’s Baseline Projections | | | | | Inflation | 4.7* | 4.0 | 4.3 | | Real GDP growth | 6.5@ | 6.5 | 6.7 | | Median Projections of Professional Forecasters | | | | | Inflation, Q4 (y-o-y) | 3.9 | 4.5 | - | | Real GDP growth | 6.4 | 6.5 | 6.6 | | Gross domestic saving (per cent of GNDI) | 30.2 | 30.4 | 30.3 | | Gross capital formation (per cent of GDP) | 31.0 | 30.7 | 31.1 | | Credit growth of scheduled commercial banks | 11.5 | 12.3 | 13.5 | | Combined gross fiscal deficit (per cent of GDP) | 7.8 | 7.4 | 7.1 | | Central government gross fiscal deficit (per cent of GDP) | 4.8 | 4.4 | 4.3 | | Repo rate (end-period) | 6.25 | 5.75 | - | | Yield on 91-days treasury bills (end-period) | 6.5 | 6.0 | 6.4 | | Yield on 10-year central government securities (end-period) | 6.6 | 6.4 | 6.5 | | Overall balance of payments (US$ billion) | 4.1 | 17.0 | 24.1 | | Merchandise exports growth | -0.2 | 3.5 | 5.0 | | Merchandise imports growth | 4.6 | 4.5 | 5.5 | | Current account balance (per cent of GDP) | -0.8 | -1.0 | -1.0 | Notes: GNDI: Gross National Disposable Income.
@: NSO Second Advance Estimates;
*: Average CPI Inflation in 2024-25 (up to February).
Sources: RBI staff estimates; and Survey of Professional Forecasters (March 2025). | The baseline forecasts are subject to several upside and downside risks. The upside risks emanate from continuing geopolitical conflicts and resultant supply disruptions; volatility of energy prices; and adverse weather events. The downside risks could emanate from an early resolution of geopolitical conflicts; adherence to fiscal consolidation and debt path; further correction in global crude and commodity prices in case of slowing global demand; and improvement in supply conditions. I.3 The Outlook for Growth Domestic economic activity remains strong supported by revival in consumption as well as government’s capex push. Pick up in private consumption, upturn in agricultural activity, continuing resilience of the services sector, high capacity utilisation, healthy balance sheets of banks and corporates, and government’s continued thrust on capital expenditure augur well for the growth outlook. Uncertainty about global trade owing to rising protectionist measures, persistent geopolitical tensions, rising supply chain pressures, and volatile global financial conditions, however, render the outlook uncertain. Turning to the key messages from forward-looking surveys, consumer confidence (the current situation index) improved in the pessimistic territory in March 2025 vis-à-vis the previous round, driven by improved sentiments across all survey parameters6. Consumers’ optimism for the year ahead, measured by the future expectations index, strengthened further and maintained its resilience in the optimistic territory (Chart I.7). Reserve Bank's industrial outlook survey results reveal that business optimism in the manufacturing sector for Q1:2025-26 moderated marginally, which is partly seasonal (Chart I.8a). The services and infrastructure companies, on the other hand, remained optimistic about the overall business situation in Q1:2025-26 (Charts I.8b and I.8c). Recent surveys by other agencies indicate a mixed picture on business expectations relative to the previous round (Table I.4). In the PMI surveys for March 2025, manufacturing firms remained upbeat about the year ahead though sentiments moderated for services firms. Professional forecasters polled in the March 2025 round of the Reserve Bank’s survey expected real GDP growth at 7.0 per cent during the last quarter of 2024-25. Growth is expected at 6.5-6.7 per cent during Q1-Q4:2025-26 (Chart I.9 and Table I.3). Real GDP growth was higher at 6.2 per cent in Q3:2024-25 as compared with 5.6 per cent in Q2. Taking into account the baseline assumptions, survey indicators and model forecasts, real GDP growth is expected at 6.5 per cent in 2025-26 – 6.5 per cent in Q1; 6.7 per cent in Q2; 6.6 per cent in Q3 and 6.3 per cent in Q4 – with risks evenly balanced around this baseline path (Chart I.10 and Table I.3). Assuming a normal monsoon and no major exogenous or policy shocks, structural model estimates for 2026-27 indicate real GDP growth at 6.7 per cent, with Q1 at 6.5 per cent, Q2 at 6.4 per cent, Q3 at 6.8 per cent and Q4 at 6.8 per cent. | Table I.4: Business Expectations Surveys | | Item | NCAER Business Confidence Index (January 2025) | FICCI Overall Business Confidence Index (November 2024) | Dun and Bradstreet Composite Business Optimism Index (April 2025) | CII Business Confidence Index (March 2025) | | Current level of the index | 138.4 | 62.5 | 120.2 | 63.7 | | Index as per previous survey | 134.3 | 67.3 | 114.4 | 66.2 | | % change (q-o-q) sequential | 3.0 | -7.1 | 5.1 | -3.8 | | % change (y-o-y) | 8.5 | -6.6 | 11.2 | -6.8 | Notes: 1. NCAER: National Council of Applied Economic Research.
2. FICCI: Federation of Indian Chambers of Commerce & Industry.
3. CII: Confederation of Indian Industry.
4. Dun and Bradstreet Composite Business Optimism Index is for Q1:2025-26, CII Business Confidence Index is for Q4:2024- 25, FICCI Overall Business Confidence Index is for Q2:2024-25, and NCAER Business Confidence Index is for Q3:2024-25
Sources: NCAER, FICCI, CII and Dun & Bradstreet Information Services India Pvt. Ltd. |

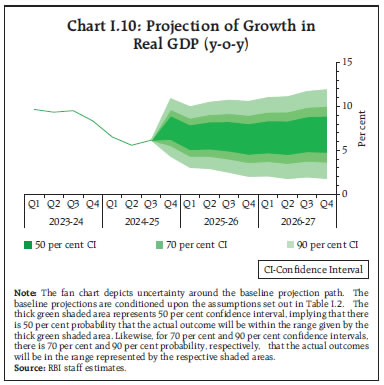 There are upside and downside risks to this baseline growth path. The upside risks emanate from revival in corporate investment cycle; improving business sentiments; faster global disinflation; quick resolution of global trade related issues; continued softening of global commodity prices; and an early resolution of the geopolitical conflicts. On the contrary, increasing trade fragmentation due to protectionist policies including higher tariffs; further escalation in geopolitical tensions; volatility in international financial markets; frequent weather-related disturbances; and supply chain disruptions pose downside risks to the baseline growth path. I.4 Balance of Risks The baseline projections of growth and inflation are based on the set of assumptions related to the likely path of key domestic and global macroeconomic variables which are set out in Table 1.2. These baseline assumptions are, however, subject to uncertainties emanating from reciprocal and retaliatory tariffs owing to protectionist trade policies adopted by major economies, prolonged geopolitical conflicts, volatility in global financial and commodity markets and possibility of adverse climate events. Against this backdrop, this section explores the plausible alternative scenarios to assess the balance of risks around the baseline projections of inflation and growth. (i) Global Growth Uncertainties Global economic activity remained steady in H2:2024, albeit marred by sluggish growth recorded by some Asian and European economies as weakness in manufacturing and trade exports offset the robust growth momentum in the United States. Going forward, however, global growth is prone to considerable uncertainties. Trade tensions and geopolitical conflicts between major economies are bound to create uncertainties in global financial markets, trigger a slowdown in global trade and create disruptions in supply chains. Additionally, protectionist trade policies including reciprocal tariffs will further fragment global trade and have an adverse impact on growth prospects leading to potential increase in input costs for businesses. Major central banks could also diverge in the pace and direction of monetary policy actions in achieving the last mile of disinflation, inducing higher volatility in global financial markets with spillover effects on EMEs. Global economic outlook is also subject to headwinds from fiscal sustainability concerns, occurrence of extreme weather events and technological disruptions. If some of these scenarios materialise, and if global growth turns out to be 100 bps lower than assumed in the baseline, domestic growth and inflation could be lower by around 30 bps and 15 bps, respectively, in comparison with the baseline projections. However, if there is a faster recovery in global trade owing to quicker resolution of trade related issues between the major economies and synchronised accommodative monetary policy due to benign inflation outlook going forward, global growth prospects may improve. If global growth is higher by 50 bps relative to the baseline, domestic growth and inflation could turn out to be higher by around 15 bps and 7 bps, respectively (Charts I.11a and I.12a). 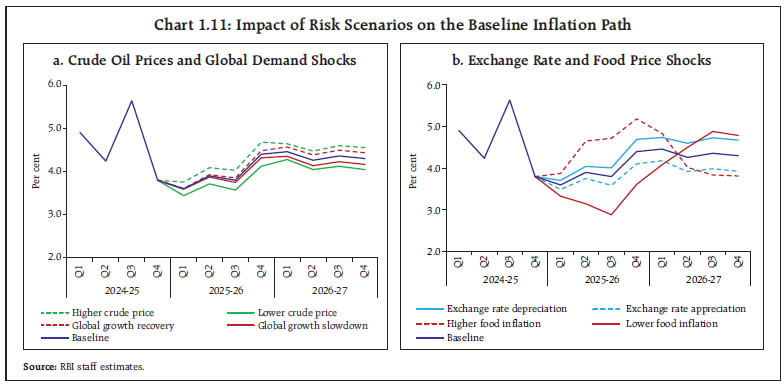 (ii) International Crude Oil Prices Global crude oil prices have exhibited a declining trend with Brent crude falling from a high of US$ 82 per barrel in early-October 2024 to an average of US$73 per barrel in March 2025. Weak global demand conditions, sustained supply increase from OPEC+ and non-OPEC countries and orderly resolution of geo-political conflicts will have a potential dampening impact on crude oil prices. In this scenario, if crude oil prices drop by 10 per cent relative to the baseline, and in case of its full pass-through to domestic product prices, inflation could be lower by around 30 bps with a boost of 15 bps to India’s real GDP growth. In contrast, recovery in global demand, and restriction in oil supplies due to continuation of geo-political tensions may put upward pressure on crude oil prices. In a scenario, when crude oil prices are higher by 10 per cent than the baseline assumption, domestic inflation may turn out to be higher by 30 bps and growth may be weaker by around 15 bps. (Charts I.11a and I.12a). (iii) Exchange Rate The Indian Rupee depreciated vis-à-vis the US dollar during October 2024-March 2025, primarily reflecting the uncertainties due to disruptions in global trade, strengthening of the US dollar and capital outflows reflecting ‘flight to safety’. Going ahead, restrictive monetary policy by the US Federal Reserve than what has been currently factored in by the financial markets could further lower the attractiveness of EME assets. Rising trade protectionism, currency war threats, and higher international crude oil prices are also some of the factors that may exert downward pressure on the Indian rupee. In this scenario, if INR depreciates by 5 per cent over the baseline, inflation could rise by around 35 bps while GDP growth could benefit by around 25 bps through the trade channel in the short term. On the other hand, the Indian economy exhibits continued resilience in growth with a stable inflation outlook and is expected to contribute to revival of global demand conditions. These developments, along with faster resolution of trade protectionism and quicker than anticipated monetary policy easing by major economies, would lead to strengthening of the Indian Rupee. In this scenario, if the INR appreciates by 5 per cent relative to the baseline, inflation and GDP growth could moderate by around 35 bps and 25 bps, respectively (Charts I.11b and I.12b). 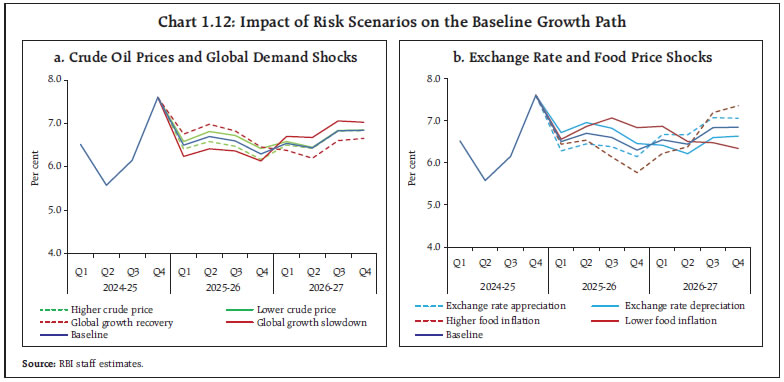 (iv) Food Inflation Food inflation witnessed moderation in H2:2024-25 after scaling its peak in October 2024, primarily driven by sharp seasonal correction in vegetable prices, lower cereals and pulses inflation and deflation in spices. Going ahead, food prices may soften faster supported by robust kharif crop production and likely bumper rabi arrivals. In such a scenario, headline inflation may moderate by around 50 bps over the baseline. On the other hand, sudden reversal in the prices of perishable food items and reduction of agricultural yields due to adverse climatic conditions may exert upward pressure on food prices. These factors could lead to higher headline inflation by 50 bps as compared to the baseline (Charts I.11b and I.12b). I.5 Conclusion Domestic economic activity is on a recovery path and is expected to remain resilient backed by consumption demand. It needs to be recognised that India’s forte is its high growth potential and robust macroeconomic fundamentals. Government's push for consumption and capex, resilient services sector, robust outlook of agricultural sector aided by strong corporate and bank balance sheets provide impetus to the growth momentum, going forward. The measures announced in the Union Budget 2025-26 augur well for improving domestic consumption. Moreover, the adherence to fiscal consolidation and debt path without compromising on the quality of expenditure will help in improving sovereign ratings, attracting capital inflows, easing financial conditions, and improving overall sentiment and outlook. Well-coordinated fiscal and monetary policy working in tandem could undoubtedly generate improved outcomes in terms of better growth-inflation balance. The recent tariff announcements by US administration have hightened policy uncertainty posing new headwinds for global growth and inflation. While India cannot remain immune to these developments, the progress achieved on the disinflation front gives headroom to monetary policy to focus on balancing the growth-inflation outcome. _________________________________________________________________________________
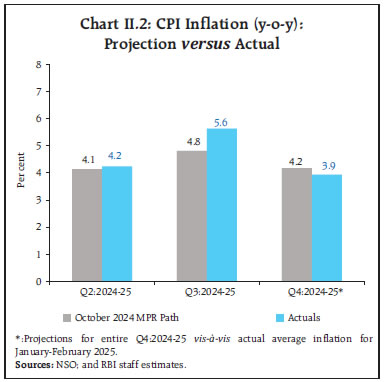
II. Prices and Costs Headline inflation has been marked by considerable volatility during H2:2024-25, engendered by overlapping food price shocks. As the impact of shocks receded, a sharp correction followed, resulting in headline inflation declining below the target rate of 4 per cent by February 2025. Core inflation pressures were muted in H2, though February saw a notable pick-up. Industrial and farm input costs remained subdued. Nominal rural wage growth stayed elevated, driven by agricultural wages, while the organised sector staff cost growth decelerated. Movements in headline consumer price index (CPI) inflation1 since August 2024 were marked by considerable volatility engendered by overlapping food price shocks that pushed up headline inflation above the upper tolerance threshold of 6 per cent in October 2024. As the impact of shocks receded, a sharp correction followed, resulting in headline inflation declining below the target rate of 4 per cent by February 2025. Headline CPI inflation surged from 3.7 per cent in August to 6.2 per cent by October 2024, propelled by a jump in food inflation owing to a spike in prices of vegetables, and oils and fats. In the ensuing months, as food inflation eased on correction in vegetable prices, headline inflation softened successively to 4.3 per cent in January 2025 and further to 3.6 per cent in February. Reflecting the volatility in food inflation, the contribution of the food and beverages group (with a weight of around 46 per cent in the CPI basket) to headline inflation fell from an elevated 74 per cent in October 2024 to 50 per cent in February 2025. Deflation in the fuel group persisted, though the rate of deflation moderated from (-)5.3 per cent in August 2024 to (-)1.3 per cent in February 2025. Core (CPI excluding food and fuel) inflation2 remained muted, moving in a range of 3.5-3.8 per cent during September 2024 to January 2025, before firming up to 4.1 per cent in February 2025 (Chart II.1). The Reserve Bank of India (RBI) Act, 1934 (amended in 2016) enjoins the RBI to set out deviations of actual inflation outcomes from projections, if any, and explain the underlying reasons thereof. The October 2024 MPR had projected inflation at 4.8 per cent in Q3:2024-25 and 4.2 per cent in Q4:2024-25 (Chart II.2). The deviations of the actual inflation outcomes from the projections were bi-directional – with inflation being higher than projections in Q3:2024-25 and lower than projections in Q4. The undershoot of projections by 80 basis points in Q3 arose primarily from an unanticipated transitory spike in prices of tomatoes due to weather disruptions and a rapid pick-up in domestic edible oil prices due to higher costs of imports. Thereafter, with vegetables prices registering a sharper than anticipated winter season price correction during January and February 2025, realised headline inflation at 3.9 per cent in Q4 so far (up to February) turned out to be 25 bps lower than the projections set out in the October 2024 MPR. 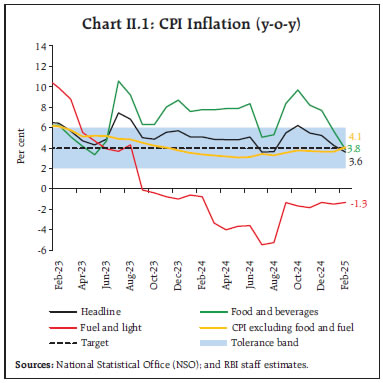
 II.1 Consumer Prices The surge in headline inflation by 1.8 percentage points from 3.7 per cent in August 2024 to 5.5 per cent in September came from an uptick in price momentum3 along with sharp unfavourable base effects (1.1 percentage points). The headline CPI momentum quickened pace in October – primarily coming from a sharp increase in food prices – that firmed up headline inflation to 6.2 per cent, breaching the upper tolerance threshold, notwithstanding significant favourable base effects. Thereafter, with a sharp correction in the food price momentum, headline momentum began to register consecutive declines during November 2024-February 2025, resulting in a softening of headline inflation by 2.6 percentage points during this period to touch a low of 3.6 per cent in February. This decline was despite a sharp pick-up in core (CPI excluding food and fuel) momentum in February (Chart II.3). 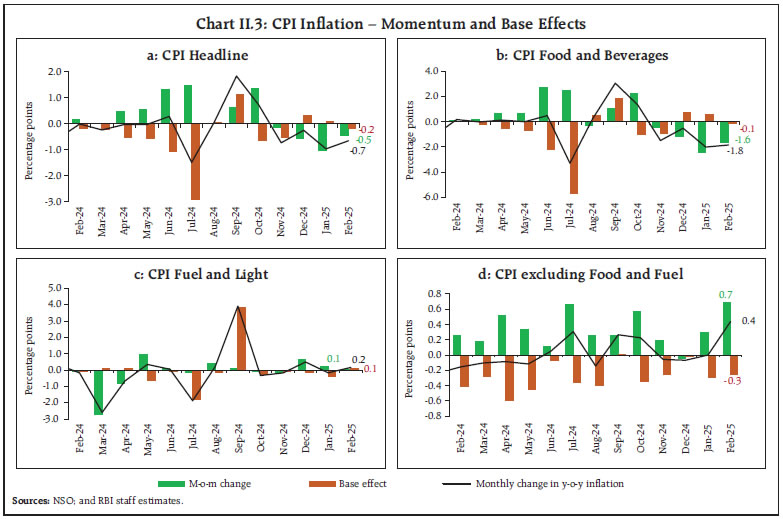
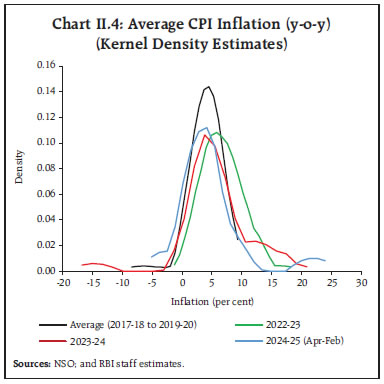 The distribution of CPI inflation in 2024-25 so far (April 2024-February 2025) vis-à-vis 2023-24 indicates high positive skew and relatively higher standard deviation, pointing to the outsized impact of continuing sectoral supply side shocks in engendering the persistence of headline inflation (Chart II.4). The pick-up in inflation during September-October was also marked by widening of inflation divergence across CPI sub-groups, reflecting the sharp increase in inflation across a few sub-groups. The pullback in inflation pressures across these sub-groups since December was also followed by a narrowing of the inflation divergence across quantiles (Chart II.5). An analysis of spatial inflation dynamics shows that even with sharp swings in inflation due to supply shocks, inflation across states has tended to converge to the national average during the Flexible Inflation Targeting (FIT) period (Box II.1). 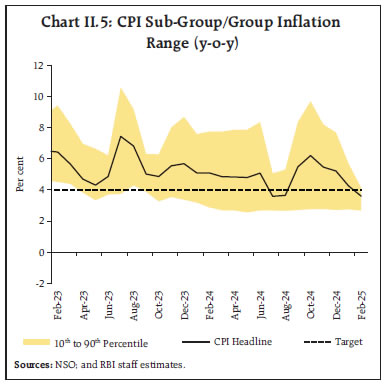
Box II.1: Spatial Inflation Convergence in India The period since the 2020s has been characterised by persistent inflationary pressures due to multiple overlapping shocks. It has also raised concerns about whether they have fundamentally altered spatial inflation dynamics in India – in terms of its volatility and convergence over time – with its attendant implications for monetary policy and the credibility of the 4 per cent CPI headline inflation target. Against this backdrop, spatial convergence properties of overall CPI inflation since the implementation of FIT in 2016 are examined, with a focus on the post-COVID period. Monthly year-on-year (y-o-y) changes in the CPI Combined Index as the measure of inflation across 35 Indian states and union territories spanning October 2016 to December 20244 are used for the analysis. It is observed that the headline inflation dispersion across states has moderated over time (Chart II.1.1). The spatial convergence properties are further examined by (a) panel unit root tests such as Levin-Lin-Chu and Im-Pesaran-Shin for stationarity, and (b) the beta (β) convergence analysis to ascertain whether states with higher initial differentials with the national inflation level experienced a faster decline in inflation over time, i.e., convergence to a common steady state. Accordingly, a panel regression framework is used with the following specification (1). 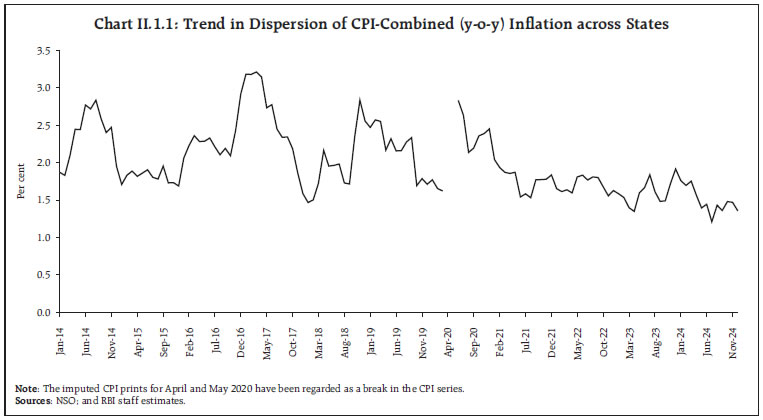
 Where Δπdiffit is the rate of change in inflation differential of state i in period t with respect to the national level in the same period, πdiffit–1 is the one-period lagged inflation differential, β is the coefficient measuring speed of convergence, and α and ε are the constant and error terms, respectively. Additionally, the analysis performs (c) sigma (σ)-convergence test, for testing the movements of the cross-sectional dispersion (standard deviation) of inflation5 over time; and (d) the log-t and convergence club tests, for checking whether all units converge to a single equilibrium or whether they are divided into clusters or ‘clubs’ (presence of multiple equlibria). The results for both panel unit root tests reject the null hypothesis of ‘panels contain unit roots’, implying stationarity, i.e., supporting inflation convergence across states. Similarly, the results of the β-convergence test using a pooled ordinary least square (OLS)6 regression framework show negative and statistically significant beta coefficients for both FIT and post-COVID periods, confirming the existence of spatial inflation convergence to the national level. Furthermore, the σ-convergence test, which involves regressing the standard deviation of inflation across states on a time trend, yields a negative and significant coefficient, implying a decline in inflation dispersion over time, including the post-COVID period. The Phillips and Sul log-t test also indicates a convergence for the FIT period, with the club convergence test confirming the presence of a single club containing all 35 states (Table II.1.1). These findings indicate an ongoing convergence of inflation across states towards the national average with lower dispersion despite the impact of multiple adverse supply side shocks since early 2020, thereby indicating economic integration and anchoring of inflation expectations during FIT. | Table II.1.1: Results of Spatial Convergence Tests | | a. Panel Unit Root Tests | | Tests | Statistic | Null Hypothesis | | Levin–Lin–Chu unit-root test | -12.021*** | Panels contain unit roots | | Im–Pesaran–Shin unit-root test | -11.634*** | All panels contain unit roots | | b. Beta-convergence analysis | | Explanatory Variables | FIT
(October 2016 - December 2024) | Post-COVID
(June 2020 - December 2024) | | Lagged Inflation Differential | -0.040*** | -0.060*** | | | (0.011) | (0.009) | | Constant | -0.083 | -0.001 | | | (0.247) | (0.358) | | c. Sigma-convergence analysis | | Time Trend | -0.002*** | -0.007*** | | | (0.0003) | (0.0009) | | Constant | 3.224*** | 6.769*** | | | (0.266) | (0.656) | | d. Phillips and Sul log-t test | | log(t) | -0.878 | | | (0.829) | | t-stat | -1.059 | | No. of clubs identified | 1 (containing all 35 states) | | Note: Figures in parentheses indicate robust standard errors. *** and ** denote significance at 1% and 5% levels, respectively. | Reference: Ray, S., Suganthi, D., Bhatia, S., & George, A. T. (2025). Spatial Inflation Convergence in India, mimeo |
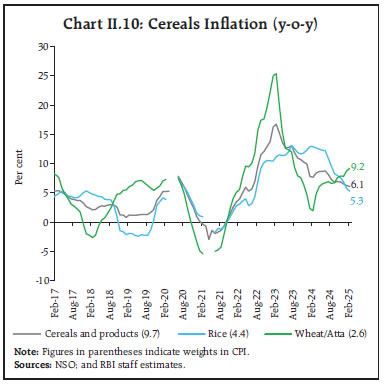
CPI diffusion indices (DIs)7 strengthened while remaining in the expansionary zone from September to December 2024. Following a dip in August, the headline CPI DI saw a steady sequential rise from September, largely driven by the goods subcomponent. Although remaining in the expansionary zone in January-February 2025, the headline CPI DI declined sharply, signalling a slowdown in incidence of price increases in the CPI basket. This moderation was primarily led by movements in CPI goods, while CPI services edged up (Chart II.6a). Threshold DIs8 – for price increases in excess of 4 per cent as well as 6 per cent on a month-on-month seasonally adjusted annualised rate (m-o-m saar) basis – continued to remain well below the 50-level mark, indicating that the extent of price increases across a majority of the CPI items continued to remain muted (Chart II.6b). II.2 Drivers of Inflation A historical decomposition of inflation using a vector autoregression (VAR)9 model indicates that the sharp moderation in inflation in Q4:2024-25 came from the reversal of supply side shocks seen in Q3 (Chart II.7a).  Goods inflation (with a weight of 76.6 per cent in overall CPI) contributed around 85 per cent of headline inflation, on average, between September 2024 and January 2025, and services (with a weight of 23.4 per cent) the remaining 15 per cent. In February 2025, however, the contribution of goods to overall inflation fell sharply to around 76 per cent following the large decline in CPI food inflation, while services contribution edged up (Chart II.7b). The contribution of perishable items (non-durable with a 7-day recall10) – which include vegetables, spices, fruits, and other food items such as milk, meat and fish, and prepared meals – jumped up in Q3:2024-25, contributing to the stickiness in headline inflation, before falling in January-February 2025. On the other hand, after the contribution of semi-perishables (non-durable goods with a 30-day recall) to overall inflation declined in Q3 – driven primarily by softening of inflation in pulses and sugar even as personal care items remained sticky – it started firming up again in January-February 2025. The contribution of durable items (goods with a 365- day recall) to overall inflation also edged up in January- February 2025 after remaining mostly steady during September-December 2024, reflecting the rising and elevated price inflation in gold and silver. The contribution of imported components11 to headline inflation registered a sequential increase since October and was at 21 per cent in February 2025 (a contribution of 0.8 percentage points to the headline inflation rate of 3.6 per cent) driven primarily by a pick-up in international prices of gold and silver, and the depreciation of the rupee (Chart II.7c). CPI Food Group Food and beverages (weight of 45.9 per cent in the CPI basket) group exhibited high volatility in H2:2024-25 of 2024-25 so far. The month of September witnessed a resurgence of price pressures, which got further accentuated in October. Tight supply of vegetables caused by adverse weather conditions, along with price pressures in oils and fats due to increased import duties on crude and refined edible oils combined with rising international prices, led to the surge in food inflation. Vegetable prices corrected sharply from November onwards with fresh crop arrivals and seasonal winter easing, which, along with easing of price pressures in pulses, led to a substantial softening of food inflation to 3.8 per cent by February 2025 (Chart II.8). The food price build-up in 2024-25 so far (up to February) has been significantly lower than last year and the historical levels. The drivers of food price build-up this year, however, have changed since last year. While oils and fats, fruits, prepared meals and non-alcoholic beverages registered a higher price build-up, those in pulses, cereals, sugar and eggs were noticeably lower than last year. In contrast to last year, spices and vegetable prices, on average, registered a substantial decline, although vegetables witnessed large intra-year price volatility. A softer price build-up was also observed in meat and fish, and milk (Chart II.9). 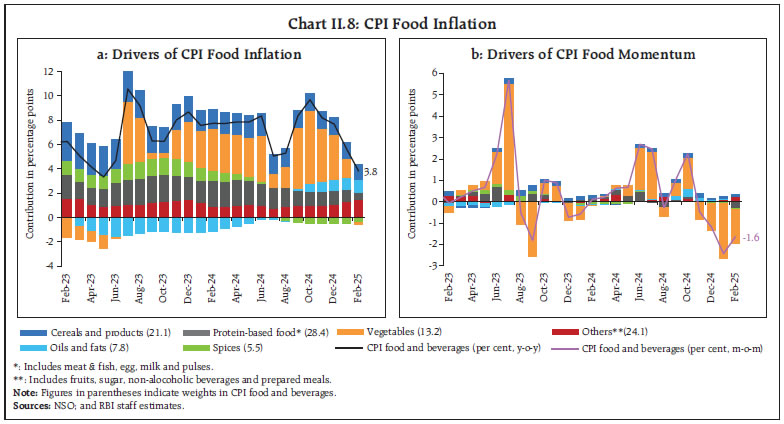 Cereals inflation (weight of 9.7 per cent in the CPI and 21.1 per cent in the food and beverages group) remained elevated, though it moderated from 6.9 per cent in October 2024 to 6.1 per cent in February 2025 (Chart II.10). This softening primarily came from rice due to improved supply conditions as reflected in higher production (6.7 per cent as per the second advance estimate (AE) 2024-25 over 2023-24) and higher mandi arrivals compared to the previous year, despite easing of export restrictions during September-October 2024. The comfortable buffer stocks of rice (8.7 times the norm as on March 16, 2025), along with the direct sale of rice to state governments, other government agencies, and continued retail sales, have aided in easing supply conditions and containing price pressures. Wheat inflation, on the other hand, hardened from 6.7 per cent in September 2024 to 9.2 per cent in February 2025 on tight supply conditions as reflected in lower mandi arrivals and low buffer stocks (0.9 times the norm as on March 16, 2025). In order to contain price pressures, supply management measures were implemented by the government, including the sale of 2.5 million tonnes of wheat through e-auctions under the Open Market Sale Scheme (OMSS) till March 2025 at a fixed reserve price, downward revision of the existing stock limit in December 2024 and further in February 2025, and continued restrictions on wheat exports. Second AE of 2024-25 agricultural production shows improved rabi wheat production (1.9 per cent increase over 2023-24). 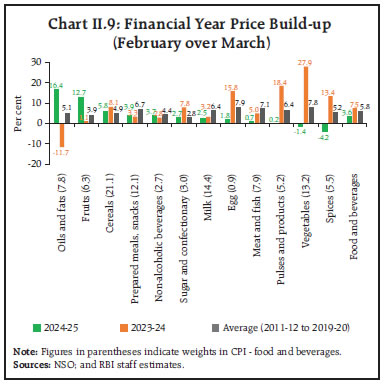
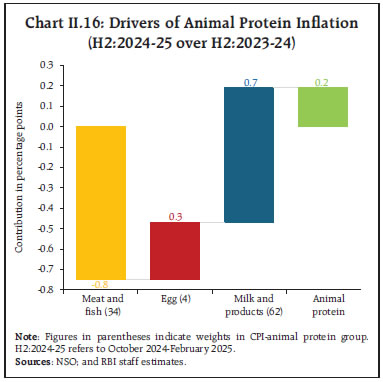
 Vegetables (weight of 6.0 per cent in the CPI and 13.2 per cent in the food and beverages group) inflation reached a peak at 42.2 per cent in October 2024, induced by multiple and overlapping weather shocks, marking another year of volatile and elevated inflation. Thereafter, vegetables inflation declined sharply to (-)1.1 per cent by February 2025, aided by an unusually strong winter price correction during November 2024-February 2025 on account of robust production and fresh market arrivals (Chart II.11). Among key vegetables, potato prices increased (on y-o-y basis) by an average of around 66.2 per cent during September-December 2024 on account of lower production in 2023-24 [(-)5.0 per cent over 2022-23]. The steep price build-up due to lower production last year, however, was corrected subsequently in January- February 2025, with increased production for 2024-25 (4.4 per cent as per the first AE 2024-25 over 2023-24) and higher market arrivals. Onion price increases also moderated sharply on a y-o-y basis– to 30.4 per cent in February 2025 from 66.1 per cent in September 2024 – due to higher production (18.9 per cent as per the first AE 2024-25 over 2023-24) and increased late kharif arrivals even as export restrictions were relaxed. To contain price pressures, the government released onions from its buffer stocks through open market sales at a subsidised rate of ₹35 per kg across major consumption centres in September 2024. Furthermore, a special train, Kanda Express, was initiated in October 2024 for faster distribution from surplus to deficit states. Tomato prices, after increasing sharply by 161 per cent on a y-o-y basis in October 2024 from a deflation of (-)47.9 per cent in August 2024 on the back of lower mandi arrivals in southern states induced by unseasonal rainfall, corrected sharply recording a deflation of (-)28.5 per cent in February 2025 with improved supply. 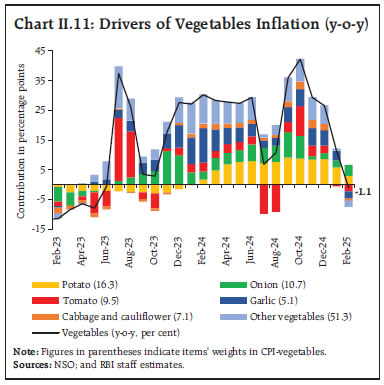 Within vegatables excluding TOP (tomato, onion, and potato), garlic experienced persistently elevated inflation, averaging around 75 per cent during September-December 2024 due to modest production growth in 2023-24 (2.3 per cent over 2022-23, following a decline of (-)8.1 per cent in 2022-23 over 2021-22). Inflationary pressures in non-TOP vegetables, thereafter, eased by February 2025, led by a sharp moderation in garlic prices on the back of improved production (3.2 per cent growth as per the first AE 2024-25 over 2023-24). Consequently, the price build-up in both TOP and non-TOP categories remained higher than the historical pattern until December 2024. Thereafter, a sharp broad-based correction in vegetable prices resulted in a marked fall in the price build-up across TOP and non-TOP categories (Chart II.12). 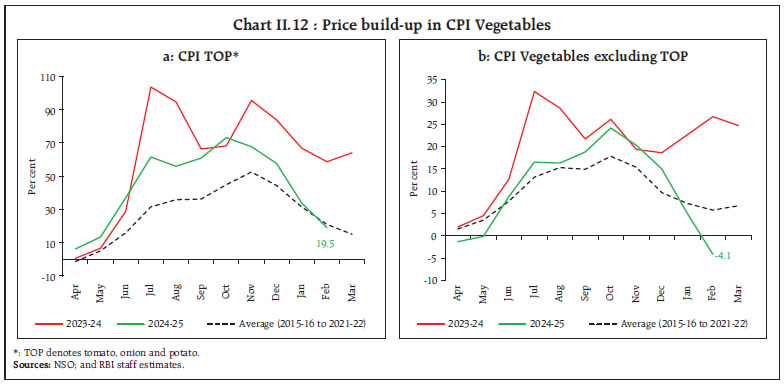 Inflation in fruits (weight of 2.9 per cent in the CPI and 6.3 per cent within the food and beverages group) remained elevated since August 2024. In February 2025, it surged to 14.8 per cent, the highest print since October 2014, driven by a pick-up in price pressures, compounded by an unfavourable base effect. The price build-up in fruits this year has been substantially higher than last year and its historical trend (Chart II.13). The price pressures were primarily driven by coconut on the back of tight supply conditions attributed to lower production across major coconut-growing states, coupled with high festive demand. Since December 2024, apple prices have also hardened, reflecting declining imports towards the end of the apple marketing season in India. After moderating during September- December 2024, banana inflation increased sharply in February 2025, largely reflecting an unfavourable base effect. Groundnut prices, however, remained in deflation since August 2024 on account of higher kharif production (20.4 per cent as per the second AE 2024-25 over 2023-24). 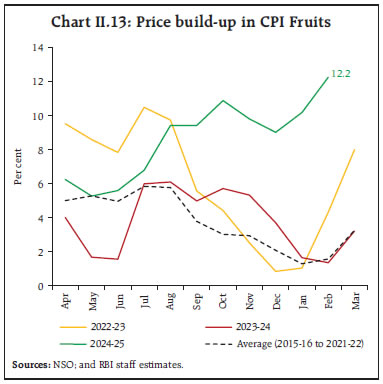 Pulses, the primary source of plant-based protein (weight of 2.4 per cent in the CPI and 5.2 per cent in the food and beverages group), which registered double digit inflation during April-August 2024, witnessed sustained softening thereafter to (-)0.3 per cent in February 2025 on higher production (2.8 per cent for tur and 28 per cent for moong as per the second AE 2024-25 over 2023-24) and robust imports. Inflation in gram, however, remained elevated despite improved rabi production [4.5 per cent in 2024-25 as per the second AE over 2023-24 following (-)10.0 per cent in 2023-24 over 2022-23]. On the whole, the price build-up in pulses remained lower during April 2024-February 2025 as compared to the previous year, reflecting government interventions towards easing supply conditions through the retail sale of subsidised chana, moong and masur dals under the brand name Bharat dal and the extension of free import of yellow peas in stages till May 31, 2025, and tur till March 31, 2026 (Chart II.14). Relatedly, the stock-to-use ratio of 6.3 during September 2024-March 2025, in contrast to 5.9 over the same period in 2023-24, is indicative of improving supply conditions of pulses (Chart II.15). 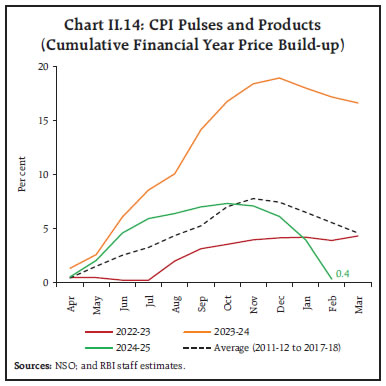 Prices of animal-based protein items increased marginally during H2:2024-25, driven by milk and products, and eggs. On a y-o-y basis, price inflation in meat and fish (weight of 3.6 per cent in CPI and 7.9 per cent in CPI food and beverages group) increased sequentially to an average of 5.3 per cent during December 2024-January 2025 before moderating to 2.1 per cent in February 2025 on account of reduced demand for chicken due to bird flu in some states. Eggs (weight of 0.4 per cent in CPI and 0.9 per cent in the CPI food and beverages group) exhibited elevated and volatile price movements, from an average of 6.5 per cent during April-September 2024 to 4.8 per cent in November 2024 before increasing to 6.9 per cent in December on account of strong winter demand and increased feed costs. In January-February 2025, egg inflation moderated on account of a sharp correction in prices due to a mild winter and bird flu concerns that reduced demand, coupled with a favourable base effect. Inflation in milk and products (weight of 6.6 per cent in the CPI and 14.4 per cent within the food and beverages group) remained subdued at around 2.9 per cent during September 2024-February 2025 on account of lower input costs (Chart II.16). 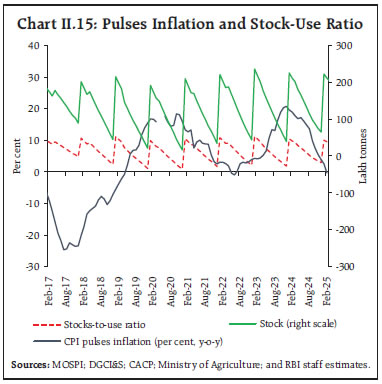
 After recording 19 consecutive months of deflation, oils and fats (weight of 3.6 per cent in the CPI and 7.8 per cent within the food and beverages group) price inflation increased from 2.5 per cent in September 2024 to 16.4 per cent by February 2025. The sharp pick-up in edible oil prices was triggered by a hike in basic customs duty on crude and refined edible oils by 20 percentage points in September 2024, along with an uptick in international edible oil prices. On a month-on-month basis, however, the rate of price increases has softened since November 2024, reflecting improved supply conditions on account of higher domestic production of oilseeds (8.4 per cent as per the second AE 2024-25 over 2023-24) and easing of global edible oil prices (Chart II.17). Within the oils and fats sub-group, ghee and butter price inflation remained broadly moderate, indicative of the transmission of lower milk inflation. Sugar and confectionery (weight of 1.4 per cent in the CPI and 3.0 per cent in the food and beverages group) inflation moderated in 2024-25 so far on the back of higher stocks and fresh arrivals during the cane crushing season. However, lower estimated kharif production [(-)4.0 per cent as per the second AE 2024-25 over 2023-24] and partial removal of export restrictions, along with removal of restrictions on sugar diversion for ethanol production in August 2024, pose upward risks to sugar prices. Among other food items, deflation in spices deepened from (-)1.4 per cent in July 2024 to an average of (-)7.4 per cent during November and December 2024, primarily driven by jeera and dry chillies, before narrowing to (-)5.8 per cent in February 2025. Inflation in prices of prepared meals has witnessed a sequential pick-up in H2 so far, though it remains contained. Retail Margins The absolute retail price margins, defined as the difference between retail and wholesale prices12 in the case of cereals, remained steady during October 2024-January 2025 before witnessing a marginal deceleration in February-March 2025, reaching ₹4.2 per kg, the lowest since December 2020. Retail price margins of pulses edged up during October-November 2024 but thereafter declined, hovering around ₹9.2 per kg till February 2025 before a marginal uptick to ₹9.3 per kg in March 2025. The retail price margins of edible oils witnessed a gradual uptick during October 2024-February 2025 due to firming up in the margins of all edible oils – soybean, sunflower, mustard, and refined oils. Thereafter, retail margins declined to ₹10.1 per kg in March 2025, with moderation in retail and wholesale prices of edible oils. In case of TOP vegetables, retail price margins registered a sequential decline since October 2024 and reached ₹5.7 per kg in March 2025, primarily driven by tomato and potato (Chart II.18). 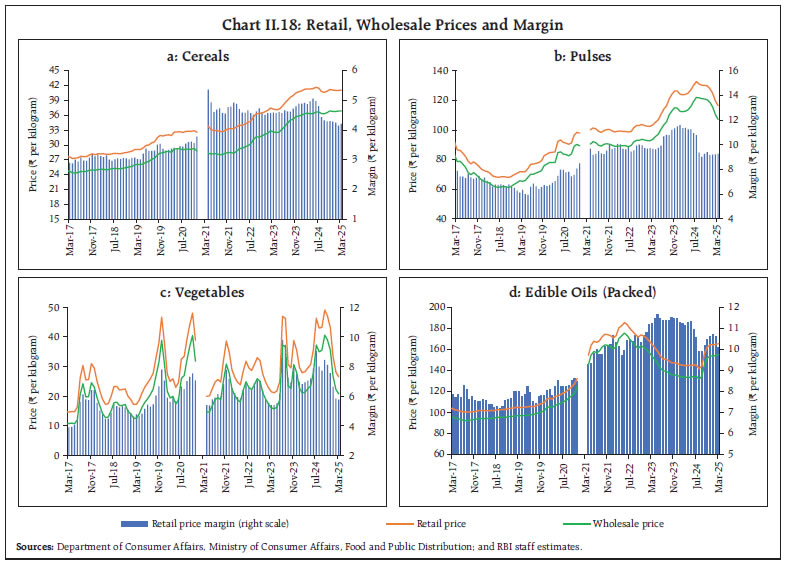 Sectoral and Spatial Distribution of Food Inflation The CPI food inflation pressures eased across both rural and urban areas since November 2024 with urban food inflation decreasing more than rural food inflation (Chart II.19).
| Table II.1: Distribution of food inflation across States/UTs: Number of states# | | Food Inflation Range | 2023-24 (Apr-Feb) | 2024-25 (Apr-Feb) | | Less than 2 per cent | 1 | 1 | | Between 2 to 4 per cent | 4 | 0 | | Between 4 to 6 per cent | 11 | 12 | | Greater than 6 per cent | 20 | 23 | #Accounted for the unification of Daman and Diu with Dadra & Nagar Haveli and the formation of Ladakh as a Union Territory (UT).
Sources: NSO; and RBI staff estimates. | Food inflation pressures during April 2024-February 2025 seem to have strengthened spatially, with the number of states/UTs experiencing food inflation above 6.0 per cent on an average rising to 23 vis-à-vis 20 in the corresponding period a year ago. Sequentially, however, there has been a considerable softening in food inflation pressures across states, with the number of states experiencing food inflation in excess of 6.0 per cent reducing significantly – from a peak of 32 states in November 2024 to 05 states in February 2025 (Table II.1). CPI Fuel Group CPI fuel remained in deflation in H2:2024-25 so far, although the deflation moderated sharply from (-)5.3 per cent in August 2024 to an average of (-)1.5 per cent during September 2024-February 2025. Softer deflation in LPG due to unfavourable base effects, and that of kerosene due to a sharp pickup in price momentum in December, along with a pick-up in firewood and chips prices on a y-o-y basis, led to the narrowing of deflation in CPI fuel in H2. The movement of domestic kerosene prices largely mirrored international price movements. Domestic retail prices of LPG, however, remained unchanged during H2, despite a pick-up in international prices, contributing to its continuing deflation. Electricity prices, on a y-o-y basis, moved in a range-bound manner – rising to 5.4 per cent in September-October from 4.9 per cent in August – before edging down to 5.3 per cent in February 2025 (Chart II.20). Core CPI (CPI excluding Food and Fuel) Core inflation (CPI excluding food and fuel) edged up from a low of 3.3 per cent in August 2024 to 3.8 per cent in October and remained steady around 3.6 - 3.7 per cent during November 2024-January 2025. In February 2025, core inflation picked-up to 4.1 per cent – the highest print in 15 months – driven primarily by a sharp increase in gold prices. Exclusion-based measures of underlying inflation, which remove volatile items such as petrol and diesel, gold and silver in addition to food and fuel, also remained muted till January before witnessing a notable uptick in February, though of a lower magnitude (Table II.2). Exclusion-based CPI threshold DIs during September 2024-February 2025 point to the continuation of muted price pressures across the core CPI basket. CPI excluding food, fuel, petrol, diesel, gold and silver DI for price increases of greater than 4 per cent (m-o-m saar) remained in the contraction zone throughout H2, indicating that a majority of items exhibited price increases at a m-o-m saar of less than 4 per cent. The DI for price increases of greater than 6 per cent (m-o-m saar) also remained deep in the contractionary zone during September 2024-February 2025, indicating that most of the items in CPI core exhibited price increases below the 6 per cent m-o-m saar threshold during this period (Chart II.21). Though still in contraction zone, the month of February saw a notable uptick in threshold DIs. | Table II.2: Exclusion-based Measures of Inflation (y-o-y) | | Period | CPI excluding food and fuel (47.3) | CPI excluding food fuel petrol diesel (45.0) | CPI excluding food fuel petrol diesel gold silver (43.8) | | Jan-24 | 3.5 | 3.7 | 3.4 | | Feb-24 | 3.4 | 3.5 | 3.3 | | Mar-24 | 3.3 | 3.4 | 3.2 | | Apr-24 | 3.2 | 3.4 | 3.0 | | May-24 | 3.1 | 3.3 | 2.8 | | Jun-24 | 3.1 | 3.3 | 2.8 | | Jul-24 | 3.4 | 3.6 | 3.1 | | Aug-24 | 3.3 | 3.5 | 3.0 | | Sep-24 | 3.5 | 3.8 | 3.2 | | Oct-24 | 3.8 | 4.0 | 3.3 | | Nov-24 | 3.7 | 3.9 | 3.3 | | Dec-24 | 3.6 | 3.9 | 3.3 | | Jan-25 | 3.6 | 3.9 | 3.2 | | Feb-25 | 4.1 | 4.3 | 3.4 | Notes: 1. Figures in parentheses indicate weights in CPI.
2. Derived as residual from headline CPI.
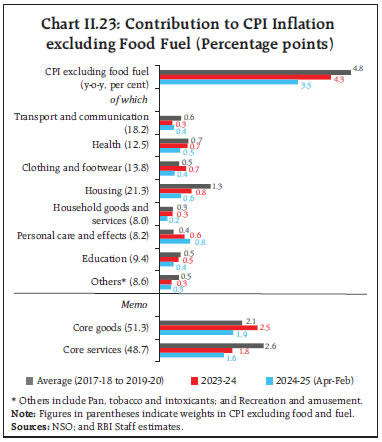
Sources: NSO; and RBI staff estimates. | Core inflation across April 2024-February 2025 exhibited some signs of higher inflation variability when compared to the previous year, but the level of inflation and its variability were much lower than other post-COVID years (Chart II.22). Core inflation pressures in 2024-25 so far, on an average, were muted and broad-based, covering both core goods and services categories. Contribution of all sub-groups/ groups (barring transport and communication, and personal care and effects) were lower compared to previous years and pre-COVID patterns (Chart II.23). 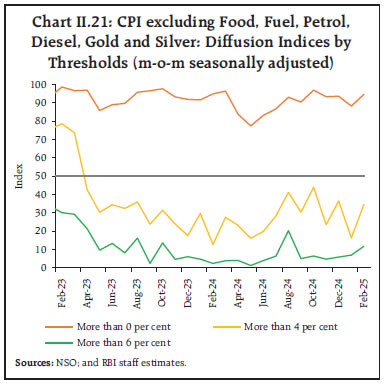

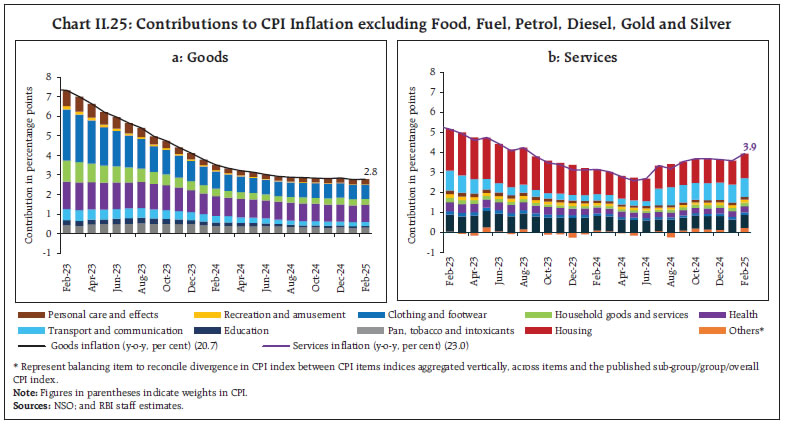
 The pick-up in core inflation between August 2024 and February 2025 was largely contributed by the personal care and effects sub-group reflecting the spike in gold and silver prices. Notably, a significant portion of the increase also stemmed from the balancing item that accounts for statistical discrepancy13. Adjusted for the pick-up in gold and silver prices, and statistical discrepancies, the increase in core inflation has been low, with the modest contribution of housing, household goods and services, transport and communication, recreation and amusement, and health, somewhat offset by the decline in contribution of education, pan, tobacco and intoxicants and clothing and footwear to overall core inflation (Chart II.24). Goods inflation arrived at by decomposing CPI excluding food, fuel, petrol, diesel, gold, and silver inflation into its goods (with a weight of 20.7 per cent in the headline CPI) and services (weight of 23.0 per cent) components, remained broadly steady in H2 so far (up to February 2025), albeit showing a marginal softening from 2.9 per cent in August-September 2024 to 2.8 per cent in October 2024, where it remained steady at that level till February 2025. The contribution of all sub-groups was also unchanged during this period (Chart II.25a). Core services inflation firmed up from 3.4 per cent in August 2024 to 3.7 per cent in February 2025. A significant part of the increase can be attributed to statistical aggregation effects14. Abstracting this, the pick-up in core services inflation was primarily driven by housing (house rent, residential building and land, water charges), health, household and transport and communication services (Chart II.25b). 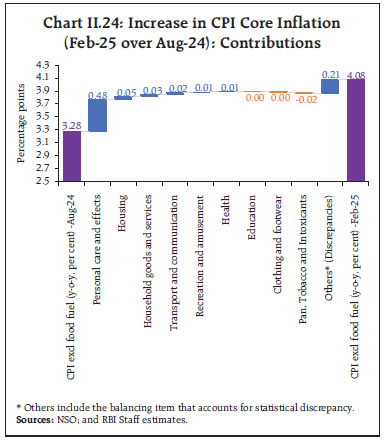
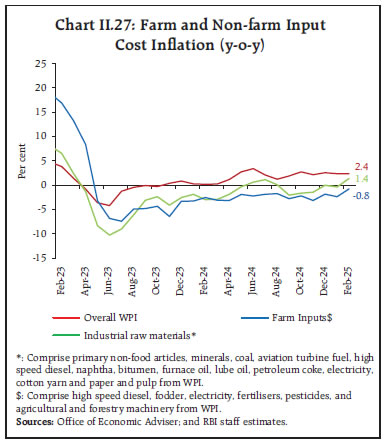
 Trimmed mean measures15 of inflation remained muted in H2. While there were variations across months, all trimmed mean measures of inflation gradually softened from October 2024 to February 2025 (Table II.3). Other Measures of Inflation CPI inflation for agricultural labourers (CPI-AL) and rural labourers (CPI-RL) registered sequential moderation since September 2024. Moreover, the gap between CPI-AL (and RL) with respect to CPI headline inflation narrowed vis-à-vis last year on significant moderation in food inflation in both CPI-AL and RL. CPI inflation for industrial workers (CPI-IW), on the other hand, was below the headline CPI inflation during the same period, primarily due to lower food inflation and steeper fuel deflation in CPI-IW vis-à-vis headline CPI. Wholesale price index (WPI) inflation, year-on-year, accelerated to 2.8 per cent in October 2024, with food inflation touching a record peak of 12.1 per cent in more than a decade. Thereafter, following the moderation in food inflation, WPI inflation softened to 2.2 per cent in November. After registering an uptick to 2.6 per cent in December, WPI inflation has since then moderated and remained within a narrow range of 2.3 to 2.4 per cent during January-February 2025, as the softening in food inflation was offset by a pick-up in non-food manufactured products inflation and a narrowing of deflation in the fuel group. With overall WPI recording a pick-up during Q3:2024-25, inflation measured by deflators for gross value added (GVA) and gross domestic product (GDP) picked up. GDP deflator rose to 3.5 per cent in Q3 from 2.5 per cent in Q2 and GVA deflator rose to 3.8 per cent in Q3 from 2.3 per cent in Q2 (Chart II.26a). | Table II.3: Trimmed Mean Measures of Inflation (y-o-y) | | Month | 5% trimmed | 10% trimmed | 25% trimmed | Weighted Median | | Jan-24 | 4.7 | 4.5 | 3.9 | 3.7 | | Feb-24 | 4.6 | 4.4 | 3.7 | 3.6 | | Mar-24 | 4.7 | 4.4 | 3.6 | 3.3 | | Apr-24 | 4.6 | 4.2 | 3.5 | 3.0 | | May-24 | 4.5 | 4.2 | 3.4 | 2.9 | | Jun-24 | 4.3 | 3.9 | 3.4 | 2.9 | | Jul-24 | 3.8 | 3.7 | 3.3 | 3.0 | | Aug-24 | 3.9 | 3.7 | 3.3 | 3.0 | | Sep-24 | 4.4 | 3.9 | 3.5 | 3.0 | | Oct-24 | 4.6 | 4.1 | 3.5 | 3.0 | | Nov-24 | 4.6 | 4.1 | 3.5 | 3.2 | | Dec-24 | 4.5 | 4.1 | 3.5 | 3.1 | | Jan-25 | 4.1 | 3.7 | 3.4 | 2.9 | | Feb-25 | 3.7 | 3.5 | 3.2 | 2.9 | | Sources: NSO; and RBI staff estimates. | Similar sub-groups/items across CPI and WPI also exhibited diverse inflation movements. While WPI inflation in food sub-groups such as cereals, pulses, fruits, oils and fats, and vegetables ruled above corresponding CPI groups/subgroups, those in sugar, milk and egg prices were higher in the CPI than in the WPI. Similarly, inflation in clothing, and pan, tobacco and intoxicants was higher in the CPI measure vis-à-vis the WPI. On the other hand, fuel and light recorded a deflation in both CPI and WPI, with CPI showing a lower rate of decline. Likewise, petrol and diesel recorded a lower rate of deflation in the CPI vis-a-vis WPI (Chart II.26b). II.3 Costs Costs, as measured by WPI inflation in industrial raw materials and farm inputs, stayed largely in deflation since September 2024, primarily on account of electricity, fodder, aviation turbine fuel (ATF), high-speed diesel (HSD), and pesticides driven by easing international commodity prices (Chart II.27). The other contributory factors were non-food articles – particularly raw cotton and oilseeds – whose prices were mostly in deflation during this period. Mineral oils also remained in deflation, driven majorly by HSD, ATF, kerosene and petrol. In February 2025, however, industrial input costs increased and deflation in farm input costs decelerated with an increase in prices of furnace oil, naphtha, and paper and pulp products in the industrial sector and higher fodder and machinery costs in the agricultural sector. Minerals inflation, on the other hand, remained positive in H2:2045-25, primarily led by iron ore due to an increase in global iron ore prices on the back of higher Chinese demand and lower supply. 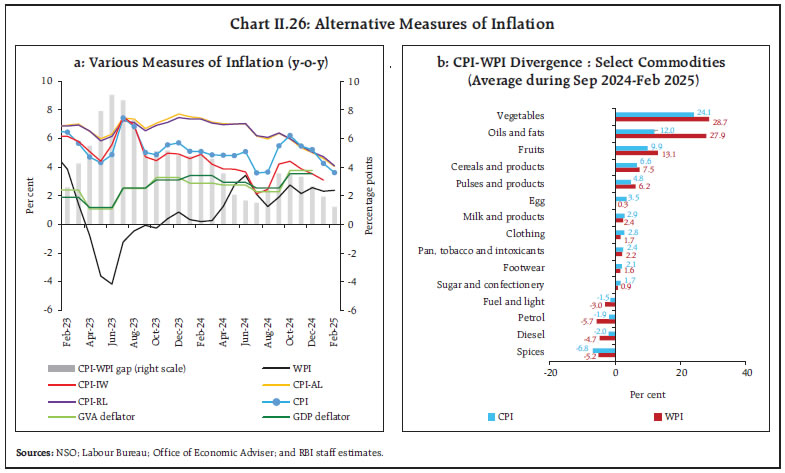
 Nominal rural wage growth averaged 6.3 per cent during October 2024-February 2025. While agricultural sector wages saw a sequential pick-up during this period, non-agricultural sector wage growth showed a deceleration (Chart II.28). Agricultural wage growth was mainly driven by horticulture workers, inland fishermen, picking workers, and ploughing and tilling workers; while that of non-agricultural wages was on account of plumbers, electricians, and LMV and tractor drivers in the rural sector.
In the organised sector, staff cost growth (y-o-y) decelerated for manufacturing and services sectors in Q3:2024-25 as compared to the previous quarter, driven by a decline in momentum of staff costs in both sectors assisted by favourable base effects (Chart II.29). On the assessment and outlook of cost conditions, manufacturing firms polled in the Reserve Bank’s enterprise surveys16 indicate that input cost pressures may soften in Q1:2025-26 but pressures from salary outgo are expected to accelerate. Manufacturing firms also anticipate growth of selling prices to decelerate in Q1 in tandem with lower input costs whereas for services firms, the input and wage cost pressures as well as selling prices are likely to pick up during Q1:2025-26. Infrastructure firms, on the other hand, expect input cost and wage cost pressures to rise further along with higher growth in selling prices in Q1:2025-26 (Chart II.30). One year ahead business inflation expectations17, after firming up to 4.79 per cent in December 2024 from 4.18 per cent in November, corrected sharply to 4.24 per cent in January 2025 and softened further to 4.06 per cent in February 2025. The businesses polled in the survey perceived marginal softening in cost pressures. However, subdued sales figures resulted in muted expectations for profit margins compared to the previous round. Manufacturing firms polled for the purchasing managers’ index (PMI) reported an uptick in input prices in Mar-25 after three months of consecutive deceleration. Manufacturing sector saw a slowdown in the rate of increase in output prices, during December 2024 to March 2025, though it continued to grow at a faster pace as compared to input costs. On the other hand, PMI services sector continued to report relatively sticky input prices in March 2025. The input-output price gap for the manufacturing sector indicates no pent-up pass-through with output price increase remaining sticky since October 2024, while the increase in prices charged by the services sector remained softer vis-à-vis that of input prices from September 2024 (Chart II.31). II.4 Conclusion CPI headline inflation exhibited significant volatility in H2:2024-25 due to food price shocks. Despite repetitive supply side shocks, pre-emptive monetary policy actions have helped to limit their second-round effects on underlying inflation trends and sustain the disinflation process. In this context, supply side measures have also played a role in mitigating the impact of sectoral price shocks on general inflation trends. The significant softening in CPI headline inflation in Q4:2024-25 so far, driven by the sharp correction in food inflation, is likely to sustain on robust agricultural production. In the absence of further adverse weather events and negative spillovers from geopolitical and external sector uncertainties, this could facilitate a durable alignment of headline inflation with the 4 per cent target and anchor inflation expectations effectively, thereby enhancing the credibility of monetary policy. The impact of the hike in trade tariffs by the US on domestic inflation outlook is uncertain at the moment. Following the tariff announcements, commodity prices, however, have seen sharp swings – while energy and metal prices plunged, gold prices experienced considerable volatility. Amidst large uncertainties surrounding the global economic outlook, the considerable progress achieved on the disinflation front has provided greater leeway to monetary policy in effectively managing the growth-inflation balance. _________________________________________________________________________________
III. Demand and Output Domestic economic activity recovered in H2:2024-25 from Q2:2024-25, with consumption demand acting as the main driver. Improved prospects for agriculture and rural economy, sustained buoyancy in services, government’s efforts to spur demand, and healthy balance sheets of banks and corporates brighten the outlook. The recent tariff announcements by the US, on the other hand, is likely to adversely impact India's net external demand. Heightened trade policy uncertainties, geoeconomic fragmentations, geopolitical tensions, volatility in global financial markets and weather disturbances pose downside risks to the domestic growth outlook. Domestic economic activity picked up in H2:2024-25 after slackening in Q2. Private consumption remained robust, driven by strong rural demand and improving urban demand, and government final consumption expenditure picked up in H2. Investment activity moderated vis-a-vis the highs of the previous years. Net external demand remained bouyant supported by resilient services exports. On the supply side, while agriculture posted a strong growth and services remained resilient, industrial growth was muted, on the back of deceleration in manufacturing activity. III.1 Aggregate Demand Aggregate demand conditions recovered as real gross domestic product (GDP) growth improved to 6.2 per cent (y-o-y)1 in Q3:2024-25 from 5.6 per cent in the previous quarter (Table III.1 and Chart III.1a). The momentum of GDP – quarter-on-quarter (q-o-q) seasonally adjusted annualised rate (SAAR) – also recorded improvement as compared to the previous quarter (Chart III.1b). GDP Projections versus Actual Outcomes The Monetary Policy Report (MPR) of October 2024 had projected real GDP growth at 7.0 per cent for Q2, and 7.4 per cent for both Q3 and Q4 of 2024-25. Actual growth in Q2 and Q3 turned out to be much lower (Chart III.2), mainly on account of moderation in investment on the back of lower government capital expenditure. Data for Q4 are scheduled to be released by the National Statistical Office (NSO) on May 30, 2025. | Table III.1: Real GDP Growth | | (Y-o-y, per cent) | | Item | 2023-24 | 2024-25 | Weighted Contribution* | 2023-24 | 2024-25 | | (FRE) | (SAE) | 2023-24 | 2024-25 | Q1 | Q2 | Q3 | Q4 | Q1 | Q2 | Q3 | Q4# | | Private Final Consumption Expenditure | 5.6 | 7.6 | 3.2 | 4.3 | 7.4 | 3.0 | 5.7 | 6.2 | 7.7 | 5.9 | 6.9 | 9.9 | | Government Final Consumption Expenditure | 8.1 | 3.8 | 0.8 | 0.4 | 5.3 | 20.1 | 2.3 | 6.6 | -0.5 | 3.8 | 8.3 | 4.2 | | Gross Fixed Capital Formation | 8.8 | 6.1 | 3.0 | 2.1 | 8.4 | 11.7 | 9.3 | 6.0 | 6.7 | 5.8 | 5.7 | 6.4 | | Exports | 2.2 | 7.1 | 0.5 | 1.5 | -7.0 | 4.6 | 3.0 | 7.7 | 8.1 | 2.5 | 10.4 | 7.6 | | Imports | 13.8 | -1.1 | 3.3 | -0.3 | 18.0 | 14.3 | 11.3 | 11.4 | -0.7 | -2.5 | -1.1 | -0.1 | | GDP at market prices | 9.2 | 6.5 | 9.2 | 6.5 | 9.7 | 9.3 | 9.5 | 8.4 | 6.5 | 5.6 | 6.2 | 7.6 | Notes: *: Component-wise contributions to growth do not add up to GDP growth because changes in stocks, valuables and discrepancies are not included.
FRE: First revised estimates; SAE: Second advance estimates. #: Implicit
Sources: National Statistical Office (NSO); and RBI staff estimates. |
III.1.1 Private Final Consumption Expenditure Private final consumption expenditure (PFCE) – the mainstay of aggregate demand – revived and recorded a growth of 6.9 per cent in Q3:2024-25, contributing 4.1 percentage points to overall GDP growth. Amongst the high frequency indicators (HFIs) of urban consumption, domestic air passenger traffic rose by a strong 11.4 per cent in Q3 and sustained its momentum in January-February 2025. Passenger vehicle sales posted positive growth in H2 so far (October-February) after contracting in Q2. Consumer durables production expanded at a robust pace of 9.1 per cent in Q3 and 7.2 per cent in January, indicating steady expansion in discretionary spending. Bank credit to households grew in double digits, despite the slowdown in unsecured personal loans and credit cards outstanding. Fast Moving Consumer Goods (FMCG) sales volume growth showed improvement in Q3 and Jan-Feb 2025 for urban areas, despite lagging their rural counterpart (Table III.2). 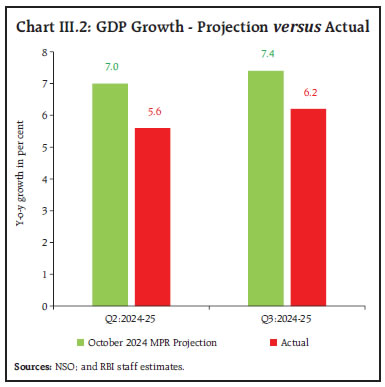 Rural demand, supported by healthy crops production and improved reservoir levels, gained strength. Growth in FMCG sales volume in the rural areas, which has been healthy in Q3 and Jan-Feb 2025, continued to outpace that of urban areas. Tractor sales recorded upbeat growth in H2:2024-25 so far (October-February) after remaining muted in H1. Fertiliser sales growth turned positive in Q3 and January 2025 after contracting in Q2. Motorcycle sales, however, inched down during H2:2024-25 so far (Table III.2). Private consumption in India shows a strong co-movement with GDP and adjusts fast for any divergence from shocks. The pace of convergence, however, moderated during post-COVID as compared with the pre-COVID period (Box III.1). | Table III.2: Indicators of Consumption | | (Y-o-y, per cent) | | Indicators | 2023-24 | 2024-25 | | Q1 | Q2 | Q3 | Q4 | Q1 | Q2 | Q3 | Jan | Feb | | Urban Demand | | | | | | | | | | | Domestic Air Passenger Traffic | 19.1 | 23.0 | 9.1 | 5.2 | 5.6 | 7.2 | 11.4 | 14.1 | 12.1 | | Passenger Vehicle Sales# | 9.6 | 5.8 | 8.7 | 10.8 | 3.4 | -1.3 | 5.0 | 3.5 | 3.3 | | IIP Consumer Durables | -2.7 | 1.1 | 5.3 | 11.2 | 10.7 | 6.6 | 9.1 | 7.2 | | | Personal Loans | 21.3 | 18.2 | 17.6 | 17.6 | 16.6 | 16.4 | 14.9 | 14.2 | 14.0 | | Vehicle Loans | 23.0 | 21.2 | 19.7 | 17.6 | 14.9 | 13.3 | 8.8 | 9.7 | 9.6 | | Credit Card Outstanding | 37.6 | 31.4 | 32.6 | 25.6 | 23.3 | 18.0 | 15.6 | 13.0 | 11.2 | | Rural Demand | | | | | | | | | | | Tractor Sales | -1.9 | -5.8 | -4.9 | -22.9 | 0.5 | 0.7 | 13.5 | 11.4 | 35.9 | | Motorcycle Sales | 13.8 | -2.9 | 22.1 | 27.0 | 16.8 | 10.2 | -1.9 | -3.1 | -12.9 | | IIP Consumer Non-durables | 6.8 | 7.0 | 2.5 | 0.7 | -0.2 | -2.2 | -1.8 | -0.2 | | | Fertiliser Sales | -2.8 | 4.2 | 0.2 | -7.4 | 5.5 | -6.1 | 2.8 | 8.2 | | | FMCG Sales Volume | | | | | | | | | | | Rural | 3.1 | 5.4 | 4.9 | 7.2 | 4.9 | 5.8 | 9.2 | 10.5 | 10.5* | | Urban | 9.6 | 10.2 | 6.9 | 5.3 | 1.3 | 1.9 | 4.2 | 4.8 | 3.5* | | All-India | 6.7 | 8.2 | 6.0 | 6.1 | 2.8 | 3.6 | 6.3 | 7.2 | 6.4* | Note: *: Adjusted for leap year effect in February. #: Doesn't include Tata Motors data.
Sources: Directorate General of Civil Aviation (DGCA), Society of Indian Automobile Manufacturers (SIAM); NSO; RBI; Tractor and Mechanization Association (TMA); and Ministry of Chemicals and Fertilisers (MoC&F); NielsenIQ’s Retail Audit Service; and RBI staff estimates. | Employment conditions remained healthy in Q3:2024-25, as reflected by the labour force participation rate (LFPR) and the employment rate (ER) under the urban Periodic Labour Force Survey (PLFS). The unemployment rate in urban areas remained at 6.4 per cent in Q3, the lowest in the PLFS series. Strengthening of formal employment was evident in the Employees’ Provident Fund Organisation (EPFO) payrolls data – net payroll additions rose by 4.2 per cent in Q3 as compared with a contraction in the previous quarter (Table III.3). Box III.1: Unravelling the Consumption Puzzle: Long-run Relationship and Post-shock Convergence with GDP The importance of private final consumption expenditure (PFCE) in driving GDP growth is well-established as being the primary driver of aggregate demand, directly influencing output (Keynes, 1936). In India also, PFCE has remained the largest contributor to aggregate demand over the years. To investigate the relationship between PFCE and GDP in the Indian context, a co-integration technique is employed using quarterly data spanning Q1:1996-97 to Q3:2024-25. The results confirm a strong long-run relationship between PFCE and GDP. The short-term results indicate that deviations from the long-run equilibrium are corrected primarily through adjustments in private consumption. This implies that following an economic shock, PFCE responds more quickly to restore equilibrium. Moreover, comparing the results of pre-COVID period and full sample period (including COVID and post-COVID), it is found that the speed of adjustments in private consumption was lower for the full sample period compared to the pre-COVID period, possibly due to slowing response during the post-COVID period in the face of heightened uncertainty. Nonetheless, these findings reinforce the critical role of PFCE in shaping India’s economic trajectory and its resilience in the face of external shocks. 
| Table III.1.1: GDP and PFCE: Co-integration and Error Correction Estimates | | Pre-COVID (1998Q1 – 2019Q4) | | Long-Run Equation | | LN(GDP) | 0.96*** | | | | (-53.53) | | | Short-Run Equation | | | D(LNPFCE) | D(LNGDP) | | Error Correction Term | -0.28*** | -0.13 | | | (-2.92) | (-1.9) | | Adjusted R-squared | 0.45 | 0.07 | | Full Sample (1998Q1 – 2024Q3) | | Long-Run Equation | | Ln(GDP) | 0.98*** | | | | (-48.77) | | | Short-Run Equation | | | D(LNPFCE) | D(LNGDP) | | Error Correction Term | -0.19*** | -0.06 | | | (-3.06) | (-1.37) | | Adjusted R-squared | 0.77 | 0.83 | Notes: (1) GDP and PFCE series are seasonally adjusted; (2) COVID-19 dummies are used to capture the substantial short-term disruptions caused by the pandemic, with negative effects observed during the initial quarters of 2020, followed by partial recovery in subsequent periods; (3) Trace test and max-eigenvalue test indicates cointegrating relationship at 5 per cent level of significance; (4) Figures in parentheses are t-statistics; (5) *** denotes significance at 1 per cent level.
Sources: NSO; and RBI staff estimates. | References: 1. Engle, R. F., & Granger, C. W. J. (1987). Co-integration and Error Correction: Representation, Estimation, and Testing, Econometrica. 55(2), 251-276. 2. Johansen, S. (1988). Statistical Analysis of Cointegration Vectors, Journal of Economic Dynamics and Control. 12(2-3), 231-254. 3. Keynes, J. M. (1937). The General Theory of Employment, The Quarterly Journal of Economics. 51(2), 209-223. |
| Table III.3: Employment Situation in India | | (Per cent) | | Indicators | 2023-24 | 2024-25 | | Q1 | Q2 | Q3 | Q4 | Q1 | Q2 | Q3 | | Labour Force Participation Rate | 48.8 | 49.3 | 49.9 | 50.2 | 50.1 | 50.4 | 50.4 | | Worker Population Ratio | 45.5 | 46 | 46.6 | 46.9 | 46.8 | 47.2 | 47.2 | | Unemployment Rate | 6.6 | 6.6 | 6.5 | 6.7 | 6.6 | 6.4 | 6.4 | | Net Payroll Additions in EPFO Records (y-o-y) | -9.2 | -0.6 | 12.5 | 22.7 | 7.8 | -3.4 | 4.2 | | Sources: NSO; and Employees’ Provident Fund Organisation (EPFO). | III.1.2 Gross Fixed Capital Formation Gross fixed capital formation (GFCF) expansion at 5.7 per cent in Q3:2024-25 was lower as compared to 9.3 per cent in the same period last year. In Q4, amongst the key underlying indicators, import of capital goods expanded by 7.5 per cent in Jan-Feb 2025, led by electronic goods, electrical and non-electrical machinery, iron and steel, and machine tools. Domestic production of capital goods recorded improvement in January 2025. Among the coincident indicators of construction activity, both steel consumption and cement production reverted to double-digit growth in Jan-Feb 2025. Steel consumption, however, contracted marginally in March 2025 (Table III.4). Capacity utilisation (CU) in the manufacturing sector2 increased to 75.4 per cent in Q3:2024-25 from 74.7 per cent in the same quarter of the previous year. Seasonally adjusted capacity utilisation at 75.3 per cent was well above the long-term average of 73.8 per cent3 (Chart III.3). Robust capacity utilisation act as an important driver in boosting private investment (Box III.2). Since the level of CU has been above the long period trend over the last few quarters, heightened policy uncertainty may be acting as a dampening force for revival in private capex. The interest coverage ratio (ICR)4 of listed private manufacturing companies remained comfortable in Q3:2024-25, indicating improved debt servicing capacity which, in conjunction with easing financial conditions, augers well for expansion in capacity. Within the services sector, ICR of non-IT companies improved during Q3 while ICR of IT companies remained at elevated levels despite moderation (Table III.5). | Table III.4: Indicators of Investment Demand | | (Y-o-y, per cent) | | Indicators | 2023-24 | 2024-25 | | Q1 | Q2 | Q3 | Q4 | Q1 | Q2 | Q3 | Jan | Feb | Mar | | Import of Capital Goods | 9.2 | 9.6 | 5.6 | 8.9 | 10.0 | 11.7 | 6.0 | 15.5 | -0.5 | | | IIP: Capital Goods | 5.1 | 8.8 | 7.5 | 4.1 | 3.0 | 4.9 | 7.3 | 7.8 | | | | Finished Steel Consumption | 12.1 | 17.7 | 14.7 | 10.4 | 15.0 | 12.0 | 7.8 | 10.9 | 10.9 | -0.5 | | Cement Production | 12.7 | 10.3 | 5.1 | 7.6 | 0.4 | 3.2 | 6.7 | 14.5 | 10.5 | | | Sources: Directorate General of Commercial Intelligence and Statistics (DGCI&S); NSO; Joint Plant Committee; and Office of Economic Adviser. |
The investment rate5 at 31.4 per cent in 2023-24 moderated from the previous year level (32.6 per cent). On the other hand, domestic savings rate remained steady at 30.7 per cent of GDP in 2023-24, indicating lower reliance on external funding (Chart III.4). Net household financial savings improved marginally to 5.2 per cent of GDP from 5.0 per cent last year, mainly due to uptick in financial assets of households (Table III.6). | Box III.2: Investment Dynamics through the Lens of Capacity Utilisation The public sector played a major role in the post-pandemic revival of gross fixed investments while the private corporate sector has been lagging, which is pivotal in expanding the productive capacity of the economy (IMF, 2025). The capacity utilisation (CU) level is a vital indicator to understand whether fresh investments by the private corporate sector will get triggered to meet the improving domestic demand conditions. Capacity utilisation in the manufacturing sector in the recent period has been higher than its long-term average. It is generally understood that a high level of capacity utilisation coupled with a positive economic outlook incentivises fresh capacity additions. An improvement in productivity, however, may lead to a lower level of capacity utilisation. Thus, examining the threshold level of capacity utilisation assumes importance; particularly, at the current juncture when the environment seems to be conducive for a turnaround in the private capex cycle with healthy balance sheets and easing of financial conditions. The dynamic relationship between capacity utilisation and private investments is empirically explored to find out the threshold level of capacity utilisation that triggers investment. A structural vector auto-regression (SVAR) model is estimated using five variables6 viz., business expectation, CU, gross fixed investments, inflation (GFCF deflator) and repo rate for the period Q2:2008-09 to Q3:2024-25. Since uncertainty is believed to dampen current and future investments, it is included as an exogenous variable7. Empirical findings suggest that around 50.0 per cent of the variation in private investment growth is explained by CU, suggesting its dominant role as a driver of private investments (Chart III.2.1). Economic policy uncertainty is found to have a dampening effect on fresh investments. The threshold level of CU, which might trigger private corporate investment going forward, is estimated with the same set of variables but using an alternative specification of Threshold VAR models (Balke, 2000). The findings suggest a band of 72.4 to 74.4 per cent as a threshold level for CU. References: 1. IMF (2025). India 2024 Article IV Consultation, International Monetary Fund Country Report No. 25/54. 2. N. Balke (2000). Credit and Economic Activity: Credit Regimes and Nonlinear Propagation of Shocks, The Review of Economics and Statistics. 82(2), 344-349. | III.1.3 Government Consumption Government final consumption expenditure (GFCE) posted a sharp recovery in Q3:2024-25, rising by 8.3 per cent, following a subdued growth of just 1.6 per cent in H1, mainly due to the model code of conduct during the general elections. Notably, union government’s revenue expenditure, excluding interest payments and major subsidies, grew by 11.2 per cent, and capital outlay surged by 20.5 per cent in Q3:2024-25 (Chart III.5). GFCE growth for 2024-25, however, fell to 3.8 per cent as compared to 8.1 per cent in the previous year. | Table III.5: Interest Coverage Ratio | | (Ratio) | | Sector | 2023-24 | 2024-25 | | Q1 | Q2 | Q3 | Q4 | Q1 | Q2 | Q3 | | Manufacturing | 6.8 | 7.5 | 7.4 | 7.5 | 7.9 | 7.9 | 7.6 | | Services (non-IT) | 1.6 | 1.4 | 1.8 | 1.7 | 1.8 | 1.7 | 2.1 | | IT | 44.5 | 43.2 | 41.2 | 44.1 | 42.9 | 45.6 | 40.9 | Note: Data for Q3:2024-25 are based on results of 2,924 listed non-government non-financial companies.
Source: RBI staff estimates. |
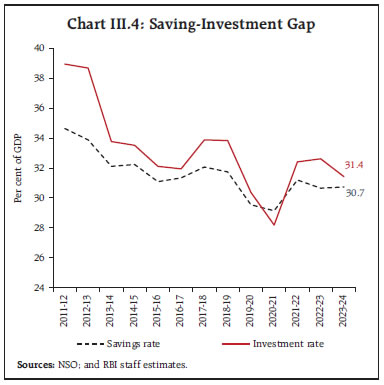
| Table III.6: Domestic Savings | | (Per cent of GDP) | | Sector | 2011-12 to 2015-16 | 2016-17 | 2017-18 | 2018-19 | 2019-20 | 2020-21 | 2021-22 | 2022-23 | 2023-24 | | Households Savings | Physical (1) | 13.3 | 10.7 | 11.6 | 12.4 | 11.4 | 11.0 | 12.8 | 13.7 | 13.0 | | | Gross Financial Assets (2) | 10.6 | 10.5 | 12.0 | 12.0 | 11.6 | 15.4 | 11.1 | 10.9 | 11.4 | | | Gross Financial Liabilities (3) | 3.1 | 3.0 | 4.4 | 4.1 | 3.9 | 3.7 | 3.8 | 5.9 | 6.2 | | | Net Financial Savings (4=2-3) | 7.5 | 7.4 | 7.6 | 7.9 | 7.7 | 11.7 | 7.3 | 5.0 | 5.2 | | | Total Household Savings (5=1+4) | 20.8 | 18.1 | 19.3 | 20.3 | 19.1 | 22.7 | 20.1 | 18.6 | 18.1 | | Private Corporate Savings (6) | 10.8 | 10.8 | 11.5 | 11.2 | 10.5 | 10.2 | 10.5 | 11.2 | 11.0 | | Public Savings (7) | 1.2 | 1.2 | 1.7 | 1.6 | 0.9 | 0.2 | -4.1 | -0.1 | 1.1 | | Gross Domestic Savings (5+6+7) | 32.8 | 32.8 | 31.3 | 32.1 | 31.7 | 29.6 | 29.1 | 31.2 | 30.7 | Note: Physical saving comprises saving in physical assets and saving in the form of gold and silver ornaments.
Source: NSO. | The central government’s revenue expenditure (excluding interest payments and major subsidies) grew by 7.9 per cent, while capital expenditure expanded by 7.3 per cent during 2024-25 (RE). Pursuing fiscal consolidation, the central government’s gross fiscal deficit (GFD) at 4.7 per cent of GDP in 2024-25 (RE) was 20 basis points lower than its budget estimate, and 75 basis points lower compared to the previous year. The centre’s GFD for 2025-26 has been budgeted at 4.4 per cent of GDP, which is consistent with the medium-term goal of reducing the GFD-GDP ratio to below 4.5 per cent by 2025-26. The central government’s fiscal consolidation in 2025-26 (BE) has been planned largely by rationalisation in revenue expenditure, while maintaining a thrust on capital expenditure which has been budgeted at 3.1 per cent of GDP. Gross tax revenues are projected to rise to 12.0 per cent of GDP in 2025-26 (BE) from 11.6 per cent in 2024-25 (RE) (Table III.7). The revenue expenditure to capital outlay ratio (RECO), a key indicator of the quality of expenditure, stood at 4.4 in 2025-26 (BE), same as in the last two years and the lowest in over three decades. 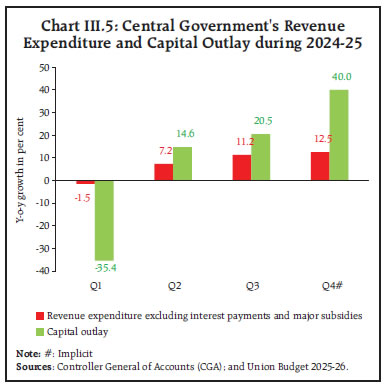
| Table III.7: Central Government Finances | | (Per cent of GDP) | | Indicator | 2022-23 | 2023-24 | 2024-25 (RE) | 2025-26 (BE) | | 1. Gross tax revenue | 11.4 | 11.5 | 11.6 | 12.0 | | 2. Revenue receipts | 8.9 | 9.1 | 9.3 | 9.6 | | a. Tax revenue (Net) | 7.8 | 7.7 | 7.7 | 7.9 | | b. Non-tax revenue | 1.1 | 1.3 | 1.6 | 1.6 | | 3. Non-debt capital receipts | 0.3 | 0.2 | 0.2 | 0.2 | | 4. Revenue expenditure | 12.8 | 11.6 | 11.2 | 11.0 | | a. Interest payments | 3.5 | 3.5 | 3.4 | 3.6 | | b. Major subsidies | 2.0 | 1.4 | 1.2 | 1.1 | | 5. Revenue expenditure excluding interest payments and major subsidies | 7.4 | 6.7 | 6.6 | 6.4 | | 6. Capital expenditure | 2.8 | 3.2 | 3.1 | 3.1 | | 7. Capital outlay | 2.3 | 2.6 | 2.6 | 2.5 | | 8. Effective capital expenditure | 3.9 | 4.2 | 4.0 | 4.3 | | 9. Total expenditure | 15.6 | 14.8 | 14.2 | 14.2 | | 10. Gross fiscal deficit | 6.5 | 5.5 | 4.7 | 4.4 | | 11. Revenue deficit | 4.0 | 2.5 | 1.8 | 1.5 | | 12. Primary deficit | 3.0 | 2.0 | 1.3 | 0.8 | Notes: RE: Revised Estimates; BE: Budget Estimates.
Effective capital expenditure includes grants in aid for creation of capital assets.
Figures may vary from those published in the Union Budget due to revision in GDP.
Sources: Union Budget 2025-26; and RBI staff estimates. |
 During April-February 2024-25, the central government's revenue expenditure excluding interest and major subsidy payments increased by 3.9 per cent, whereas capital expenditure witnessed muted growth of 0.8 per cent. The central government’s gross tax revenue recorded a growth of 10.9 per cent, supported by buoyant direct tax collections. Direct taxes increased by 13.3 per cent with income tax expanding by 22.0 per cent. Indirect tax collections rose by 7.9 per cent, with goods and services tax (GST) and custom duties registering a growth of 11.6 and 4.2 per cent, respectively. Monthly average GST collections (centre plus states) was ₹1.84 lakh crore during 2024-25, registering a growth of 9.4 per cent over the previous year (Chart III.6). The aggregate gross fiscal deficit (GFD) for the states and union territories has been estimated at 3.2 per cent of GDP for 2024-25 (BE) (Table III.8). The states have projected a rise in revenue receipts 2024-25 (BE), fuelled by both tax and non-tax components. Notably, the states have continued their thrust on augmenting capital expenditure, with a budgeted increase of 22.4 per cent in 2024-25. State’s GFD reached 61.3 per cent of their BE during April-January 2024-25, lower than the level recorded in the previous year (Chart III.7a). Total revenue receipts for the states remained buoyant during April-January 2024-25, driven primarily by a strong rise in tax revenue, although growth in non-tax revenue moderated. On the expenditure side, capital spending contracted marginally by 0.6 per cent during April-January 2024-25, while growth in revenue expenditure accelerated during this period (Chart III.7b). | Table III.8: State Government Finances - Key Fiscal Indicators | | (per cent of GDP) | | Items | 2022-23 (A) | 2023-24 (PA) | 2024-25 (BE) | | Revenue deficit | 0.2 | 0.2 | 0.2 | | Gross fiscal deficit | 2.7 | 2.9 | 3.2 | | Primary deficit | 1.0 | 1.4 | 1.5 | Notes: Data pertains to 31 States/UTs
A: Actuals; PA: Provisional Accounts; BE: Budget Estimates
Sources: Budget Documents of States/UTs; and Comptroller and Auditor General (CAG) of India. |
The rise in revenue expenditure along with the contraction in capital outlay has diluted the quality of state spending (Chart III.8). The states’ capital expenditure has been supported by the Scheme for Special Assistance to States for Capital Investment. Under this initiative, the centre has approved loans totalling ₹1,22,180 crore as of January 31, 2025, of which, about ₹1,10,792 crore has been disbursed.8 The scheme has been extended to 2025-26 in the Union budget, recognising its critical role in fostering investment and growth.
| Table III.9: Government Market Borrowings | | (₹ crore) | | | 2022-23 | 2023-24 | 2024-25 | | Centre | States | Total | Centre | States | Total | Centre | States | Total | | Net borrowings | 11,08,261 | 5,18,830 | 16,27,091 | 11,80,456 | 7,17,140 | 18,97,596 | 10,39,275 | 7,53,345 | 17,92,620 | | Gross borrowings | 14,21,000 | 7,58,392 | 21,79,392 | 15,43,000 | 10,07,058 | 25,50,058 | 14,00,697 | 10,73,310 | 24,74,007 | | Sources: Government of India (GoI); and RBI staff estimates. | In 2024-25, the centre’s gross market borrowings amounted to ₹14.01 lakh crore, marginally lower than the budgeted estimates. In pursuit of active debt consolidation, the Reserve Bank of India conducted eight switch auctions on behalf of the central government, totalling ₹1.47 lakh crore. These auctions involved substituting shorter-maturity securities with those of longer maturities. The weighted average yield on issuances during 2024-25 declined to 7.0 per cent from 7.2 per cent in 2023-24. On the other hand, the weighted average maturity of borrowings increased to 20.7 years from 18.1 years in the previous year. States raised market borrowing of ₹10.73 lakh crore in 2024-25, lower than the total sanctioned amount of ₹11.72 lakh crore for the fiscal year (Table III.9). The Ways and Means Advances (WMA) limits of the central government, to meet temporary mismatches between receipts and payments, remained unchanged from the previous year at ₹1.5 lakh crore for H1 and ₹50,000 crore for H2 in 2024-25. The WMA limits for states and union territories were increased to ₹60,118 crore from the earlier ₹47,010 crore, effective on July 1, 2024.9 The centre's gross market borrowings and net borrowings for 2025-26 (BE) are placed at ₹14.82 lakh crore and ₹11.54 lakh crore, respectively. III.1.4 External Demand During April-February 2024-25, merchandise exports saw a modest growth of 0.1 per cent, while merchandise imports recorded a rise of 5.7 per cent. During H2:2024-25 (October-February), India’s merchandise exports contracted by 1.2 per cent, while imports rose by 2.4 per cent. As a result, the merchandise trade deficit widened to US$115.8 billion during H2:2024-25 (October-February) from US$ 106.6 billion in the corresponding period of the previous year (Chart III.9). The contraction in merchandise exports during H2 was primarily driven by petroleum, oil and lubricants (POL), gems and jewellery, iron ore, organic and inorganic chemicals, and oil meals, while electronic goods, engineering goods, rice, readymade garments (RMG) of all textiles, and drugs and pharmaceuticals contributed positively (Chart III.10). The growth in merchandise imports during H2:2024-25 (October-February) was primarily driven by imports of electronic goods, gold, machinery (both electrical and non-electrical), vegetable oil, and chemical materials and products (Chart III.11). On the other hand, imports of coal, coke, and briquettes, petroleum, crude and products, pearls, precious and semi-precious stones, silver, and iron and steel contributed negatively to the overall import growth. Non-oil exports posted a robust y-o-y increase of 8.7 per cent during H2, while non-oil non-gold imports rose by 4.7 per cent to reach US$ 199.7 billion during this period. 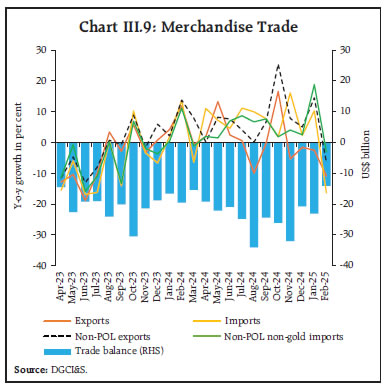
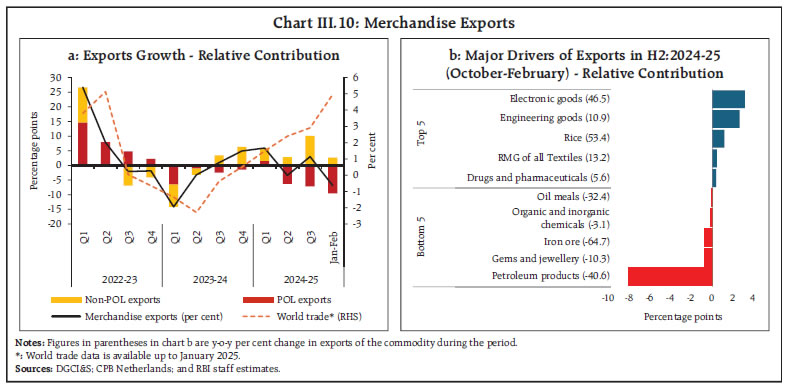 Services exports grew by 13.1 per cent during 2024-25 (April-February), a notable increase from 5.5 per cent recorded in the same period of last year, reflecting robust global demand for Indian services. In H2:2024-25 (October-February), services exports surged by 15.4 per cent, compared to a modest 6.0 per cent growth in the previous year (Chart III.12). The growth in H2 was primarily driven by strong performances in software, business, and transportation services. Among the world’s leading service-exporting nations, India maintained its position within the top five countries in 2024-25 (up to December 2024). Services imports rebounded from contraction and recorded a 12.1 per cent growth during 2024-25 (April-February), with a significant increase of 14.6 per cent during H2 (October-February) on the back of buoyant domestic demand. 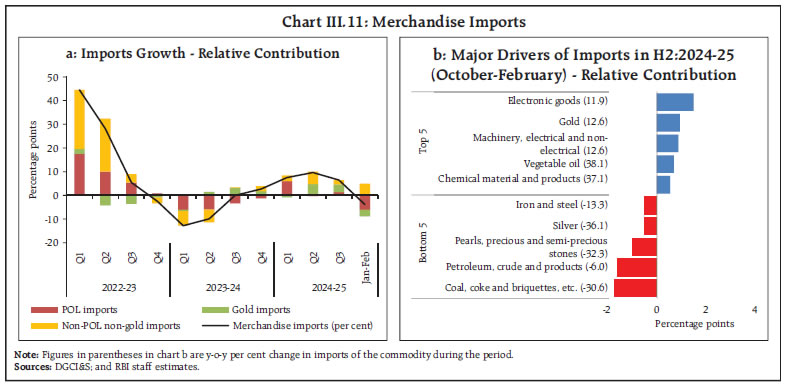
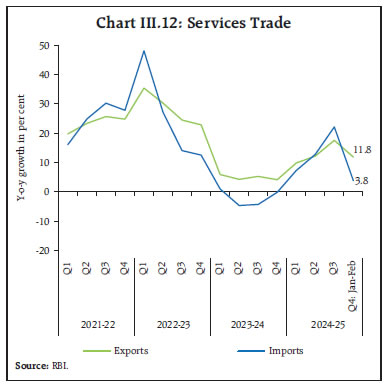 On a balance of payments (BoP) basis, India’s current account deficit (CAD) widened marginally to US$ 11.5 billion (1.1 per cent of GDP) in Q3:2024-25 from US$ 10.4 billion (1.1 per cent of GDP) in Q3:2023-24, but moderated from US$ 16.7 billion (1.8 per cent of GDP) in Q2:2024-25. In the financial accounts, net foreign direct investment (FDI) flows to India declined to US$ 2.5 billion during April-January 2024-25 from US$ 11.5 billion in the same period of last year, mainly due to a surge in repatriations and increased outward FDI (Table III.10). Gross FDI flows, however, remained strong at US$ 69.4 billion in 2024-25 (up to January), growing by 15.3 per cent over last year, a notable rebound compared to a 2.6 per cent contraction during the corresponding period of last year. Major sources of FDI inflows included Singapore, Mauritius, the USA, UAE, Netherlands and Japan, which together accounted for 80.0 per cent of total FDI. The majority of FDI equity inflows were into manufacturing, financial services, electricity generation, distribution & transmission, communication services, retail & wholesale trade, and computer services, which together received 77.0 per cent of FDI equity inflows. | Table III.10: Net Foreign Direct and Portfolio Investment | | (US$ billion) | | | 2023-24 | 2024-25 | | Q1 | Q2 | Q3 | Q4 | Q1 | Q2 | Q3 | Q4 | | Net FDI | 4.7 | -0.8 | 4.0 | 2.3 | 6.6 | -2.3 | -2.8 | 0.9# | | Net FPI* | 16.1 | 5.3 | 11.7 | 11.6 | 0.9 | 19.8 | -11.4 | -6.8 | Notes: #: Net FDI for Q4:2024-25 is up to January 2025;
*: Net FPI data up to Q3:2024-25 are based on balance of payments (BoP) statistics of RBI, while data for Q4:2024-25 is sourced from daily data, published by NSDL.
Sources: National Securities Depository Limited (NSDL); and RBI. | Foreign portfolio investment (FPI) to India recorded a net outflow of US$ 18.3 billion in H2:2024-25, as portfolio investors turned net sellers in equities mainly due to hightened global uncertainties. Although FPI flows in the debt segment moderated in H2:2024-25, they remained positive for the full year, reflecting the inclusion of Indian government bonds in J.P. Morgan’s benchmark emerging market index and other indices. Overall, FPI recorded a net inflow of US$ 2.4 billion in 2024-25, a sharp decline from the net inflow of US$ 44.6 billion in the same period of the previous year. The uncertain global economic outlook, rising US bond yields, and moderation in corporate earnings seem to have dampened FPI sentiment. The FPI flows have revived in March 2025 and recorded net inflow of US$ 3.8 billion. External commercial borrowing (ECB) flows saw significant increase, reaching US$ 15.2 billion during April-February 2024-25, as against US$ 2.8 billion a year ago. Net accretions to non-resident deposits surged to US$ 14.3 billion during April-January 2024-25 from US$ 10.2 billion in the previous year, on the back of strong deposit growth in all three accounts i.e., FCNR(B), NRE and NRO. As of March 28, 2025, India’s foreign exchange reserves stood at US$ 665.4 billion, equivalent to 11.0 months of annualized merchandise imports on a BoP basis and 92.7 per cent of the outstanding external debt as of December 2024. III.2 Aggregate Supply Aggregate supply – measured by real gross value added (GVA) at basic prices – expanded by 6.2 per cent in Q3:2024-25 (8.0 per cent in Q3:2023-24), showing improved momentum over the previous quarter (5.8 per cent growth in Q2:2024-25). This improvement in Q3 was supported by robust growth in agriculture and allied sector activity and resilience in services activity (Table III.11 and Chart III.13). III.2.1 Agriculture Real GVA in agriculture and allied activities recorded a six-quarter high growth of 5.6 per cent in Q3:2024-25 (1.5 per cent a year ago) on the back of healthy kharif production. As on March 27, 2025, the water storage levels in major reservoirs across India stood at 42 per cent of full capacity, marking an increase of 16.5 per cent compared to the previous year and 14.6 per cent above the decadal average. Notably, storage levels exceeded the decadal average in all regions, except the Northern and Eastern regions. | Table III.11: Real GVA Growth | | (Y-o-y, per cent) | | Sector | 2023-24 | 2024-25 | Weighted Contribution | 2023-24 | 2024-25 | | (FRE) | (SAE) | 2023-24 | 2024-25 | Q1 | Q2 | Q3 | Q4 | Q1 | Q2 | Q3 | Q4# | | Agriculture, forestry and fishing | 2.7 | 4.6 | 0.4 | 0.7 | 5.7 | 3.7 | 1.5 | 0.9 | 1.7 | 4.1 | 5.6 | 6.2 | | Industry | 11.0 | 4.3 | 2.4 | 0.9 | 6.6 | 15.3 | 12.6 | 9.9 | 7.7 | 2.0 | 3.5 | 4.3 | | Mining and quarrying | 3.2 | 2.8 | 0.1 | 0.1 | 4.1 | 4.1 | 4.7 | 0.8 | 6.8 | -0.3 | 1.4 | 2.4 | | Manufacturing | 12.3 | 4.3 | 2.1 | 0.8 | 7.3 | 17.0 | 14.0 | 11.3 | 7.5 | 2.1 | 3.5 | 4.3 | | Electricity, gas, water supply and other utilities | 8.6 | 6.0 | 0.2 | 0.1 | 4.1 | 11.7 | 10.1 | 8.8 | 10.2 | 3.0 | 5.1 | 6.0 | | Services | 9.2 | 7.5 | 5.8 | 4.7 | 12.1 | 8.3 | 8.5 | 8.0 | 7.2 | 7.4 | 7.3 | 8.0 | | Construction | 10.4 | 8.6 | 0.9 | 0.8 | 9.2 | 14.6 | 10.0 | 8.7 | 10.1 | 8.7 | 7.0 | 8.9 | | Trade, hotels, transport, communication | 7.5 | 6.4 | 1.4 | 1.2 | 11.0 | 5.4 | 8.0 | 6.2 | 5.4 | 6.1 | 6.7 | 7.0 | | Financial, real estate and professional services | 10.3 | 7.2 | 2.4 | 1.7 | 15.0 | 8.3 | 8.4 | 9.0 | 6.6 | 7.2 | 7.2 | 8.0 | | Public administration, defence and other services | 8.8 | 8.8 | 1.1 | 1.1 | 9.3 | 8.9 | 8.4 | 8.7 | 9.0 | 8.8 | 8.8 | 8.7 | | GVA at basic prices | 8.6 | 6.4 | 8.6 | 6.4 | 9.9 | 9.2 | 8.0 | 7.3 | 6.5 | 5.8 | 6.2 | 6.8 | Notes: FRE: First revised estimates; SAE: Second advance estimates; #: Implicit.
Sources: NSO; and RBI staff estimates. |
| Table III.12: Agricultural Production in 2024-25 | | (Lakh tonnes) | | Crop | 2023-24 Final Estimates | 2024-25 | Variation in 2024-25
(Per cent) Over 2023-24 | | Target | SAE | | 1. Foodgrains | 3157.7 | 3259.2 | 3309.2 | 4.8 | | Kharif | 1557.7 | 1613.7 | 1663.9 | 6.8 | | Rabi | 1600.1 | 1645.5 | 1645.3 | 2.8 | | a. Rice | 1278.6 | 1260.5 | 1364.4 | 6.7 | | b. Wheat | 1132.9 | 1150.0 | 1154.3 | 1.9 | | c. Pulses | 221.7 | 276.5 | 230.2 | 3.8 | | 2. Oilseeds | 384.4 | 434.0 | 416.7 | 8.4 | | 3. Sugarcane | 4531.6 | 4700.0 | 4350.8 | -4.0 | | 4. Cotton # | 325.2 | 350.0 | 294.3 | -9.5 | | 5. Jute & Mesta ## | 96.9 | 105.0 | 86.2 | -11.0 | Notes: Table covers data only for Kharif and Rabi seasons.
#: Lakh bales of 170 kgs each; ##: Lakh bales of 180 kgs each.
SAE: Second Advance Estimates.
Source: Ministry of Agriculture and Farmers’ Welfare (MoA&FW), GoI. | The second advance estimate (SAE) for 2024-25 placed foodgrains production at 3309.2 lakh tonnes, marking an increase of 4.8 per cent over the previous year (Table III.12). Among major crops, rice production increased by 6.7 per cent with a significant increase in both kharif and rabi output, while wheat production rose by 1.9 per cent. Pulses production is estimated to record a growth of 3.8 per cent. Among commercial crops, oilseeds production increased by 8.4 per cent, while the output of cotton and sugarcane registered a decline vis-à-vis last year. The production of horticultural crops in 2024-25 reached 3620.9 lakh tonnes as per the first advance estimates (FAE), 2.1 per cent higher than the final estimates for 2023-24. The growth in production was primarily attributed to a higher output of onions and potatoes. Allied activities like livestock, forestry and fishing contributed almost 82.0 per cent of agricultural GVA growth in 2023-24 (Chart III.14). Real GVA of agriculture and allied activities expanded by 2.7 per cent in 2023-24 (FRE), primarily driven by 5.4 per cent growth in livestock and 5.9 per cent growth in fisheries and aquaculture sector. In 2023-24, total meat production grew by 4.9 per cent, while milk production grew by 3.8 per cent.
As on March 31, 2025, rice procurement for the 2024-25 kharif marketing season reached 511.5 lakh tonnes, an increase of 6.9 per cent over the previous year. Rice stocks at 659.3 lakh tonnes as of March 16, 2025, 8.7 times the buffer requirement, while wheat stocks at 121.7 lakh tonnes were marginally lower than the buffer norms (Chart III.15). High-frequency indicators such as tractor and fertiliser sales, and agriculture exports suggested buoyancy in the rural economy during H2:2024-25, whereas demand for employment under Mahatma Gandhi National Rural Employment Guarantee Act (MNREGA) and agricultural credit growth reflected moderation (Table III.13). Higher kharif and rabi production coupled with improved reservoir levels are supportive of rural economic activity. FAE for horticultural production also indicate a positive trend as compared to the previous year. | Table III.13: Rural Economy - High Frequency Indicators | | Item | Unit | H1 (Apr-Sep) | H2 (Oct-Mar) | | 2022-23 | 2023-24 | 2024-25 | 2022-23 | 2023-24 | 2024-25 | | Tractor sales* | Number (in lakh) | 4.9 | 4.7 | 4.7 | 3.8 | 3.3 | 3.9 | | Two-wheeler sales* | Number (in lakh) | 84.0 | 87.4 | 101.6 | 61.7 | 77.5 | 77.9 | | Fertiliser sales# | Lakh tonnes | 335.4 | 338.5 | 335.5 | 248.8 | 243.8 | 253.6 | | Demand for employment (MGNREGA) | Crore households | 13.9 | 15.1 | 12.6 | 12.0 | 11.5 | 12.0 | | Agriculture and allied sector exports# | USD billion | 26.4 | 23.3 | 23.4 | 16.4 | 15.4 | 18.2 | | Agriculture credit growth* | y-o-y | 13.4 | 16.7 | 16.4 | 14.9 | 20.0 | 11.4 | | Rice stock to buffer norm** | Ratio | 2.8 | 3.1 | 3.8 | 5.8 | 7.6 | 8.7 | | Wheat stock to buffer norm** | Ratio | 1.1 | 1.2 | 1.2 | 0.7 | 0.6 | 0.9 | Notes: *: up to February; #: up to January; **: as on March 16, 2025.
Sources: TMA; SIAM; MoC&F; Ministry of Rural Development (MoRD); CMIE; RBI; and Food Corporation of India (FCI). | III.2.2 Industry As per the SAE, industrial sector growth moderated to 4.3 per cent in 2024-25, from 11.0 per cent in the previous year, mainly owing to the sharp deceleration in manufacturing along with a slowdown in mining activity. The industrial sector, however, picked up modestly and expanded by 3.5 per cent in Q3:2024-25 as against 2.0 per cent in Q2, supported by a recovery in manufacturing activity. Manufacturing sector witnessed a gradual recovery in sales growth and operating profit. Mining and quarrying activity witnessed a slowdown in coal production and a contraction in crude oil and natural gas production in Q3. GVA of electricity, gas, water supply, and other utility services grew modestly by 5.1 per cent during Q3 in the face of a relatively warmer winter along with a slowdown in industrial activity (Chart III.16). The index of industrial production (IIP) grew by 4.1 per cent during Q3:2024-25 and 5.0 per cent in January (Chart III.17 and Table III.14). Mining and quarrying registered a moderate growth of 1.8 per cent in Q3 and 4.4 per cent in January. Manufacturing recorded an expansion of 4.4 per cent in Q3 (5.4 per cent during the previous year) and 5.5 per cent in January. While the production of basic metals, electrical equipment, coke and refined petroleum products, fabricated metal products, and machinery and equipment posted an upsurge in Q3, manufacturing of food products, pharmaceuticals, printing, and leather products acted as a drag on growth. In terms of the use-based classification, primary, capital, intermediate, infrastructure and consumer durables rose during Q3 and January. Consumer non-durable goods, however, contracted during this period. Electricity, gas, water supply and other utility services registered 5.5 per cent growth in H2. Electricity generation rose modestly by 4.0 per cent in Q3:2024-25 (9.2 per cent a year ago) with thermal power generation remaining muted amidst subdued demand due to less harsh winter. Renewable energy, which has a share of 12.7 per cent in total generation, increased sharply by 17.2 per cent in Q3. In Q4 (up to February), electricity generation grew by 3.0 per cent. Region-wise, electricity demand exhibited divergence –– while the northern region maintained robust demand, other regions recorded subdued demand with the southern region witnessing a contraction in Q3. In Q4, electricity demand growth increased to 3.5 per cent, with the western region leading the growth, followed by the eastern, southern and northern regions (Table III.15). 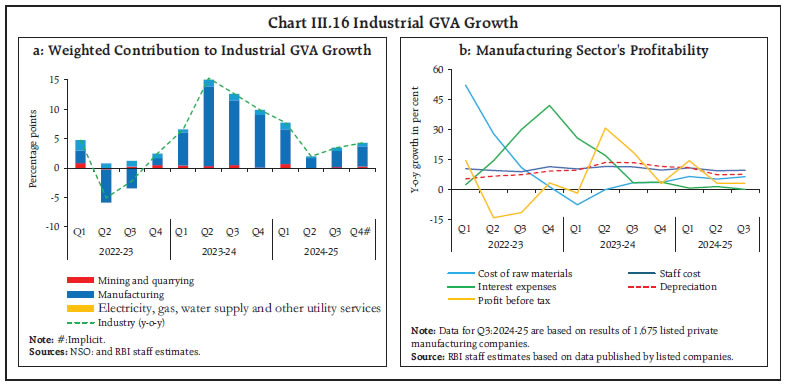
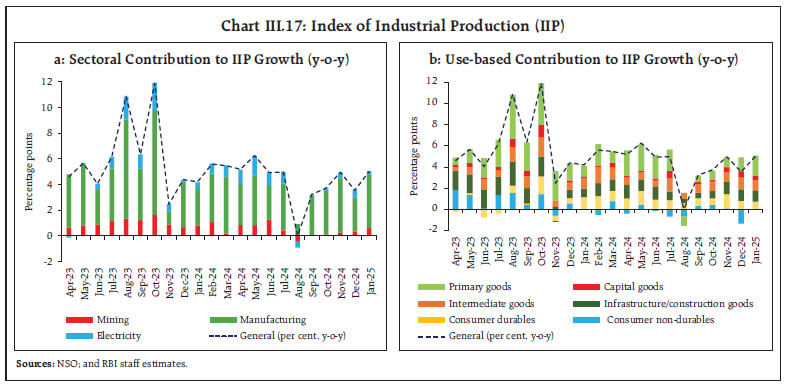
| Table III.14: Industrial Sector y-o-y growth | | (Per cent) | | | Indicators | 2024-25 | | Q1 | Q2 | Q3 | Jan | Feb | Mar | | 1 | PMI: Manufacturing (>50 indicates growth over previous month) | 58.2 | 57.4 | 56.8 | 57.7 | 56.3 | 58.1 | | 2 | Index of Industrial Production (IIP) | 5.5 | 2.7 | 4.1 | 5.0 | | | | 3 | IIP: Manufacturing | 4.3 | 3.3 | 4.4 | 5.5 | | | | 4 | IIP: Primary goods | 1.1 | 1.6 | 3.0 | 5.5 | | | | 5 | IIP: Capital goods | 3.0 | 4.9 | 7.3 | 7.8 | | | | 6 | IIP: Infrastructure and construction goods | 8.1 | 3.9 | 6.7 | 7.0 | | | | 7 | IIP: Consumer durables | 10.7 | 6.6 | 9.1 | 7.2 | | | | 8 | IIP: Consumer non-durables | -0.2 | -2.2 | -1.8 | -0.2 | | | | 9 | Eight Core Industries (ECI) | 6.3 | 2.4 | 4.8 | 5.1 | 2.9 | | | 10 | ECI: Steel | 8.4 | 4.3 | 7.8 | 4.7 | 5.6 | | | 11 | ECI: Cement | 0.4 | 3.2 | 6.6 | 14.6 | 10.5 | | | 12 | Electricity demand | 10.2 | -0.7 | 2.6 | 1.3 | 2.4 | 6.6 | | | Production of Automobiles | | 13 | Passenger vehicles | 5.8 | -0.7 | -8.9 | 3.7 | 4.5 | | | 14 | Two-wheelers | 19.6 | 12.5 | 8.0 | 10.3 | 1.6 | | | 15 | Three wheelers | 9.4 | 6.3 | -2.1 | 16.2 | 6.5 | | | 16 | Tractors | 1.0 | 3.2 | 12.1 | 23.7 | -7.8 | | | Sources: CMIE; CEIC; NSO; SIAM and RBI staff estimates. |
| Table III.15: Electricity Generation and Consumption | | (Y-o-y, per cent) | | Indicators | 2023-24 | 2024-25 | | Q1 | Q2 | Q3 | Q4 | Q1 | Q2 | Q3 | Jan | Feb | Mar | | Electricity generation | | | | | | | | | | | | Thermal | 2.1 | 14.7 | 14.3 | 10.1 | 12.1 | -1.3 | 0.0 | -2.9 | 1.0 | 3.1 | | Nuclear | -6.4 | 16.7 | 10.0 | -2.2 | 28.3 | 18.4 | 11.4 | 15.1 | 18.6 | 16.8 | | Hydro | -10.0 | -13.4 | -30.7 | -20.2 | 1.0 | 6.2 | 28.3 | 16.3 | 17.6 | 24.2 | | Renewables | 8.1 | 21.9 | 7.0 | 5.6 | 7.0 | 7.3 | 17.2 | 31.9 | 12.2 | | | Electricity consumption | | | | | | | | | | | | Northern region | -8.9 | 8.4 | 6.0 | 8.3 | 22.0 | 3.1 | 9.5 | -2.9 | 2.4 | 6.0 | | Western region | 3.5 | 20.8 | 7.7 | 7.1 | 5.5 | -6.7 | 0.4 | 3.3 | 3.0 | 9.5 | | Southern region | 10.7 | 16.3 | 18.2 | 9.3 | 3.3 | 0.8 | -2.3 | 3.1 | 2.1 | 3.9 | | Eastern region | 4.9 | 6.6 | 9.2 | 7.9 | 9.8 | 0.6 | 3.9 | 2.7 | 1.7 | 6.6 | | All-India | 1.5 | 13.4 | 9.9 | 8.1 | 10.2 | -0.7 | 2.6 | 1.3 | 2.4 | 6.6 | | Sources: Central Electricity Authority (CEA); and Power System Operation Corporation Limited (POSOCO). | The manufacturing purchasing managers’ index (PMI) stayed in expansion zone and stood at 56.8 in Q3, improving further to 57.4 in Q4 with an uptick in new export orders and employment. Business expectations for manufacturing remained optimistic, as indicated by future output assessment (Chart III.18a). III.2.3 Services Services sector remains the mainstay of the Indian economy, with contribution of around 75 per cent to GVA growth in 2024-25. A notable transformation within India’s services sector has been observed with the growing share of high-skill and high-value services. The services sector maintained its momentum in Q3:2024-25, with an impetus from trade, hotels, transport, communication and broadcasting; financial, real estate and professional services; and public administration, defence and other services (Chart III.19a). As per the SAE, the services sector grew robustly at 7.5 per cent in 2024-25, on top of 9.2 per cent growth a year ago. Finished steel consumption and cement production – proximate indicators of construction activity – improved from Q3 and recorded double-digit growth during Jan-Feb 2025. Steel consumption, however, contracted marginally in March (Chart III.19b). 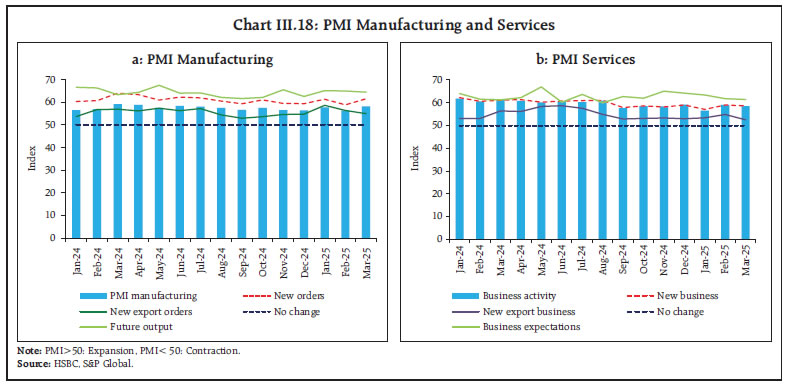
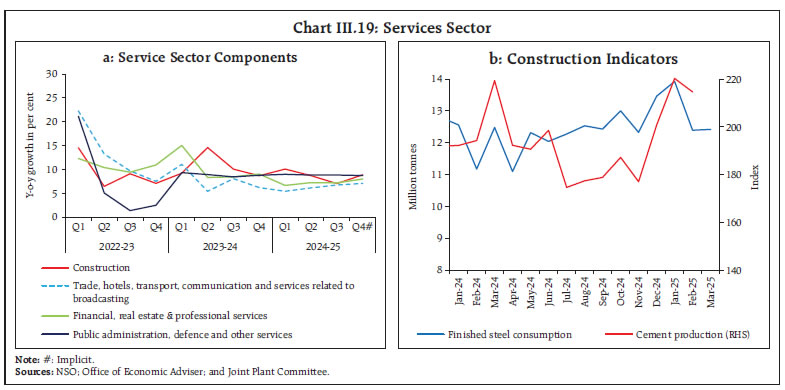 Trade, hotels, transport, and communication recorded a growth of 6.7 per cent in Q3:2024-25 (6.1 per cent in Q2). GST collections improved in Q4, indicating healthy domestic trading activity. Domestic air passenger traffic sustained strong growth in January-February 2025, reflecting steady growth in tourism and business-related travels. Indicators of transportation services exhibited a mixed picture – toll collections remained strong in Q4 and port cargo rebounded strongly in Q4 after a weak performance in Q3, while passenger vehicle sales recorded muted growth during this period. Financial, real estate and professional services rose by 7.2 per cent in Q3:2024-25 and was a major contributor to services sector GVA growth (33.1 per cent) as well as to aggregate GVA growth (23.9 per cent). Bank credit and deposits expanded by 12.1 per cent and 10.5 per cent, respectively, in March 2025. Insurance premia in non-life segments grew at a healthy rate in H2 (October-February), while life insurance premia witnessed a contraction (Table III.16). Nominal sales of non-IT services remained buoyant and registered double-digit growth in Q3. The performance of IT sector also inched up further in Q3, despite global headwinds (Chart III.20). 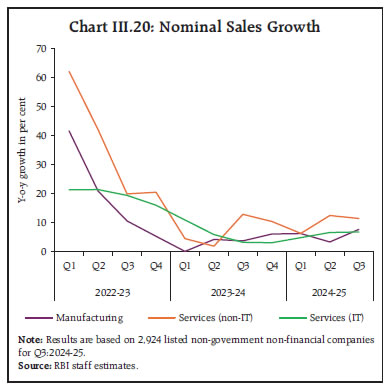
| Table III.16: Services Sector y-o-y growth | | (Per cent) | | | Indicators | 2024-25 | | Q1 | Q2 | Q3 | Jan | Feb | Mar | | 1 | PMI: Services (>50 indicates growth over previous month) | 60.5 | 59.6 | 58.7 | 56.5 | 59.0 | 58.5 | | | Construction | | 2 | Steel consumption | 15.0 | 12.0 | 7.8 | 10.9 | 10.9 | -0.5 | | 3 | Cement production | 0.4 | 3.2 | 6.6 | 14.6 | 10.5 | | | | Trade, Hotels, Transport, Communication and Services related to Broadcasting | | 4 | Commercial vehicle sales | 3.5 | -11.0 | 1.2 | | | | | 5 | Domestic air passenger traffic | 5.6 | 7.2 | 11.4 | 14.1 | 12.1 | | | 6 | Domestic air cargo | 7.1 | 7.6 | 4.6 | 6.9 | -2.5 | | | 7 | International air cargo | 18.4 | 21.9 | 15.0 | 7.1 | -6.3 | | | 8 | Port cargo | 3.9 | 6.2 | -1.7 | 6.2 | 7.4 | 13.3 | | 9 | Toll collection: volume | 5.6 | 7.6 | 9.9 | 14.8 | 18.7 | 11.9 | | 10 | Petroleum consumption | 3.9 | 1.0 | 5.4 | 3.0 | -5.2 | -3.1 | | 11 | GST E-way bill | 16.0 | 16.8 | 16.9 | 23.1 | 14.7 | 20.2 | | 12 | GST revenue | 10.2 | 8.9 | 8.3 | 12.3 | 9.1 | 9.9 | | | Financial, Real Estate and Professional Services | | 13 | Credit outstanding | 13.9 | 14.4 | 12.4 | 12.5 | 12.0 | 12.1 | | 14 | Bank deposits | 10.6 | 12.0 | 10.2 | 10.6 | 10.6 | 10.5 | | 15 | Life insurance premium | 22.9 | 16.5 | -6.6 | -8.1 | -11.6 | | | 16 | Non-life insurance premium | 13.3 | 1.9 | 10.8 | 6.6 | -2.8 | | | Sources: CEIC; HSBC; IRDAI; MoSPI; NSO; S&P Global; SIAM; and RBI Staff Estimates. | Real estate activity in Q3:2024-25 presented mixed signals with lesser new launches, reflecting uncertainty about future demand, even as sales recorded some uptick in momentum. As sales surpassed launches, unsold inventory registered a marginal decline (Chart III.21a). The growth in all-India housing prices moderated in Q3, with its pace decelerating across all major cities (Chart III.21b). Public administration, defence, and other services (PADO) grew at 8.8 per cent in Q3, primarily driven by other services, like, health, education and recreation. The centre’s revenue expenditure, excluding interest payments and subsidies, increased by 11.2 per cent during Q3 before contracting by 3.0 per cent in Jan- Feb 2025. Services PMI remained in expansionary zone at 58.7 in Q3 and 58.0 in Q4, although it moderated from 60.1 in H1:2024-25, supported by employment and new business activity from abroad (Chart III.18b and Table III.16). The composite PMI index moderated from the high of 60.4 in H1:2024-25 to 58.9 in Q3, and further to 58.6 in Q4, but remained comfortably above the 50-mark signalling sustained growth. PMI manufacturing and PMI services readings for India have remained the highest globally since July 2022 and April 2023, respectively. III.3 Conclusion After witnessing a transient slowdown in Q2:2024-25, economic activity recovered in Q3 on the back of healthy private consumption and improved government’s capital expenditure. Further, buoyancy in the rural economy, resilient services sector, governments’ efforts to spur household demand through tax incentives and healthy balance sheets of financial entities and corporates along with the easing of financing conditions are expected to give an impetus to growth. Continued geopolitical uncertainties, global trade disruptions, weather-related disturbances amidst high volatility in the global financial markets, on the other hand, pose downside risks to the outlook. While reciprocal tariff by the US will adversely impact India’s net external demand, India’s relative tariff advantage over its peer economies may contain the impact. ________________________________________________________________________________
IV. Liquidity Conditions and Financial Markets Domestic financial markets remained relatively stable and resilient in contrast to volatile global markets during H2:2024-25. Money market rates evolved in sync with the policy stance and shifts in liquidity conditions while bond yields eased in response to domestic developments and global cues. Transmission to lending and deposit rates remained robust. Bank credit growth moderated in H2:2024-25. The Reserve Bank took a slew of liquidity augmenting measures to ensure orderly market conditions. Introduction During H2:2024-25, global financial markets remained volatile amidst elevated trade and policy uncertainties and continuing geopolitical tensions. Advanced economy central banks have been charting out a carefully calibrated course for monetary policy in the wake of a spurt in volatility and foggy macroeconomic outlook. Global bond yields, especially at the longer end, gyrated in line with the shifting economic outlook and expectations about increasingly divergent monetary policy trajectories across jurisdictions. Amidst heightened volatility and regional variations, global equity markets fell sharply in Q4:2024-25. Volatile capital flows and exchange rates and their attendant impact on domestic financial conditions posed complex policy challenges in emerging market economies (EMEs) (see Chapter V for details). IV.1 Liquidity Conditions and the Operating Procedure of Monetary Policy The Reserve Bank of India (RBI) Act, 1934 requires the RBI to place the operating procedure related to the implementation of monetary policy and changes thereto from time to time, if any, in the public domain.1 During H2:2024-25, the monetary policy committee (MPC) changed the stance from withdrawal of accommodation to neutral in October 2024 to ensure that inflation progressively aligns to the 4 per cent target, while supporting growth. To ease liquidity conditions, the cash reserve ratio (CRR) of banks was reduced by 50 basis points to 4.0 per cent of net demand and time liabilities (NDTL) in December 2024, restoring the CRR to its pre-pandemic level while releasing primary liquidity to the tune of ₹1.16 lakh crore to the banking system. To assure markets and instil confidence about the availability of adequate liquidity to meet the productive requirements of the economy, the Reserve Bank undertook a slew of liquidity augmenting measures in Q4:2024-25. It introduced daily variable rate repo (VRR) auctions on all working days with reversal taking place on the next working day effective January 16, 2025. In addition, the Reserve Bank injected durable liquidity through term repo auctions, open market purchase operations and USD/INR Buy/Sell swaps. The Reserve Bank increased the aggregate limit available to Standalone Primary Dealers (SPDs) under the Standing Liquidity Facility (SLF) from ₹10,000 crore to ₹15,000 crore, starting from April 2, 2025, and announced a monthly calendar of open market purchase operations for April 2025. Furthermore, the MPC reduced the policy repo rate by 25 basis points to 6.25 per cent in February 2025. Drivers and Management of Liquidity System liquidity, as measured by net balances under the liquidity adjustment facility (LAF), transited from surplus in H1:2024-25 to deficit in H2:2024-25 (Chart IV.1). On a net basis, average daily injection under the LAF amounted to ₹0.36 lakh crore in H2 as against average daily net absorption of ₹0.39 lakh crore in H1. Changes in the Government of India (GoI) cash balances, expansion in currency in circulation (CiC) and volatile capital flows emerged as the major drivers of liquidity during H2. The leakage of banking system liquidity due to the increase in currency demand and the Reserve Bank’s forex market operations was partly offset by the drawdown of GoI cash balances, reduction in CRR and the Reserve Bank’s liquidity augmenting measures during H2 (Table IV.1). 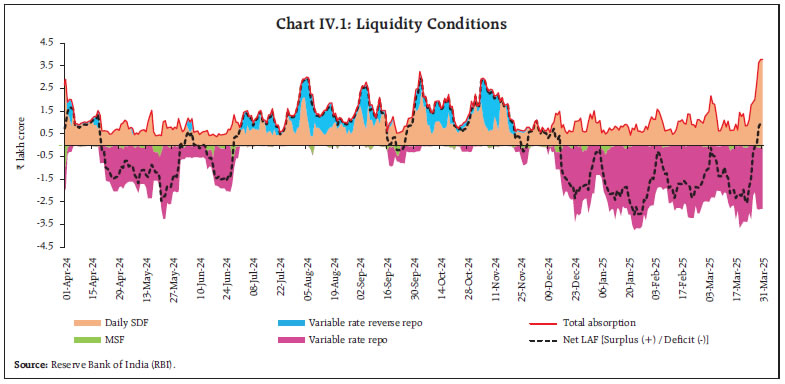 Within H2, system liquidity was in surplus during October-November (except for a brief period at end November) on account of higher government spending, notwithstanding an increase in CiC due to festival related demand in October and significant capital outflows in November. System liquidity turned into deficit during the second half of December due to the combined impact of advance tax payments, capital outflows and currency leakage. The liquidity infusing impact of CRR reduction, drawdown of GoI cash balances and excess reserves was overwhelmed by the withdrawal of banking system liquidity due to increase in CiC and the Reserve Bank’s forex market operations. As a result, average daily net absorption under the LAF (including MSF) declined to ₹0.8 lakh crore in Q3:2024-25 compared to ₹1.3 lakh crore in the preceding quarter. In contrast, liquidity conditions remained in deficit for a major part of Q4 due to continued capital outflows and seasonal increase in CiC. Reflecting liquidity tightness, the average net injection under the LAF stood at ₹1.6 lakh crore in Q4. To manage liquidity conditions, the Reserve Bank introduced daily VRR auctions on all working days beginning January 16, 2025, with the notified amount being in sync with the evolving liquidity conditions. Furthermore, the Reserve Bank took a slew of measures – Open Market Operations (OMOs) purchases, USD/INR Buy/Sell swaps and long term VRRs – to inject durable liquidity into the system. Consequently, system liquidity turned into surplus at end-March, after a gap of more than 3 months. | Table IV.1: Liquidity – Key Drivers and Management | | (₹ crore) | | | 2023-24 | 2024-25 | | H1 | H2 | H1 | Q3 | Q4* | H2* | | Drivers | | | | | | (i) CiC [withdrawal (-) /return (+)] | 89,356 | -2,26,366 | 33,556 | -78,963 | -1,59,204 | -2,38,167 | | (ii) Net Forex Purchases (+)/ Sales (-) | 1,44,667 | 1,94,861 | 70,402 | -3,27,601 | -2,52,034^ | -5,79,635^ | | (iii) GoI Cash Balances [build-up (-) / drawdown (+)] | -4,17,850 | 1,42,694 | -1,50,494 | 1,06,873 | 78,358 | 1,85,231 | | (iv) Excess Reserves [build-up (-) / drawdown (+)] | 34,925 | -46,886 | 36,768 | 41,534 | -39,962 | 1,572 | | Management | | | | | | (i) Net OMO Purchases (+)/ Sales (-) | -8,480 | -10,025 | -24,040 | 0 | 2,83,386 | 2,83,386 | | (ii) Required Reserves [including both change in NDTL and CRR] | -1,35,220 | 7,503 | -55,613 | 39,349 | 37,101 | 76,450 | | (iii) Long term Forex Swaps Buy/Sell (+)/Sell/Buy (-) | - | - | - | - | 2,18,000^ | 2,18,000^ | | (iv) Term Repo Auctions | - | - | - | - | 1,82,964 | 1,82,964 | | Memo Item | | | | | | | | Net Absorption (+)/ Injection (-) as at end-period | -97,015 | -52,918 | 84,651 | -1,82,788 | -172 | -172 | Notes: 1. (+) / (-) sign suggests accretion/depletion in banking system liquidity. 2. Data pertain to the last Friday of the respective period. 3. Net forex purchases or sales do not include the first leg of long-term forex swaps announced by the Reserve Bank.
*: Data for Q4 and H2:2024-25 are up to March 28, 2025. ^: approximate values.
Source: RBI. | Banks’ recourse to the marginal standing facility (MSF) at a daily average of ₹0.06 lakh crore in H2 was lower than ₹0.08 lakh crore in H1. Of the average total absorption under the LAF at ₹1.26 lakh crore during H2, average placement under the standing deposit facility (SDF) constituted about 82.6 per cent (₹1.04 lakh crore), while the remaining amount was absorbed through variable rate reverse repo (VRRR) auctions. The simultaneous occurrence of liquidity deficit conditions alongside substantial fund placements under the SDF suggests asymmetric distribution of liquidity within the banking system as well as increased liquidity preference on the part of banks (Chart IV.2). 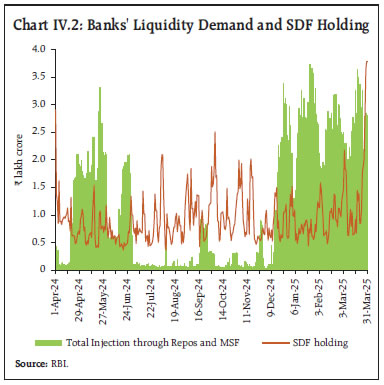 The Reserve Bank remained nimble and flexible in its liquidity management and conducted two-way operations under the LAF in view of the changing liquidity dynamics. With system liquidity remaining in surplus during Q3, five main and 23 fine tuning VRRR auctions (1-4 days maturity) were conducted, cumulatively mopping up about ₹11.7 lakh crore from the banking system in October-November 2024.2 Banks showed reluctance in parking liquidity with the Reserve Bank, as reflected in the lower bid-offer ratio for main as well as fine-tuning VRRR operations (Chart IV.3.a). The demand for liquidity remained elevated during mid-December to February, as reflected in the higher bid-cover ratio for the repo auctions. As liquidity turned into deficit since the latter half of December, two main and 12 fine-tuning VRR auctions were conducted, cumulatively injecting ₹9.4 lakh crore into the system. The demand for liquidity, as reflected in the bid-cover ratios of daily VRRs, moderated in March as liquidity conditions eased in the wake of several liquidity augmenting measures (Chart IV.3.b). Overall, the Reserve Bank conducted four main and 62 fine-tuning VRR auctions to alleviate the liquidity tightness during Q4:2024-25, cumulatively injecting ₹48.7 lakh crore into the banking system.  To meet durable liquidity requirements, the Reserve Bank injected around ₹8.0 lakh crore of liquidity through a combination of CRR cut, open market purchases, term VRR auctions and USD/INR Buy/Sell swaps during H2:2024-25 (Table IV.2). The high bid-cover ratios for the OMOs and forex swaps suggested high demand for durable liquidity. Considering this and the expected financial year-end liquidity tightness, the Reserve Bank provided further durable liquidity support through additional OMO purchase auctions of ₹1,50,000 crore and a USD/INR Buy/Sell swap auction of USD 10 billion for a tenor of thirty-six months during March. | Table IV.2: Durable Liquidity Measures during H2:2024-25 | | (Amount in ₹ crore) | | Measures | Auction Date | Description | Bid Cover Ratio | Liquidity injected | | CRR Cut | Announced on December 6, 2024 | CRR cut by 50 bps in two equal tranches of 25 bps each with effect from the fortnight beginning December 14 and December 28 | | 1,16,000* | | OMO Purchase | Q4:2024-25 | Through NDS-OM | | 38,825 | | OMO Purchase auctions | January 30, 2025 | Notified Amount: 20,000 | 6.03 | 20,020 | | February 13, 2025 | Notified Amount: 40,000 | 4.53 | 40,000 | | February 20, 2025 | Notified Amount: 40,000 | 4.69 | 40,000 | | March 12, 2025 | Notified Amount: 50,000 | 2.51 | 50,000 | | March 18, 2025 | Notified Amount: 50,000 | 2.02 | 50,000 | | March 25, 2025 | Notified Amount: 50,000 | 1.35 | 44,541 | | Term Repo Auctions | February 07, 2025 | 56-day VRR auction | 2.17 | 50,010 | | | Notified Amount: 50,000 | | | | February 14, 2025 | 49-day VRR auction | 1.33 | 75,003 | | | Notified Amount: 75,000 | | | | February 21, 2025 | 45-day VRR auction | 0.77 | 57,951 | | | Notified Amount: 75,000 | | | | USD/INR Buy/Sell swap auctions | January 31, 2025 | Tenor: 6 months | 5.12 | 44,000* | | (Settlement on Feb 4, 2025) | Notified Amount: USD 5 billion | | (USD 5.10 Billion) | | February 28, 2025 | Tenor: 3 years | 1.62 | 88,000* | | (Settlement on Mar 4, 2025) | Notified Amount: USD 10 billion | | (USD 10.06 Billion) | | March 24, 2025 | Tenor: 3 years | 2.23 | 86,000* | | (Settlement on Mar 26, 2025) | Notified Amount: USD 10 billion | | (USD 10.04 Billion) | | Total | 8,00,350* | Note: * indicates approximate value.
Source: RBI. | As on March 28, 2025, reserve money (RM) expanded by 3.3 per cent (y-o-y) as against 6.7 per cent a year ago. The lower growth in RM reflected the decline in bankers’ deposits with the RBI on account of the reduction in cash reserve ratio (CRR) in December 2024. Adjusted for the CRR change, growth in RM stood at 5.8 per cent (6.7 per cent a year ago). As on March 21, 2025, growth (y-o-y) in money supply (M3) decelerated to 9.6 per cent from 11.2 per cent a year ago. The money multiplier increased to 5.7 as on March 21, 2025, from 5.4 a year ago, reflecting the dual impact of both the CRR cut and a lower currency-deposit ratio. IV.2 Domestic Financial Markets In contrast to global developments, domestic financial markets remained relatively stable and resilient. Money market rates evolved in sync with the policy stance and shifts in liquidity conditions. Long-term government bond yields eased in response to domestic developments and global cues. Corporate bond yields generally softened while spreads widened during H2:2024-25 reflecting higher softening of G-sec yields. The simultaneous occurrence of rising uncertainties and liquidity constraints drove spreads across market segments (Box IV.1). Equity markets experienced a persistent decline in H2:2024-25 amidst geopolitical, trade and policy uncertainties and foreign portfolio investment (FPI) outflows. The INR traded with a depreciating bias against the US dollar until February, but recovered some of the loses in March and remained among the least volatile major EME currencies. In the credit market, despite some moderation, growth in bank credit continued to outpace deposit expansion in H2:2024-25. Box IV.1: What Drives Yields and Spreads – Liquidity or Uncertainty? In the recent period, global financial markets have remained volatile amidst trade and policy uncertainties, lingering geopolitical tensions and shifting expectations about the monetary policy trajectories of advanced economy central banks. These global spillovers have a disconcerting impact on domestic financial conditions in Emerging Market and Developing Economies (EMDEs), necessitating policy interventions. In the backdrop of elevated uncertainties, the attendant impact of such interventions on domestic liquidity conditions has a bearing on yields and spreads across market segments, which merit closer scrutiny from a policy perspective. Related literature suggests that spreads in the money and bond markets are driven by uncertainty, apart from prevailing liquidity conditions. Uncertainty could emanate from volatility in liquidity conditions, which can have its own independent impact on spreads by increasing the demand for precautionary savings (Amisano and Tristani, 2019). Additionally, economic and policy uncertainty may also cause spreads to increase by tightening credit supply and increasing borrowers’ default premia (Ashraf and Yinjie, 2019). Accordingly, the impact of liquidity conditions and uncertainty on spreads is examined based on monthly data of money and bond markets for the period January 2012 to January 2025, using the following regression specification:  ,where St denotes spreads in the money and bond market segments3; Liq_Condt is liquidity conditions as proxied by Net LAF as a proportion of NDTL in which lower values indicate relatively tighter liquidity conditions; Liq_Uncertt is an indicator variable for months of high liquidity uncertainty4; and Eco_Pol_Uncert captures global economic policy uncertainty5. In addition, an interaction term of liquidity conditions and liquidity uncertainty is included in the specification to capture the heterogeneous impact of liquidity conditions on spreads during periods of high uncertainty (Chart IV.1.1). Lagged dependent variable is included to capture the persistence in spreads. 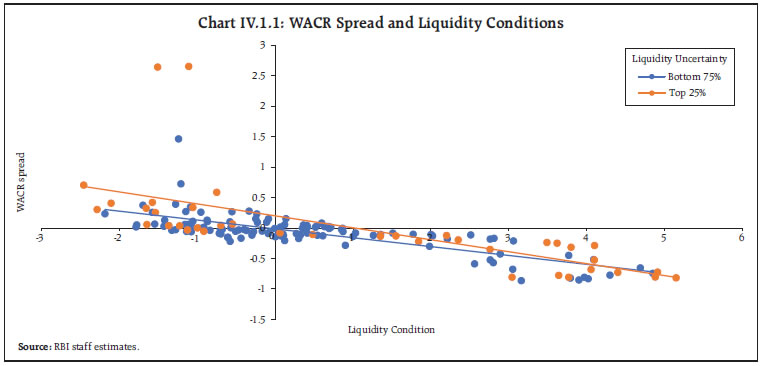 The estimates suggest that an easing of liquidity conditions lowers spreads across all segments in a statistically significant manner, albeit more in the money than in bond markets (Table IV.1.1). Increase in liquidity uncertainty is associated with higher spreads in the overnight money market but its effect on spreads in Commercial Paper (CP) and bond markets is found to be insignificant. This may be attributed to the spreads in CP and bond market reflecting pure credit risk premium, while the liquidity uncertainty premium gets captured in the risk-free rates. Notably, the interaction term of liquidity condition and liquidity uncertainty turns out to be statistically significant for money market spreads, implying the intensified impact of liquidity conditions during periods of high uncertainty. From a policy perspective, the result suggests that providing sufficient liquidity has a more pronounced impact on spreads, especially during uncertain times. Moreover, global economic policy uncertainty is found to have a significant impact on spreads in CP and corporate bond markets. Overall, the findings suggest that while liquidity and uncertainty drive spreads in financial markets with their simultaneous occurrence having a magnified impact, their relative importance varies across market segments and financial cycles. | Table IV.1.1: Drivers of Spread in Money and Bond Market | | Regressors | Dependent Variable | | WACR spread | WAMMR spread | CP spread | AA 3-year spread | AAA 3-year spread | AA 5-year spread | AAA 5-year spread | | Liquidity Condition | -0.033*** | -0.031** | -0.046*** | -0.024*** | -0.026*** | -0.021*** | -0.020*** | | Liquidity Uncertainty | 0.192*** | 0.194*** | 0.039 | 0.054 | 0.022 | -0.006 | -0.026 | | Liquidity Condition*Liquidity Uncertainty | -0.056** | -0.089*** | 0.043 | 0.013 | 0.021 | 0.009 | 0.012 | | Global EPU | | | 0.154** | 0.103** | 0.040 | 0.096*** | 0.050** | | Constant | -0.014 | -0.029 | -0.554 | -0.230 | -0.057 | -0.289** | -0.176 | | Lagged Dependent Variable | 0.749*** | 0.751*** | 0.707*** | 0.774*** | 0.815*** | 0.840*** | 0.890*** | | Number of Observations | 156 | 156 | 156 | 156 | 156 | 156 | 156 | | Adjusted R-squared | 0.782 | 0.768 | 0.615 | 0.712 | 0.785 | 0.800 | 0.882 | | Note: ‘***’,‘**’ and ‘*’ represent statistical significance at 1 per cent, 5 per cent and 10 per cent level, respectively. | References: Amisano, G., and Tristani, O. (2019). Uncertainty Shocks, Monetary Policy and Long-Term Interest Rates. ECB Working Paper No. 2279. Ashraf, B.N., and Yinjie, S. (2019). Economic policy uncertainty and banks’ loan pricing. Journal of Financial Stability, Volume 44. Baker, S.R., Bloom, N., Davis, S.J. (2016). Measuring economic policy uncertainty. Quarterly Journal of Economics, 131, 1593-1636. | IV.2.1 Money Market The weighted average call rate (WACR) – the operating target of monetary policy – moved in tandem with the policy repo rate and the evolving liquidity conditions. During H2:2024-25, the WACR, which remained within the policy corridor and hovered close to the policy repo rate during October-November, hardened, moving close to and occasionally breaching the ceiling of the LAF corridor (MSF rate) during the second half of December and early January. This was partly attributed to the lower lending volumes in the call money market as banks were unwilling to on-lend in the uncollateralised market at the quarter-end; instead, they preferred parking funds under the SDF. In early January, the WACR reverted closer to the policy repo rate as liquidity conditions eased before tightening again in the second week. The WACR moderated since mid-January with the introduction of daily VRR, the policy repo rate cut in February and the RBI’s liquidity augmenting measures. Generally, movements in WACR mainly reflected transient liquidity conditions, softening during the beginning of the month on higher government spending and hardening during the third week due to tax outflows (Chart IV.4.a). Reflecting the alleviation of liquidity tightness at the short-end, the average spread of WACR over the policy repo rate declined to 7 basis points (bps) in March 2025 from a high of 15 bps in December 2024 (Chart IV.4.b). Volatility of the WACR, as measured by the exponential weighted moving average (EWMA)6, however, continued to remain elevated till March 2025. The overnight rates in the collateralised segment, i.e., triparty repo (TREPS) and market repo broadly remained aligned with the WACR. 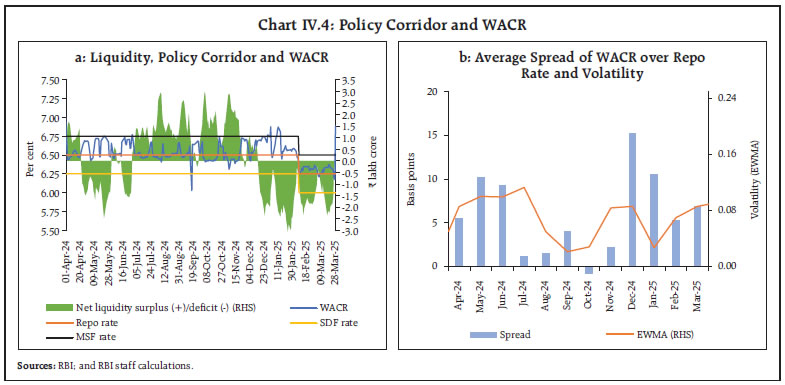
| Table IV.3: Average Volume and Share in Overnight Money Market | | (₹ lakh crore) | | | 2023-24 | 2024-25 | | H1 | H2 | H1 | Q3 | Q4 | H2 | | Call/Notice | 0.10(2) | 0.10(2) | 0.10(2) | 0.10(2) | 0.13(2) | 0.11(2) | | Triparty Repo | 2.87(64) | 3.14(68) | 3.30(68) | 3.74(72) | 3.51(69) | 3.62(70) | | Market Repo | 1.51(34) | 1.37(30) | 1.48(30) | 1.37(26) | 1.48(29) | 1.42(28) | | Total | 4.47(100) | 4.62(100) | 4.88(100) | 5.20(100) | 5.11(100) | 5.16(100) | Note: Figures in parentheses denote share of each segment in overnight money market. Figures may not add up to total due to rounding off.
Sources: Clearing Corporation of India Ltd. (CCIL); and RBI. | Money market activity continued to be dominated by the collateralised (tri-party and market repo) segments, with their share in overnight money market volume mostly remaining unchanged at 98 per cent. (Table IV.3). Mutual funds (MFs) remained the major lenders in the TREPS market, with their share increasing to 67 per cent in H2 from 65 per cent in H1:2024-25. In the market repo segment, the lending share of mutual funds (MFs) increased to 46 per cent in H2 from 41 per cent in H1:2024-25, alongside a decline in the share of foreign banks to 31 per cent from 34 per cent. On the borrowing side, public sector banks (PSBs) remained the dominant players in TREPS, although their share reduced to 40 per cent in H2 from 47 per cent in H1:2024-25. In market repo, however, their share increased to 6 per cent from 4 per cent over the same period. In the longer-term segments of the money market, rates on commercial paper (CPs) and certificates of deposit (CDs) increased during H2 relative to H1:2024-25 due to the liquidity tightness in the banking system (Chart IV.5). On the contrary, T-bill rates softened during the same period. The average spread of CDs and CPs over the policy repo rate increased to 91 bps and 105 bps, respectively, in H2 from 74 bps and 92 bps, respectively, in H1:2024-25. On the other hand, the average spread of T-Bills over the policy repo rate moderated to 4 bps from 25 bps during the same period. 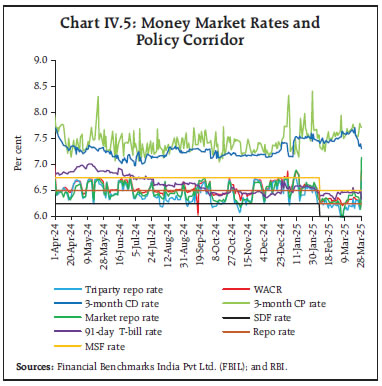 Fresh issuances of CDs increased to ₹6.6 lakh crore in H2 from ₹5.4 lakh crore in H1:2024-25. Consequently, total outstanding amount of CD issuances reached an all-time high of ₹5.3 lakh crore for the fortnight ending March 21, 2025, as banks continued to rely on raising funds through CDs amidst subdued deposit growth. Within H2, CD issuances in the shorter tenor (up to 91-days) declined, with their share in total issuances reducing to 58 per cent in March 2025 from 68 per cent in October 2024. Concomitantly, the share of longer tenor CDs (181-365 days) increased to 40 per cent in March 2025 from 30 per cent in October 2024 (Table IV.4). | Table IV.4: Tenor wise Break up for CD Issuances | | (₹ lakh crore) | | | 2023-24 | 2024-25 | | H1 | H2 | H1 | Q3 | Q4 | H2 | | Up to 91 Days | 2.37(76) | 3.76(68) | 3.93(73) | 1.75(61) | 1.99(54) | 3.74(57) | | 92-180 Days | 0.18(6) | 0.18(3) | 0.20(4) | 0.09(3) | 0.08(2) | 0.17(3) | | 181-365 Days | 0.58(19) | 1.59(29) | 1.22(23) | 1.02(36) | 1.63(44) | 2.64(40) | | Total | 3.13(100) | 5.52(100) | 5.35(100) | 2.86(100) | 3.70(100) | 6.56(100) | Note: Figures in parentheses denote the share of each segment in the overnight money market. Figures may not add up to total due to rounding off.
Sources: CCIL; and RBI staff estimates. |
Resource mobilisation through fresh issuances of CPs increased to ₹8.2 lakh crore during H2 from ₹7.6 lakh crore in H1:2024-25 (Chart IV.6.a). The weighted average discount rate (WADR) of CPs increased during Q4:2024-25 mainly due to liquidity deficit. The spread of CP rate over T-bills increased before the February 2025 policy rate reduction, mainly attributed to policy uncertainty amidst tight liquidity conditions (Chart IV.6.b). Among fresh issuances, the average share of non-banking financial companies (NBFCs) increased to 33 per cent in H2:2024-25 from 32 per cent in H1:2024-25. In the CP market, corporates were the major players with an average share of 38 per cent in total issuances during H2:2024-25 (Chart IV.7). Maturity bucket wise, the 91-180 days segment had the largest share of fresh CP issuances (Table IV.5). Higher issuances of longer tenor CPs during H2 compared to H1 could be attributed to higher investor demand in view of the commencement of an interest rate easing cycle. | Table IV.5: Maturity Profile of CP Issuances | | (₹ lakh crore) | | Tenor | H1: 2023-24 | H2: 2023-24 | H1: 2024-25 | H2: 2024-25 | | 7- 30 days | 0.45(6) | 0.48(7) | 0.63(8) | 0.51(6) | | 31-90 days | 3.18(45) | 2.32(35) | 2.35(31) | 2.33(28) | | 91-180 days | 2.75(39) | 3.11(47) | 3.94(52) | 4.24(52) | | 181-365 days | 0.70(10) | 0.77(12) | 0.64(8) | 1.11(14) | | Total | 7.09(100) | 6.67(100) | 7.55(100) | 8.19(100) | | Outstanding (as at end-period) | 4.12 | 3.89 | 3.98 | 4.43 | Note: Figures in parentheses denote the share of each maturity profile. Figures may not add up to total due to rounding off.
Sources: CCIL; F-TRAC; and RBI | IV.2.2 Government Securities (G-sec) Market The 10-year G-sec yield moved in the range of 6.62 to 6.86 per cent during H2:2024-25. At the beginning of H2, yields hardened, tracking movements in US yields and the rise in crude oil prices. Yields, however, softened amidst positive sentiments on the inclusion of Indian Government Bonds in the Emerging Market Government Bond Index (EMGBI). During November, yields softened primarily due to sharp fall of gross domestic product (GDP) growth estimates of Q2 and anticipation of an early easing of monetary policy cycle. The decline in yields continued in December, but it was tempered by the unchanged repo rate and the continuation of neutral stance in the December policy. Yields rose thereafter, following the Federal Open Markets Committee’s (FOMC) indication of a slower pace of rate cuts, and thereafter remained steady. Beginning January, yields exhibited some moderation, tracking US yields and buyback announcements by GoI. Yields came down in the latter half of January due to lower-than-expected US CPI inflation print, fall in crude oil prices and the inclusion of Indian Government Bonds in the Emerging Market Local Currency Index (EMLCI). Yields traded in a narrow range during February and remained steady during end-February on account of release of Q3 GDP data. During March, the yields softened on account of lower-than-expected CPI print, liquidity measures by RBI, lower than expected April-September central government borrowing calendar, and expectations of another rate cut (Chart IV.8). The yields on T-bills hardened during October amidst increasing volatility in the global financial markets. During November, they softened at the short end but hardened at the longer end. The hardening bias continued in December due to tight liquidity conditions and reduced expectations of rate cuts. During January, T-bill rates softened across tenors, tracking the decline in domestic yields, and buoyed by the expectations of policy easing. The softening bias continued for a short period in February with yields hardening amidst the cancellation of treasury bill auctions. During March, T-bill rates softened tracking global and domestic developments (Chart IV.9).
The average trading volume in G-secs and T-bills moderated in H2:2024-25 relative to H1 (Chart IV.10). The weighted average yield (WAY) on traded maturities for G-secs and T-bills declined by 21 bps and 26 bps, respectively, in H2 from that in H1:2024-25. The overall dynamics of the yield curve are captured by its latent factors viz., level, slope and curvature7. Yields have softened across the longer end of the term structure as reflected in the downward shift of the yield curve during H2:2024-25 (Chart IV.11.a), with its average level reducing by 8 bps while the slope of the yield curve steepened by 10 bps (Chart IV.11.b). The curvature, on the other hand, declined by 20 bps, reflecting the softening bias in the mid-segment vis-à-vis the short and long term. In the Indian context, the level and curvature of the yield curve are found to have more information content on future macroeconomic outcomes than the slope owing to market segmentation, unlike in AEs (Patra et al, 2022)8. To facilitate debt consolidation, the Reserve Bank conducted two switch auctions on behalf of GoI amounting to ₹31,424 crore during H2:2024-25. The weighted average maturity (WAM) of the outstanding stock of G-secs increased to 13.24 years as at end-March, 2025 from 12.96 years at end-September 2024, while the weighted average coupon (WAC) was lower over the same period (7.25 per cent as against 7.28 per cent).
During H2:2024-25, five buyback auctions were announced for an aggregate amount of ₹1.25 lakh crore with a view to retiring some of the GoI’s debt, particularly in the backdrop of its improved cash position9. The market response to the auctions, however, was modest with the Reserve Bank accepting offers aggregating only ₹0.88 lakh crore against the notified amount of ₹1.25 lakh crore. The weighted average spread of cut-off yields on state government securities (SGS) over G-sec yields of comparable maturities was 30 bps in H2:2024-25 (Chart IV.12) as against 31 bps in H1. The average inter-state spread on securities of 10-year tenor (fresh issuances) was 4 bps in H2 as against 2 bps in H1.
IV.2.3 Corporate Bond Market Corporate bond yields generally softened while spreads widened during H2:2024-25. Issuer-wise, the average yield on AAA-rated 3-year bonds of public sector undertakings (PSUs), financial institutions (FIs) and banks softened by 5 bps to 7.48 per cent, while those by NBFCs and corporates declined by 14 bps to 7.70 per cent and 18 bps to 7.62 per cent, respectively, in March 2025 over September 2024 (Chart IV.13.a). Nevertheless, the risk premium (the spread of 3-year AAA corporate bond yields over 3-year G-sec yields) increased from 71 bps to 83 bps for PSUs, FIs and banks; from 102 bps to 106 bps for NBFCs; and from 97 bps to 98 bps for corporates in H2:2024-25 (Chart IV.13.b). The increase in risk premia was evident across tenors and rating spectrum amidst moderate corporate performance in Q3:2024-25 and softer economic growth outlook for FY:2024-25 (Table IV.6). In tandem, the average 3-year credit default swap (CDS) spreads that are trading overseas for the State Bank of India and ICICI Bank increased by 2 bps and 4 bps, respectively, in H2:2024-25 over H1. | Table IV.6: Financial Markets - Rates and Spread | | | Interest Rates
(per cent) | Spread (bps)
(over corresponding risk-free rate) | | Instruments | March 2024 | September 2024 | March 2025 | March 2024 | September 2024 | March 2025 | | 1 | 2 | 3 | 4 | 5 | 6 | 7 | | Corporate Bonds | | | | | | | | (i) AAA (1-yr) | 7.97 | 7.92 | 7.76 | 77 | 117 | 115 | | (ii) AAA (3-yr) | 7.95 | 7.80 | 7.62 | 77 | 97 | 98 | | (iii) AAA (5-yr) | 7.74 | 7.70 | 7.60 | 54 | 86 | 89 | | (iv) AA (3-yr) | 8.55 | 8.55 | 8.43 | 137 | 172 | 178 | | (v) BBB-minus (3-yr) | 12.19 | 12.14 | 12.09 | 500 | 531 | 544 | Note: Yields and spreads are computed as monthly averages.
Source: FIMMDA. | Primary issuances of listed corporate bonds in domestic markets stood at ₹4.2 lakh crore during H2 (up to February 2025) as against ₹4.6 lakh crore during H1:2024-2510 (Chart IV.14.a). Overseas issuances at ₹26,494 crore during H2 were lower than ₹33,952 crore during H1:2024-25 amidst heightened global uncertainty and decline in domestic yields. Almost the entire resource mobilisation in the corporate bond market (99.3 per cent) was through the private placement route (up to February 2025). Outstanding investments by foreign portfolio investors (FPIs) in corporate bonds stood at ₹1.21 lakh crore at end-March 2025, as against ₹1.18 lakh crore at end-September 2024, with the utilisation of the approved limits declining to 15.8 per cent from 16.4 per cent (Chart IV.14.b). Secondary market activity, however, picked up, with daily average trading volume at ₹7,715 crore during H2 (up to February 2025) from ₹6,533 crore during H1:2024-25 (Chart IV.14.c). To address the issue of illiquidity in the secondary market for corporate bonds, the Securities and Exchange Board of India (SEBI) issued guidelines to introduce a liquidity window facility allowing bond issuers to give investors voluntary put options, which is the right to sell the bond back to the issuer at specific intervals before maturity. Furthermore, the regulator also announced the establishment of a centralised database for corporate bonds with an objective to create a single authentic source of information on corporate bonds issued in India. IV.2.4 Equity Market The Indian equity market experienced a persistent decline in H2:2024-25 amidst uncertainty over global tariff wars and geopolitical tensions that triggered risk-off sentiment and FPI outflows. The benchmark Bombay Stock Exchange (BSE) Sensex declined in October in the wake of FPI selling amidst geopolitical strains and weaker-than-expected corporate earnings in Q2:2024-25. Markets pared some of the losses in late November and early December on favourable global cues. Subsequently, markets faced headwinds amidst a global sell-off triggered by changes in the US Fed’s monetary policy outlook for 2025. The markets began 2025 on a negative note on risk-off sentiment. Moreover, uncertainties regarding US policy changes, persistent FPI selling and mixed domestic corporate earnings for Q3:2024-25 also dampened investor sentiments. However, markets recovered in the second half of March amid favourable global cues and a rebound in FPI inflows. Overall, the BSE Sensex declined by 8.2 per cent during H2:2024-25 to close at 77,415 at end-March 2025. The broader market indices underperformed the benchmark with the BSE MidCap and BSE SmallCap index shedding 15.8 per cent and 18.4 per cent, respectively (Chart IV.15.a). The India Volatility Index (VIX), a measure of short-term expected volatility of Nifty 50, averaged around 14.5 during H2:2024-25, compared to 14.9 in H1:2024-25. All the BSE sectoral indices registered losses during the second half (Chart IV.15.b). The average daily notional equity derivatives volume exhibited a declining trend in H2 over H1, pursuant to SEBI’s implementation of specific measures to strengthen equity derivatives framework with effect from November 20, 2024 (Chart IV.16). Net FPI flows in the domestic equity markets turned negative in H2:2024-25. In contrast, flows from domestic institutional investors (DIIs) continued to remain robust. Overall, FPIs were net sellers to the tune of ₹2.2 lakh crore while DIIs were net buyers to the tune of ₹3.6 lakh crore in H2 (Chart IV.17.a). On a relative basis, i.e., when FPI outflows are measured with respect to total market capitalisation, outflows remained modest so far at 0.5 per cent of the market capitalisation in comparison to the sell-off of 1 per cent witnessed during October 2021 to July 2022. 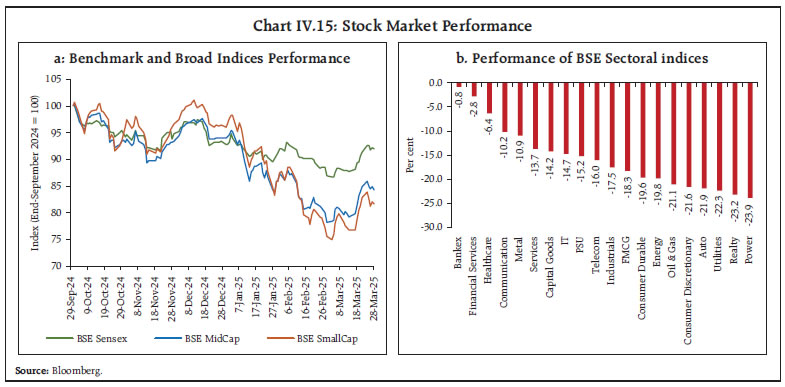
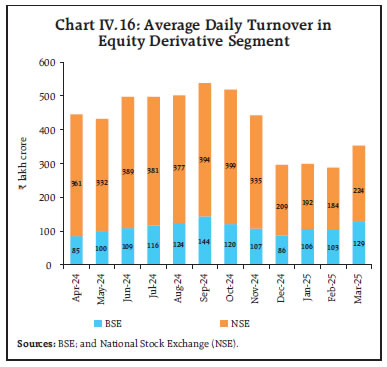 Primary market resource mobilisation in equity markets remained at ₹2.07 lakh crore during H2:2024-25 (up to February 2025) against ₹2.09 lakh crore in H1:2024-25 (Chart IV.17.b). After remaining robust till December, issuances declined significantly in January and February 2025 amidst muted risk sentiment. Out of the total primary market mobilisation during H2 (up to February 2025), amount raised by small and medium enterprises (SME) companies through public issues aggregated ₹4,178 crores as against ₹5,253 crore in H1:2024-25. IV.2.5 Foreign Exchange Market Global foreign exchange market experienced increased volatility during the latter part of 2024-25, primarily due to rising geopolitical tensions and uncertainties regarding trade policies. The US dollar experienced sharp fluctuations, reaching a two-year high in mid-January 2025 due to expectations of robust US economic growth. It, however, subsequently declined, reflecting growing concerns over the sustainability of US economic expansion amidst fears of an impending trade war. Emerging market (EM) currencies initially faced depreciating pressures due to the strengthening of the US dollar but recovered as the dollar weakened. During this period, the Indian rupee (INR) faced downside pressure primarily because of US dollar appreciation. Moreover, persistent FPI outflows, increasing global economic uncertainty, and widening trade deficit added to the downward pressure on the INR. However, the INR staged a recovery in March 2025, supported by FPI inflows and improved risk sentiments (Chart IV.18.a). The INR also experienced heightened volatility, particularly in Q4:2024-25, mirroring the fluctuations in the global foreign exchange market (Chart IV.18.b). The 1-month at-the-money (ATM) option-implied volatility for the INR rose to 3.0 per cent in H2:2024-25 from 2.2 per cent in H1:2024-25. 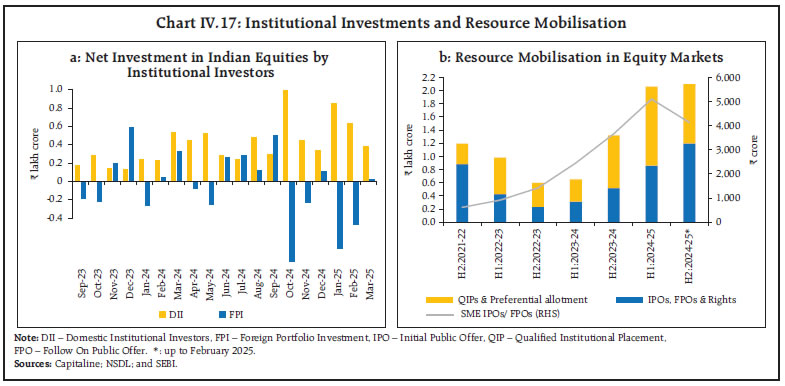
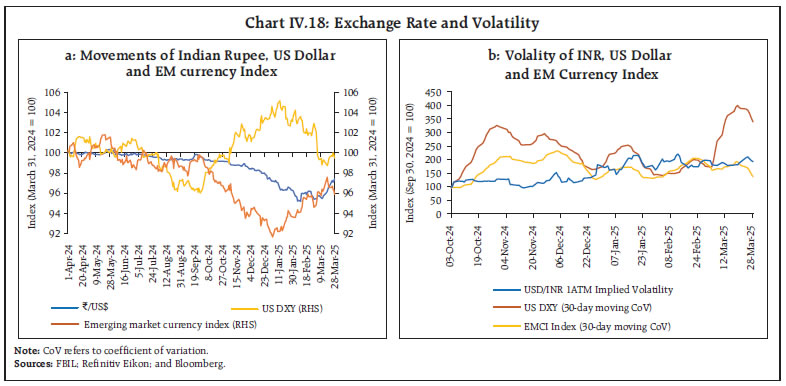 Several global events contributed to foreign exchange market volatility during H2:2024-25, including the US elections, tariff announcements and signals from US Fed meetings (Table IV.7). Forward premia also exhibited significant fluctuations and remained elevated across all maturities during H2:2024-25, reflecting tighter liquidity conditions and heightened global uncertainties (Chart IV.19.a). It surged notably from November 2024 onwards, with the 1-month forward premia surging above longer-term premia, thus resulting in an inversion in the forward premia curve which signalled increased near-term uncertainty and volatility on the back of rising global risk-off sentiment. While forward premia remained elevated, it began to decline since early 2025 due to the RBI’s USD/INR Buy/Sell swap operations to inject durable liquidity into the system before rising during late March. The onshore-offshore spread for the INR followed a similar pattern, rising during Q3:2024-25 in the wake of increased global risk aversion before moderating in Q4 (Chart IV.19.b). | Table IV.7: Episodes of Significance in Global and Domestic Exchange Rate Market During H2:2024-25 | | | Appreciation(+) / Depreciation(-) (%) | Volatility Measures (%) | | ₹/US$ | US DXY | EMCI Index | INR 1 ATM Volatility | 3 Month Forward Premium | | Nov 6, 2024 (US Election Results) | -0.1 | 1.6 | -0.5 | 2.1 | 1.7 | | Nov 25, 2024 (US Tariff Announcement on Mexico, Canada and China) | 0.3 | -0.7 | 0.4 | 2.2 | 1.8 | | Dec 2, 2024 (US Tariff Announcement on BRICS) | -0.2 | 0.7 | -0.5 | 2.8 | 1.9 | | Dec 18, 2024 (US FOMC Meeting) | -0.01 | 1.0 | -1.0 | 2.3 | 2.4 | | Feb 3, 2025 (Executive Orders on Tariffs) | -0.5 | 0.6 | -0.03 | 3.9 | 2.9 | | Feb 4, 2025 (Tariffs Paused for a Month) | -0.01 | -0.9 | 0.3 | 3.7 | 2.7 | | Mar 3, 2025 (Paused Tariffs Imposed) | 0.1 | -0.8 | 0.2 | 3.8 | 2.5 | | Mar 19, 2025 (US FOMC Meeting) | 0.2 | 0.2 | -0.5 | 3.5 | 2.6 | | Sources: FBIL; Refinitiv Eikon; Bloomberg; and RBI staff estimates. |
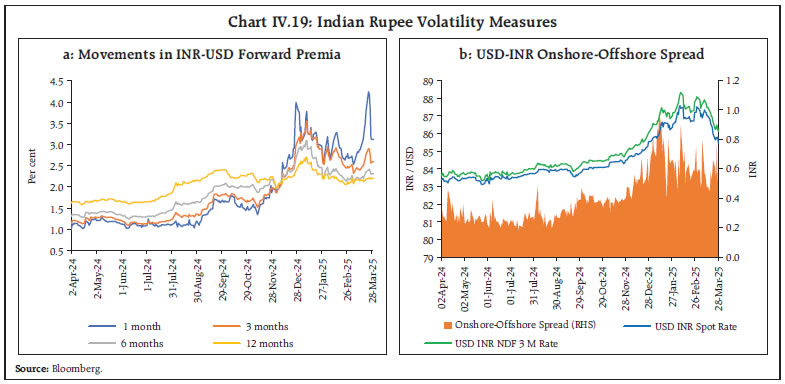 Most major EM currencies depreciated during H2:2024-25 due to a stronger US dollar and heightened global uncertainty (Chart IV.20). Between end-March 2024 and end-March 2025, the INR depreciated by 2.6 per cent against the US dollar, with major depreciation occurring in H2:2024-25. Despite this, the INR’s depreciation during 2024-25 was relatively modest compared to some peer EMEs. Volatility also rose across most EM currencies in H2:2024-25 (Table IV.8). Despite the heightened global uncertainty, however, the INR remained one of the least volatile EM currencies, exhibiting resilience during turbulent times.
In terms of the 40-currency real effective exchange rate (REER), the INR also experienced stress during H2:2024-25, depreciating by 1.9 per cent between September 2024 (average) and March 28, 2025. The depreciation of 40-currency REER in recent months also reflected the narrowing of India’s inflation differential relative to its major trading partners (Chart IV.21.a). From a cross-country perspective, the depreciation of INR’s 40-currency REER remained modest relative to REER of some major economies (Chart IV.21.b). The financial conditions index (FCI) constructed based on twenty Indian financial market indicators11 at daily frequency for the period April 1, 2016 to March 28, 2025 and using the dynamic factor model (DFM) approach suggests broad-based tightening across market segments since early November 2024 (Chart IV.22). Financial conditions eased during March in the wake of relatively easier conditions in the money, equity and forex markets. IV.2.6 Credit Market Bank Credit12 Bank credit growth (y-o-y) moderated during 2024-25. The moderation was seen across bank groups except for public sector banks (PSBs) (Chart IV.23.a). PSBs continued to be the major driver of incremental credit extended by all scheduled commercial banks (SCBs) in 2024-25, while the share for private sector banks (PVBs) declined (Chart IV.23.b). Non-food bank credit of scheduled commercial banks (SCBs) increased at a decelerated pace of 12.0 per cent (y-o-y) as on March 21, 2025, compared to 16.3 per cent a year ago (Chart IV.24). Sector-wise13, bank credit growth to industry remained healthy at 7.3 per cent (y-o-y). While agricultural credit growth remained in double-digit at 11.4 per cent in February 2025, it moderated from 20.0 per cent in February 2024. Despite some deceleration in growth of credit to services sector and personal loans segments at 13.0 per cent and 14.0 per cent, respectively, in February 2025, they remained the prime drivers of non-food credit growth during H2:2024-2514 (Chart IV.25).
Credit to MSMEs15 segment remained robust, registering a growth of 12.3 per cent in February 2025, however, credit to large industry segment recorded a modest growth in H2. Within industry, credit to basic metals and all engineering witnessed a robust growth, while credit to infrastructure sector slowed notably in H2:2024-25 (Chart IV.26). Credit growth to services sector moderated in H2, mainly attributed to decelerated credit growth to NBFCs16. However, credit growth was broadly stable in other major sub-sectors, such as trade, commercial real estate and professional services. Incremental credit (y-o-y) to services sector excluding NBFCs, remained nearly steady in H2 (Chart IV.27). Incremental credit in personal loans segments with unchanged risk weights improved progressively, whereas it moderated for the loan categories with increased risk weights. Housing loans – the largest segment of personal loans – grew at a robust pace despite some moderation, while vehicle loans growth slowed down (Chart IV.28). Irrespective of the moderation, non-food bank credit continued to grow at a healthy pace above the 10- year average y-o-y growth rate (10.5 per cent). Sector-wise, while credit to industry continued to grow above its long-term average, personal loans recorded moderation. Credit growth in services and agriculture sectors hovered around their respective long-term averages. While credit growth remains broadly intact for segments with unchanged risk weight, the growth rate of targeted sectors, i.e., ‘unsecured personal loans’ and ‘bank’s credit to NBFCs’ moderated gradually in response to the regulatory measures undertaken in November 2023 (Chart IV.29 and Table IV.9). 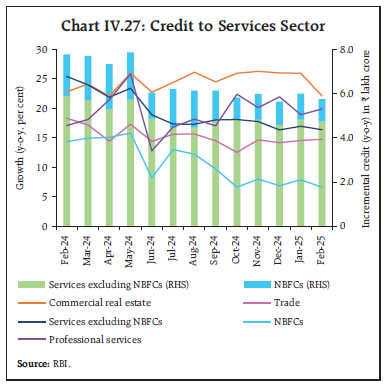
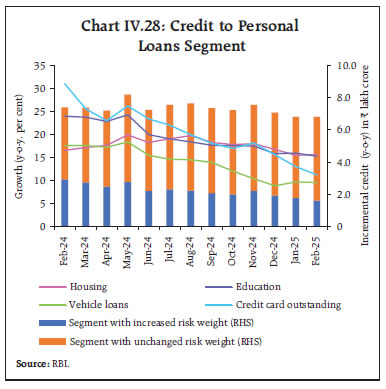
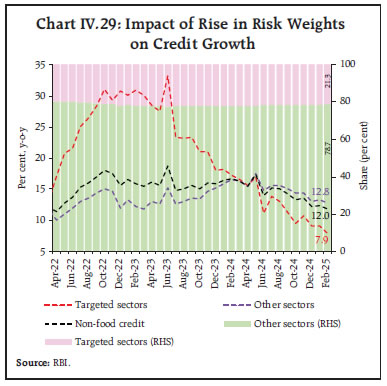
| Table IV.9: Prudential Measures and Sectoral Credit Growth (y-o-y, per cent) | | Sectors/Sub-Sectors# | Long-Term* | Post-COVID** | Nov-23 | Mar-24 | Jun-24 | Sep-24 | Dec-24 | Feb-25 | | Bank Credit without Merger$ | 10.5 | 14.7 | 16.3 | 16.3 | 13.9 | 14.4 | 12.4 | 12.1^ | | Bank Credit with Merger$ | 10.8 | 15.9 | 20.7 | 20.2 | 17.4 | 13.0 | 11.2 | 11.0^ | | Agriculture (13.6) | 11.8 | 15.9 | 18.1 | 20.0 | 17.4 | 16.4 | 12.5 | 11.4 | | Industry (23.2) | 4.1 | 8.0 | 5.5 | 8.0 | 7.7 | 9.1 | 7.4 | 7.3 | | Services (30.0) | 13.4 | 18.7 | 22.2 | 20.8 | 15.1 | 15.2 | 13.0 | 13.0 | | Services excluding NBFCs (20.3) | 11.8 | 18.4 | 24.3 | 24.0 | 18.9 | 18.1 | 16.4 | 16.4 | | NBFCs (9.7) | 19.0 | 19.6 | 18.5 | 15.0 | 8.2 | 9.7 | 6.9 | 6.6 | | Personal Loans (33.2) | 17.2 | 18.0 | 18.7 | 17.6 | 16.6 | 16.4 | 14.9 | 14.0 | | Personal loans segment with unchanged risk weight (21.6) | 16.2 | 16.3 | 16.2 | 17.4 | 18.2 | 18.5 | 17.0 | 16.9 | | Personal loans segment with increased risk weight (11.6) | 19.5 | 21.5 | 23.3 | 18.1 | 13.7 | 12.6 | 11.1 | 9.0 | #: Provisional data, bank credit data is based on Section-42 return. *: 10-year average of y-o-y growth.
**: Average of y-o-y growth since April 2022. $: In July 2023, a non-bank was merged with a bank.
^: Pertain to data for the fortnight ended March 21, 2025.
Note: Figures in parentheses against each sector denote share in total non-food credit as per the data of the fortnight ended February 21, 2025.
Source: RBI. | The asset quality of SCBs improved during 2024-25 (up to December 2024), with the overall gross non-performing assets (NPA) ratio declining to 2.5 per cent in December 2024 from 3.0 per cent a year ago (Chart IV.30.a). Asset quality improved across all the major sectors (Chart IV.30.b). Non-SLR17 investments of banks (comprising investments in CPs, bonds, debentures, and shares of public and private corporates) increased by 1.2 per cent in H2:2024-25, lower than the expansion of 4.8 per cent witnessed in H1:2024-25 (Chart IV.31.a). Growth in adjusted non-food credit (i.e., non-food bank credit plus non-SLR investments by banks) decelerated to 11.8 per cent in Q4:2024-25 from 15.5 per cent in Q4:2023-24 (Chart IV.31.b).
As on February 21, 2025, excess holdings of statutory liquidity ratio (SLR) securities by SCBs moderated to 7.3 per cent of their net demand and time liabilities (NDTL) from 8.5 per cent at end-March 2024 (Chart IV.32). Excess SLR holdings are a component of the liquidity coverage ratio (LCR). They also provide collateral buffers to banks for availing funds under the LAF as well as wholesale funding in the TREPS and market repo segments. NBFCs Credit18 Growth (y-o-y) of credit extended by NBFCs decelerated to 13.3 per cent in February 2025 from 18.6 per cent in February 2024 reflecting the impact of increase in risk weights which has now been reversed effective April 01, 2025. NBFCs' credit to industry, the largest segment in terms of outstanding credit, registered a stable growth in H2:2024-25 (up to February 2025). Retail loans accounted for the largest share of incremental credit, followed by industry, services and agriculture (Chart IV.33). IV.3: Monetary Policy Transmission Transmission to lending rates reached its peak in H1:2024-25 before adjusting downwards thereafter on account of competition among banks to retain market share by reducing the spread (Chart IV.34.a). On the other hand, deposit rates have been increasing in the wake of tighter liquidity conditions and higher credit demand (Chart IV.34.b). In response to the cumulative 250-bps rate hike during the recent tightening cycle, i.e., May 2022 to January 2025, the 1-year median marginal cost of funds-based lending rate (MCLR) of scheduled commercial banks (SCBs) increased by 178 bps. Consequently, the weighted average lending rates (WALRs) on fresh and outstanding rupee loans increased by 181 bps and 115 bps, respectively, during this period. On deposit side, the weighted average domestic term deposit rates (WADTDRs) on fresh and outstanding deposits increased by 253 bps and 199 bps, respectively, during the same period. After reduction in the policy repo rate by 25 bps in February 2025, banks have adjusted their repo-linked lending rates downward by a similar magnitude. In contrast, the MCLR, that has a longer reset period and is linked to the cost of funds, may undergo adjustments with some lag. Consequently, the WALR on outstanding rupee loans declined by 7 bps. In case of fresh loans, however, it has increased by 8 bps during February 2025 reflecting significant proportion of MCLR-linked loans in it (Table IV.10). The share of the external benchmark-based lending rate (EBLR)-linked loans in total outstanding floating rate loans of SCBs increased to 60.6 per cent at end-December 2024 from 56.6 per cent at end-March 2024. Consequently, the share of MCLR-linked loans declined to 35.9 per cent (Table IV.11). With faster adjustments in lending rates, the EBLR system has quickened the pace of monetary policy transmission. 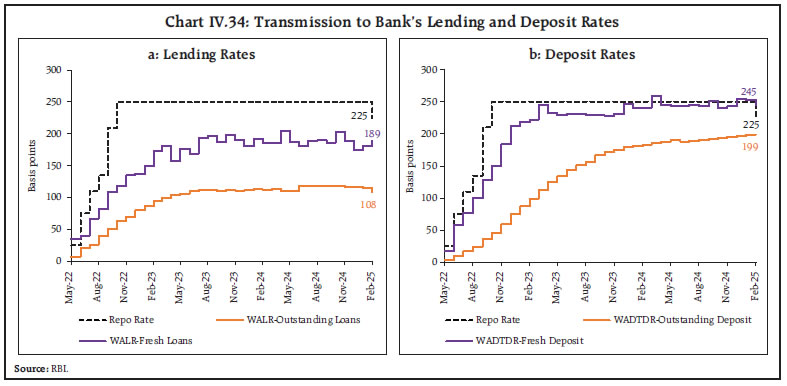
| Table IV.10: Transmission to Banks’ Deposit and Lending Rates | | (Basis points) | | | | Term Deposit Rates | Lending Rates | | Period | Repo Rate | WADTDR- Fresh Deposits | WADTDR- Outstanding Deposits | EBLR | 1-Yr. MCLR (Median) | WALR - Fresh Rupee Loans | WALR- Outstanding Rupee Loans | | | Retail Deposits | Retail and Bulk Deposits | Retail and Bulk Deposits | | | | | | (1) | (2) | (3) | (4) | (5) | (6) | (7) | (8) | (9) | Easing Phase
Feb 2019 to Mar 2022 | -250 | -209 | -259 | -188 | -250 | -155 | -232 | -150 | Tightening Period
May 2022 to Jan 2025 | +250 | 182 | 253 | 199 | 250 | 178 | 181 | 115 | Easing Phase
Feb 2025 - Mar* 2025 | -25 | -3 | -8 | 0 | -25 | 0 | 8 | -7 | | Memo: | | | | | | | | | | Jan- 2025 | 0 | 4 | -1 | 2 | 0 | 0 | 7 | -1 | | Feb- 2025 | -25 | -3 | -8 | 0 | -25 | 0 | 8 | -7 | Note: 1. Data on EBLR pertain to 32 domestic banks.
2. Data on WALR and WADTDR pertain to February 2025.
WALR: Weighted Average Lending Rate; WADTDR: Weighted Average Domestic Term Deposit Rate;
MCLR: Marginal Cost of Funds-based Lending Rate; EBLR: External Benchmark-based Lending Rate.
Sources: MPD 06 return & RBI. | There is still a significant proportion of loans linked to MCLR in the case of public sector banks (PSBs) (Chart IV.35.a). The share of EBLR-linked loans is higher in private banks (PVBs) (Chart IV.35.b). The persistence of loans linked to MCLR and other legacy rates – based on internal benchmarks and having longer reset period – acts as an impediment to overall monetary policy transmission. | Table IV.11: Outstanding Floating Rate Rupee Loans of SCBs across Interest Rate Benchmarks | | (Per cent) | | Regime | March 2020 | March 2022 | March 2024 | December 2024 | | MCLR | 78.3 | 48.7 | 39.2 | 35.9 | | EBLR | 9.1 | 44.0 | 56.6 | 60.6 | | Others | 12.6 | 7.3 | 4.2 | 3.5 | Notes: 1. ‘Others’ include benchmark prime lending rate, base rate and other internal benchmarks.
2. Data pertain to 73 scheduled commercial banks.
Source: RBI. | Bank group-wise, the transmission to WALRs on fresh rupee loans of PSBs was higher than that of PVBs (Chart IV.36.a). Moreover, it was lower for outstanding loans, which could be attributed to the significant proportion of outstanding loans still linked to the internal benchmark-based lending rate. The lending rates of PVBs remained above those of PSBs (Chart IV.36.b). The maximum pass-through to lending rates was witnessed in case of foreign banks, reflecting their higher share of low-cost and wholesale deposits of lower maturity. Moreover, the higher share of EBLR-linked loans in foreign banks has further enhanced monetary policy transmission19. 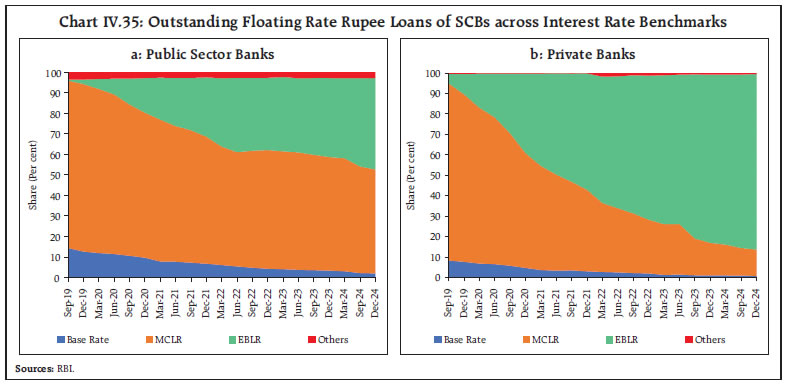 During February 2025, transmission to WALRs on fresh and outstanding loans has been broad-based across sectors (Chart IV.37.a). The differential pace of transmission to different sectors is on account of the proportion of credit portfolios linked to fixed and floating interest rates in the sector and the varied spreads charged by banks. In case of floating rate loans that are mandatorily linked to EBLR, the WALRs on fresh loans of domestic banks declined in the range of 8-19 bps in February 2025. During the tightening cycle, however, it had increased by 220 bps for education loans, 203 bps for vehicle loans, 167 bps for MSME loans, and 163 bps for housing loans (Chart IV.37.b). Banks have reduced their spreads (difference of WALRs on fresh floating rate rupee loans and their benchmark rate), which moderated the extent of transmission (Table IV.12). For loans that are linked to the policy repo rate, the spread on fresh rupee loans (WALR over the repo rate) was the highest for education loans, followed by other personal loans and MSME loans. Among domestic bank groups, PSBs charged a lower spread than PVBs for housing, vehicles, education, and other personal loans. In contrast, PSBs charged a higher spread for MSME loans as compared to PVBs. 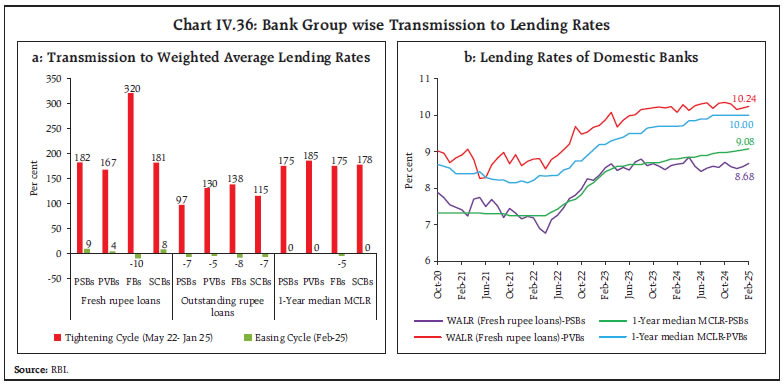
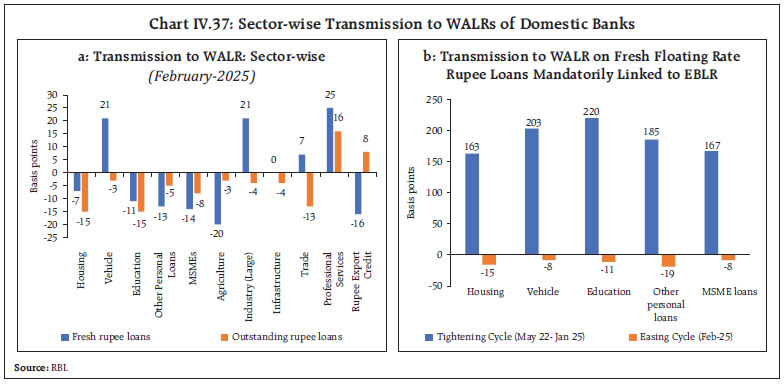 Non-banking financial companies (NBFCs) have been playing an increasingly important role in meeting the credit needs of the economy by extending the last mile of credit to hitherto unbanked areas and providing niche financing to various sectors ranging from real estate and infrastructure to agriculture and micro loans. NBFCs bring more borrowers to formal financial institutional network, enhancing the reach of the credit channel of monetary transmission. Monthly data on lending rates of major NBFCs reveal that interest rates charged by NBFCs tend to be higher as compared to SCBs, inter alia, reflecting their liability structure and the risk profile of their borrowers. The degree of monetary policy transmission, thus, differs between NBFCs and SCBs (Chart IV.38). Systemic liquidity developments and the relatively faster pace of credit growth prompted banks to increase their term deposit rates, especially in shorter tenor deposits (Chart IV.39.a). Across bank groups, the pass-through to WADTDRs on fresh and outstanding deposit rates was higher for PSBs than PVBs (Chart IV.39.b). The rates on savings bank deposits that comprise about 30 per cent of total deposits, however, have remained mostly sticky (Chart IV.39.c). Accordingly, the overall transmission to deposit rates remained low as savings deposit rates remained unresponsive to policy rate changes. In addition, the decline in the share of current account and savings account (CASA) deposits in total deposits, along with the higher transmission to term deposit rates vis-a-vis lending rates have exerted downward pressure on the net interest margins (NIMs) of banks (Chart IV.39.d). | Table IV.12: Spread of WALR (Fresh Loans) over the Repo Rate for Loans linked to External Benchmark | | (Percentage points) | | Sectors | Apr-22 | Feb-25 | | Public sector banks | Private sector banks | Domestic banks | Public sector banks | Private sector banks | Domestic banks | | MSME Loans | 4.27 | 3.93 | 4.04 | 3.38 | 3.37 | 3.37 | | Personal Loans | | | | | | | | Housing | 2.91 | 3.32 | 3.21 | 2.15 | 2.59 | 2.43 | | Vehicle | 3.37 | 4.39 | 3.55 | 2.68 | 4.53 | 3.24 | | Education | 4.42 | 5.71 | 4.71 | 3.79 | 5.19 | 4.55 | | Other personal loans | 3.54 | 7.35 | 4.01 | 3.05 | 5.73 | 3.42 | Note: Other personal loans include loans other than housing, vehicles, education and credit card loans.
Sources: RBI; and RBI staff estimates. |
The GoI reviewed the interest rates on various small savings instruments, which are linked to secondary market yields on G-secs of comparable maturities and kept it unchanged for Q1:2025-26. With these adjustments, the rates on most of the instruments are now above the formula-based rates in the range 16-66 bps (Table IV.13). 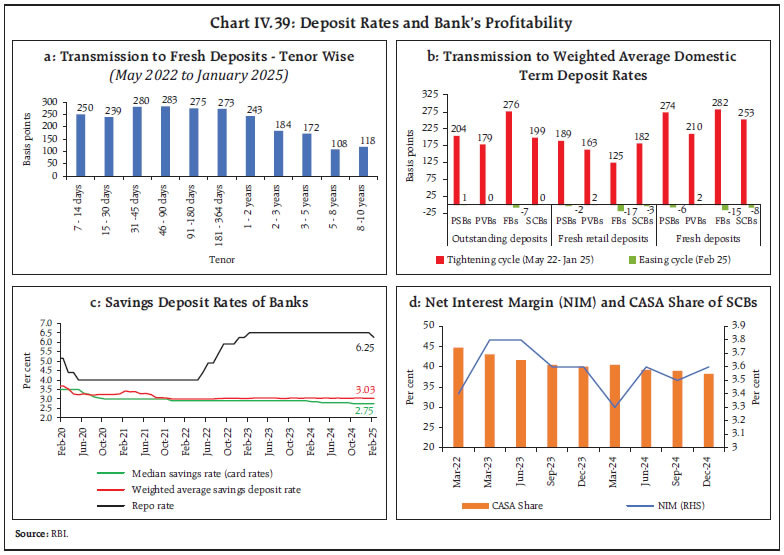
| Table IV.13: Interest Rates on Small Savings Instruments – Q1:2025-26 | | Small Savings Schemes | Maturity (years) | Spread (%age point) $ | Average G-sec Yield (%) of Corresponding Maturity (Dec 2024-Feb 2025) | Formula based Rate of Interest (%) (applicable for Q1:2025-26) | Government Announced Rate of Interest (%) in Q1:2025-26 | Difference (percentage points) | | (1) | (2) | (3) | (4) | (5) = (3) + (4) | (6) | (7) = (6) - (5) | | Savings Deposit | - | | | | 4.00 | - | | Public Provident Fund | 15 | 0.25 | 6.85 | 7.10 | 7.10 | 0.00 | | Term Deposits | | | | | | | | 1 Year | 1 | 0 | 6.45 | 6.45 | 6.90 | 0.45 | | 2 Year | 2 | 0 | 6.50 | 6.50 | 7.00 | 0.50 | | 3 Year | 3 | 0 | 6.54 | 6.54 | 7.10 | 0.56 | | 5 Year | 5 | 0.25 | 6.62 | 6.87 | 7.50 | 0.63 | | Recurring Deposit Account | 5 | 0 | 6.54 | 6.54 | 6.70 | 0.16 | | Monthly Income Scheme | 5 | 0.25 | 6.59 | 6.84 | 7.40 | 0.56 | | Kisan Vikas Patra | 115 months | 0 | 6.85 | 6.85 | 7.50 | 0.65 | | NSC VIII issue | 5 | 0.25 | 6.79 | 7.04 | 7.70 | 0.66 | | Senior Citizens Saving Scheme | 5 | 1.00 | 6.62 | 7.62 | 8.20 | 0.58 | | Sukanya Samriddhi Account Scheme | 21 | 0.75 | 6.85 | 7.60 | 8.20 | 0.60 | $: Spreads for fixing small saving rates as per GoI Press Release of February 2016.
Note: Compounding frequency varies across instruments.
Sources: GoI; FBIL and RBI staff estimates. | IV.4 Conclusion Domestic financial markets broadly mirrored volatile global financial market conditions in H2:2024-25. After remaining in surplus in October and November, system liquidity turned into deficit during the second half of December on account of several factors, both domestic and global. The Reserve Bank took a slew of liquidity augmenting measures to ensure orderly market conditions and enhance monetary policy transmission. Domestic long-term bond yields eased amidst improving inflationary outlook and positive global sentiment on India’s economic prospects. Equity market witnessed sharp correction driven by foreign portfolio investment outflows. The INR traded with a depreciating bias until February, recouping some of the losses in March and remaining among the least volatile EME currencies during H2. Lending rates adjusted downwards during H2, while deposit rates remained at elevated level. Going forward, the Reserve Bank will remain agile and nimble in conducting market operations to ensure financial stability while providing adequate liquidity to meet the productive requirements of the economy. ________________________________________________________________________________
V. External Environment The global economy is growing below its long-term average, with heightened near-term risks emanating from implementation of trade restrictive economic policies and evolving geopolitics. Inflation rules above the target for many economies due to persistence in services sector. Central banks have cautiously eased monetary policy, but actions remain divergent. Financial markets remain volatile, impacted by changing growth-inflation dynamics. Intensification of protectionist tariffs, heightened policy uncertainty, lingering geopolitical risks, and inflation persistence pose downside risks to the global growth outlook. The global economy is growing below its longterm average, with near-term outlook shrouded with several risks, especially in the wake of recent reciprocal tariff impositions. Headline inflation continues to rule above the target for most economies, with persistent services and core (headline excluding food and energy) inflation hindering the pace of disinflation. Many central banks have lowered their level of monetary policy restraint but divergence in monetary policy action has increased. Global financial markets remain volatile exhibiting risk-off sentiment over fluctuating perceptions on the monetary policy trajectory and trade related uncertainty. Equity markets, that were buoyed by tax cut expectations and resilient data releases in the US, experienced significant sell-off in March and early April amidst growing trade and policy uncertainty weighing on growth outlook. Bond yields softened and US dollar retreated in Q1:2025 and early April as tariffs announcement stoked fears of global slowdown. V.1 Global Economic Conditions In H2:2024, the global economy remained steady amidst accommodative financial conditions and a rebound in international trade. High frequency indicators for Q1:2025, however, suggest a slowdown in global economic growth as the output index of global composite purchasing managers’ index (PMI)1 was the weakest since the last quarter of 2023. The Organizations for Economic Co-operation and Development (OECD) in its Economic Outlook Interim Report (March 2025) revised the growth forecast downwards by 20 bps and 30 bps to 3.1 per cent and 3.0 per cent for 2025 and 2026 respectively, from its December 2024 projections. Amongst the AEs, the US economy grew by 2.4 per cent (quarter on quarter, seasonally adjusted annualized rates (q-o-q, saar)) in Q4:2024 (lower than the Q3 outturn of 3.1 per cent), supported by increases in consumer and government spending and fall in imports, partly offset by a decline in investment (Table V.1). The labour market remained broadly stable averaging 4.1 per cent during October 2024 to March 2025. The Standard and Poor’s (S&P) US composite PMI touched a three-month high of 53.5 in March driven by a strong rebound in the services sector, which surged to 54.4 in March (51.0 in February). In contrast, growth in manufacturing sector slowed in March, with the PMI easing to 50.2 from 52.7 in February. | Table V.1: Real GDP Growth | | (Per cent) | | Country | Q1-2024 | Q2-2024 | Q3-2024 | Q4-2024 | 2023 | 2024(E) | 2025(P) | 2026(P) | | Quarter-on-quarter, seasonally adjusted, annualised rate (q-o-q, saar) | | Canada | 1.8 | 2.8 | 2.2 | 2.6 | | | | | | Euro area | 1.3 | 0.7 | 1.7 | 0.9 | | | | | | Japan | -2.1 | 3.2 | 1.4 | 2.2 | | | | | | South Korea | 5.3 | -0.9 | 0.4 | 0.3 | | | | | | UK | 3.7 | 1.8 | 0.0 | 0.4 | | | | | | US | 1.6 | 3.0 | 3.1 | 2.4 | | | | | | Year-on-year | | Advanced Economies | | Canada | 0.7 | 1.2 | 1.9 | 2.4 | 1.5 | 1.3 | 2.0 | 2.0 | | Euro area | 0.5 | 0.5 | 1.0 | 1.2 | 0.4 | 0.8 | 1.0 | 1.4 | | Japan | -0.7 | -0.7 | 0.7 | 1.1 | 1.5 | -0.2 | 1.1 | 0.8 | | South Korea | 3.3 | 2.3 | 1.5 | 1.2 | 1.4 | 2.2 | 2.0 | 2.1 | | UK | 0.7 | 1.1 | 1.2 | 1.5 | 0.4 | 0.9 | 1.6 | 1.5 | | US | 2.9 | 3.0 | 2.7 | 2.5 | 2.9 | 2.8 | 2.7 | 2.1 | | Emerging Market Economies | | Brazil | 2.6 | 3.3 | 4.1 | 3.6 | 3.2 | 3.7 | 2.2 | 2.2 | | China | 5.3 | 4.7 | 4.6 | 5.4 | 5.4 | 4.8 | 4.6 | 4.5 | | India | 8.4 | 6.5 | 5.6 | 6.2 | 9.2 | 6.5 | 6.5 | 6.5 | | Indonesia | 5.1 | 5.1 | 5.0 | 5.0 | 5.1 | 5.0 | 5.1 | 5.1 | | Philippines | 5.9 | 6.5 | 5.2 | 5.3 | 5.5 | 5.8 | 6.1 | 6.3 | | Russia | 5.4 | 4.1 | 3.1 | | 4.1 | 3.8 | 1.4 | 1.2 | | South Africa | 0.6 | 0.4 | 0.4 | 0.9 | 0.7 | 0.8 | 1.5 | 1.6 | | Thailand | 1.7 | 2.3 | 3.0 | 3.2 | 2.0 | 2.7 | 2.9 | 2.6 | | Memo: | | World | 2023 | 2024 (E) | 2025 (P) | 2026 (P) | | Year-on-year | | | | | | Output | 3.3 | 3.2 | 3.3 | 3.3 | | Trade volume | 0.7 | 3.4 | 3.2 | 3.3 | E: Estimate P: Projection
Note: India’s data correspond to fiscal year (April-March); e.g., 2024 pertains to April 2024-March 2025.
Sources: Official statistical agencies; Bloomberg; IMF WEO Update, January 2025; and RBI staff estimates. | Real GDP growth in the Euro area moderated to 0.9 per cent (q-o-q, saar) in Q4 following 1.7 per cent growth in Q3 primarily due to decline in inventories, gross fixed capital formation and government expenditure. Labour markets, however, remained resilient, with a historic low unemployment of 6.1 per cent in February 2025. In the Eurozone, the composite PMI in March, rose to 50.9 from 50.2 in February, driven by expansion in services activity while manufacturing sector remained in contraction zone despite climbing to 26 month-high at 48.6. The UK economy rebounded, to grow by 0.4 per cent (q-o-q, saar) in Q4:2024 as growth in services and construction sector more than compensated for the contraction in production. The labour market continued to ease with unemployment rate rising to 4.4 per cent in January from 4.1 per cent in August. The UK composite PMI climbed to a five-month high of 51.5 in March driven by strong services PMI that rose to 52.5 from 51.0 in February, offsetting the sharpest drop in manufacturing PMI since November 2023 to 44.9. Japan’s GDP growth accelerated to 2.2 per cent (q-o-q, saar) in Q4:2024 from 1.4 per cent in Q3 over improved business investment and sharp fall in imports. However, the composite PMI (au Jibun Bank) declined to its lowest level since November 2022 to 48.9 in March from 52.0 in February, as the services PMI slipped to the neutral mark while manufacturing contracted further. Amongst EMEs, China’s real GDP growth accelerated to 5.4 per cent year-on-year (y-o-y) in Q4:2024, marking the strongest quarterly expansion in 2024, thus meeting the government’s annual growth target of around 5 per cent for the full year. Growth was driven by an expansion in the tertiary and secondary sectors, supported by a broad range of government stimulus measures announced since late September, including a 25 bps rate cut in the benchmark lending rate. Growth in the second half of 2024 was led by booming exports, contributing around 45 per cent to the GDP growth in both Q3 and Q4. Industrial capacity utilization also rose by 1.1 percentage points in Q4 as compared to Q3. Consumption, however, remains a weak spot with its share in GDP falling sharply from 88.3 per cent in Q4:2023 to 29.7 per cent in Q4:2024. The composite PMI (Caixin) expanded to 51.8 in March 2025 from 51.5 in February, driven by quicker growth in output across both the manufacturing and services sectors. Among other major EMEs, Brazil’s GDP growth moderated to 3.6 per cent (y-o-y) in Q4:2024 vis-à-vis 4.1 per cent in Q3, driven by contraction in agriculture sector which was more than offset by expansion in the services and industrial sectors. The labour market conditions eased as unemployment increased from 6.2 per cent in Q4:2024 to 6.7 per cent in Q1:2025. The composite PMI increased to four-month high of 52.6 in March supported by strong growth in sales. The South African economy grew at a slightly faster pace of 0.9 per cent in Q4, compared to 0.4 per cent in Q3, driven by sharp growth in agriculture sector, supported by finance and trade industries. However, the composite PMI for South Africa remained in contraction territory for the fourth consecutive month at 48.3 in March as persistent demand weakness continued to weigh on output and sales. Growth in the Russian economy moderated to 3.1 per cent (y-o-y) in Q3:2024 (4.1 per cent in Q2) owing to an increase in supply-side constraints. In March 2025, the composite PMI (49.1), slipped below the neutral mark after five months of expansion due to manufacturing PMI which fell to its lowest level since April 2022 at 48.2. The ASEAN2 economies demonstrated resilient growth in Q4:2024 driven by higher new orders and increased output activity. Overall, southeast asian economies are expected to have grown at a healthy pace in 2024, supported by stronger manufacturing exports and public capital spending in larger economies, with growth expected to remain stable in 2025.3 In Q1:2025, growth remained modest driven by increased output and new orders amidst a continued downtrend in inflationary pressures. In the BRICS economies, GDP growth for 2025 is projected to moderate, barring South Africa and India where growth is expected to accelerate and remain steady, respectively (Table V.2). The inflation outlook is also expected to improve for BRICS economies in 2025, softening for those that had higher inflation but desirably rising for China, already grappling with deflationary pressures. Turning to high frequency indicators, the OECD composite leading indicators (CLIs) for March 2025 showed that most economies remained above the long-term trend (Chart V.1a). The global composite PMI also remained above the neutral mark since February 2023 (Chart V.1b). It expanded to 52.1 in March from 51.5 in February, its highest reading in 2025, driven by solid expansion in services sector. The global manufacturing PMI moderated to 50.3 in March from 50.6 in February over slowdown in growth of output and new orders. Global merchandise trade volume grew for the tenth consecutive month in January 2025, rising sharply by 5.0 per cent (y-o-y). The momentum accelerated to 1.1 per cent, remaining positive for the fourth straight month, as countries front loaded their imports in anticipation of tariff imposition. EMEs remained the major driver of growth for the eighth consecutive quarter in Q4:2024 (October-December). In January 2025, however, the contribution of AEs in world trade growth increased significantly (Chart V.2a). The Freightos Baltic Global Index – the global ocean freight container pricing index that measures 40-feet container prices – contracted sharply by 23.1 per cent (y-o-y) in March 2025 driven by slowdown in demand from China and an increase in vessel capacity amidst new alliances in the shipping industry (Chart V.2b). The latest WTO’s Goods Trade Barometer (March 2025) indicates that global merchandise trade volume expanded at a steady pace through Q4:2024 and is poised to continue growing in the first few months of 2025. According to the IMF’s WEO Update of January 2025, global trade volume is expected to grow by 3.2 per cent and 3.3 per cent in 2025 and 2026, respectively. Nevertheless, the recent wave of tariffs announced by the US and varied trade responses of countries will shape the evolving global trade dynamics going ahead. The initial estimates of WTO indicate that the global merchandise trade volume would contract by about one per cent in 2025.4 | Table V.2: Select Macroeconomic Indicators for BRICS | | Real GDP growth rate (y-o-y, per cent) | Country | 2023 | 2024(E) | 2025(P) | General Government gross debt (per cent of GDP)# | Country | 2023 | 2024(E) | 2025(P) | | Brazil | 3.2 | 3.7 | 2.2 | Brazil | 84.7 | 87.6 | 92.0 | | Russia | 4.1 | 3.8 | 1.4 | Russia | 19.5 | 19.9 | 20.4 | | India | 9.2 | 6.5 | 6.5 | India | 83.0 | 83.1 | 82.6 | | China | 5.4 | 4.8 | 4.6 | China | 84.4 | 90.1 | 93.8 | | South Africa | 0.7 | 0.8 | 1.5 | South Africa | 73.4 | 75.0 | 77.4 | | CPI inflation rate (y-o-y, per cent) | Country | 2023 | 2024(E) | 2025(P) | Current account balance (per cent of GDP) | Country | 2023 | 2024(E) | 2025(P) | | Brazil | 4.6 | 4.3 | 3.6 | Brazil | -1.0 | -1.7 | -1.8 | | Russia | 5.9 | 7.9 | 5.9 | Russia | 2.5 | 2.7 | 2.6 | | India | 5.4 | 4.4 | 4.1 | India | -0.7 | -1.1 | -1.3 | | China | 0.2 | 0.4 | 1.7 | China | 1.4 | 1.4 | 1.6 | | South Africa | 5.9 | 4.7 | 4.5 | South Africa | -1.6 | -1.6 | -1.9 | | General Government net lending/borrowing (per cent of GDP) | Country | 2023 | 2024(E) | 2025(P) | Forex reserves* (in US$ billion) | Country | 2023 | 2024 | 2025 | | Brazil | -7.6 | -6.9 | -7.3 | Brazil | 355.0 | 329.7 | 332.5 | | Russia | -2.3 | -1.9 | -0.5 | Russia | 598.6 | 609.1 | 632.4 | | India | -8.3 | -7.8 | -7.6 | India | 622.5 | 635.7 | 665.4 | | China | -6.9 | -7.4 | -7.6 | China | 3449.7 | 3455.6 | 3498.6 | | South Africa | -5.8 | -6.2 | -6.3 | South Africa | 62.5 | 65.5 | 66.3 | E: Estimate P: Projection
*: Forex reserves for 2025 pertain to February 2025 for all countries except for India (March 2025).
#: Gross debt refers to the nonfinancial public sector, excluding Eletrobras and Petrobras, and includes sovereign debt held by the central bank.
Notes: India’s data correspond to fiscal year (April-March) except data on forex reserves which are as per calendar year. India's inflation data for 2024 is from April 2024 to February 2025.
Sources: Official statistical agencies; WEO October 2024 database and January 2024 Update, IMF; International Reserve and Foreign Currency Liquidity (IRFCL), IMF; and RBI. |
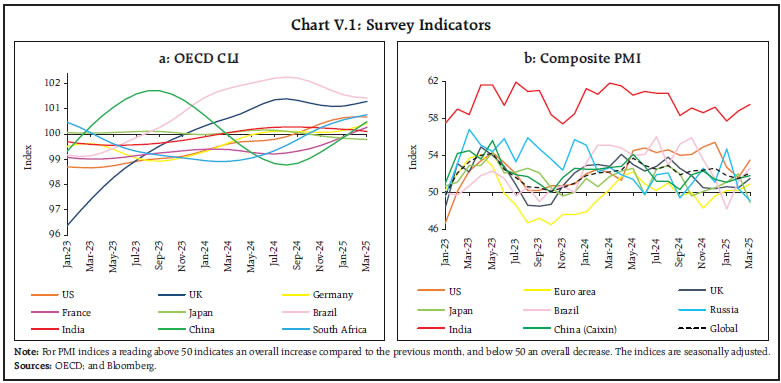
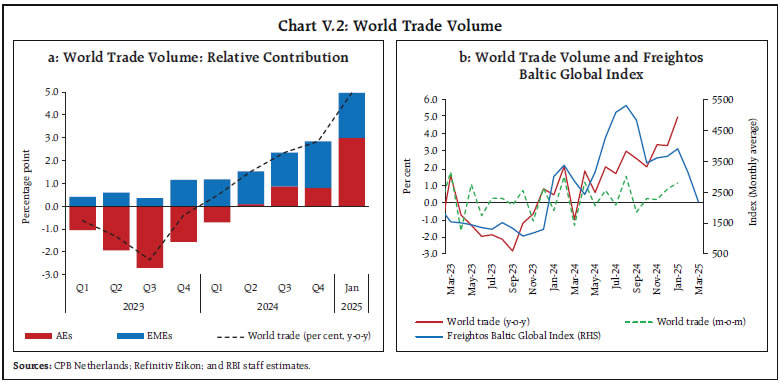 V.2 Commodity Prices and Inflation In Q4:2024, global commodity prices, as measured by the Bloomberg commodity price index, remained volatile with a downward bias, softening by 1.6 per cent due to moderation in metal prices (Chart V.3a). The correction was, however, more than offset in Q1:2025, when prices rose sharply by 7.7 per cent as energy and metal prices increased. The trend again reversed in early April with commodity prices declining in tandem with increasing global slowdown fears over dented demand outlook. According to the Food and Agriculture Organization (FAO), global food prices edged up by 4.0 per cent (q-o-q) in Q4:2024, driven by higher vegetable oil and dairy prices. The prices, however, moderated in Q1:2025 as prices softened by 0.9 per cent, primarily due to sharp decline in sugar prices, despite higher dairy prices (Chart V.3b). Crude oil prices rose in the first fortnight of October, surpassing $80 per barrel due to heightened tensions in the Middle East and Hurricane Milton in the US. Prices softened and remained subdued thereafter in Q4:2024, hovering in the range of $74-76 per barrel, driven by a mix of geopolitical and economic factors. While receding tensions, less than expected China’s stimulus measures and ceasefire discussion in the Middle East continued to pull down prices, anticipation of sanctions and escalating Russia- Ukraine conflict led to occasional price surges. Prices rebounded in January amidst sanctions on Russia’s energy sector and increased demand due to cold weather. Since mid-January, price treaded downwards following ceasefire in Gaza, increasing fears surrounding tariff imposition and higher oil supply. The correction continued till the first week of March when OPEC+ announced to commence its unwinding process.5 Oil prices started rising again after imposition of sanctions on Venezuela and Iran but plummeted to a 3-year low amidst bleak growth prospects and surprise OPEC+ announcement (Chart V.3c). 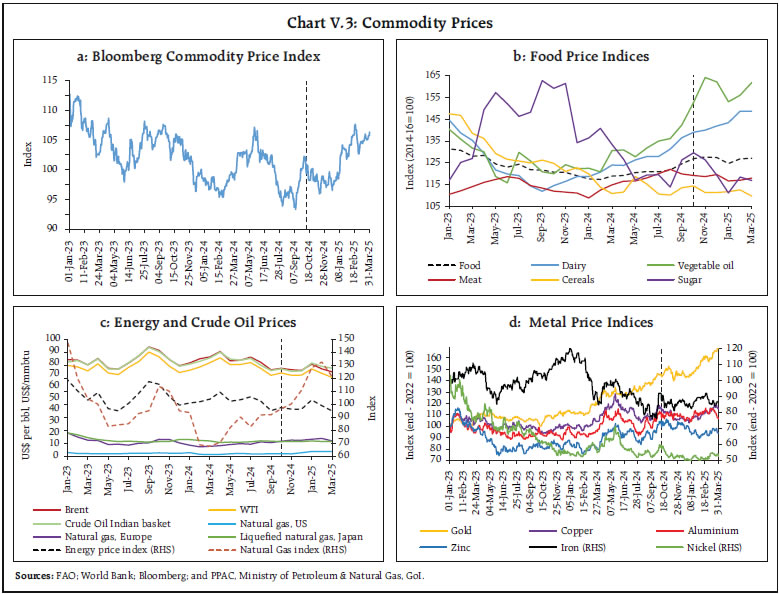 Base metal prices declined in Q4:2024 due to strengthening of US dollar and weak demand from China, the world’s largest consumer of base metals, as Chinese stimulus measures were well below expectations. Prices of most base metals, however, edged up in Q1:2025 over China's stimulus announcement in January but plunged after metals evaded further tariffs levy by the US. Gold prices surged in October by 4.9 per cent (m-o-m) driven by heightened uncertainty regarding the US elections and escalating geopolitical tensions. The rally was more than offset by decline in prices in November and December as strengthening US dollar and treasury yields increased the opportunity cost of holding gold, causing gold prices to fall by 1.5 per cent (q-o-q) in Q4:2024. Thereafter, prices rose sharply in Q1:2025, gaining 19.5 per cent and surpassing the USD 3,100 per ounce mark for the first time, over increased safe haven demand and higher gold purchases by central banks (Chart V.3d). Consumer Price Inflation Consumer price inflation remained above the target in many countries as the progress of disinflation lost momentum. While core goods inflation has eased, services inflation remains above pre-pandemic levels, especially in advanced economies. The OECD in its Interim Economic Outlook Report of March 2025 revised up its inflation projections by 30 bps for both 2025 and 2026 to 3.8 per cent and 3.2 per cent, respectively, for G20 economies. In the US, headline CPI inflation accelerated from 2.4 per cent in September 2024 to 2.8 per cent in February 2025, primarily due to rising shelter prices, whereas core CPI inflation moderated to 3.1 per cent in February after remaining broadly steady at 3.3 per cent from September 2024 to January 2025 (Table V.3). Inflation in terms of the personal consumption expenditure (PCE) price index – the US Federal Reserve’s (Fed) preferred measure of inflation – edged up to 2.5 per cent in February from 2.1 per cent in September (Chart V.4a), while core PCE inched up to 2.8 per cent from 2.7 per cent over the same period (Chart V.4b). In the Euro area, CPI inflation increased from 2.0 per cent in October 2024 to 2.2 per cent in March 2025, while core inflation (inflation excluding energy, food, alcohol, and tobacco) moderated to 2.4 per cent in March after remaining stable at 2.7 per cent for five months from September 2024 to January 2025. In the UK, CPI headline inflation surged by 110 bps to 2.8 per cent in February 2025 from 1.7 per cent in September 2024, whereas core inflation rose by 30 bps over the same period to 3.5 per cent. In Japan, headline inflation rose sharply by 120 bps to 3.7 per cent in February 2025 from 2.5 per cent in September 2024. CPI inflation (all items less fresh food) also increased by 60 bps – from 2.4 per cent in September 2024 to 3.0 per cent in February 2025, while core inflation (inflation excluding both fresh food and energy), rose to 2.6 per cent from 2.1 per cent over the same period. | Table V.3: Consumer Price Inflation | | (Y-o-y, Per cent) | | Country | Inflation Target | Q1:2024 | Q2:2024 | Q3:2024 | Q4:2024 | Q1:2025 | | Advanced Economies | | Canada | 2.0 ± 1.0 | 2.9 | 2.8 | 2.0 | 1.9 | 2.3 | | Euro area | 2.0 | 2.6 | 2.5 | 2.2 | 2.2 | 2.3 | | Japan | 2.0 | 2.6 | 2.7 | 2.8 | 2.9 | 3.9 | | South Korea | 2.0 | 3.0 | 2.7 | 2.1 | 1.6 | 2.1 | | UK | 2.0 | 3.5 | 2.1 | 2.0 | 2.5 | 2.9 | | US | | 3.3 | 3.2 | 2.6 | 2.7 | 2.9 | | | (2.0) | (2.7) | (2.6) | (2.3) | (2.5) | (2.5) | | Emerging Market Economies | | Brazil | 3.0 ± 1.5 | 4.3 | 4.0 | 4.4 | 4.8 | 4.8 | | Russia | 4.0 | 7.6 | 8.2 | 8.9 | 9.0 | 10.0 | | India | 4.0 ± 2.0 | 5.0 | 4.9 | 4.2 | 5.6 | 3.9 | | China | | 0.0 | 0.3 | 0.5 | 0.2 | -0.1 | | South Africa | 3.0-6.0 | 5.4 | 5.2 | 4.3 | 2.9 | 3.2 | | Mexico | 3.0 ± 1.0 | 4.6 | 4.8 | 5.0 | 4.5 | 3.7 | | Indonesia | 2.5 ± 1.0 | 2.8 | 2.8 | 2.0 | 1.6 | 0.6 | | Philippines | 3.0 ± 1.0 | 3.3 | 3.8 | 3.2 | 2.6 | 2.3 | | Thailand | 1.0-3.0 | -0.8 | 0.8 | 0.6 | 1.0 | 1.1 | | Turkey | 5.0 ± 2.0 | 66.8 | 72.3 | 54.4 | 46.7 | 39.8 | | Memo: | | | 2023 | 2024(E) | 2025(P) | 2026(P) | | World consumer price inflation | 6.7 | 5.7 | 4.2 | 3.5 | E: Estimate P: Projection
Notes: (1) Figures in the parentheses for US are year-on-year change in personal consumption expenditure (PCE) price index.
(2) Inflation numbers for Q1:2025 are upto February 2025 except for Euro area, South Korea, Philippines, Thailand, Indonesia and Turkey (March 2025).
Sources: Central bank websites; IMF; and Bloomberg. |
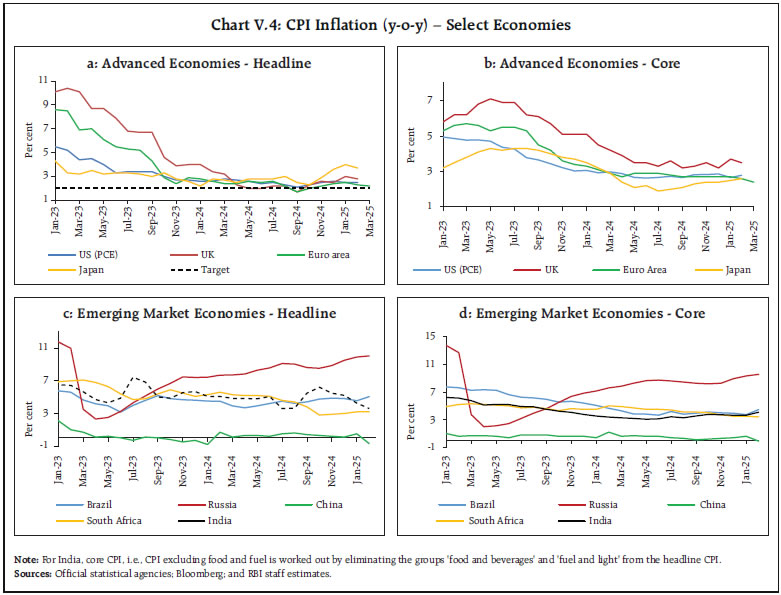 Amongst major EMEs, CPI inflation increased in Brazil to 5.1 per cent in February 2025 from 4.4 per cent in September 2024 (Chart V.4c). In Russia, it accelerated from 8.6 per cent to 10.1 per cent over the same period due to western sanctions and shortage of labour driving up wages. In South Africa, however, inflation receded to 3.2 per cent in February 2025 from 3.8 per cent in September 2024. China experienced positive but low level of inflation, hovering in the range of 0.1 per cent to 0.5 per cent during September 2024 to January 2025, remaining subdued mostly because of weak demand and low consumer confidence. In February 2025, however, the CPI declined to (-)0.7 per cent, returning to the deflationary zone and marking its lowest level in over a year, driven by weak domestic demand. Core inflation movement exhibited divergence for EMEs, moderating for some but accelerating for others (Chart V.4d). Since the October 2024 MPR, the last mile of disinflation is getting prolonged with slowdown in disinflation across AEs and most EMEs (Chart V.5a & 5b). V.3 Monetary Policy Stance Following the synchronous tightening to counter multi-decadal high inflation in 2022-23, central banks commenced their policy normalisation from 2023 and 2024. The pace of easing, however, turned out to be divergent as central banks responded to their own evolving growth-inflation dynamics. Most central banks have become less restrictive but continue to remain vigilant and data dependent for future decisions. Nonetheless, the extent of divergence increased further in the second half of 2024 and early 2025 as some countries continued with their easing cycle, some remained watchful at relatively lower levels of policy rates while a few pre-emptively started hiking to stem any surge in inflation. 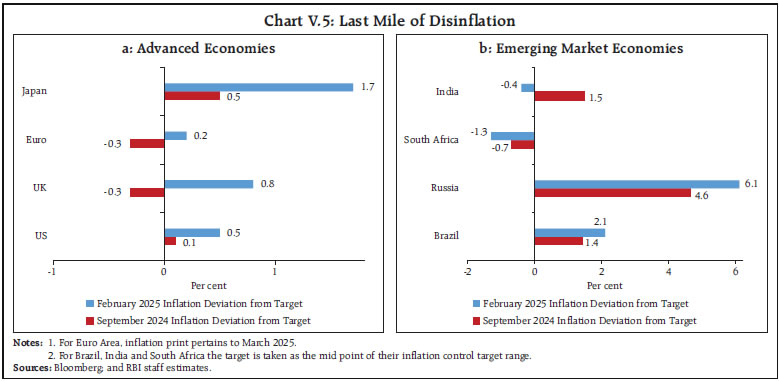 The US Fed initiated easing cycle in September 2024, lowering the target range for the federal funds rate by 50 bps to 4.75-5.00 per cent (Chart V.6a). In its two subsequent meetings, i.e., in November and December, it reduced the federal funds rate by 25 bps each lowering it to 4.25-4.50 per cent. In 2025, however, the policy rate was left unchanged in both the January and March meetings. In its March 2025 meeting, the Fed noted that uncertainty around the economic outlook had increased and announced its plan to slow down the pace of quantitative tightening programme.6 As per the Summary of Economic Projections released in the March meeting, the Federal Open Market Committee (FOMC) expected the target range for the federal funds rates to be at 3.75-4.00 per cent by end 2025, indicating a further 50 bps rate cut in 2025, unchanged from its December 2024 projection. The European Central Bank (ECB) continued to ease its policy rate, lowering the deposit facility rate (DFR) by 25 bps each in all its four meetings held during October 2024 - March 2025, cumulatively reducing the benchmark rate by 150 bps since it began its easing cycle in June 2024. The ECB reiterated that it would follow a data-dependent and meeting-by-meeting approach to determine the appropriate monetary policy stance. Besides, with the principal payments from maturing securities being no longer reinvested, both Asset Purchase Programme (APP) portfolio and Pandemic Emergency Purchase Programme (PEPP) portfolio continue to shrink at a predictable pace. The Bank of England (BoE), however, has been more gradual in its easing cycle, reducing its policy rate in every alternate meeting between August 2024-March 2025. Based on the evolving view of the medium-term outlook for inflation, the BoE indicated a gradual and careful approach to the further withdrawal of monetary policy restraint. 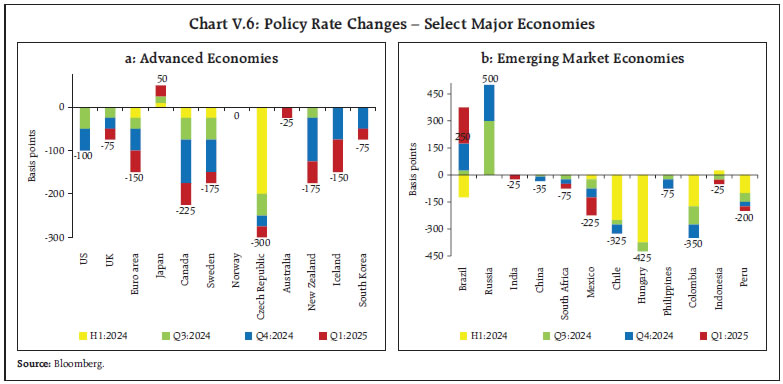 Amongst other major AEs, the Bank of Canada lowered its policy rate during Q4:2024 and Q1:2025 by 150 bps, cumulatively. During all the meetings in Q4:2024, the Reserve Bank of New Zealand (RBNZ) and the Bank of Korea (BoK) reduced their benchmark rates by 50 bps and 25 bps, respectively. In Q1:2025, however, the BoK pared its policy rate by 25 bps in February following a pause in January while the RBNZ continued to ease its policy rate by 50 bps. The Reserve Bank of Australia initiated its policy easing cycle in February 2025, reducing its key rate by 25 bps to 4.10 per cent, after an extended pause since December 2023. The Central Bank of Iceland embarked on policy easing by reducing its key rate by 25 bps in October 2024 and by 50 bps in all its subsequent meetings. In March, however, it tempered its pace to 25 bps. The Sveriges Riksbank lowered the policy rate by 50 bps in its November 2024 meeting, by 25 bps each in its December 2024 and January 2025 meetings and held it constant in its March meeting. The Swiss National Bank also lowered its policy rate by 50 bps in its December meeting and 25 bps in its March meeting. The Czech National Bank reduced its key rate by 25 bps in its November 2024 and February 2025 meetings but held it constant in December 2024 and March 2025 meetings. Norges Bank, however, is yet to begin its policy normalisation process and has maintained a status quo during its Q4:2024 and Q1:2025 meetings. Bank of Israel also kept its policy rate unchanged during these quarters, although it had reduced its policy rate once in January 2024. In contrast, the Bank of Japan (BoJ), after raising its key rate by 15 bps in July, paused in its subsequent meetings in 2024. In its January 2025 meeting, however, the BoJ resumed policy hiking, raising the policy rate by 25 bps while keeping it steady in March. In the BRICS economies, the Banco Central do Brasil, which had initiated the policy tightening cycle in September 2024, continued to raise its Selic rate by 50 bps in November 2024 and by 100 bps each in the month of December, January and March. The South African Reserve Bank cut its repo rate by 25 bps each in its November 2024 and January 2025 meetings, followed by a pause in the month of March. In continuation of the slew of measures announced in September, the People’s Bank of China lowered its one-year Loan Prime Rate (LPR) and over-five-year LPR by 25 bps each to 3.1 per cent and 3.6 per cent, respectively, in October 2024. Since then, it has maintained status quo in all subsequent meetings but indicated that the reserve requirement ratio and interest rates may be further cut depending on the domestic and external economic conditions. The Bank of Russia increased its policy rate by 200 bps in October but maintained status quo thereafter, keeping the key rate elevated at 21.00 per cent amidst inflationary pressures. Among Asian EME central banks, the Bank of Thailand lowered its benchmark rate for the first time in October 2024 by 25 bps followed by a pause in December but again reduced by 25 bps in its February 2025 meeting. The Bank Indonesia maintained status quo on its key rate in Q4:2024, followed by a 25 bps cut in January and pause in subsequent meetings. The central bank of Philippines cut its policy rate by 25 bps in every alternate meeting since October 2024, cumulatively lowering its key rate by 75 bps since the commencement of the rate easing cycle in August 2024. In Latin America, the Banco de Mexico reduced its benchmark rate by 50 bps in Q4:2024 and by 100 bps in Q1:2025. The central bank of Colombia gradually moderated its pace of monetary policy easing by paring its benchmark rate by 50 bps in October 2024 and 25 bps in December, followed by a pause in 2025 so far. Chile lowered its policy rate by 25 bps in each of its meetings in Q4:2024 but paused in Q1:2025. Peru cut its reference rate by 25 bps each in November and January meetings but maintained status quo in October, December, February and March. Among European EMEs, Hungary and Poland kept their policy rates unchanged in all meetings held during Q4:2024 and Q1:2025 (Chart V.6b). V.4 Global Financial Markets Global financial markets remained volatile since the final quarter of 2024 gyrating sharply with every incoming information as the outlook was shrouded in economic, political and trade policy uncertainty. Market sentiment has been largely conditioned by shifting expectations regarding monetary policy amidst fast changing growth-inflation outlook. Equities broadly shed gains since the last MPR but remained volatile throughout, increasing amidst resilient economic indicators, expectations of tax cuts and AI driven rally in China, but retreating due to risk-off sentiment and tariff induced disruptions. In Q4:2024, bond yields had increased, and the US dollar had appreciated in tandem with political transition in the US and uncertainty surrounding geopolitical developments. In Q1:2025, however, the adverse implications of such increased economic uncertainty came to the forefront denting consumer and corporate sentiments and igniting growth concerns causing bond yields in the US to decline and US dollar to depreciate. EME financial markets remain particularly vulnerable to spillovers from such shocks and the associated uncertainty that increases the trade-offs and complicates the conduct of monetary policy (Box V.1). Accordingly, EME currencies depreciated in the fourth quarter of 2024 although recovering partially in the first quarter of 2025. Equity markets, in terms of the Morgan Stanley Capital International (MSCI) world index, remained volatile in the last quarter of 2024 shedding 1.2 per cent in Q4:2024 with EME equity markets underperforming relative to those of AEs (Chart V.7a). In Q1:2025, equity markets extended their sell-off but with reversing trends as EMEs outperformed their AE counterparts. Among AEs, the US S&P 500 remained buoyant for the most part of October, spurred by the unusually aggressive beginning of the rate-cutting cycle by the US Fed, followed by turbulence amidst election-related uncertainty. Nonetheless, as the election outcome unveiled, US stock market rallied in November driven by expectations that the incoming administration’s policies would boost growth, lower taxes, and reduce regulation. Equity markets, however, witnessed an intermittent correction in mid-November post strong economic data releases and hawkish Fed commentary causing readjustments in the monetary policy trajectory (Chart V.8a). The correction persisted through mid-January 2025, as odds of one or no rate cuts by December 2025 increased. Optimism over the US exceptionalism and strong corporate earnings fuelled an equity market rally briefly in the later half of January. After turning cautious in February, markets corrected sharply in March amidst preliminary fears of stagflation and increasing policy uncertainty (Chart V.8b). Overall, the US S&P index rose by 2.1 per cent during Q4:2024 but pared gains to the tune of 4.6 per cent during Q1:2025. 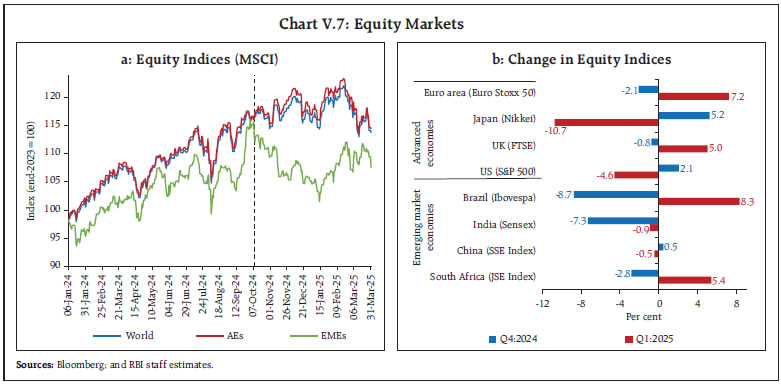
Box V.1: Geopolitical Spillover Shocks on Financial Markets of EMEs Geopolitical tensions and heightened uncertainties owing to conflicts, wars including trade wars and related tensions have been a defining feature of the global landscape over the last few years, with its deleterious impact on the global economy drawing increasing attention of policy makers and researchers. Such systemic geopolitical shocks reinforce “flight home effect” (Feng et al., 2023), leaving the financial system vulnerable, especially in EMEs. Geopolitical events can escalate risk aversion, prompting shifts in investment portfolios, triggering stock market meltdown, exchange rate depreciation, and rising risk premia (Caporale and Menla-Ali, 2024), with heterogenous effects on advanced and emerging markets (Choi, 2025). To gauge the economic ramifications of geopolitical risks (GPR), the GPR Index (Chart V.1.1), which captures the episodic fluctuations linked to major geopolitical events (Caldara and Iacoviello, 2022)7, is used to assess the impact on stock markets, credit spreads and exchange rates of EMEs using monthly data8 spanning 10 years (January 2015 to January 2025). Using the local projections model (Jordà, 2005), the movement in each financial market segment for the subsequent six months is predicted. The orthogonalized impulse response functions (OIRFs) evaluate the impact of a one-unit increase in the GPR Index on EMEs stocks, bonds and currency markets, after employing appropriate controls (Chart V.1.2). 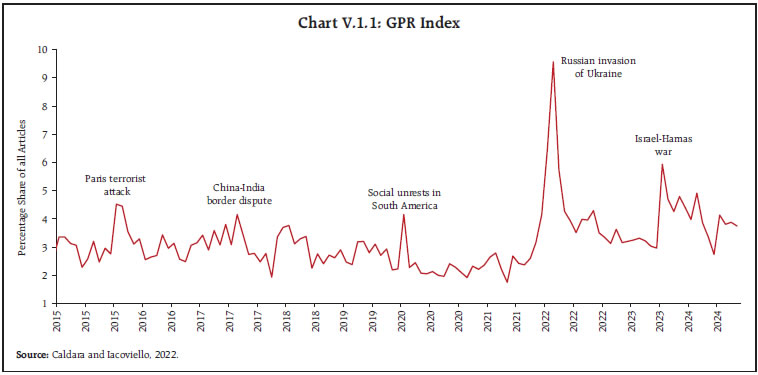
 The results indicate that a one percentage point rise in the GPR Index leads to a significant deterioration in EME financial conditions, causing stock markets to decline by 0.25 percentage points, currencies to depreciate by 0.16 percentage points, and credit spreads to widen by around 1 basis point in the first month, reflecting enhanced risk premia during periods of high geopolitical uncertainty and consequent flight to safety. The effect peaks in the second month in all three market segments, with stock markets shedding gains by 0.64 percentage points, currencies depreciating by 0.32 percentage points and credit spread worsening by around 1.2 basis points by the end of the second month. The effect, thereafter, gradually peters out. Nevertheless, the repeated occurrence of such geopolitical shocks that impinges on the economy with differential impact has lent a persistence to the turmoil and uncertainty, keeping the risks elevated. The findings are broadly robust to alternate lags and controls. Thus, the geopolitical shocks entail risks to financial stability in EMEs, underscoring the need for strategic policy measures to enhance resilience by building on their fundamentals and mitigating vulnerabilities. References: 1. Caldara, D., & Iacoviello, M. (2022). “Measuring Geopolitical Risk”. American Economic Review, 2022. 2. Caporale, G.M., & Menla-Ali, F. (2024). “Geopolitical Risk and Cross-Border Portfolio Flows: Effects and Channels”. CESifo Working Paper No. 11337. 3. Choi, S., & Havel, J. (2025). “Geopolitical risk and U.S. Foreign Portfolio Investment: A Tale of Advanced and Emerging Markets”. Journal of International Money and Finance, 2025. 4. Feng, C., Han, L., Vigne, S., & Xu, Y. (2023). “Geopolitical Risk and the Dynamics of International Capital Flows”. Journal of International Financial Markets, Institutions & Money, January 2023. 5. Jorda, O. (2005). “Estimation and Inference of Impulse Responses by Local Projections”. The American Economic Review, March 2005. | European stocks underperformed in Q4:2024 as tariff fears induced market correction but have markedly outperformed its peers in Q1:2025 amidst ECB rate cut expectations, increased odds of a Russia-Ukraine peace deal, a stronger economy in France passing its contentious 2025 budget and Germany’s fiscal overhaul. The UK’s stock indices broadly tracked the European markets, though with a smaller magnitude, performing well in Q1:2025, supported by higher odds of rate cut by the BoE. The Japanese market outperformed the US market in Q4:2024 as yen weakness towards the end of 2024 bolstered the earnings outlook for large-cap exporters, but retreated in 2025 as policy normalisation by the BoJ led to appreciation of the yen. Barring China, EME equities corrected in Q4:2024, tracking global cues and trade policy uncertainty (Chart V.7b). In 2025 so far, EME equity markets exhibited mixed trends as they gained ground supported by waning currency depreciation pressures but declined following global cues amidst increased uncertainty and idiosyncratic factors. 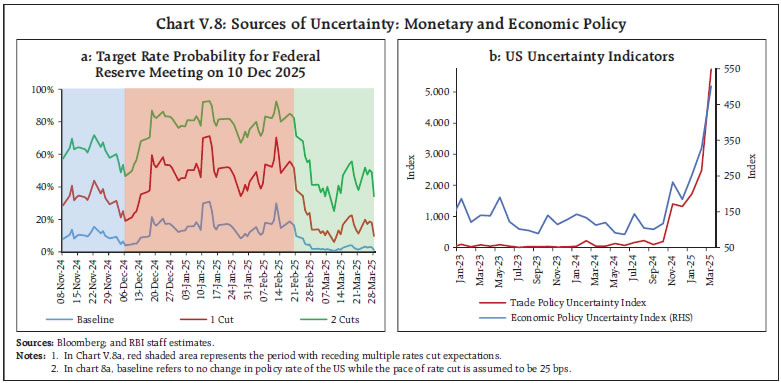 Sovereign bond yields across most major AEs hardened since Q4:2024 in response to expectations of a firmer future path of interest rates amidst sticky inflation and rising economic policy uncertainty. In the US, bond yields hardened in Q4:2024 with the 10- year treasury yield rising by 79 bps due to a revision in the dot plot projection to 50 bps rate cut by the end of 2025 as against 100 bps earlier. In Q1:2025, however, yields softened, driven by fears of growth slowdown, market corrections and shifting perceptions of policy rates and fiscal deficit. The UK 10-year bond yields broadly hardened between October 2024-March 2025. The German 10-year yields also firmed up since Q4:2024 and even more so in March after the fiscal stimulus announcement. The 10-year Japanese Government bond yield firmed up by 63 bps (as on March 31, 2025) since October, driven by the BoJ’s policy normalization, including its stance on further rate hikes contingent on its economic outlook (Chart V.9a). During October 2024-March 2025, bond yields in several EMEs exhibited an upward movement, driven by domestic fiscal conditions and global factors (Chart V.9b). In contrast, bond yields in China eased amidst expectations of further monetary policy easing, while India’s bond yield remained relatively stable during this period with a softening bias. In the currency market, the US dollar appreciated by 9.1 per cent between October 2024 and its peak on January 13, 2025 – the highest level since November 10, 2022 – driven by several factors arising from the policies of the new US administration. Investors swiftly adjusted their portfolios in anticipation of the change in trade and tariff policies, as the inflationary impact of tariffs could prompt the US Fed to adopt a more cautious stance on rate cuts. At the same time, heightened trade tensions clouded the global economic growth outlook, and anticipated stricter immigration policies raised inflation concerns, all leading to portfolio rebalancing in favour of US assets. Since mid-January, however, the dollar has retreated from its multi-year high, amidst high frequency indicators signalling a lacklustre growth momentum, elevated policy uncertainty and non-realisation of other economic policies that had previously fuelled appreciation pressures (Chart V.10a). These movements were mirrored in the EME currencies, though the upswings were capped due to capital outflows (Chart V.10b). The MSCI Emerging Market Currency Index depreciated sharply in Q4:2024 (3.6 per cent) but rose by 1.7 per cent in Q1:2025. 
 V.5 Conclusion Global growth faces considerable headwinds due to intensification of protectionist tariffs and heightened policy uncertainty. The sweeping tariff announcement by the US and ensuing retaliation by other countries risk escalating into a full-blown trade war, potentially disrupting the existing global supply chains. These supply chain disruptions may further hinder the stalling disinflation process, thus impeding the process of monetary policy easing. EMEs face considerable downside risks including burgeoning capital outflows, increasing risk premium and deepening external vulnerabilities. Besides, the recent financial market rout could just be a preview, showcasing the cascading effects of changing trade policies. __________________________________________________________________________________
ABBREVIATIONS | A | Actuals | | ADB | Asian Development Bank | | AE | Advance Estimates | | AEs | Advanced Economies | | AI | Artificial Intelligence | | APP | Asset Purchase Programme | | ASEAN | Association of Southeast Asian Nations | | ATF | Aviation Turbine Fuel | | ATM | At-the-money | | bbl | Barrel | | BE | Budget Estimates | | BIES | Business Inflation Expectations Survey | | BIS | Bank for International Settlements | | BoE | Bank of England | | BoJ | Bank of Japan | | BoK | Bank of Korea | | BoP | Balance of Payment | | bps | Basis points | | BRICS | Brazil, Russia, India, China and South Africa | | BSE | Bombay Stock Exchange | | CACP | Commission for Agricultural Costs and Prices | | CAD | Current Account Deficit | | CAG | Comptroller and Auditor General | | CASA | Current Account and Savings Account | | CCIL | Clearing Corporation of India Limited | | CDs | Certificates of Deposit | | CDS | Credit Default Swap | | CE | Cointegrating Equation | | CEA | Central Electricity Authority | | CFPP | Central Food Grains Procurement Portal | | CGA | Controller General of Accounts | | CI | Confidence Interval | | CiC | Currency in Circulation | | CII | Confederation of Indian Industry | | CLI | Composite Leading Indicator | | CMIE | Centre for Monitoring Indian Economy | | CoV | Coefficient of Variation | | COVID-19 | Coronavirus Disease 2019 | | CPs | Commercial Papers | | CPB | Central Planning Bureau | | CPI | Consumer Price Index | | CPI-AL | Consumer Price Index for Agricultural Labourers | | CPI-IW | Consumer Price Index for Industrial Workers | | CPI-RL | Consumer Price Index for Rural Labourers | | CRR | Cash Reserve Ratio | | CU | Capacity Utilisation | | DoCA | Department of Consumer Affairs | | DFR | Deposit Facility Rate | | DFM | Dynamic Factor Model | | DGCA | Directorate General of Civil Aviation | | DGCI&S | Directorate General of Commercial Intelligence and Statistics | | DI | Diffusion Index | | DII | Domestic Institutional Investor | | EBIT | Earnings Before Interest and Taxes | | EBLR | External Benchmark - based Lending Rate | | ECB | European Central Bank | | ECI | Eight Core Industries | | EIA | Energy Information Administration | | EM | Emerging market | | EMBI | Emerging Market Bond Index | | EMDEs | Emerging Market and Developing Economies | | EMEs | Emerging Market Economies | | EMGBI | Emerging Market Government Bond Index | | EMLCI | Emerging Market Local Currency Index | | EPFO | Employees’ Provident Fund Organisation | | ER | Employment Rate | | EWMA | Exponential Weighted Moving Average | | FAE | First Advance Estimates | | FAO | Food and Agriculture Organization of the United Nations | | FBIL | Financial Benchmarks India Pvt. Ltd | | FCI | Financial Conditions Index | | FCNR | Foreign Currency Non-Resident | | FDI | Foreign Direct Investment | | Fed | Federal Reserve | | FIs | Financial Institutions | | FICCI | Federation of Indian Chambers of Commerce and Industry | | FIMMDA | Fixed Income Money Market and Derivatives Association of India | | FIT | Flexible Inflation Targeting | | FMCG | Fast Moving Consumer Goods | | FOMC | Federal Open Market Committee | | FPI | Foreign Portfolio Investment/Investor | | FPO | Follow on Public Offer | | FRE | First Revised Estimate | | F-TRAC | FIMMDA Trade Reporting and Confirmation System | | FTSE | Financial Times Stock Exchange | | FY | Financial Year | | GDP | Gross Domestic Product | | GFCE | Government Final Consumption Expenditure | | GFCF | Gross Fixed Capital Formation | | GFD | Gross Fiscal Deficit | | GNDI | Gross National Disposable Income | | GoI | Government of India | | GPR | Geopolitical Risks | | G-Secs | Government Securities | | GST | Goods and Services Tax | | GVA | Gross Value Added | | H1 | First Half of the Financial Year (April-September) | | H2 | Second Half of the Financial Year (October-March) | | HFIs | High Frequency Indicators | | HSBC | Hong Kong and Shanghai Banking Corporation | | HSD | High-Speed Diesel | | ICICI | Industrial Credit and Investment Corporation of India (Bank) | | ICR | Interest Coverage Ratio | | IIF | Institute of International Finance | | IIP | Index of Industrial Production | | IMF | International Monetary Fund | | INR | Indian Rupee | | IOCL | Indian Oil Corporation Limited | | IOS | Industrial Outlook Survey | | IPO | Initial Public Offering | | IRDAI | Insurance Regulatory and Development Authority | | IRF | Impulse Response Function | | IRFCL | International Reserves and Foreign Currency Liquidity | | IT | Information Technology | | JSE | Johannesburg Stock Exchange | | LAF | Liquidity Adjustment Facility | | LCR | Liquidity Coverage Ratio | | LFPR | Labour Force Participation Rate | | LMV | Light Motor Vehicle | | LPG | Liquefied Petroleum Gas | | LPR | Loan Prime Rate | | MCLR | Marginal Cost of Funds Based Lending Rate | | MFs | Mutual Funds | | MGNREGA | Mahatma Gandhi National Rural Employment Guarantee Act | | mmbtu | Metric Million British Thermal Unit | | MMRP | Modified Mixed Reference Period | | MoA&FW | Ministry of Agriculture and Farmers’ Welfare | | MoC&F | Ministry of Chemicals and Fertilisers | | MoF | Ministry of Finance | | M-o-M | Month-on-Month | | MoRD | Ministry of Rural Development | | MoSPI | Ministry of Statistics and Programme Implementation | | MPC | Monetary Policy Committee | | MPR | Monetary Policy Report | | MSCI | Morgan Stanley Capital International | | MSF | Marginal Standing Facility | | MSME | Micro, Small and Medium Enterprises | | NBFCs | Non-Banking Financial Companies | | NCAER | National Council of Applied Economic Research | | NDS-OM | Negotiated Dealing System-Order Matching | | NDTL | Net Demand and Time Liabilities | | NIMs | Net Interest Margins | | NPA | Non-Performing Asset | | NRE | Non-Resident External | | NRO | Non-Resident Ordinary | | NSC | National Savings Certificate | | NSDL | National Securities Depository Limited | | NSE | National Stock Exchange | | NSO | National Statistical Office | | NSSO | National Sample Survey Office | | OBICUS | Order Books, Inventories and Capacity Utilisation Survey | | OECD | Organisation for Economic Cooperation and Development | | OIRFs | Orthogonalized Impulse Response Functions | | OLS | Ordinary Least Square | | OMOs | Open Market Operations | | OMSS | Open Market Sale Scheme | | OPEC | Organization of the Petroleum Exporting Countries | | PA | Provisional Accounts | | PADO | Public Administration, Defence and Other services | | PCE | Personal Consumption Expenditure | | PE | Provisional Estimates | | PEPP | Pandemic Emergency Purchase Programme | | PFCE | Private Final Consumption Expenditure | | PLFS | Periodic Labour Force Survey | | PMI | Purchasing Managers’ Index | | POL | Petroleum, Oil and Lubricants | | POSOCO | Power System Operation Corporation Limited | | PPAC | Petroleum Planning and Analysis Cell | | PPP | Purchasing Power Parity | | PSBs | Public Sector Banks | | PSUs | Public Sector Undertakings | | PVBs | Private Sector Banks | | Q1 | First Quarter | | Q2 | Second Quarter | | Q3 | Third Quarter | | Q4 | Fourth Quarter | | QIP | Qualified Institutional Placement | | q-o-q | Quarter-on-Quarter | | RBI | Reserve Bank of India | | RBNZ | Reserve Bank of New Zealand | | RE | Revised Estimates | | RECO | Revenue Expenditure to Capital Outlay | | REER | Real Effective Exchange Rate | | RHS | Right Hand Side | | RM | Reserve money | | RMG | Readymade Garments | | S&P | Standard and Poor’s | | SAAR | Seasonally Adjusted Annualised Rate | | SAE | Second Advance Estimate | | SCBs | Scheduled Commercial Banks | | SDF | Standing Deposit Facility | | SEBI | Securities and Exchange Board of India | | SGS | State Government Securities | | SGST | State Goods and Services Tax | | SIAM | Society of Indian Automobile Manufacturers | | SLF | Standing Liquidity Facility | | SLR | Statutory Liquidity Ratio | | SME | Small and Medium Enterprises | | SPD | Standalone Primary Dealers | | SSE | Shanghai Stock Exchange | | SVAR | Structural Vector Auto Regression | | TBs/T-Bill | Treasury Bills | | TMA | Tractor and Mechanization Association | | TOP | Tomato, Onion and Potato | | TREPS | Tri-party Repo | | UAE | United Arab Emirates | | UK | United Kingdom | | UNCTAD | United Nations Conference on Trade and Development | | US | United States | | USD | US Dollar | | USA | United States of America | | UT | Union Territory | | VAR | Vector Auto Regression | | VAT | Value Added Tax | | VECM | Vector Error Correction Model | | VIX | Volatility Index | | VRR | Variable Rate Repo | | VRRR | Variable Rate Reverse Repo | | WAC | Weighted Average Coupon | | WACR | Weighted Average Call Rate | | WADR | Weighted Average Discount Rate | | WADTDRs | Weighted Average Domestic Term Deposit Rates | | WALRs | Weighted Average Lending Rates | | WAM | Weighted Average Maturity | | WAMMR | Weighted Average Money Market Rate | | WAY | Weighted Average Yield | | WEO | World Economic Outlook | | WMA | Ways and Means Advances | | WPI | Wholesale Price Index | | WTI | West Texas Intermediate | | WTO | World Trade Organization | | YCC | Yield Curve Control | | Y-o-Y | Year-on-Year | |