Biswa
Swarup Misra*
Since their inception, regional rural banks
(RRBs) have taken deep roots and have become a sort of inseparable part of the
rural credit structure in India. The financial viability of the RRBs has, however,
been a matter of concern since the 1980s, just five years after their existence.
A number of committees have gone into the issue of their financial viability and
possible restructuring. This study follows a deductive approach. First the extent
of the problem of the loss making RRBs has been studied to analyse if the problem
is confined to some particular sponsor banks or States. Subsequently, an attempt
is made to enquire as to factors that influence the performance of the RRBs and
the role-played by the sponsor banks. The empirical analysis has been couched
in terms of profit and loss making RRBs for a reasonably long (10-year) period
to draw robust policy inferences.
JEL Classification : G21,
C23, R12
Keywords: RRBs, Restructuring Strategy, Panel
GMM
Introduction
Regional Rural Banks have
been in existence for around three decades in the Indian financial scene. Inception
of regional rural banks (RRBs) can be seen as a unique experiment as well as experience
in improving the efficacy of rural credit delivery mechanism in India. With joint
share holding by Central Government, the concerned State Government and the sponsoring
bank, an effort was made to integrate commercial banking within the broad policy
thrust towards social banking keeping in view the local peculiarities. The genesis
of the RRBs can be traced to the need for a stronger institutional arrangement
for providing rural credit. The Narsimham committee conceptualised the creation
of RRBs in 1975 as a new set of regionally oriented rural banks, which would combine
the local feel and familiarity of rural problems characteristic of cooperatives
with the professionalism and large resource base of commercial banks. Subsequently,
the RRBs were set up through the promulgation of RRB Act1 of 1976. Their equity
is held by the Central Government, concerned State Government and the Sponsor
Bank in the proportion of 50:15:35. RRBs were supposed to evolve as specialised
rural financial institutions for developing the rural economy by providing credit
to small and marginal farmers, agricultural labourers, artisans and small entrepreneurs.
Over the years, the RRBs, which are often viewed as the small man’s
bank, have taken deep roots and have become a sort of inseparable part of the
rural credit structure2 . They have played a key role in rural institutional
financing in terms of geographical coverage, clientele outreach and business volume
as also contribution to development of the rural economy3 . A remarkable feature
of their performance over the past three decades has been the massive expansion
of their retail network in rural areas. From a modest beginning of 6 RRBs with
17 branches covering 12 districts in December 1975, the numbers have grown into
196 RRBs with 14,446 branches working in 518 districts across the country in March
2004. RRBs have a large branch network in the rural area forming around 43 per
cent of the total rural branches of commercial banks. The rural orientation of
RRBs is formidable with rural and semi-urban branches constituting over 97 per
cent of their branch network. The growth in the branch network has enabled the
RRBs to expand banking activities in the unbanked areas and mobilise rural savings.
The mandate of promoting banking with a rural focus, however, would be an
enduring phenomenon only when the financial health of the RRBs is sound. With
built-in restrictions4 on their operations, it is common to expect that the financial
health of the RRBs itself would be a matter of concern. As regards their financial
status, during the year 2003-04, 163 RRBs earned profits amounting to Rs.953 crore
while 33 RRBs incurred losses to the tune of Rs.184 crore. Ninety RRBs had accumulated
losses as on March 31, 2004. Aggregate accumulated loss of RRBs amounted to Rs.
2,725 crore during the year 2003-04. Of the 90 RRBs having accumulated loss, 53
RRBs had eroded their entire owned funds as also a part of their deposits. Furthermore,
non-performing assets (NPAs) of the RRBs in absolute terms stood at Rs.3,299 crore
as on March 31,2004. The percentage of gross NPAs was 12.6 during the year ending
March 31, 2004. While 103 RRBs had gross NPAs less than the national average,
93 had NPAs more than it.
Given the multi agency share holding, this study
makes an attempt to enquire into such factors that influence the performance of
the RRBs and the role played by sponsor bank in a broader scenario. The problem
has been approached in a deductive pattern. First, an attempt is made to identify
the extent of the problem of loss making RRBs and see if they are confined to
some particular sponsor banks or States. If the problem banks and States could
be identified that would help in focussing the attention for an enduring solution.
Subsequently, a model-based approach has been pursued to identify the factors
that are responsible for the problems faced by the RRBs. This study contributes
to the literature on RRBs primarily in two ways. First, the issues concerning
RRBs are an area that is less visited empirically (econometrically) compared to
the vast literature on commercial banks. Whatever studies have emerged on the
topic, they have primarily relied on exploratory analysis done for a particular
year or on a group of RRBs to draw inferences. This kind of an approach has a
serious limitation in that the findings are guided by the choice of the year of
analysis or the particular RRB(s) in question. To overcome this problem, one needs
to consider, as attempted in this paper, a reasonably long period for analysis
where extreme observations would be evened out so that one gets results that are
more dependable. This study is an attempt in that direction. The present study
considers the entire population rather than a few RRBs and a ten-year period for
empirical analysis so that results are broad based and robust. Second, given the
attention at the policy level to restructure the RRBs, it is necessary that the
behaviour of RRBs be analysed separately for the profit and loss making ones,
than all RRBs bunched together so that it helps in policy formulation. Such an
approach has been followed in this study. The rest of the paper is organised
in six segments. Section I provides a brief review of the course for restructuring
and financial viability of RRBs suggested by different committees over the years.
Section II reviews briefly the different factors identified in the literature
that affects the financial performance of commercial banks and also the extant
literature on factors affecting performance of RRBs. A bird’s eye view of
the spatial distribution of the performance of RRBs across the States and sponsor
banks is given in section III. The methodology of the empirical analysis is discussed
in Section IV. Section V discusses the empirical results. Concluding observations
are set out in Section VI. Section
I Restructuring Strategies The financial viability
of RRBs has engaged the attention of the policy makers from time to time. In fact,
as early as 1981, the Committee to Review Arrangements for Institutional Credit
for Agriculture and Rural Development (CRAFICARD) addressed the
issue of financial viability of the RRBs. The CRAFICARD recommended that ‘the
loss incurred by a RRB should be made good annually by the shareholders in the
same proportion of their shareholdings’. Though this recommendation was
not accepted, under a scheme of recapitalisation, financial support was provided
by the shareholders in the proportion of their shareholdings. Subsequently, a
number of committees have come out with different suggestions to address the financial
non-viability of RRBs. For instance, the Working Group on RRBs
(Kelkar Committee) in 1984 recommended that small and uneconomic RRBs should be
merged in the interest of economic viability. Five years down the line, in a similar
vein, the Agricultural Credit Review Committee (Khusro Committee), 1989 pointed
out that ‘the weaknesses of RRBs are endemic to the system and non-viability
is built into it, and the only option was to merge the RRBs with the sponsor banks.
The objective of serving the weaker sections effectively could be achieved only
by self-sustaining credit institutions’. The Committee on Restructuring
of RRBs, 1994 (Bhandari Committee) identified 49 RRBs for comprehensive restructuring.
It recommended greater devolution of decision-making powers to the Boards of RRBs
in the matters of business development and staff matters. The option of liquidation
again was mooted by the Committee on Revamping of RRBs, 1996 (Basu Committee). The
Expert Group on RRBs in 1997 (Thingalaya Committee) held that very weak RRBs should
be viewed separately and possibility of their liquidation be recognised. They
might be merged with neighbouring RRBs. The Expert Committee on Rural Credit,
2001 (Vyas Committee I) was of the view that the sponsor bank should ensure necessary
autonomy for RRBs in their credit and other portfolio management system. Subsequently,
another committee under the Chairmanship of Chalapathy Rao in 2003 (Chalapathy
Rao Committee) recommended that the entire system of RRBs may be consolidated
while retaining the advantages of regional character of these institutions. As
part of the process, some sponsor banks may be eased out. The sponsoring institutions
may include other approved financial institutions as well, in addition to commercial
banks. The Group of CMDs of Select Public Sector Banks, 2004 (Purwar Committee)
recommended the amalgamation of RRBs on regional basis into six commercial banks
- one each for the Northern, Southern, Eastern, Western, Central and North-Eastern
Regions. Thus one finds that a host of options have been suggested starting with
vertical merger (with sponsor banks), horizontal merger (amongst RRBs operating
in a particular region) to liquidation by different committees that have gone
into the issue of financial viability and restructuring strategies for the RRBs. More
recently, a committee under the Chairmanship of A.V Sardesai revisited the issue
of restructuring the RRBs (Sardesai Committee, 2005). The Sardesai committee held
that ‘to improve the operational viability of RRBs and take advantage of
the economies of scale, the route of merger/amalgamation of RRBs may be considered
taking into account the views of the various stakeholders’. Merger of RRBs
with the sponsor bank is not provided in the RRB Act 1976. Mergers, even if allowed,
would not be a desirable way of restructuring. The Committee was of the view that
merging a RRB with its sponsor bank would go against the very spirit of setting
up of RRBs as local entities and for providing credit primarily to weaker sections.
Having discussed various options for restructuring, the Committee was of the view
that ‘a change in sponsor banks may, in some cases help in improving
the performance of RRBs. A change in sponsorship may, inter alia; improve
the competitiveness, work culture, management and efficiency of the concerned
RRBs’. Against this backdrop, a number of issues need empirical probing.
Such as, which are the RRBs that need focus and whether for them the sponsor bank
has really to be made accountable. All these issues fall under the broader questions
of what factors drive the performance of RRBs? and do the sponsor banks have a
role to play? Section II reviews the literature on factors affecting performance
of a commercial bank in general and also in the context of RRBs. Section
II
Review of Literature RRBs though operate
with a rural focus are primarily scheduled commercial banks with a commercial
orientation. Beginning with the seminal contribution of Haslem (1968), the literature
probing into factors influencing performance of banks recognises two broad sets
of factors, i.e., internal factors and factors external to the bank.
The internal determinants originate from the balance sheets and/or profit and
loss accounts of the bank concerned and are often termed as micro or bank-specific
determinants of profitability. The external determinants are systemic forces that
reflect the economic environment which conditions the operation and performance
of financial institutions. A number of explanatory variables have been suggested
in the literature for both the internal and external determinants. The typical
internal determinants employed are variables, such as, size and capital [Akhavein
et al. (1997), Demirguc-Kunt and Maksimovic (1998) Short (1979) Haslem
(1968), Short (1979), Bourke (1989), Molyneux and Thornton (1992) Bikker and Hu
(2002) and Goddard et al. (2004)]. Given the nature of banking
business, the need for risk management is of crucial importance for a bank’s
financial health. Risk management is a reflection of the quality of the assets
with a bank and availability of liquidity with it. During periods of uncertainty
and economic slow down, banks may prefer a more diversified portfolio to avoid
adverse selection and may also raise their liquid holdings in order to reduce
risk. In this context, both credit and liquidity risk assume importance. The literature
provides mixed evidence on the impact of liquidity on profitability. While Molyneux
and Thornton (1992) found a negative and significant relationship between the
level of liquidity and profitability, Bourke (1989) in contrast, reports an opposite
result. One possible reason for the conflicting findings may be the different
elasticity of demand for loans in the samples used in the studies (Guru, Staunton
and Balashanmugam, 2004). Credit risk is found
to have a negative impact on profitability (Miller and Noulas,
1997standard microeconomic profit function. In this context, Bourke (1989) and
Molyneux and Thornton (1992) find that better-quality management and profitability
go hand in hand. As far as the external determinants of bank profitability
are concerned the literature distinguishes between control variables that describe
the macroeconomic environment, such as inflation, interest rates and cyclical
output, and variables that represent market characteristics. The latter refer
to market concentration, industry size and ownership status. Among the external
determinants which are empirically modeled are regulation [Jordan (1972); Edwards
(1977); Tucillo (1973)], bank size and economies of scale [Benston, Hanweck and
Humphrey (1982); Short (1979)], competition [Phillips (1964); Tschoegl (!982)],
concentration [Rhoades (1977); Schuster (1984)], growth in market [Short (1979)],
interest rates as a proxy for capital scarcity and government ownership (Short,
1979). The most frequently used macroeconomic control variables are the inflation
rate, the long-term interest rate and/or the growth rate of money supply. Revell
(1979) introduced the issue of the relationship between bank profitability and
inflation. He notes that the effect of inflation on bank profitability depends
on whether banks’ wages and other operating expenses increase at a faster
pace than inflation. Perry (1992) in a similar vein contends that the extent to
which inflation affects bank profitability depends on whether inflation expectations
are fully anticipated. The influence arising from ownership status of a bank on
its profitability is another much debated and frequently visited issue in the
literature. The proposition that privately owned institutions are more profitable,
however, has mixed empirical evidence in favour of it. For instance, while
Short (1979) provides cross-country evidence of a strong negative relationship
between government ownership and bank profitability, Barth et al. (2004)
claim that government ownership of banks is indeed negatively correlated with
bank efficiency. Furthermore, Bourke (1989) and Molyneux and Thornton (1992) find
ownership status is irrelevant in explaining profitability. While many of the
above factors would be relevant, it would be instructive to scan the literature
that has exclusively focussed on the RRBs.). This result may be explained by taking
into account the fact that more the financial institutions are exposed to high-risk
loans, the higher is the accumulation of unpaid loans implying that these loan
losses have produced lower returns to many commercial banks (Athanasoglou, Brissimis
and Delis, 2005). Some of the other internal determinants found in the literature
are funds source management and funds use management (Haslam, 1968), capital and
liquidity ratios, the credit-deposit ratio and loan loss expenses [Short (1979);
Bell and Murphy (1969); Kwast and Rose (1982)]. Expense management, a correlate
of efficient management is another very important determinant of bank’s
profitability. There has been an extensive literature based on the idea that an
expenses-related variable should be included in the cost part of a The literature
on RRBs recognises a host of reasons responsible for their poor financial health.
According to the Narasimham Committee, RRBs have low earning capacity. They have
not been able to earn much profit in view of their policy of restricting their
operations to target groups. The recovery position of RRBs is not satisfactory.
There are a large number of defaulters. Their cost of operation has been high
on account of the increase in the salary scales of the employees in line with
the salary structure of the employees of commercial banks. In
most cases, these banks followed the same methods of operation and procedures
as followed by commercial banks. Therefore, these procedures have not found favour
with the rural masses. In many cases, banks have not been located at the right
place. For instance, the sponsoring banks are also running their branches in the
same areas where RRBs are operating. The issue whether location matters for the
performance has been addressed in some detail by Malhotra (2002). Considering
22 different parameters that impact on the functioning of RRBs for the year 2000,
Malhotra asserts that geographical location of RRBs is not the limiting factor
for their performance. He further finds that ‘it is the specific nourishment
which each RRB receives from its sponsor bank, is cardinal to its performance’.
In other words, the umbilical cord had its effect on the performance of RRBs.
The limitation of the study is that the financial health of the sponsor bank was
not considered directly to infer about the umbilical cord hypothesis. Nitin and
Thorat (2004) on a different note provide a penetrating analysis as to how constraints
in the institutional dimension5 have seriously impaired the governance of the
RRBs. They have argued that perverse institutional arrangements that gave rise
to incompatible incentive structures for key stakeholders such as political leaders,
policy makers, bank staff and clients have acted as constraints on their performance.
The lacklustre performance of the RRBs during the last two decades, according
to the authors can be largely attributed to their lack of commercial orientation.
An appropriate restructuring strategy would require to identify the problems leading
to the non-satisfactory performance of the RRBs. The performance of the RRBs under
the aegis of their sponsor banks in the spatial dimension has been dealt in some
detail in Section III. Section III
Performance of RRBs in the Spatial Dimension: Some Stylised Facts The
RRBs, over the years have made impressive strides on various business indicators.
For instance, deposits of RRBs have grown by 18 times and advances by 13 times
between 1980 and 1990. Between 1990 and 2004, deposits and advances grew by 14
times and 7 times, respectively (Table 1). Between the
year 2000 and 2004, loans disbursed by RRBs more than doubled reflecting the efforts
taken by the banks6 to improve credit flow to the rural sector. The average per
branch advances also increased from Rs.25 lakh in March 1990 to Rs.154 lakh in
March 2003. When one considers the deployment of credit relative to the mobilisation
of resources, the credit-deposit (C-D) ratio of RRBs were more than 100 per cent
during the first decade of their operations up to 1987. Though the C-D ratio subsequently
became lower, of late, it has shown an improvement and went up from around 39
per cent in March 2000 to 44.5 per cent in March 20047 .
Table
1:Evolution of RRBs: Select Indicators |
(Rs. Crore) |
Parameter | 1980 | 1985 | 1990 | 1995 | 1996 | 1997 | 1998 | 1999 | 2000 | 2001 | 2002 | 2003 | 2004 |
No. of RRBs | 85 | 188 | 196 | 196 | 196 | 196 | 196 | 196 | 196 | 196 | 196 | 196 | 196 |
Capital | 21 | 46 | 91 | 166 | 358 | 705 | 1,118 | 1,380 | 1,959 | 2,049 | 2,143 | 2,141 | 2,221 |
Deposits | 222 | 1,315 | 4,023 | 11,141 | 14,171 | 17,976 | 22,191 | 27,059 | 32,226 | 38,294 | 44,539 | 49,582 | 56,295 |
Investments | 20 | 164 | 60 | 1,348 | 2,879 | 3,891 | 5,280 | 6,680 | 7,760 | 8,800 | 9,471 | 17,138 | 21,286 |
Advances | 262 | 1,405 | 3,384 | 5,987 | 7,057 | 7,908 | 9,021 | 10,559 | 12,427 | 15,050 | 17,710 | 20,934 | 25,038 |
Total Assets | 426 | 2,320 | 6,081 | 14,886 | 18,969 | 24,376 | 29,468 | 35,820 | 42,236 | 49,596 | 56,802 | 62,500 | 70,195 |
Interest Earned | NA | NA | 480 | 1,158 | 1,421 | 2,033 | 2,624 | 3,281 | 3,938 | 4,619 | 5,191 | 5,391 | 5,535 |
Other income | NA | NA | 113 | 72 | 89 | 103 | 136 | 151 | 207 | 240 | 370 | 430 | 697 |
Total Income | NA | NA | 593 | 1,230 | 1,511 | 2,136 | 2,760 | 3,432 | 4,145 | 4,859 | 5,561 | 5,821 | 6,231 |
Interest expended | NA | NA | 326 | 851 | 1,065 | 1,462 | 1,773 | 2,131 | 2,565 | 2,966 | 3,329 | 3,440 | 3,363 |
Operating expenses | NA | NA | 254 | 657 | 726 | 804 | 845 | 982 | 1,056 | 1,165 | 1,459 | 1,667 | 1,825 |
Provisions and | | | | | | | | | | | | | |
contingencies | NA | NA | NA | 120 | 171 | 673 | 72 | 99 | 96 | 128 | 163 | 132 | 289 |
Total expenses | NA | NA | 581 | 1,509 | 1,791 | 2,265 | 2,617 | 3,113 | 3,621 | 4,130 | 4,787 | 5,107 | 5,187 |
Operating Profit | NA | NA | 12 | -279 | -280 | -129 | 143 | 319 | 524 | 729 | 774 | 714 | 1,044 |
Note :
Total expenses are excluding provisions and contingencies.
Source
: Reserve Bank of India. |
The presence of RRBs shows wide variation both across States and sponsor banks.
Although RRBs are spread over twenty-six States, they have most of their presence
in seven States, i.e., Andhra Pradesh, Bihar, Karnataka, Madhya Pradesh,
Maharastra, Rajasthan and Uttar Pradesh. Uttar Pradesh has the highest number
of RRBs, i.e., thirty-six and Kerala has got only two amongst the major
States of the country (Table 2). The north-eastern States
like Manipur, Meghalya, Mizoram and Nagaland have got only one RRB. Like-wise,
seven sponsor banks amongst twenty-eight, viz., Bank of Baroda, Bank
of India, Central Bank of India, Punjab National Bank, State Bank of India, United
Bank of India and UCO bankaccount for more than three fifths of the RRBs. More
than 160 RRBs earned profit in March 2004 while 150 RRBs were found to be earning
profits for three consecutive years beginning with the year 2000-01. More than
half of these loss-making RRBs are found to be operating in four States, i.e.,
Bihar, Madhya Pradesh, Maharastra and Orissa. Seen at the level of sponsor banks,
three banks, i.e., Bank of India, Central Bank of India and State Bank
of India accounted for more than half of the loss making RRBs.
As a
number of sponsor banks have promoted RRBs in more than one State, it becomes
natural to ask whether the presence of RRBs sponsored by a few banks whose area
of operation is confined to some specific States is camouflaging the performance
of better run RRBs. There can be three possibilities in such a situation. One,
irrespective of the State, the RRBs sponsored by some banks are incurring losses;
second, irrespective of sponsor banks, certain States are simply not conducive
to better performance for RRBs; and third, there is nothing inherent either with
a sponsor bank or a particular State in which the RRBs operate to contribute towards
the performance of RRBs and it is a combination of some other factors. To answer
these possibilities, one needs to assess the presence of RRBs sponsored by different
banks across the States and their performance. Such an attempt is made in Table
3 where performance of sponsor banks across regions is depicted.
Seen
from the perspective of the State in which they are operating, five out of the
eight-loss making RRBs in Bihar are
Table
2:State and Sponsor Bank-wise Distribution of RRBs |
Sr No | State | No.
| RRBs Profit Making
| Sr No | Sponsor
Bank | RRBs
No. | Profit
Making | f1 | Andhra
Pradesh | 16 | 15 | 1 | Allahabad
Bank | 7 | 7 |
2 | Arunachal
Pradesh | 1 | 0 | 2 | Andhra
Bank | 3 | 3 |
3 | Assam
| 5 | 4 | 3 | Bank
of Baroda | 19 | 15 |
4 | Bihar
| 16 | 8 | 4 | Bank
of India | 16 | 10 |
5 | Chhattisgarh | 5 | 3 | 5 | Bank
of Maharastra | 3 | 1 |
6 | Gujarat
| 9 | 8 | 6 | Bank
of Rajasthan | 1 | 0 |
7 | Haryana | 4 | 4 | 7 | Central
Bank of India | 23 | 15 |
8 | Himachal
Pradesh | 2 | 2 | 8 | Canara
Bank | 8 | 8 |
9 | Jammu
& Kashmir | 3 | 1 | 9 | Corporation
Bank | 1 | 0 |
10 | Jharkhand | 6 | 3 | 10 | Dena
Bank | 4 | 4 |
11 | Karnataka | 13 | 12 | 11 | Indian
Overseas Bank | 3 | 2 |
12 | Kerala | 2 | 2 | 12 | Indian
Bank | 4 | 4 |
13 | Madhya
Pradesh | 19 | 14 | 13 | J&K
Bank | 2 | 1 |
14 | Maharashtra
| 10 | 5 | 14 | Punjab
& Sind Bank | 1 | 1 |
15 | Manipur | 1 | 0 | 15 | Punjab
National Bank | 19 | 17 |
16 | Meghalaya | 1 | 1 | 16 | State
Bank of Bikaner and Jaipur | 3 | 2 |
17 | Mizoram | 1 | 1 | 17 | State
Bank of Hyderabad | 4 | 4 |
18 | Nagaland | 1 | 0 | 18 | State
Bank of India | 30 | 18 |
19 | Orissa | 9 | 3 | 19 | State
Bank of Indore | 1 | 1 |
20 | Punjab
| 5 | 5 | 20 | State
Bank of Mysore | 2 | 2 |
21 | Rajasthan | 14 | 10 | 21 | State
Bank of Patiala | 1 | 1 |
22 | Tamil
Nadu | 3 | 3 | 22 | State
Bank of Saurashtra | 3 | 3 |
23 | Tripura | 1 | 0 | 23 | Syndicate
Bank | 10 | 10 |
24 | Uttar
Pradesh | 36 | 34 | 24 | United
Bank of India | 11 | 9 |
25 | Uttaranchal | 4 | 4 | 25 | UCO
Bank | 11 | 7 |
26 | West
Bengal | 9 | 8 | 26 | Uttar
Pradesh State | | |
| | | | | Co-operative
(U.P.S.C.) | | |
| | | | | Bank | 1 | 0 |
| | | | 27 | Union
Bank of India | 4 | 4 |
| | | | 28 | Vijaya
Bank | 1 | 1 |
| Total | 196 | 150 | | Total | 196 | 150 |
Note :
Based
on three consecutive years performance beginning with the year 2000-01
Source
: Statistical Tables relating to banks in India (Various Issues) |
Table
3:Performance of Sponsor Banks Across Regions |
Sponsor Bank | No
of RRBs | State | Loss
Making | Allahabad
Bank | 7 | Uttar
Pradesh (6), Madhya Pradesh (1) | |
Andhra Bank | 3 | Andhra
Pradesh (2), Orissa (1) | |
Bank of Baroda | 19 | Uttar
Pradesh (9), Rajasthan (5), | Gujarat
(1), Madhya | | | Gujarat
(3), Madhya Pradesh (1), | Pradesh
(1), | | | Uttaranchal
(1) | Rajasthan (2) |
Bank of India | 16 | Uttar
Pradesh (3), Madhya Pradesh (4), | Jharkhand
(1), | | | Maharastra
(4), Jharkhand (4), Orissa (1) | Madhya
Pradesh (2) | | | | Maharastra
(3) | Bank
of Maharastra | 3 | Maharastra
(3) | Maharastra (2) |
Bank of Rajasthan | 1 | Rajasthan
(1) | Rajasthan (1) |
Central Bank
of India | 23 | Bihar
(8), Chattisgarh (1), Madhya Pradesh (7), | Bihar
(5) Madhya | | | Maharastra
(3), Rajasthan (1), Uttar Pradesh (2), | Pradesh
(1) | | | West
Bengal (1) | Uttar Pradesh
(1) | | | | West
Bengal (1) | Canara
Bank | 8 | Uttar
Pradesh (3), Karnataka (4), Kerala | |
Corporation
Bank | 1 | Karnataka
(1) | Karnataka (1) |
Dena Bank | 4 | Gujarat
(3), Chattisgarh (1) | |
Indian Overseas
Bank | 3 | Orissa
(2), Tamil Nadu (1) | Orissa
(1) | Indian
Bank | 4 | Andhra
Pradesh (2), Tamil Nadu (2) | |
J&K Bank | 2 | Jammu
& Kashmir (1) | Jammu
& Kashmir (1) | Punjab
& Sind Bank | 1 | Punjab
(1) | |
Punjab National Bank | 19 | Uttar
Pradesh (6), Punjab (3), Rajasthan (2) | Bihar
(1), | | | Bihar
(4), Himachal Pradesh (1), Haryana (3) | Uttar
Pradesh (1) | State
Bank of Bikaner and Jaipur | 3 | Rajasthan
(3) | Rajasthan (1) |
State Bank of
Hyderabad | 4 | Andhra
Pradesh (4) | |
State Bank of
India | 30 | Andhra
Pradesh (5), Arunachal Pradesh (1), | Andhra
Pradesh (1), | | | Assam
(1), Bihar (1), Chattisgarh (3), Himachal | Arunachal
(1), Assam | | | Pradesh
(1), Jammu & Kashmir (1), Jharkhand (2), | (1),
Uttar Pradesh (2), | | | Karnataka
(1), Madhya Pradesh (3), Meghalaya (1), | Uttaranchal
(3) Bihar | | | Mizoram
(1), Nagaland (1), Orissa (3), | (1),
Chattisgarh (1), | | | | Jammu
& Kashmir | | | | (1),
Jharkhand (2), | | | | Nagaland
(1), Orissa (3) | State
Bank of Indore | 1 | Madhya
Pradesh (1) | |
State Bank of
Mysore | 2 | Karnataka
(2) | |
State Bank of Patiala | 1 | Punjab
(1) | |
State Bank of Saurashtra | 3 | Gujarat
(3) | |
Syndicate Bank | 10 | Andhra
Pradesh (3), Haryana (1), Karnataka (4), | |
| | Kerala
(1), Uttar Pradesh (1) | |
United Bank
of India | 11 | West
Bengal (5), Assam (4), | Manipur
(1), | | | Manipur
(1), Tripura (1) | Tripura
(1) | UCO
Bank | 11 | West
Bengal (3), Bihar (3), Orissa (2), | Bihar
(1) Madhya | | | Rajasthan
(2), Madhya Pradesh (1) | Pradesh
(1), | | | Orissa
(2) | |
Uttar Pradesh State Co- | 1 | Uttar
Pradesh (1) | Uttar Pradesh
(1) | operative
(U.P.S.C.) Bank | | | |
Union Bank of
India | 4 | Uttar
Pradesh (3), Madhya Pradesh (1) | |
Vijaya Bank | 1 | Karnataka
(1) | |
Note : The figures
in parenthesis indicate the number of RRBs by the Sponsor banks. Performance relates
to the period 2000-01 to 2002-03
Source : Statistical Tables
Relating to Banks in India (Various Issues) and Annual Accounts of Scheduled Commercial
Banks in India 1989-2001, Reserve Bank of India | sponsored
by the Central Bank of India and one each by the Punjab National Bank, SBI and
the UCO bank. Of the five-loss making RRBs found in Madhya Pradesh, two are sponsored
by Bank of Baroda and one each by the Bank of India, the Central Bank of India
and the UCO Bank. Like wise, of the five-loss making RRBs found in Maharastra,
three are sponsored by Bank of India and two by Bank of Maharastra. From the sponsor
bank’s perspective one finds that the RRBs in which they have a stake and
which are not earning profits, are not confined to a single State. It is spread
across the States in which they have a presence. For instance, the eight loss
making RRBs for which the Central Bank of India is the sponsor bank, are spread
over Bihar, Madhya Pradesh, Uttar Pradesh and West Bengal. Similarly, the twelve
loss making RRBs sponsored by the SBI are spread across Andhra Pradesh, Arunachal
Pradesh, Assam, Bihar, Chhattisgarh, Jharkhand, Nagaland and Orissa. The same
is the case with the RRBs sponsored by Bank of India and UCO bank. Hence, one
finds no strong systematic pattern so as to infer whether or not the peculiarities
of any particular sponsor bank or a specific State in which they operate drives
the performance of RRBs. In such a situation, financial performance of the RRBs
has been modeled based on balance sheet information of the RRBs for a ten-year
period to decipher, what all factors that contribute to their financial health.
The modalities of the econometric estimation have been taken up in the next section.
Section IV Data and Methodology
Net income as a percentage to total assets (NITA)8 is taken
to be the indicator of financial performance of the RRBs. NITA measures how profitably
and efficiently the RRB is making use of its total assets. Deflating the net income
by total assets also takes account of the variation in the absolute magnitude
of the profits, which may be size related. The performance of RRBs is postulated
to depend upon two broad sets of factors, internal to the RRBs as well as external
to them. The internal factors are represented through the balance sheet information
of the individual RRBs. RRBs are scheduled commercial banks whose source of income
arises primarily from lending and investment. Balance sheet management on
part of RRBs requires a judicious mix between lending and investment. As such,
loans and advances of each RRB as a percentage of total assets (LOTA) and investments
in securities of each RRB as a percentage of total assets (INTA) are included
as explanatory variables. In terms of liquidity management, since banks are involved
in the business of transforming short-term deposits into long-term credit, they
would be constantly faced with the risks associated with the maturity mismatch.
In order to hedge against liquidity deficits, which can lead to insolvency problems,
banks often hold liquid assets, which can be easily converted to cash. However,
liquid assets are often associated with lower rates of return. Hence, high liquidity
is expected to be associated with lower profitability (Molyneux and Thornton,
1992). The impact of liquidity on profitability is captured through the variable
LIQ, which is represented through Cash in Hand of the RRBs as a proportion of
their Assets. Another internal factor that can be expected to have a significant
effect on the financial health of the RRBs is their efficiency in expense management.
The ‘total expenses’ shown in profit & loss account of the RRBs
is the sum of ‘interest expenses’ and ‘operating expenses’.
While rising operating costs to support increasing business activities is natural,
increasing operating costs relative to non operating expenses is a matter of concern
and reflects poor expense management. To judge the impact of expense management
on balance sheet health, the variable operating expenses as a percentage of total
expenditure (OE) has been taken as another independent variable.
Apart from
the internal factors, the literature recognises the influence of the sponsor bank
on a RRB’s health through what is termed as theumbilical
cord (Malhotra, 2002). According to the umbilical
cord hypothesis, given the very close relationship9 between the RRB and its sponsor
bank, the attitude of the sponsor bank would have a bearing on the performance
of the RRB. As it is quite complex to quantify the attitude of the sponsor bank
towards the concerned RRB, the impact of the sponsor bank has been subsumed under
a single indicator and it is the financial health of the sponsor bank. Financial
health of the sponsor bank reflected through its net income as a percentage of
its total assets (NITASPON) has been included as one of the regressors. Based
on the above discussion, to ascertain the impact of the internal and the external
factors on bank profitability, panel data regression models have been used. Equation
(1) describes the general specification of the model. Equation (1) can be estimated
either by least squares or through a procedure that accounts for fixed/ random
effects.
 Where 
The subscripts i and t refer to the year and cross section
(RRB); respectively. In addition to the above factors, an
environmental factor that may affect both the costs and revenue of the RRBs is
the inflationary conditions in the economy. The impact of inflation rates on bank
profitability depends on its effect on a bank’s costs and revenues. The
effect of inflation on bank performance depends on whether the inflation is anticipated
or unanticipated (Perry, 1992). If inflation is fully anticipated and interest
rates are adjusted accordingly resulting in revenues rising faster than costs,
then it would have a positive impact on profitability. However, if the inflation
is not anticipated and the banks are sluggish in adjusting their interest rates
then there is a possibility that bank costs may increase faster than bank revenues
and hence, adversely affect bank profitability. Interest rates in India were administered
for a long time till the onset of financial liberalization. In the post liberalisation
phase though banks have greater freedom to price their products, maneuverability
on part of banks in adjusting the interest rates are rather limited on account
of the preference for fixed rate deposits, administered savings, etc. Furthermore,
as all the variables in (1) are expressed as ratios, inflation is already accounted
for in the model. Hence, inflation as an additional variable has been excluded
from the regression model. It is quite possible that past year’s performance
has a bearing on today’s performance and non-incorporation of the same in
the econometric estimation would blur the impact of other variables on NITA. To
account for the past year’s performance, lagged value of NITA has also been
considered in an extended model. The extended model assumes specification as laid
down in equation (2) 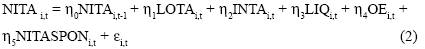
Where,
ηs are the parameters to be estimated. The extended
model (2) is a dynamic panel data model. A dynamic panel model poses a number
of econometric issues. The major problem that arises when lagged dependent variable
is introduced as an explanatory variable is that the error term and the lagged
dependent variable are correlated, with the lagged dependent variable being correlated
with the individual specific effects that are subsumed into the error term. This
implies that standard estimators are biased, and as such an alternative method
of estimating such models is required. The standard procedure to provide consistent
estimates is to adopt an instrumental variable procedure, with different lags
of the dependent variable used as instruments. Although a number of candidates
are possible, the Arellano and Bover (1995) approach is adopted as this
generates the most efficient estimates. While using lagged dependent variables
as instruments, overall instrument validity is examined using a Sargan test of
over identifying restrictions. The study covers the period
1994-2003. The choice of end points for the period of analysis is essentially
governed by two considerations. Based on the recommendations of the Narasimham
Committee Report (1992), reforms were initiated in 1993 to turn around the failing
RRBs. To enhance financial viability, a new set of prudential accounting norms
of income recognition, asset classification, provisioning, and capital adequacy
were implemented. Banks were also required to make full provisioning for bulk
of their non-performing assets. Furthermore, they were permitted to lend to non-target
group borrowers up to 60 per cent of new loans beginning in 1993-94. Permission
was also granted to introduce new services, such as loans for consumer durables.
As such, year 1993-94 has been taken as the initial year for estimation when the
RRBs were given the opportunity to operate in a more liberal framework. The choice
of the terminal year for the empirical study is guided by the availability of
balance sheet information on both RRBs as well as the sponsor bank from the various
issues of Statistical Tables Relating to Banks in India brought out by the Reserve
Bank of India. Balance sheet information was available till 2002-03 for RRBs when
the study was carried out. The study deals with all the 196 RRBs except one10
. To get a deeper insight into the factors contributing to the financial performance
of RRBs, the empirical analysis has been carried out separately for the profit
and the loss making RRBs apart from for all the RRBs taken together. Those RRBs
that earned profits consecutively for three years during 2000-01 till 2002-03
have been categorized as the profit making RRBs and the rest as loss making
RRBs. Section V Empirical
Results To choose the appropriate model for estimating
specification (1), Hausman test is employed. The very low p-value obtained for
Hausman Statistics indicates a preference for fixed effects over random effect
model. The fixed effect estimation results indicate that investments contributed
positively to net income of both profit and loss making RRBs. On the other hand,
advances had a positive impact on the financial health of the profit making RRBs
only; the impact is found to be negative, although insignificant, for the loss
making
Table
4: Fixed Effects Estimation Results |
Independent Variables | Profit
Making RRBs | Loss
Making RRBs | All
RRBs | | Coefficient | P-Value | Coefficient | P-Value | Coefficient | P-Value |
LOTA | 0.013 | 0.02 | -0.01 | 0.36 | 0.003 | 0.56 |
INTA | 0.029 | 0.00 | 0.031 | 0.00 | 0.028 | 0.00 |
LIQ | 0.034 | 0.62 | -0.206 | 0.21 | -0.037 | 0.56 |
OETOTE | -0.232 | 0.00 | -0.217 | 0.00 | -0.226 | 0.00 |
NITASPON | 0.053 | 0.40 | 0.132 | 0.42 | 0.09 | 0.12 |
Adjusted R2 | 0.80 | | 0.75 | | 0.82 | |
RRBs. Liquidity also turned out to be insignificant
in the statistical sense to affect the net income of any category of RRBs. Operating
expenses have an across-the-board negative and significant impact on the RRBs’
financial performance. Furthermore, sponsor bank’s health turns out to be
insignificant in having an impact on the concerned RRBs irrespective of whether
it is making profits or incurring losses. Thus, going by the fixed effect estimation
results, the umbilical cord hypothesis appears to be on a weak footing. However,
estimation of the extended model (2), which employs more rigorous estimation procedures,
provides strikingly different results (Table 5). The dynamic
panel data estimation reveals that performance in the past years had a significant11
impact for the current year for both categories of RRBs. Advances contributed
negatively
Table
5: Dynamic Panel Data (GMM) Estimation Results |
Independent Variables | Profit
Making RRBs | Loss
Making RRBs | All
RRBs | | Coefficient | P-Value | Coefficient | P-Value | Coefficient | P-Value |
NITA(-1) | 0.454 | 0.00 | 0.490 | 0.00 | 0.410 | 0.00 |
NITA(-2) | 0.033 | 0.07 | 0.039 | 0.01 | 0.040 | 0.00 |
LOTA | -0.074 | 0.00 | 0.097 | 0.00 | -0.069 | 0.01 |
INTA | 0.016 | 0.01 | -0.002 | 0.82 | 0.020 | 0.00 |
LIQ | 0.064 | 0.82 | -1.682 | 0.00 | 0.51 | 0.12 |
OETOTE | -0.110 | 0.00 | -0.149 | 0.00 | -0.129 | 0.00 |
NITASPON | 0.304 | 0.00 | -0.747 | 0.00 | 0.200 | 0.0.04 |
P-Value of Sargan Test | 0.18 | | 0.10 | | 0.08 | |
to the health of the profit making RRBs.
This is in contrast to the fixed effects estimation result where advances had
a positive impact for the profit making RRBs. For the loss making RRBs, the negative
and insignificant coefficient for advances in the fixed effects estimations turns
out to be positive and significant in the dynamic model. For all RRBs taken together,
advances are found to adversely affect the bottom line. As far as investments
are concerned, they contributed positively and significantly to the performance
of the profit making RRBs. Again in sharp contrast to the fixed effects results,
investments seem to be inconsequential in influencing the bottom line of loss
making RRBs. For all RRBs taken together, impact of investments turns out to be
positive and significant. The relative importance attached to investment vis-a-vis
advances in their portfolio management by the profit and loss making RRBs, can
be seen from Chart 1, which depicts yearly average figures. As can be seen from
Chart 1, investments over the years have assumed increasing importance in the
asset portfolio of profit making RRBs. Income from investments relative to advances
has also contributed a higher proportion to income for profit making RRBs in the
recent years compared to the loss making ones (Chart 1).
For instance, investment income in total income while increased from 6 per cent
to 9 per cent for the loss making RRBs, it increased from 2 per cent to 14 per
cent for the profit making RRBs between the period 1994-99 and 2000- 
03.
Compared to the period 1994-99, there has been a relative shift towards investments
in the portfolio management of both profit and loss making RRBs during the period
2000-03. The shifting away from advances, however, has been sharper for the profit
making RRBs. While the proportion of loans to assets declined from 41.5 percent
to 35 per cent for the loss making RRBs, the decline was more pronounced from
59 per cent to 48 per cent for the profit making RRBs over the sub periods 1994-99
and 2000-03.
Operating expenses had a negative impact on the profitability
of both profit and loss making RRBs. A more interesting finding from the panel
GMM estimations in contrast to the fixed effect estimations concerns to the umbilical
cord hypothesis. One would be tempted to say that the umbilical cord hypothesis
does not hold good going by the fixed effect estimation results. The GMM estimation12
results, however, indicate that while the sponsor bank acted as a positive force
for the profit making RRBs, the impact was negative for the loss making RRBs.
For all RRBs taken together, the impact of the sponsor bank’s health on
the financial health of the concerned RRB turns out to be positive and statistically
significant. The profit making RRBs are able to reap the synergy from their association
with the sponsor bank. The sponsor bank, on the other hand, is found to act, as
a drag on the financial health of the loss making RRBs. The literature (Malhotra,
2002 etc.) recognises a host of reasons for the drag. It could be due to competition
for business rather than co-operation between the RRB and the sponsor bank, which
are co-present in a particular geographical area. Else, it could simply be, because
of the apathetic attitude of the sponsor bank towards the RRBs when it requires
a supporting hand. Support could be in the form of advice on financial decisions,
or meeting skill requirements of the RRBs or management of the affairs of the
RRB. This finding is significant in the present milieu where a number of options
are being considered to restructure the RRBs. The results indicate that different
strategies need to be thought of keeping in view whether the RRB under consideration
is making profits or incurring losses. While going into the details of the modalities
of the restructuring process of RRBs is beyond the scope of this study, it can
be held that a one size fits all prescription (be it for horizontal or vertical
merger of the RRBs) for the restructuring of the RRBs needs to be revisited. Very
recently, 28 RRBs sponsored by nine banks1 in six States have been amalgamated
into nine new RRBs, bringing down the number of RRBs to 177. The consolidation
exercise mostly involved merger of profit making RRBs of the same sponsor bank
within a State. It is much easier (as they are in any case financially viable)
to decide about the course of restructuring of the RRBs that are making profits.
The approach to the restructuring of the loss making RRBs is an area, which would
require deeper analysis. Merger of loss making RRBs operating in a contiguous
area has the possibility of bringing some rewards in terms of house keeping, better
administrative control, etc. The other possibility is that by merging two RRBs
that are financially unviable, the inefficiencies are compounded and the merged
entity falls under its own dead weight. With the umbilical cord hypothesis operational,
it may be suggested that for the loss making RRBs, the sponsor banks need to play
a more proactive role. Section VI Conclusion The
study made an attempt to examine whether the problems associated with the RRBs
are specific to certain sponsor banks or States in which they operate. To get
a deeper insight, all the RRBs were categorised either as profit making or loss
making ones. RRB earning profits consecutively for the past three years from the
terminal year of the study have been classified as profit making and the rest
as loss making. Such a classification led to 150 RRBs falling in the profit making
category and rest 46 as loss making. The exploratory analysis revealed that the
problem of the loss making RRBs is neither confined to some specific States nor
to a group of sponsor banks. In the absence of any strong systematic pattern so
as to suggest that the performance of RRBs is driven by the peculiarities of any
particular sponsor Bank or a specific State in which they operate, econometric
estimation was employed so as to decipher the factors that contribute to their
financial health. Based on the balance sheet information on individual RRBs for
the past ten years, this study has approached the issue primarily form the asset
side of the RRBs balance sheet. Given the linkage between the RRBs and their sponsor
bank, an attempt was also made to infer whether or not the umbilical cord hypothesis
is operational. Both fixed effect and panel GMM estimations were carried out.
The more appropriate GMM estimation results indicated that the loan portfolio
management for the profit making RRBs is an area of concern. Investments
contribute positively to the financial performance of the profit making RRBs.
Advances while had a positive impact, investments, however, turned out to be inconsequential
for the performance of loss making RRBs. The results further indicated that the
umbilical cord hypothesis is operational. The sponsor bank contributes positively
to the financial health of the profit making RRBs. For the loss making RRBs, the
sponsor bank acts as a drag on their performance. The income from investments
coupled with synergy from the sponsor bank’s association could mitigate
the negative impact flowing from the loan portfolio for the profit making RRBs.
The loss making RRBs on the other hand, could have done better had the sponsor
banks played a proactive role, especially in their investment portfolio management.
The loss making RRBs need focused attention of the all the stake holders, in general,
and of the sponsor bank, in particular, so as to transform them into profitable
ventures. In view of the intricacies involved, some critical thinking is called
for at the policy level in restructuring the loss making RRBs are concerned. The
sponsor bank for the loss making RRBs could be given a time frame and if within
this period, significant improvement is not made, the possibility of changing
the sponsor bank as suggested by the Sardesai Committee may be a worthwhile option.
Notes 1. RRBs were
established “with a view to developing the rural economy by providing, for
the purpose of development of agriculture, trade, commerce, industry and other
productive activities in the rural areas, credit and other facilities, particularly
to small and marginal farmers, agricultural labourers, artisans and small entrepreneurs,
and for matters connected therewith and incidental thereto”(RRBs Act, 1976).
2. Debate in the XV Lok Sabha on Regional Rural Bank (Amendment Bill,
2004).
3. RRBs alone have organised roughly 12 lakh self-help
groups, 45 per cent of the total self-help groups in the country. RRBs have also
issued over 40 lakh Kisan Credit Cards to the farmers and organised over 5,000
out of 11,000 farmers’ clubs under NABARD scheme.
4.
Following the recommendations of the Narasimham Committee (1991), there have been
gradual relaxations in their choice of clientele and area of operations.
5. Lack of a single owner with clear ownership and control, and no
prospects for profits, diffused accountability and weakened oversight of the RRBs.
6. Though the growth in credit when seen in isolation gives an impression
of the impressive strides made by RRBs in disbursing credit, they account for
a very small proportion (around 3 per cent) of the total assets of the Indian
banking sector, despite their significant branch network.
7.
While C-D ratio for 50 RRBs was more than 60 per cent that for 87 banks was less
than 40 per cent in March 2004.
8. Net Income has been defined
as the excess of total income over total expenditure.
9. Specifically,
the sponsor bank contributes thirty-five per cent of issued capital of a RRB,
appoints its chairman, advises on decisions regarding investments, monitor its
progress and suggest corrective measures to be taken by the RRB. More on the relationship
between the sponsor bank and their RRBs is discussed in Annex 2.
10. The
left out RRB is the Kshetryia Kisan Gramin Bank due to lack of information on
the Sponsor Bank for the entire period of 1994-2003.
This
RRB is sponsored by U.P.S.C.B., a Cooperative Bank.
11. This in a way
testifies the appropriateness of employing the extended dynamic model for estimation.
Guided by statistical significance, two lags of the dependent variable have been
used in the GMM estimation.
12. The p-values for the Sargan test are 0.18,
0.10 and 0.08 for the profit making, loss making and all RRBs, respectively.
13. The Government of India (Ministry of Finance), issued nine notifications
on September 12, 2005 for amalgamation of 28 RRBs into nine new RRBs sponsored
by nine banks in six States. These amalgamations have become effective from September
12, 2005.
References
Akhavein,
J.D., Berger, A.N., Humphrey, D.B. (1997): “The Effects of Megamergers on
Efficiency and Prices: Evidence from a Bank Profit Function”, Finance
and Economic Discussion Series 9, Board of Governors of the Federal Reserve
System.
Arellano, M., and Bover, O. (1995): “Another
Look at the Instrumental Variables Estimation of Error Components Models,”
Journal of Econometrics, 68, pp.29–51.
Athanasoglou
Panayiotis P., Brissimis Sophocles N. and Delis Matthaios D. (2005): “Bank-
Specific, Industry-Specific and Macroeconomic Determinants of Bank Profitability”,
Bank of Greece Working Paper No. 25.
Balachandher
K G, John Staunton and Balashanmugam (2004): “Determinants of Commercial
Bank Profitability in Malaysia” Papers presented at the 12th Annual
Australian Conference on Finance and Banking.
Barth, J.R., Caprio, G.,
Levine, R. (2004): “Bank supervision and regulation: What Works Best?”
Journal of Financial Intermediation, 13 (2), pp.205-248.
Benston,
George J., Gerald A. Hanweck and David B. Humphrey (1982): “Scale Economies
in Banking”, Journal of Money, Credit, and Banking, Vol.XIV, No.
4, part 1, November.
Bikker, J.A., Hu, H. (2002): “Cyclical
Patterns in Profits, Provisioning and Lending of Banks and Procyclicality of the
New Basel Capital Requirements”, BNL Quarterly Review, 221, pp.143-175.
Bell Frederick W. and Nell Mushy (1969): “Impact of
Market Structure on the Price of a Commercial Banking Service”, The
Review of Economics and Statistics, May.
Bose, Sukanya
(2005): “Regional Rural Banks: The Past and the Present Debate”, Macro
Scan, URL: http://www.macroscan.com/fet/jul05/ fet200705RRB_Debate.htm.
Bourke, P. (1989): “Concentration and other Determinants
of Bank Profitability in Europe, North America and Australia”, Journal
of Banking and Finance, Vol.13, pp. 65-79.
Consideration
of the Regional Rural Banks (Amendment) Bill, 2004,
Proceedings Other
Than Questions and Answers, XIV Lok Sabh.
Das
Prasant (2000): “Sustainability Through Outreach - The Malbar Lighthouse
Shows the Way.” National Seminar on Best Practices in RRBs,BIRD,
Lucknow.
Demirguc-Kunt, A., Huizinga, H. (2000): “Financial
Structure and Bank Profitability”, World Bank, Mimeo.
Demirguc-Kunt,
A., Maksimovic, V. (1998): “Law, Finance and Firm Growth”, Journal
of Finance, 53(6), pp.2107-2137.
Edwards. Franklin
R. (1977): “Managerial Objectives in Regulated Industries: Expense Preference
Behavior inBanking”, Journal of Political Economy, February.
Goddard, J., Molyneux, P., Wilson, J.O.S. (2004): “The
Profitability of European Banks: A Cross-Sectional and Dynamic Panel Analysis”,
Manchester School 72 (3), pp.363- 381.
Haslem,
John (1968): “A Statistical Analysis of the Relative Profitability of Commercial
Banks”, Journal of Finance, Vol. 23, pp.167-176.
Hausman,
Jerry A. (1978): “Specification Tests in Econometrics,” Econometrica,
46, pp.1251–1272.
Joshi V.C. and Joshi V.V. (2002):
“Managing Indian Banks”, Response Books, New Delhi.
Kannan,
R (2004), ”Regional Rural Banks”, URL: http:// www.geocities.com/learning/banking2/rrb.html
Kwast, Myron L. and John T. Rose (1982), “ Pricing,
Operating Efficiency and Profitability Among Large Commercial Banks”,
Journal of Banking and Finance,Vol.6.
Malhotra, Rakesh
(2002): “Performance of India’s Regional Rural Banks (RRBs): Effect
of the Umbilical Cord”. URL: http://www.alternative-finance.org.uk/rtf/rrbsmalhotra.rtf.
Miller, S.M., Noulas, A.G. (1997): “Portfolio Mix and
Large-bank Profitability in the USA”, Applied Economics, 29 (4),
pp.505-512.
Mohan Jagan (2004): “Regional Rural
Banks Need a Shot in the Arm”, Financial Daily from The Hindu Group
of Publications. March 19th Edition.
Molyneux, P.,
Thornton, J. (1992): “Determinants of European Bank profitability: A Note”,
Journal of Banking and Finance, Vol.16, pp.1173-1178.
Nitin
Bhatt and Thorat Y. S. P. (2004): “India’s Regional Rural Banks: The
Institutional Dimension of Reforms”, National Bank News Review, NABARD,
April-September.
Neely, M.C., Wheelock, D.C. (1997),
“Why Does Bank Performance Vary Across States? Review”, Federal
Reserve Bank of St. Louis, Vol 79, No. 2, pp. 27-40.
Perry,
P., (1992): “Do Banks Gain or Lose from Inflation”, Journal of
Retail Banking, 14(2), pp.25-30.
Reddy, Y.V. (2000): “Future of
Rural Banking” Address at Prof. G. Rama Reddy’s Third Endowment Lecture,
Hyderabad, Reserve Bank of India Bulletin, January.
Reddy,
Y.V. (2000): “Rural Credit: Status and Agenda”, Reserve Bank of
India Bulletin, November.
Report on Trends and Progress of Banking in
India (Various Issues), Reserve Bank of India, Mumbai. URL: (www.rbi.org.in).
Reserve Bank of India (2004): “Report of the Advisory
Committee on Flow of Credit to Agriculture and Related Activities From the Banking
System”. URL: (www.rbi.org.in).
Reserve
Bank of India (2005): “Report of the Internal Working Group on
RRBs”, Chairman: A.V. Sardesai, Mumbai. URL: (www.rbi.org.in).
Reserve Bank of India (2002): “Annual Accounts of
Scheduled Commercial Banks in India (1989-2001)”,Mumbai. URL: (www.rbi.org.in).
Revell, J., (1979): “Inflation and Financial Institutions”,
Financial Times, London.
Rhoades, Stephen A.1977):
“Structure and Performance Studies in Banking: A Summary and Evaluation”,
Staff Economics Studies 92, Federal Reserve Board, Washington, DC.
Schuster, Leo (1984): “Profitability and Market Share
of Banks”, Journal of Bank Research, Spring.
Shaffer,
S. (1994): “Bank Competition in Concentrated Markets”, Federal
Reserve Bank of Philadelphia Business Review, March/April, pp.3-16.
Shaffer, S. (2004): “Comment on “What Drives Bank
Competition? Some International Evidence” by Stijn Claessens and Luc Laeven,
Journal of Money, Credit, and Banking, Vol.36, pp.585-592.
Sharma
K.C; Josh P.; Mishra J.C.; Kumar Sanjay; Amalorpavanathan R.and Bhaskran R. (2001):
“Recovery Management in Rural Credit”, Occasional Paper,
No. 21, NABARD, Mumbai.
Short, Brock (1977): “Bank
Concentration, Market Size and Performance: Some Evidence From Outside the United
States”, Mimeo, IMF, Washington, DC.
Short, B.K.
(1979): “The Relation Between Commercial Bank Profit Rates and Banking Concentration
in Canada, Western Europe and Japan”, Journal of Banking and Finance,
Vol.3, pp.209-219.
Smirlock, M. (1985): “Evidence
on the (non) Relationship Between Concentration and Profitability in Banking”,
Journal of Money, Credit, and Banking, Vol. 17, pp. 69-83.
Staikouras,
C., Steliaros, M. (1999): “Factors That Determine the Profitability of the
Greek Financial Institutions”. Hellenic Bank Association, 19, pp.61-66.
Statistical Tables Relating to Banks in India (Various
Issues), Reserve Bank of India, Mumbai. URL: (www.rbi.org.in)
Thingalaya N.K. (2000): “The Other Side of the Rural Banking”, BIRD,
Lucknow.
Velayudham, T. K., and Sankaranarayanan, V.
(1990): “Regional Rural Banks and Rural Credit: Some Issues”, Economic
and Political Weekly, September 22, pp.2157-2164.
Tschoegl, Adrian E.
(1982): “Concentration Among International Banks -A Note”, Journal
of Banking and Finance, Vol.6.
Tschoegi, Adrian
E. (1983): “Size, Growth and Transnationality Among the World’s Largest
Banks”, Journal of Business, 56, No. 2. Annex-1
The Basis for the Umbilical Cord Hypothesis
1. Section 3 of Chapter II of RRB Act, 1976 stipulates that only on
request of a Sponsor Bank, Central Government would consider establishment
of a RRB.
2. Duties of the Sponsor Bank have been spelled out in Section
3 (3) of RRB act as: a. Subscribing to the share capital of RRB, b. Training the
personnel of RRB, c. Providing such managerial and financial assistance during
the first five years as mutually agreed upon.
3. Under Section 4 of
RRB Act, 1976, the RRB will have its Head Office at such place as decided by the
Central Government in consultation with NABARD and the Sponsor Bank.
4.
Section 6(2) of RRB Act stipulates that the Sponsor Bank will contribute thirty-five
per cent of issued capital of its RRB.
5. Under Section 9(d) of RRB
Act, two directors, who are officers of the Sponsor Bank, shall be nominated on
the Board of RRB.
6. Under Section 11 of Act, the Sponsor Bank shall
appoint the Chairman of a RRB and specify the period of appointment. The appointment,
however, would not exceed a period of five years.7. The Sponsor Bank
has the right to remove the Chairman at any time (Section 11(4)).
8.
The Sponsor Bank shall depute officers or other employees to RRB as may be necessary
or desirable (Section 17 of RRB Act, 1976).
9. Amalgamation of RRBs
under Section 23-A can be done by Central Government in consultation with NABARD,
State Government and the Sponsor Bank.
10. Section 24-A of RRB Act stipulates
that the Sponsor Bank are required to monitor the progress of RRBs and carry out
inspection, internal audit and scrutiny and suggest corrective measures to be
taken by the RRB. 11. Interest rate on SLR deposits of all maturity held by RRB
with the sponsor bank would be at 0.5 per cent over the maximum term deposit rate
of the sponsor bank.
12. Governments of India and Reserve Bank of India have
further issued the directives that, ‘for overall management of the RRB it
would be the responsibility of the Sponsor Bank to guide the RRB in various matters
on human resource management, computerization, business development, branch expansion,
etc.’
13. Many RRBs have an agency arrangement with their Sponsor Bank
for issue of Demand Drafts.
14. Sponsor Bank also directly helps RRB in matters
of daily cash remittances, over draft facility, decisions on investments, etc.
The relationship between the sponsor bank and its RRBs as evolved over the years
can further be assessed in terms of summary and descriptive statistics as laid
out below:
Summary
Characteristics of the Determinants of RRB Profitability |
(Per
cent) | Year | Net
Income
to Assets
(NITA) | Loans
to
Assets
(LOTA) | Investment
To Assets
(INTA) | Liquidity
(LIQ) | Operating
Expenses
to Total
Expenses
(OETOTE) | Net
Income
to Assets
of Sponsor
Bank
(NITASPON) | Inflation |
| Profit | Loss | Profit | Loss | Profit | Loss | Profit | Loss
Profit | Loss | Profit | Loss | Inf |
1994 | -4.22 | -6.98 | 61 | 36.5 | 0.3 | 0 | 0.89 | 1.22 | 49.3 | 43.8 | 0.36 | 2.71 | 8.4 |
1995 | -2.89 | -3.97 | 59.9 | 34.2 | 0.2 | 0 | 1.14 | 1.49 | 46.6 | 44.1 | 0.48 | 2.49 | 12.5 |
1996 | -0.07 | -5.46 | 63.8 | 39.3 | 1.9 | 4.1 | 0.89 | 1.39 | 36.1 | 39.8 | -1.26 | 2.55 | 8.1 |
1997 | 1.84 | -5.95 | 57.7 | 51.1 | 2.1 | 5.2 | 1.19 | 1.49 | 30.7 | 34.4 | -0.81 | 2.06 | 4.6 |
1998 | 3.4 | -3.85 | 58 | 49.9 | 4.3 | 7.1 | 0.95 | 1.32 | 35 | 31.2 | -1.08 | 1.76 | 4.4 |
1999 | 4.33 | -2.23 | 51.5 | 37.9 | 8.9 | 10.6 | 1.07 | 1.34 | 34.4 | 30.6 | -0.76 | 1.81 | 5.9 |
2000 | 3.26 | -2.04 | 51.8 | 35.2 | 10.8 | 7 | 1.54 | 1.27 | 32.8 | 28.2 | 0.1 | 1.79 | 3.3 |
2001 | 2.89 | -2.45 | 46.2 | 33.1 | 12.6 | 5.3 | 1.77 | 1.17 | 30 | 27.4 | 0.23 | 1.64 | 7.2 |
2002 | 2.95 | -0.22 | 46.4 | 34.1 | 14 | 4.9 | 1.22 | 1.14 | 28.1 | 29.6 | 1.01 | 1.85 | 3.6 |
2003 | 2.78 | 0.04 | 46.1 | 38.8 | 25.7 | 15.4 | 0.65 | 1.11 | 30.1 | 31.2 | 1.67 | 2.25 | 3.5 |
Source:
Statistical Tables Relating to India (Various Issues). |
Descriptive
Statistics of Variables Employed | (Per
cent) | Bank | Measure | NITA | INTA | LOTA | LIQ | OETOTE | NITASPON | Inflation |
Category |
| |
| |
| |
| | Profit | Mean | 0.2 | 15.9 | 33.9 | 1.3 | 34.0 | 1.4 | 6.1 |
| Median | 0.9 | 13.4 | 32.2 | 1.1 | 32.9 | 1.5 | 5.9 |
| SD | 2.5 | 13.5 | 13.6 | 0.7 | 8.9 | 0.9 | 2.8 |
| Skewness | -1.3 | 1.0 | 0.5 | 1.3 | 0.6 | -0.8 | 1.0 |
| Kurtosis | 5.3 | 4.0 | 2.5 | 5.1 | 3.5 | 3.9 | 3.1 |
| CV | 1227.2 | 85.1 | 40.0 | 56.5 | 26.0 | 62.1 | 45.3 |
Loss | Mean | -2.6 | 31.5 | 9.3 | 1.3 | 34.0 | 1.4 | 6.1 |
|
| |
| |
| |
| |
| Median | -2.1 | 30.9 | 5.5 | 1.3 | 31.2 | 1.5 | 5.9 |
| SD. | 3.2 | 12.3 | 11.3 | 0.1 | 6.0 | 0.8 | 2.8 |
| Skewness | -0.7 | 0.5 | 1.6 | 0.2 | 0.7 | -0.9 | 1.0 |
| Kurtosis | 3.2 | 2.8 | 5.3 | 1.8 | 1.9 | 4.2 | 3.1 |
* Research Officer in the Department of
Economic Analysis and Policy, Reserve Bank of India and presently working from
the Patna office of the Bank. The views expressed here are of the author and not
necessarily of the institution to which he belongs. Discussions with Shri S.S.Mishra
have been enlightening for the author. The author would like to thank an anonymous
referee for valuable suggestions. The author gratefully acknowledges the encouragement
and inspirations of Dr. Narendra Jadhav, Dr. R.K.Pattnaik and Shri S. Ganesh. |