Amarendra Acharya and Anupam Prakash* The 2008 global financial crisis has brought the issue of global financial integration to the forefront. In the recent period, Asian economies have emerged as the new engines of growth. Many Asian economies have increasingly adopted outward oriented policies which have led to their progressive integration with the global economy. Furthermore, the outward oriented policies of many Asian economies are believed to have led them to a high growth path. This study examines the relationship between international financial integration (opening the economy both outwards and inwards) and economic growth in 11 Asian economies during 1991-2010. The approaches adopted in this paper are both analytical as well as empirical. The results of the empirical analysis indicate that evidence on the impact of international financial integration on growth is mixed. However, at a more disaggregated level, the analysis supports positive effects of the total capital inflows on growth; this holds true for both direct investment and portfolio flows. JEL Classification: D53, O11
Keywords: International Financial Integration, Financial Vulnerability Introduction Asia has witnessed rapid growth over the past few decades. Asian growth remained resilient even during the global financial crisis. The outward oriented policies of many Asian countries brought high growth and in the process helped in pulling many people out of poverty in these economies. In this context, the role of international financial integration (IFI) in the growth process has become a subject of passionate debate, particularly at a time when the global financial crisis is creating doubt about its benefits. This topic is assuming enormous importance, particularly for those Asian countries which are still in the early stages of development and the timing and pace for further opening up of their economies is expected to decide the fate of billions of people residing in this part of the world. When exchange controls are removed and entry barriers are brought down financial resources flow from one country to another. This brings about international integration of financial markets. Financial markets all over the world are also getting integrated due to advances in information technology, deregulation and globalization. Application of international best practices in macro-prudential regulations with competitive pricing of products has also added to the integration process (RBI 2007). The IFI of an economy generates some positive effects. However, the benefits of global integration are dependent on size, composition and quality of capital flows (RBI 2007). Further, it generates benefits like international risk sharing, meeting the domestic saving-investment gap and maintaining macroeconomic discipline (Agenor 2001). In addition, IFI helps in increasing factor productivity, increasing the efficiency of the financial intermediation process and lowering the cost of investments (Levine 1996, 2001, Capiro and Honhan 1999). The removal of entry barriers brings in new players and promotes competition at the global level. It reduces the cost of funds and financial services. Liberalized markets allow a capital scarce country to search for capital outside its border to finance its investment activities. Availability of different financial sources reduces not only funding costs but also the fund availability risk for a borrower. For international investors availability of various risk instruments improves the risk return profile. It brings in new financial techniques and products. It also forces financial intermediaries to go for innovation and be competitive. Greater market integration has increased competition and streamlined restrictions and increased the liquidity of markets. Access to world capital markets increases opportunities for portfolio diversification for investors and increases the potential for higher risks-adjusted rates of return. It also allows countries to borrow to smooth consumption in the face of adverse shocks, while the potential growth and welfare gains resulting from risk sharing can be large (Obstfeld 1994). Despite various economic crises, developing countries have moved towards financial openness as it has many economic benefits. Reforms which are needed to make economies safe in the face of international financial flows also help in curtailing vested interests and allow the economy’s productive potential to be fully achieved. There is empirical record that benefits are likely when reforms are implemented in a phased manner and complemented by policies to enhance stability and growth (Obstfeld 2009). The IFI of economies, however, also poses numerous challenges. While excessive capital inflows lead to an appreciation of the local currency, outflow of capital triggers panic in financial markets and makes the operation of the economic policies hostage to it. The growth of Asian economies, particularly those in South East Asia, was hampered by the south-east Asian currency crisis of 1997. A year before the crisis, five Asian economies (Korea, Indonesia, Malaysia, Thailand and the Philippines) witnessed US$93 billion of net private capital inflows; but one year after that they witnessed an outflow of around US$12 billion. The turnaround of outflow amounting to more than US$105 billion put these economies in severe economic crisis (Rodrik 1998). The financial crisis in advanced economies (AEs) was transmitted to other parts of the world inter alia due to financial linkages. In 2013, the financial markets of the major emerging market economies (EMEs) witnessed much volatility after a statement made by former Fed Chairman Ben Bernanke (on 22 May 2013) about the likely tapering of monetary expansion. This was associated with the spill-over of volatility across economies. Later, volatility returned to the financial markets in the second half of January 2014 when equities fell, spreads rose and currencies depreciated. There was broad-based pressure even though countries with weaker domestic macroeconomic fundamentals in the form of higher CAD and inflation faced more pronounced volatility. The markets recovered subsequently with various steps taken by various economies. Nevertheless, these ‘taper tantrums’ highlighted the challenges posed by international financial integration of economies and the vulnerabilities generated by it. Capital market liberalization makes a country vulnerable to the external economic environment; a change in perception can lead to capital outflows, often undermining the viability of the entire financial system (Stiglitz 2000). Further, it is also argued that capital flows are characterized by panics and manias. Short-term borrowings under free capital mobility add to economic difficulties and attracting foreign direct investment may be preferred to free capital mobility. At one extreme, there are also cases of countries that have grown without capital account convertibility. There is a difference between free portfolio capital mobility and attracting foreign direct investment. Crises attendant on capital mobility are not something that can be ignored. Financial crises are an inevitable by-product of international integration (Bhagwati 1998). But there is little formal empirical support for the argument that financial globalization is responsible for the spate of financial crises that the world has seen over the last decade (Kose et al. 2009). However, in the long-run, international integration is likely to solve its own problems and can make financial crises less likely (Krugman 2000). Literature reveals many conflicting effects of IFI on growth. The relationship between financial openness and growth changes with the change in context or the economies taken for study. While there have been many studies on the effect of IFI on growth, these studies are broadly based either on AEs or on developing countries or on high-income or middle-income group countries. However, there have been very few studies on the effects of IFI in Asia. A reason that can be cited for this lack of empirical work in the Asian region is the absence of reliable historical data for a number of countries. This study applies similar models as in previous papers; however, its aim is different. The goal of this paper is to see whether IFI has contributed to the growth process of Asian economies and in what way it has helped. The choice of Asia is due to the lack of much study in this area. This research paper is organized as follows: Section II gives a literature review on the subject of IFI and its effect on growth. Section III describes Asian growth and the trends in capital inflows to it. Section IV explores the extent of external integration of major Asian economies. Section V highlights the data sources, methodology and gives an empirical analysis. Section VI concludes the study. Section II
Literature Review Issues relating IFI with economic growth have attained prominence in economic literature only recently. International financial flows influence economic growth through various channels. Liberalizing restrictions on international financial inflows increases stock market liquidity and helps in economic growth by improving productivity. Similarly, allowing entry of foreign banks in domestic markets enhances the efficiency of domestic banking systems. Overall, IFI promotes growth by improving domestic financial systems (Levine 2001). However, two large developing countries - India and China - have survived many crises and grown remarkably while both have strong controls on capital flows (Stiglitz 2000). There have been a number of studies in this context across the globe. In general, two types of arguments exist in existing literature. One school of thought argues that there is a positive relationship between capital account openness and growth while another school of thought finds no relationship between the two. The results show a mixed response which is inconclusive in nature. Among earlier empirical studies, Quinn (1997), Klein and Olevei (1999), Baillue (2000) and Kose et al. (2009) found a positive relationship between capital account openness and growth. These studies used panel data techniques, mostly dynamic panel. Quinn (1997) took data from the Annual Report on Exchange Arrangements and Exchange Restrictions (AREAER) in 66 countries over the period 1960-89 for building an index on capital account openness. However, the positive relationship may have arisen as the sample of years did not cover the low growth period of the 1980s. Baillue (2000) investigated that capital flows foster economic growth only when the banking sector has achieved a certain level of development. The relationship turned negative when the banking sector was poorly developed broadly arguing that the domestic financial sector helps in the generation of economic growth from international capital flows. There have been some other studies that have looked for indirect effects of financial sector development, institutions, governance and macroeconomic stability (Kose et al. 2009), and argued that international integration is likely to have positive effects under a higher level of development and macroeconomic discipline. Klein and Olevei (1999) examined whether there is a link between capital account liberalization and financial depth with economic growth and showed that countries with open capital accounts have more financial depth than others which have restrictions on their capital accounts. Further, the study mentions that with the deepening of financial markets, capital account convertibility has a positive effect on growth. However, this finding is largely driven by the presence of industrial countries in the sample. Capital account liberalization promotes financial depth when associated with institutional quality. The study further suggests that policy change associated with adequate institutions and macroeconomic policies can bring in benefits of capital account liberalization. On the other side, there are studies that have also found an opposite relationship between capital account liberalization and growth. Rodrik (1998) investigated the impact of capital account liberalization on macroeconomic performance and showed that there is no significant effect of capital account convertibility on macroeconomic performance indicators like growth, investment or inflation after controlling some other growth determinants. With the extension of the estimation to countries having strong institutions, the study could not establish any significant beneficial effects. Further, Prasad et al. (2006) attempted to find a relationship between growth and foreign capital through a cross-country analysis, but could not establish a positive and significant relationship between the two. Their study showed that non-industrial countries which relied more on foreign finance did not grow faster in the long-run though there was the existence of a positive relationship in the case of industrial countries, with the possible reason for this being the limited ability of non-industrial countries to absorb foreign capital. Edison et al. (2002) examined the effect of IFI on economic growth and did not reject the null hypothesis that IFI does not accelerate economic growth. This remained true even after controlling for various economic, financial and institutional factors. Grilli et al. (1995) found that high inflation and lower interest rates were more likely to be present with capital controls. Inflation was more prevalent under left-wing and coalition governments. Further, a lower interest rate was seen in countries which had capital account and current account restrictions. Their study did not find any robust relationship between capital account restrictions and growth. A large black market premium was associated with low growth. Capital controls were more prevalent when central banks lacked independence and also in countries with underdeveloped tax systems and closed economies. The problems with financial globalization can be remedied through deep institutional reforms. Rodrik and Subramanian (2009) argued that developing countries are more likely to be investment-constrained than savings-constrained, and foreign capital sometimes aggravated this investment constraint by appreciating the real exchange rate and reducing profitability and investment opportunities in the traded goods sector. This was not helpful for long-run growth. The low correlation between capital account openness and economic growth has also been examined by Henry (2007), and it has been observed that most studies do not address the theory. Studies that address theory have enough reasons for finding significant effects of liberalization on price of capital, investment and growth. This study argues that theory always advocates a short-run impact of liberalization on growth, while generally studies test for a permanent effect. Further, a separate treatment for developed and developing countries has also been advocated. It has also been shown that the highly used share variable that shows the number of years without capital restrictions has sources of measurement errors. Evidence shows that capital account liberalization brings in a temporary increase in investments and higher growth. The prevalence of cross-sectional regressions of national growth rates on policy variables has been cited as the main reason for the little correlation of capital account liberalization with growth. The idea of capital account liberalization generating growth being dependent on the level of development has found some evidence in Edwards (2001). An open capital account positively affects growth only after an economy reaches a minimum level of economic development, supporting the view that capital account liberalization should be sequenced properly. This interpretation has been explored by interacting capital account openness term with standard measures of financial development, and has found that while the capital account term has negative coefficients the interactive term has positive coefficients. For financially developed economies capital account openness is a boon, but at a low level of development it may have a negative effect on performance. Overall, it has also been shown that the effects on EMEs are very different from those on AEs. From a review of empirical literature on capital account convertibility and growth it is clear that capital account convertibility does not necessarily lead to growth. The results reported are clearly sensitive to the variables employed, countries used and even on the econometric methodology employed. In the present study, the most used econometric methodology was chosen, while restricting the sample of countries. Many empirical investigations have used either de jure measures like restrictions on capital flows or de facto measures like actual capital flows. However, de jure measures are criticized for not revealing the actual severity of restrictions placed in accessing domestic markets. Given these difficulties, de facto IFI indicators are used in this study, that is, total capital flows as a share of GDP, total capital inflows as a share of GDP, etc. Further, to highlight the average level of external openness over a period of time, stock measures are applied to the empirical work. Section III
Growth and Capital Inflow The Asian continent, particularly the emerging and developing Asia1 is getting more and more significant in the world economy. With rapid growth, it is capturing a bigger share in world GDP (Chart 1). In terms of purchasing power parity (PPP), it accounts for one-fifth of the total world GDP. It may be added that this share will increase (upto one-third of the world GDP) if the GDP of AEs like Japan and South Korea is added to it. The growth potential of this region has also attracted heavy capital inflows. The past five years have been a period of high monetary easing in AEs. During this period central banks of AEs like US, UK, Japan and the Euro area went in for massive injection of liquidity into the financial systems to fight the adverse impacts of the global financial crisis of 2008. Following this, global liquidity increased in the past five years and led to an increase in private capital flows into the emerging and developing economies of Asia2 (Chart 2). Further, in the last one year, private capital flows were mostly dominated by private portfolio flows. 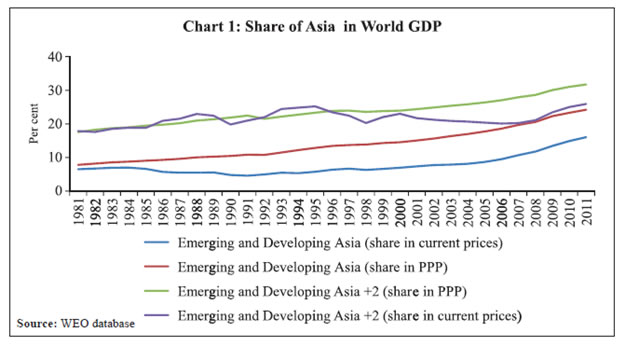 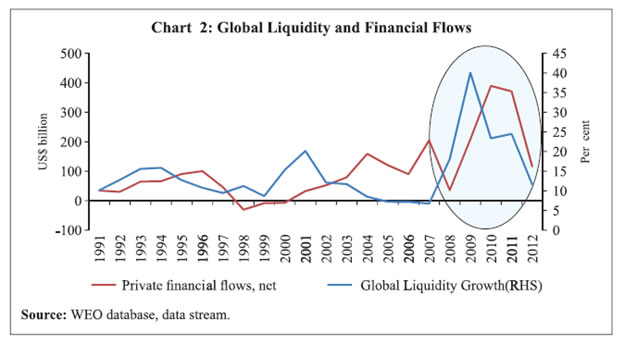 GDP growth in Asian economies during 1991-2010 was impressive despite the two crises of 1997 and 2008. GDP growth was less than 5 percent in the early 1990s. It saw robust growth in the mid-1990s, only to be followed by sharp decline to below 4 per cent in 1998. After 1998, it started soaring and reached a level of more than 11 percent around 2007. The impact of the global crisis was evident in the decline in growth in subsequent years. In sum, GDP growth was at an impressive rate of around 8 percent during 1991-2012. The Asian region witnessed capital inflows as a corollary to its high growth. Private financial flows remained robust; average private financial flows remained at around 2.5 percent of its GDP during this period. There was an increase from about 3 percent of the region’s GDP in 1991 to around 5 percent in 1996. In 1996-99, the region witnessed a massive outflow due to the crisis. However, capital inflows picked up again before falling around the time of the global financial crisis of 2008, and resumed later till 2011. The high growth phase has always been associated with high capital flows that indicate a possible relationship between the two (Chart 3). 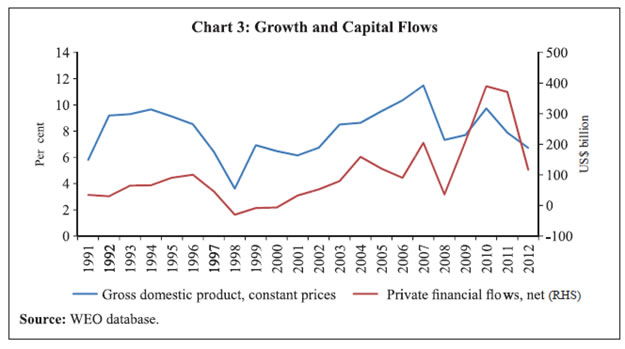 The current account of emerging and developing Asia remained continuously positive after the 1997 crisis. This indicates that savings were more than investments (Chart 4). It also highlights that in Asia the dependence of growth on external finance declined over a period of time. Further, in private financial flows, direct flows always remained positive, while portfolio flows turned negative during the crisis period of 1997 and 2008 (Chart 5). 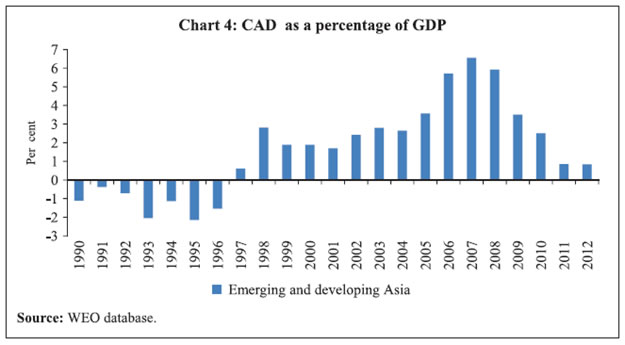 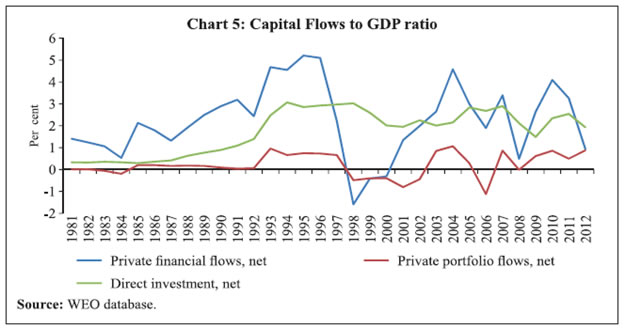 Capital flows to Asia are driven by both pull and push factors. The pull factors are: the region has remained politically stable despite insurgency in some countries. Almost all countries are going through a democratization process. Property rights are secure in this region and it gives investors enough protection against any change in law. Economic conditions have remained robust and have improved with rapid economic growth over the years. Despite the global crisis, the growth prospect remained bright for the region. The growth is bringing rapid transformation in infrastructure and is generating more positive spill-overs to investments. The region has largely remained resilient to the crises emanating from other places in the world. Unlike most other regions, this region has a very stable economic atmosphere. The high population offers a big place for marketing and also favourable low wages. It also provides high returns to investments in the region. The push factors are also equally important. Internationally, yield has remained low. AEs have been in a monetary accommodation phase for a long period. International investors are in search of yield. In an attempt to diversifying and to reduce risks to their overall investment portfolios, investors have been putting excess cash into instruments of this region. Section IV
External Integration of Asian Economies The modernization of the Asian economies has propelled them towards more integration with the outside world. Taking the ratio of external assets and liabilities to GDP as a broad indicator of international financial integration, the figures for external integration of Asian economies are given in Table 1, along with the figures of two AEs - UK and the US for comparison. In Asia the figures of selected major economies show that generally their external integration is following a rising trend. In most of the economies, the external integration did not decline even after the crises of 1997 or 2008. It may be observed that Asian economies are not as open as AEs like UK and the US. In Asia, while Japan and Malaysia have the most integrated external sectors, external sectors of India, Pakistan and Bangladesh are the least integrated with the outside world. In most of the economies external liabilities are more than external assets. In the case of China and Japan, assets are more than liabilities (Table 2). Gross asset positions have expanded over the years and their rapid expansion beyond the minimum required for settling current account transactions shows that it is for enhanced risk sharing and, at the same time, it also raises the risks of counterparty failure (Obstfeld 2005). | Table 1: International Financial Integration of Major Asian Economies | | (per cent of GDP) | | Country | 1981 | 1991 | 1997 | 2008 | 2011 | | Bangladesh | 31 | 55 | 45 | 47 | 44 | | China | 15 | 43 | 62 | 100 | 109 | | India | 16 | 34 | 38 | 66 | 62 | | Indonesia | 37 | 88 | 95 | 69 | 80 | | Japan | 34 | 103 | 104 | 184 | 195 | | Korea | 64 | 32 | 58 | 111 | 142 | | Malaysia | 96 | 118 | 144 | 176 | 230 | | Pakistan | 40 | 51 | 55 | 61 | 53 | | Philippines | 71 | 97 | 93 | 94 | 104 | | Thailand | 44 | 80 | 112 | 135 | 171 | | Vietnam | 0 | 0 | 102 | 112 | 119 | | UK | 229 | 330 | 484 | 1204 | 1405 | | USA | 49 | 80 | 118 | 302 | 318 | | Source: Philip-Lane database and WDI. |
| Table 2: Assets and Liabilities of Major Asian Economies | | (per cent of GDP) | | Country | Assets | Liabilities | | 1991 | 1997 | 2008 | 2011 | 1991 | 1997 | 2008 | 2011 | | Bangladesh | 7 | 6 | 11 | 12 | 48 | 38 | 36 | 32 | | China | 24 | 29 | 66 | 65 | 19 | 33 | 34 | 44 | | India | 3 | 9 | 25 | 22 | 32 | 29 | 41 | 40 | | Indonesia | 17 | 14 | 20 | 22 | 71 | 81 | 49 | 58 | | Japan | 57 | 63 | 118 | 126 | 46 | 41 | 67 | 69 | | Korea | 12 | 24 | 53 | 67 | 20 | 34 | 59 | 75 | | Malaysia | 50 | 50 | 94 | 117 | 68 | 94 | 81 | 113 | | Pakistan | 5 | 7 | 10 | 11 | 46 | 48 | 51 | 41 | | Philippines | 23 | 24 | 37 | 48 | 73 | 69 | 57 | 57 | | Thailand | 22 | 26 | 65 | 80 | 58 | 86 | 70 | 91 | | Vietnam | 0 | 12 | 34 | 23 | 0 | 90 | 78 | 96 | | UK | 165 | 238 | 599 | 694 | 166 | 245 | 605 | 711 | | USA | 37 | 54 | 139 | 146 | 43 | 64 | 163 | 173 | | Source: Philip-Lane database and WDI. | For an emerging and developing Asia, financial vulnerability indicators are improving over the years with external integration. The current account of developing Asia is in surplus while earlier it was in deficit. Further, the reserve level has also improved. The external debt to GDP ratio has improved significantly after the recent global crisis and in recent times the share of direct investment in total private capital flows has also improved. All these indicate that Asia’s financial vulnerability indicators have been getting better over the years (Table 3). The share of short-term debt in total external debt has also remained broadly stable in various economies, except in the case of China and Malaysia (Chart 6). | Table 3: Indicators of Financial Vulnerability of Asian Economies | | | 1991-97 | 1998-2008 | 2009-2013 | | Change in Current account balance (US$ billion) | -16 | 150 | 146 | | Current account balance (to GDP) | -1 | 3 | 2 | | Change in reserves (US$ billion) | 30 | 218 | 408 | | External debt, total (to GDP) | 31 | 24 | 15 | | Share of direct investment in private financial flows | 65 | -31 | 99 | | Source: WDI and WEO database. |
Section V
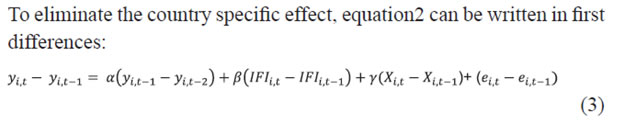
Empirical Work on a Relationship between IFI and Growth In this section, the effect of capital account liberalization on growth is examined. It is generally argued that IFI has an effect on growth. To obtain an intuitive impression about the effect of IFI on growth, Table 4 presents the growth of major economies of Asia and the indicator of their integration with the outside world in terms of average external assets and liabilities to GDP ratio during 1991-2010. It makes clear that there are fast growing countries which are less integrated with the outside world, and there are also some slow growth economies which are more integrated with the outside world. From Table 4 it can be inferred that external integration does not have much correlation with the growth rates of major Asian economies. | Table 4: Growth of Asian Economies and their International Integration | | Economies | Mean Integration | Average GDP Growth (%) | | Bangladesh | 49 | 3.82 | | China | 76 | 9.51 | | India | 48 | 5.00 | | Indonesia | 84 | 3.27 | | Japan | 149 | 0.69 | | Korea | 87 | 4.04 | | Malaysia | 174 | 3.47 | | Pakistan | 52 | 1.95 | | Philippines | 100 | 2.11 | | Thailand | 125 | 3.42 | | Vietnam | 59 | 5.90 | | Source: Philip-lane database and WDI. | However, a detailed empirical analysis is required on IFI and growth for finding a robust relationship between the two. Data sources While there are arguments and counter-arguments over whether IFI enhances growth, the difficulty in undertaking any empirical exercise on this aspect is compounded by the choice of indicators to measure IFI. Countries apply a wide range of price and quantity controls on various financial transactions to modulate the flow of capital. Measuring differences in the nature, intensity and effectiveness of barriers to international financial transactions creates technical problems for researchers (Eichengreen 2001). The International Monetary Fund’s (IMF’s) restriction measure is mostly used as an indicator of government restrictions on international transactions. It divides countries as per the presence and absence of restrictions and it does not give any indication of the actual magnitude of these restrictions. Hence, most empirical studies use de facto measures like actual capital flow to GDP ratio as an indicator of international financial integration. These types of measures are not subjective and are widely available (Edison et al. 2002). The problems associated with both de jure and de facto measures of IFI are well known. Overall, de jure measures are subjective. There are instances of countries which apply different regulations for different nationalities and different regulations for inflows and outflows but all these affect de jure measures similarly. Though all these arguments compel us to use de facto measures, the problems associated with them are also unlimited. Even if they provide more information about openness, they have limitations when it comes to showing the actual severity of regulations (Obstfeld 2012). In this study, de facto indicators such as total capital flows and total capital inflows to GDP ratio are used as indicators of IFI as they highlight the ability to receive foreign capital and the ability of residents to go for international investments. Further, capital inflow as a share of GDP is used as it has often been emphasized that this has an effect on growth. Secondly, Lane and Milesi-Ferretti’s ratio of total stock of foreign assets and liabilities to GDP and ratio of total stock of foreign liabilities to GDP are taken as indicators as these help in giving the idea of an average level of openness. Most of the studies on the effect of IFI on growth generally augment a basic growth model comprising schooling, investment, population growth and initial year GDP by an indicator of capital account liberalization. In line with this, in this paper, the model and econometric techniques availed from recent literature have been applied (Edison et al. 2002). In growth regressions, initial economic conditions are controlled to take out the effect of these drivers of growth (Barro and Sala-I-Martin, 1992). In line with the earlier model, real per capita income growth was regressed on initial income, average years of schooling, average consumer price inflation, budget deficits and on the measure of IFI. The likely effects of economic variables are given in Table 5. A panel data technique was used to exploit the time series as well as the cross-sectional nature of the data. For assessing the growth effects of IFI, the effects of other growth determinants were controlled. Growth refers to real per capita GDP growth. This study used panel data from 11 major economies of Asia during 1991-2010. The countries are Bangladesh, China, India, Thailand, Malaysia, Indonesia, Pakistan, Vietnam, Philippines, Japan and Korea. The variables used in this study were taken from various sources: (i) Real per capita GDP (source:World Development Indicator, the World Bank), (ii) investment–GDP ratio (source: WDI), (iii) inflation (source: WDI), (iv) government balance (source: ADB and others), and (v) enrolment rate (source: the Barro-Lee data base). Total capital flows and total capital inflows data were taken from IFS (International Financial Statistics, International Monetary Fund). Data for 20 years were taken and the averages calculated (except in case of initial income) for a non-overlapping four years interval so that five data points were created for every economy. Averaging was done to take out the cyclical behaviour of the data and smooth out its short-run fluctuations. | Table 5: Variables and Expected Effect on Growth | | Variables | Measurement /Description | Likely Effect | | Initial Income | Real per capita GDP in the initial year of the period
(Generally countries with lower initial income are expected to see higher growth) | Negative | | Initial schooling | Total year of secondary schooling in the initial year
(Generally higher human capital is likely to generate higher growth) | Positive | | Inflation | Change in Consumer Price Index
(shows macroeconomic policy management) | Negative | | Government Balance | Fiscal deficit to GDP ratio
(Another measure of macroeconomic policy which is expected to have a positive contribution when it is in surplus) | Negative | Methodology A system generalized method of moment (GMM) and random effect model were used. Since the random effect model is very common, only the methodology of GMM is described here. System GMM GMM was used as it takes care of the endogeneity of the capital inflow, that is, a high growing economy is likely to attract more foreign capital. 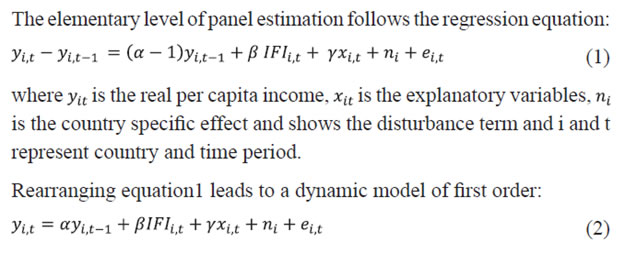
Instruments were used to control the endogeneity of the explanatory variables and correlation of the error term with lagged dependent variables. In this context, the system GMM estimator was used. The system GMM adds a standard set of equations in first differences with lagged levels as instruments with an additional set of equations in levels with lagged first differences as instruments (Arellano and Bover 1995). Estimation Results Most of the studies augment a basic growth model by an indicator of capital account liberalization. In line with this, real per capita income growth was regressed on initial income, average years of schooling, average consumer price inflation and budget deficits and on the measure of IFI. In this case, a cross-sectional analysis using OLS can be biased if capital flows are influenced by growth rate. The system GMM methodology takes care of this potential fallacy. The system GMM methodology was applied to the panel data and the results are given in Table 6. The results show that initial income enters the equation negatively, indicating conditional convergence. Further, initial schooling is found to be positive and mostly significant. The government fiscal deficit appears with the expected negative sign but it is insignificant. Inflation remains mostly insignificant but its sign changes. Overall, control variables are well behaved. The results do not reject the premise that IFI does not help in faster growth. However, the results change with the use of an alternative proxy of IFI. IFI affects growth significantly when gross capital inflow to GDP ratio or total stock of liabilities to GDP ratio is used as a proxy of IFI. Only for the gross capital inflow to GDP ratio, does IFI generate a positive relationship with growth. These types of results can be interpreted as not rejecting the null hypothesis of no statistical relationship between IFI and economic growth. Even the sign of the impact changes when other indicators of IFI are used. Further, the results are mixed and are not consistent across indicators. Since the relationship between IFI and growth varies with a change in proxy of IFI, the study is unable to establish any robust relationship between the two. | Table 6: Benchmark Growth Regression | | Dependent variable: Real per capita GDP growth (System GMM estimation) | | Proxy of IFI | Gross capital flow | Gross capital inflow | Total stock of external asset and liabilities | Total stock of liabilities | | Initial income | -0.00 | -0.00 | -0.00 | -0.00 | | | (0.11) | (0.00) | (0.42) | (0.26) | | Initial schooling | 0.004 | 0.009 | 0.006 | 0.006 | | | (0.15) | (0.00) | (0.02) | (0.03) | | Government balance | -0.002 | -0.002 | -0.001 | -0.001 | | | (0.31) | (0.30) | (0.22) | (0.17) | | Inflation | -0.001 | -0.002 | 0.000 | 0.000 | | | (0.25) | (0.07) | (0.93) | (0.62) | | IFI | 0.001 | 0.003 | -0.000 | -0.000 | | | (0.34) | (0.01) | (0.39) | (0.00) | | Constant | 0.031 | 0.015 | 0.015 | 0.042 | | | (0.22) | (0.43) | (0.40) | (0.03) | | AR (2) (p-value) | 0.57 | 0.81 | 0.41 | 0.41 | | Sargan test (p-value) | 0.74 | 0.80 | 0.64 | 0.66 | | Note: The results are of robust one-step Arellano-Bond System GMM dynamic panel estimation. P-values are given in the brackets. For the system GMM, international financial integration is treated as an endogenous variable, while initial income, initial schooling, government balance and inflation are treated as exogenous variables. | The estimation passes through the specification tests successfully. The sargan test results do not contradict the econometric specification and the validity of the instruments. Further, the serial correlation test in the error terms at the second order level does not reject the model for the presence of serial correlation. The evidence found so far is based on calculations done by lumping together various types of capital flows. All types of capital flows are not equal. FDI is believed to yield more benefits than other types of capital flows. The effects of financial openness are likely to be more revealing with the use of disaggregated data. A disaggregated data analysis can also reveal the channel through which capital flows affect growth. It has been argued that it is not just capital flows but there are other benefits from international integration like development of the financial sector, building of good institutions and macroeconomic discipline. These collateral benefits can bring in higher growth. A corollary of this argument is that collateral benefits may boost growth by increase in total factor productivity (Kose et al. 2009). Further, while more integrated economies do not grow faster, it is possible that the growth effect is conditional on the types of capital flows or third factors such as the institutional framework (Edwards 2001, Alfrao et al. 2005), and exploring these issues in greater detail is a very important area of further research. The mixed result of the previous estimation highlights the need to look into the growth effects of different types of capital flows. Even though the overall opening of the economy (both inward and outward) can have a mixed impact on growth, whether the capital flows have any significance for the growth process needs to be empirically tested. In this paper, the growth effects of various types of capital flows were examined in detail keeping the other issue of institutional framework for another research paper. The real per capita GDP growth was regressed on different types of capital flows; the results are given in Table 7. It may be added that the effect of capital flows on growth changes with the use of different types of capital flows. When total inward capital inflow is used, there is a positive and significant relationship. Similarly, inward direct investment and inward portfolio flows have a positive and significant relationship with growth. In the case of other type of flows, the result is positive but insignificant. These results indicate that capital flows do accentuate growth in Asia. In order to gain clarity over the issue, there is a need to look into the theoretical aspect. Theory says capital flow (or international financial integration) affects growth through enhancing investment and also by enhancing productivity. An inflow of capital increases the available investments and growth. But capital flow can also help growth through productivity increase. This arises when IFI brings in better utilization of domestic savings and increases efficiency in financial intermediation. Further, in the absence of capital inflows, increased competition, technology transfers and institutional developments from global integration can help in boosting growth (Levine 2006, Schularick et al. 2007). | Table 7: Effects of Different Types of Capital Flows on Growth | | Dependent variable: Real per capita GDP growth (System GMM estimation) | | Proxy of IFI | Inward capital flow | Direct Investment | Portfolio flows | Other flows | | Initial income | -0.00 | -0.00 | -0.00 | -0.00 | | | (0.001) | (0.04) | (0.001) | (0.001) | | Initial schooling | 0.009 | 0.007 | 0.009 | 0.01 | | | (0.002) | (0.02) | (0.001) | (0.001) | | Government balance | -0.001 | -0.002 | -0.0004 | -0.002 | | | (0.30) | (0.21) | (073) | (0.26) | | Inflation | -0.0002 | -0.0006 | -0.0001 | 0.0001 | | | (0.80) | (0.48) | (0.93) | (0.95) | | IFI | 0.0018 | 0.005 | 0.005 | 0.002 | | | (0.02) | (0.04) | (0.04) | (0.14) | | Constant | 0.001 | 0.011 | 0.006 | 0.006 | | | (0.53) | (0.59) | (0.77) | (0.77) | | AR (2) (p-value) | 0.74 | 0.59 | 0.85 | 0.47 | | Sargan test (p-value) | 0.21 | 0.16 | 0.20 | 0.18 | | Note: The results are of robust one-step Arellano-Bond System GMM dynamic panel estimation. P-values are given in the brackets. For the system GMM, international financial integration is treated as an endogenous variable, while initial income, initial schooling, government balance and inflation are treated as exogenous variables. | In a standard growth model, GDP per capita growth is a function of income level, investment ratio, human capital and growth in population. In the regression capital inflow is added as an additional regressor. If capital inflow affects growth mostly as an addition to investment, then the capital inflow variable is likely to remain insignificant in the presence of investment. In contrast, if it affects growth mostly through productivity enhancement, then it is likely to remain significant in the presence of the investment variable (Schularick and Steger 2007). The regression shows that inward capital flows and inward portfolio flows affect growth primarily through the productivity channel (Table 8). Even after the impact of investment is controlled, both these inflows have a significant effect. In the presence of capital flow variable, the significance of the investment declines to below the conventional significance level, which highlights some degree of collinearity between capital flow and the investment ratio. There are some interesting findings from the estimation results. The basic neo-classical growth model appears to have worked well in this regression also. Conditional convergence is achieved as initial income has a negative sign. Both physical investment and human capital work in the desired direction, though the human capital variable is marginally above the 10 percent level of significance. The population growth variable appears with the expected negative sign. | Table 8: The Standard Neo-classical Growth Model | | Dependent variable: Real per capita GDP growth (System GMM estimation) | | Regression | Without capital flow | Inward capital flow | Inward Direct capital flow | Inward portfolio flow | Inward other flow | | Initial income | -0.00 | -0.00 | -0.00 | -0.00 | -0.00 | | | (0.038) | (0.02) | (0.17) | (0.03) | (0.02) | | Initial schooling | 0.007 | 0.007 | 0.005 | 0.004 | 0.008 | | | (0.11) | (0.09) | (0.21) | (0.25) | (0.08) | | Population growth | -0.48 | -0.43 | -0.52 | -0.91 | -0.37 | | | (0.47) | (0.49) | (0.42) | (0.13) | (0.57) | | Investment | 0.001 | 0.001 | 0.001 | 0.001 | 0.001 | | | (0.07) | (0.27) | (0.21) | (0.36) | (0.16) | | Capital flow | - | 0.002 | 0.004 | 0.006 | 0.001 | | | | (0.06) | (0.19) | (0.02) | (0.33) | | Arellano-Bond test (P-value) | 0.99 | 0.48 | 0.17 | 0.91 | 0.32 | | Sargan test (P-value) | 0.09 | 0.68 | 0.23 | 0.73 | 0.45 | | Note: The results are of robust one-step Arellano-Bond System GMM estimation. For the system GMM, international financial integration is treated as an endogenous variable, while initial income, initial schooling, population growth and investment are treated as exogenous variables. P-values are given in the brackets. | Looking at the channels through which capital inflows affect growth, it is evident that there are signs of the productivity channel working here. It appears that total capital inflows have a productivity effect on the growth process. However, though capital flow variables are significant in growth regressions, some of them turn insignificant in the presence of the investment ratio. The significance of investment also declines in the presence of the capital flow variable, which indicates that there is some collinearity between the capital inflow and investment ratio. To delve deeper, aggregate investment is regressed on capital inflow variables. If capital inflow brings in higher investments, then there is most likely to be a significant relationship between capital inflows and investments. To find the relationship between capital inflows and investment, investment was regressed on initial income, inflation, government balances, human capital, and then the capital flow variable was added to it. The random effect panel regression was applied, as suggested by the Hausman test. The results of the random effect panel regressions which are given in the Table 9 highlight the relationship between capital inflows and investments in Asia. All the regressions suggest capital inflow measures to be statistically significant. This seems to suggest that with greater openness, Asian economies witnessed an increase in investments. | Table 9: Determinants of Aggregate Investment | | Dependent variable : Investment GDP ratio (Random Effect panel estimation) | | Inward capital flow | 0.86 | | | | | | (0.00) | | | | | Inward direct capital flow | | 1.93 | | | | | | (0.00) | | | | Inward portfolio flow | | | 1.84 | | | | | | (0.01) | | | Inward other flows | | | | 0.79 | | | | | | (0.003) | | Initial income | -0.0002 | -0.0001 | -0.0002 | -0.0003 | | | (0.38) | (0.95) | (0.40) | (0.20) | | Govt balance | -1.07 | -1.39 | -1.44 | -1.23 | | | (0.00) | (0.00) | (0.00) | (0.001) | | Inflation | 0.08 | 0.04 | 0.14 | 0.179 | | | (0.63) | (0.80) | (0.47) | (0.345) | | Initial schooling | 0.20 | -0.20 | 0.34 | 0.87 | | | (0.78) | (0.78) | (0.67) | (0.26) | | Constant | 26.74 | 28.83 | 28.63 | 25.08 | | | (0.00) | (0.00) | (0.00) | (0.00) | | Note: Random-effect panel estimation. P-values are given in the brackets. | Section VI
Conclusion This analysis of the process of international financial integration of some major economies of Asia is unique in certain respects. The investigation of a relationship between IFI and economic growth in 11 Asian countries over 1991-2000 is the first comprehensive study of its kind even though such investigations have been done in other parts of the globe. Another distinguishing feature of this study is that it uses a wide array of IFI indicators to study the effect of IFI on growth in Asia. Further, it chose different capital inflows as proxy for IFI and studied their effect on growth. It also examined channels of growth from capital inflows. To study the relationship between IFI and economic growth, this study employed GMM estimation. The models were run while controlling for initial income, human capital and macroeconomic variables. The possible reason for the lack of a robust positive relationship may be that these countries have not crossed threshold conditions for international integration. These conditions may be linked with the absence of well-developed financial markets and better institutional and regulatory frameworks. Even though the overall impact of IFI on growth was found to be mixed, this study threw up some useful results. It reconfirmed the general observation about the low degree of Asia’s financial integration both with the world and within the region (IMF 2011). The paper observed that Asian economies, barring Japan and Malaysia, were not as much externally open as advanced countries such as the US and the UK. However, the external financial integration of Asian economies was following a rising trend. Further, financial vulnerability indicators of the Asian economies too have improved over the years. At the disaggregated level, it may be added that capital inflows had a significant positive association with the growth process. Growth in Asian economies came from both investment and productivity channels. Both direct investment and portfolio flows had positive effects on growth, though portfolio flows primarily had an effect on productivity increase also. Keeping in view the lack of research on this aspect in Asia, this study was an attempt to open up new research in this area. To conclude, we would like to mention some recent developments which might encourage trends towards greater IFI in the region in the future. Following the great financial crisis, the exit of European banks and the entry of Australian and Japanese banks in other Asian countries is a trend which may be indicative of higher financial integration within the region. The setting of the BRICS Bank and the Asian Infrastructure Investment Bank (AIIB) also heralds an era with finance getting centred towards emerging economies in general, and Asian economies in particular. The slow growth in AEs except the US, is also forcing the Asian economies to focus within the region for exports markets. Higher trade integration might prove to be a harbinger of higher financial integration within the region. Talking specifically about India, policymakers are considering pacing up its move towards capital account convertibility as India thrives to become one of the fastest growing economies in the world. References Agenor, Pierre R.(2001),‘Benefits and Costs of International Financial Integration’, Paper for the Conference on Financial Globalisation: Issues and Challenges for Small States. Saint Kitts, 27-28 March. Alfaro, Laura, Sebnem Kalemli-Ozcan and V. Volosovych (2005),‘Why does not capital flow from rich to poor countries? An empirical investigation’, Harvard Business School Working Paper No.4-40. Arellano, Manuel and Bover Olympia (1995). ‘Another Look at the Instrumental Variable Estimation of Error-Components Models’, Journal of Econometrics 68 (1). Bailliu, Jeannine (2000),‘Private Capital Flows, Financial Development, and Economic Growth in Developing Countries’, Bank of Canada Working Paper No.15. Barro, Robert J. and Sala-i-Martin (1992),‘Convergence’, Journal of Political Economy 100 (21). Bhagwati, Jagdish (1998), ‘The capital Myth-The difference between trade in Widget and Dollars’, Foreign Affairs, May/June,77. Caprio, Gerard and Patrick Honohan (1999), ‘Restoring Banking Stability: Beyond Supervised Capital Markets’, Brookings Paper on Economic Activity 1: 143-80. Edison, Hali J., R. Levine, L. Ricci and T. Slok (2002), ‘International Financial Integration and Economic Growth’, IMF Working Paper, No.145. Edison, Hali J., M. Klein, L. Ricci and T. Slok (2004),‘Capital Account liberalisation and economic performance: Survey and Synthesis’, IMF Working Paper No.120. Edwards, Sebastian (2001), ‘Capital Mobility and Economic Performance: Are emerging economies different?’, NBER Working Paper No. 8076. Eichengreen, Barry (2001), ‘Capital Account liberalisation: What do cross country studies tell us?’, World Bank Economic Review 15(3): 341-65. Grilli, Vittorio and Gian M. M. Ferretti (1995), ‘Economic Effects and structural determinants of Capital controls’, IMF Staff Papers 42 (3). Henry, Peter B.(2007),‘Capital Account liberalisation: Theory, Evidence and Speculation’, Journal of Economic literature 45(4):887-935. Khan, Harun R.(2014),‘Regulating Capital Account: Some thoughts’, 9thAnnual Conference of FEDAI, CapeTown,12 April. Klein,M. and G. Olivei(1999),‘Capital Account Liberalisation, Financial Depth and Economic Growth’, NBER Working Paper No. 7384. Kose,M.A., E. Prasad, K. Rogoff and S.J. Wei (2009), ‘Financial Globalisation: A Reappraisal’, IMF Staff Papers 56(1). Krugman, Paul (2000), ‘Crises: The price of Globalisation?’ Paper presented at 2000 Symposium on Global Integration. Kansas City: Federal Reserve Bank of Kansas. Levine, Ross (1996), ‘Foreign Banks, Financial Development and Economic Growth’, in Claude E. Barfield (ed.), International Financial Markets: Harmonisation versus Competition. Washington DC: American Enterprise Institute. Levine, Ross (2001), ‘International Financial liberalisation and Economic growth’, Review of International Economics 9(4): 688-902. Levine, Ross (2006), ‘Finance and Growth: Theory and Evidence’, NBER Working Paper No. 10766. Obstfeld, Maurice (1994), ‘Risk-Taking, Global Diversification, and Growth’, American Economic Review 84(5): 1310-29. Obstfeld, Maurice (2005), ‘Reflections upon Rereading “The Capital Myth”, Jagdish Bhagwati 70th birthday celebrations, Columbia University. Obstfeld, Maurice (2009), ‘International Finance and Growth in Developing countries: What have we learned?’ NBER Working paper No. 14691. Obstfeld, Maurice (2012), ‘Financial flows, financial crises and global imbalances’, Journal of International Money and Finance 31(3): 469-80. Prasad, Eswar, R. Rajan and A. Subramanian (2006),‘Patterns of International Capital Flows and Their implications for economic development’, Paper presented at the symposium, ‘The Economic Geography: Effects and Policy implications’, The Federal Reserve Bank of Kansas City, Jackson Hole. Quinn, Dennis (1997), ‘The correlates of Change in International Financial Regulation’, American Political Science Review 91(3): 531-51. Rishabh, Kumar and S. Sharma (2014), ‘Global Liquidity, Financialisation and Commodity Price Inflation’, RBI Working Paper WPS(DEPR): 01 / 2014. Rodrik, Dani (1998), ‘Who needs capital account convertibility’, Essays in International Finance, No.207.Princeton,NJ: Princeton University. Rodrik, Dani and A. Subramanian (2009), ‘Why did Financial globalisation disappoint?’, IMF Staff Papers 56(1): 112–38. Schularick, Moritz and T. M. Steger (2007), ‘Financial integration, Investment and Economic growth: Evidence from Two eras of Financial Globalisation’, CESifo Working Paper No. 1691. Stiglitz, Joseph E. (2000), ‘Capital Market Liberalisation, Economic Growth and Instability’, World Development 28(6): 1075–86. The Reserve Bank of India (2007), Report on Currency and Finance. Mumbai: RBI.
|