M. Sreeramulu, A. Ramanathan and Krishnan Narayanan* The paper investigates whether heterogeneity exists across size-classes and industry groups as far as the impact of financial variables (internal funds, bank credit, equity capital) on investment spending is concerned. For empirical analysis, we use the Reserve Bank of India’s (RBI) database on company finance statistics over the period 1999-2000 to 2010-11. Our results confirm heterogeneity across size-classes and industry groups. Accordingly, large firms and industry groups – textiles and metals relatively depend more on bank credit for financing their investments. Industry groups which are involved in producing luxury goods are less dependent on internal funds. On the other hand, large firms’ investment decisions are highly motivated by internal funds. Further, equity capital turns out to be insignificant for small firms; this confirms the information problems faced by these firms in raising funds from capital markets. JEL Classification : E22, G21
Keywords : Investment, Accelerator, Bank Credit, Internal Funds Introduction Access to financial resources for investments in fixed assets may not be uniform for all firms and are likely to change across firms. Heterogeneity in accessing such financial resources arises in part because of asymmetric information problems in the capital markets (Athey and Reeser 2000). These problems make external funds costly, if not impossible, for certain firms (such as small firms) to obtain their desired quantity of investment funds. Limited access to capital markets in turn increases the customary preference for using internal funds to finance investment expenditures (Oliner and Rudebusch 1992). In the Indian context because of Government directed credit policies to a certain extent small firms are able to mitigate such information problems while raising financial resources from banks. However, they tend to suffer when it comes to raising funds from equity/debt markets. In comparison as large sized firms have (a) higher quantum of net worth and (b) more information on their financial performance in the public domain, lenders generally prefer these firms at the time of lending. Consequently, large firms suffer less as far as raising financial resources from the equity/debt markets is concerned. Analysing firm heterogeneity in accessing financial resources and in turn its impact on investment spending is well recognized in investment literature.1 For identifying such heterogeneity, previous studies adopted various criteria for classifying firms in distinct groups and analysing the impact of financial resources on investment spending across groups of firms. However, the common methodology adopted includes the size of the firm (small, medium and large firms), outward orientation (export orientation firms and domestic firms), industry-group of the firm, profit retention (high retention, low retention), access to debt and equity finance and access to capital markets.2 In the context of the degree of firm heterogeneity, a few studies have analysed determinants of investments in India by splitting sample firms into different groups based on the size and industrial activity of the firms. There is a much-felt need to undertake further research in this area on account of the following factors. Firstly, the definition adopted by the earlier studies for categorizing firms into size-classes (such as small and large firms) appears to be obsolete3 in the current globalized financial environment. Secondly, as the Indian Government promotes industrialization through the favourable treatment of priority industries, grouping firms according to their industrial activity by considering latest firm-level data may provide additional evidence on the relative importance of financial variables. Thirdly, with a view to enhancing the credit flow to the small scale industrial sector (SSI), the Government of India has initiated a number of measures4 consequent to which bank credit to SSIs has increased significantly.5 An empirical examination of whether such increased bank credit has any impact in increasing investment spending of small firms will be of great significance in evaluating the efficacies of Government directed credit policies.6 Fourthly, under the scenario of a rapid increase in capital market finance by firms7, particularly since the mid-2000s, analysing whether there is any heterogeneity among Indian firms in accessing funds from capital markets for undertaking investments is of paramount importance for policymakers. In the backdrop of these issues, this paper examines two aspects: (i) whether heterogeneity exists across size-classes and industry groups of firms in a link between financial variables (such as internal funds, bank credit, equity capital) and investment and (ii) highlighting policy implications based on empirical results. For empirical investigations, we adopted a panel data regression analysis. The paper uses the Reserve Bank of India’s database on company finance statistics over the period 1999-2000 to 2010-11.8 By adopting statistical rules, we split our sample firms into four parts based on the firms’ total assets. Accordingly, all firms with total assets below the 25th percentile are classified as small firms, all firms with total assets between the 25th and 75th percentiles are classified as medium firms and firms with total assets of more than 75th percentile are classified as large firms. For classifying firms into industry groups we followed the ‘National Industrial Classification-1998’ criteria of the Government of India. Accordingly, depending on the availability of data and industry group representation, we classified our sample firms into four major industry groups - ‘textiles’, ‘chemicals’, ‘metals’ and ‘electrical machinery’. The rest of the paper is organized as follows; Section II discusses groupings adopted in previous empirical studies. Section III deals with the framework of empirical analysis and Section IV gives a conclusion and policy implications. Section II
Literature Review Empirical literature shows that a majority of the studies have adopted size criterion while investigating the impact of financial variables on investment spending. However, a few studies have employed industry group criteria while examining the role of financial variables on investment spending. To investigate the heterogeneous effect of internal funds on investment spending, Athey and Laumas (1994) classified sample firms into three size-classes: small, medium and large firms based on the value of their share capital in 1981. The authors further categorized sample firms into seven industry groups. According to the authors, heterogeneity existed among size-classes as well as industry groups in a link between internal funds and investments. In particular, internal funds were relatively more important for large firms and for firms producing luxury goods. Harris et al. (1994) while analysing the effect of financial liberalization on the capital structure and investment decisions of Indonesian manufacturing firms, split sample firms into three groups: small, medium and large.9 The authors found that before liberalization, the smaller firms depended heavily on internal funds to finance their investments and they also faced increasing costs of external funds. However, after liberalization the small firms relaxed their dependence on internal funds. The authors found that for large firms internal funds were insignificant in explaining investments both before and after the liberalization period. To analyse the link between the size of a firm and its financial environment, Eastwood and Kohli (1999) categorized sample firms into eight industry groups. Each industry group was further divided into small and large firms.10 The authors found that small and large firms in India faced contrasting financial environments during 1965-78. According to the authors, large firms with new investment opportunities were able to obtain external finance at the margin while small firms were not. The authors found that internal funds and bank credit were important in determining investments for small firms. To investigate the heterogeneity in the link between internal funds and investment among Indian firms, Athey and Reeser (2000) split the sample firms into small and large ones. To arrive at a sample of small firms the authors used the size criterion established to determine if a firm was eligible to borrow from State Finance Corporations (SFCs). All firms that did not meet the definition of a small firm were classified as large firms. Further, large firms were divided into two groups based on their ability to mitigate the effects of asymmetric information problems. Accordingly, firms that had total assets greater than or equal to ₹450 million or more connected with the Tata, Birla or Mafatlal industrial houses were categorized as ‘have easy access to capital markets (HEA)’ and all firms not classified as either small or HEA were considered large firms which had ‘limited access to capital market (HLA).’ The authors found that internal funds were less important for small firms than they were for large firms. Further, within large firms internal funds were unimportant for very large, well known firms as they could raise external funds without any difficulties. While analysing the heterogeneity in firms’ financing patterns, Kumar et al., (2002) considered size as the criteria for distinguishing ‘high- information cost’ firms from ‘low-information cost’ firms. According to them, large firms faced greater finance constraints as compared to small firms. Sancak (2002) investigated the impact of the Turkish financial liberalization process of 1980 on firm-level investments by using data pertaining to manufacturing establishments over 1983 to 1986. According to Sancak medium-sized firms faced both an increasing premium and a credit rationing in the post liberalization period. Large firms also faced an increasing premium but were not rationed out of credit markets. However, in the case of small firms, the author found no evidence of either an increasing premium or credit rationing. Bhattacharyya (2008), examined the determinants of investments across two industry groups in India - ‘electronics, electrical equipment and cables’ and ‘general engineering’ during the post-reform period. The author found that the ‘general engineering’ industry group, could access external funds with relatively more ease. Section III
Empirical Analysis III.1. Empirical Analysis on Firm Heterogeneity and Corporate Investments This section gives econometric evidence on heterogeneity in firms’ financing patterns of investments. We conduct an empirical analysis by estimating the accelerator investment model to which we add internal funds, bank credit and equity capital. The model is estimated separately for three size classes (small, medium and large) and four industry groups (textiles, chemicals, metals and electrical machinery). The general specification of our investment model is 
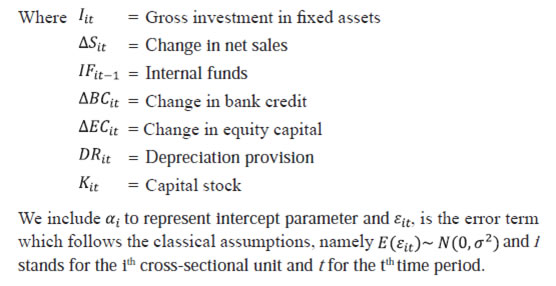
III.2. Definition of Variables Investment The variable (I) represents the gross investment of a firm. As data for actual investment was not available, we use the change in the book value of gross fixed assets as our measure of investment. Other empirical studies which have adopted a similar approach while specifying the investment equation include Krishnamurthy and Sastry (1975), Bilsborrow (1977), Athey and Laumas (1994), Eastwood and Kohli (1999) and Athey and Reeser (2000). Accelerator (∆S) The variable (∆S) represents change in net sales. On the lines of Athey and Laumas (1994), to capture accelerator effects on investment spending, we include two sales change variables – one current period and one previous period. On account of the presence of various kinds of lags such as delivery lags, availability of funds to finance investment projects, construction time and adjustment costs, current changes in net sales induce investments in the future. Likewise, current investments are induced by past changes in net sales. Bank Credit (∆BC) The variable (∆BC) represents change in bank credit. To examine the significance of bank credit in explaining corporate investments on the lines of Athukorala and Sen (2002), we include change in bank credit. We hypothesize that bank credit plays a significant positive role in determining firm-level investments since the Indian financial system is predominantly bank dominated and banks have been playing an active role in arranging not only short-term working capital funds but they are also increasingly involved in providing medium and long-term funds.11 Accordingly, borrowings from banks by the private corporate sector form one of the important sources of funds under external sources of funds.12 Under such circumstances, we may expect that firms may depend on bank credit for financing investment expenditures. Internal Funds (IF) The variable (IF) represents internal funds and is measured as net profit (that is, profits after tax). We consider the previous year’s net profit to represents internal funds because to the extent that firms depend on internal funds for financing their investment projects, investment spending will depend on realized profits (that is, profits already earned). The other empirical studies which have used one period lagged profits as a proxy for internal funds include Bilsborrow (1977), Bond et al. (1994) and Karim (2010). Equity Capital (∆EC) We use the change in the book value of the share capital as a proxy for equity capital. It should be mentioned here is that due to non-availability of firm-level data pertaining to the quantum of capital raised from capital markets, we assume change in book value of the share capital as a proxy for equity capital. Depreciation (DP) The variable (DP) represents depreciation provision. As depreciation is a provision, only book entries are made by deducting it from profit. Some authors include depreciation as a source of internal funds (Bilsborrow 1977 and Fazzari et al. 1988), while some authors interpret depreciation as a measure of replacement investment and include depreciation as a separate explanatory variable to explain gross investment (Fazzari et al. 1987). We follow the latter approach and include depreciation as a separate explanatory variable. Finally, to remove scale dependency and to facilitate comparisons among firms over time, we divide all variables in the regression equation, that is, gross investment, change in net sales, internal funds, change in bank credit, change in equity capital and depreciation by the value of a firm’s capital stock at the beginning-of-period. We estimate the beginning of period capital stock (K) from book values using a Salinger and Summers (1983) perpetual inventory method. The reported value of capital stock in the first year is assumed to be equal to the replacement value. The following formula is used to calculate the replacement value of the capital stock for subsequent years: 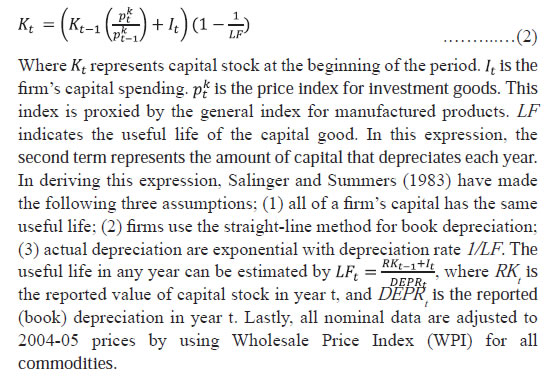
III.3. The Data The sample used for empirical analysis consists of manufacturing firms that have been continuously included in the RBI’s studies on ‘Finances of Public Limited Companies’ over the period 1999-2000 to 2010-11. Therefore, the sample used in this paper is the balanced panel. Size-wise and industry group-wise number of observations included in the empirical estimations are given in Table 1. Table 1: Distribution of Sample Firms | | Group | Number of Firms | Number of Observations | | Size-Classes | | | | Small Firms | 109 | 1090 | | Medium Firms | 104 | 1040 | | Large Firms | 115 | 1150 | | Industry-group | | | | Textiles | 44 | 440 | | Chemicals | 61 | 610 | | Metals | 33 | 330 | | Electrical Machinery | 14 | 140 | Note: (i) All firms having total assets below 25th percentile are classified as small firms, all firms with total assets between 25th and 75th percentiles are classified as medium firms and firms with total assets more than 75th percentile are classified as large firms, (ii) for classifying firms into industry groups we have followed ‘National Industrial Classification-98’ criteria of government of India.
Source: Author’s calculations based on RBI’s firm-level data | III.4. Heterogeneity in Financing Pattern of Investment - By Size Classes Summary Statistics – By Size Classes Table 2 presents the summary statistics of the sample across three size-classes of firms. It is observed that the average ‘investment to capital ratio’ for large firms is considerably larger than that for small and medium firms, indicating that relatively larger firms invest more in fixed investments. The capital productivity measured in terms of average ‘sales to capital ratio’ is also higher for large firms followed by small and medium firms. Further, the average ‘internal funds to capital ratio’ is relatively higher for large firms. The average ‘bank credit to capital ratio’ of small firms remained at 0.0172 while in the case of medium and large firms, it remained at 0.0263 and 0.0401 respectively, indicating larger dependence of large and medium sized firms on bank credit as compared to small firms. Replacement investment represented by ‘depreciation to capital ratio’ of three groups is almost comparable, as firms follow uniform rules while arriving at depreciation provision. 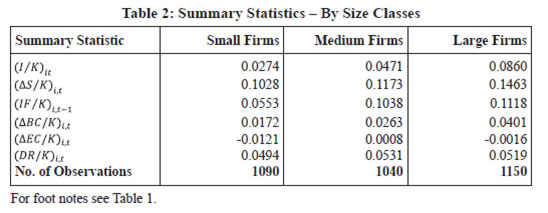 Diagnostic Tests – By Size-Classes For detecting the multi-collinearity in the data we adopted two tests -Variance Inflating Factors (VIF) and the correlation matrix. We found that mean VIF was a little more than 1.00 for all the three size classes (Table 3). It can be observed from the correlation matrix that correlations between explanatory variables included in the regression are by and large low and multi-collinearity is unlikely to be an issue in our estimation (Table 4). Further, to eliminate the problem of heteroscedasticity in estimation, we adopted the procedure suggested by White and obtain the heteroscedasticity-corrected standard errors (that is, robust standard errors). Lastly, for checking the serial correlation in the panel data, we adopted the test suggested by Wooldridge. Results of the Wooldridge test indicate that there is no first order autocorrelation in the data.
Results and Discussion – By Size-Classes Investment equation 1 is estimated separately for three size classes -- small, medium and large firms. For each size class, we presented the results obtained from the Fixed Effects Model (FEM) and Random Effects Model (REM). For small firms, the Hausman test (Null Hypothesis: estimates obtained REM is appropriate) suggests that the REM results are more appropriate while for medium and large firms the results of the Hausman test suggest that FEM are appropriate. Tables 5 to 7 present results for small, medium and large firms. The results indicate that the estimated coefficient of internal funds is positive and statistically significant for all the three size-classes considered for the analysis. However, the coefficient is relatively larger for large firms, indicating that relatively large firms depend more on internal funds for financing their investment expenditures. The result is consistent with previous Indian studies such as those by Athey and Laumas (1994), Athey and Reeser (2000) and Kumar et al. 2001. 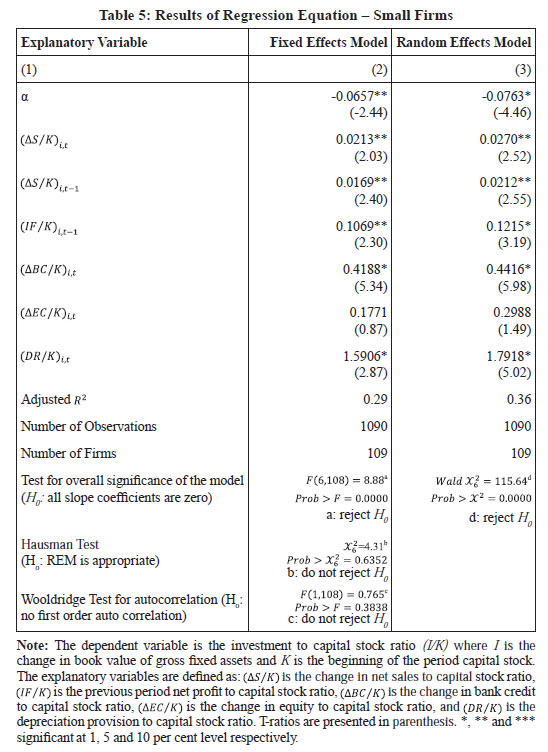 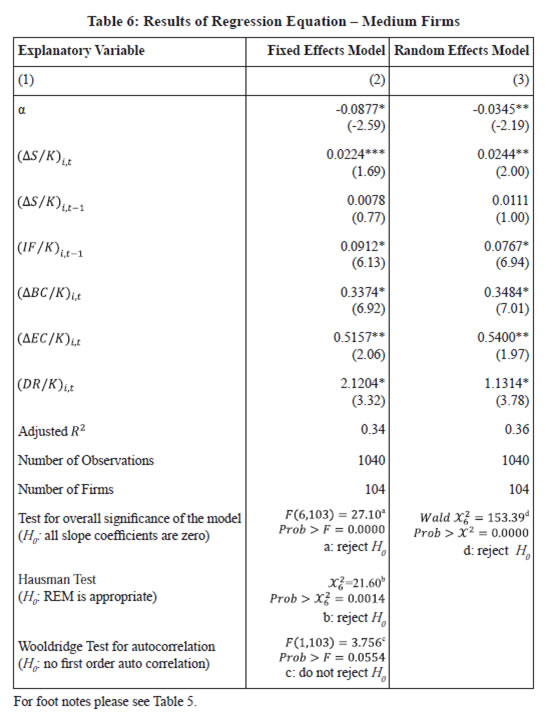 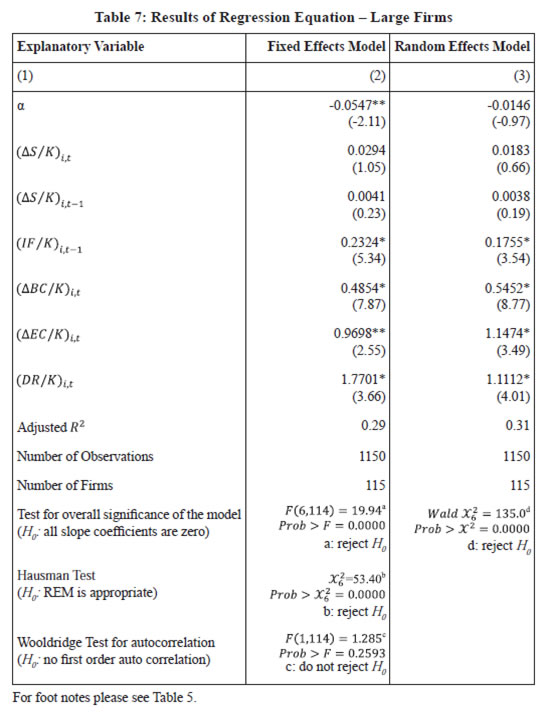 As expected, bank credit turns out to be significant in explaining investments across all three size-classes and its estimated coefficient is positive. The coefficient of bank credit, however, is relatively higher for large firms, indicating that large firms relatively depend more on bank credit to finance their investments in fixed assets. Further, as mentioned earlier, our results for small firms reveal that bank credit is significant in explaining their investments in fixed assets, a result which supports the hypothesis that bank credit channeled to small firms through Governmental credit policies will able to increase their investments in fixed assets (results consistent with Eastwood and Kohli 1999). The estimated coefficient of equity capital has an expected positive sign for all three size-classes and is statistically significant only for medium and large firms, indicating that equity capital has a significant impact on investment decisions of medium and large firms. On the contrary, equity capital is unimportant for our sample of small firms, a result consistent with the view that small firms appear to face information problems in raising funds from capital markets. Estimated coefficients of accelerator variables are positive for all three size-classes. However, accelerator is statistically significant only with respect to small and medium firms. For large firms, our results suggest that accelerator appears to be unimportant in determining investments. This may possibly be on account of the creation of excess capacity by large sized firms in anticipation of future demand. III.5. Heterogeneity in Financing Pattern of Investment - By Industry Groups Summary Statistics – By Industry Group The summary statistics across four industry groups considered for the study are given in Table 8. It is observed that the average ‘investment to capital ratio’ of the ‘metals’ industry group is highest followed by ‘textiles’ and ‘chemicals’ industry groups. The average ‘sales to capital ratio’ with respect to ‘metals’ and ‘chemicals’ industry groups is relatively higher as compared to the other groups. ‘Chemicals’ and ‘electrical machinery’ industry groups appear to retain more in the business. Accordingly, the average ‘internal funds to capital ratio’ of these industry groups is relatively on the higher side. The ‘textile’ industry group appears to depend more on bank credit – the average bank credit to capital ratio for this industry group remained at 0.0429. Except for the ‘metals’ industry group, the average equity finance to capital ratio for the remaining industry groups such as ‘textiles’, ‘chemicals’ and ‘electrical machinery’ is negative. The average depreciation to capital ratio is more or less the same across all four industry groups, indicating similar accounting practices followed by these groups. 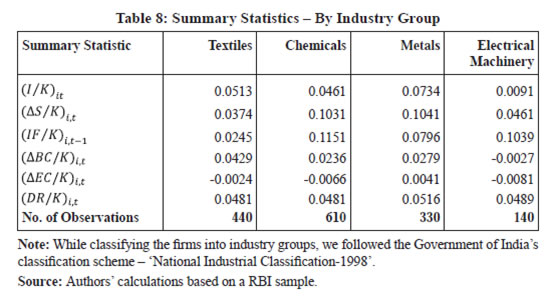 Diagnostic Tests – By Industry Group For detecting the multi-collinearity in the data, we adopted two tests: Variance Inflating Factors (VIF) and the correlation matrix. We found that mean VIF was little more than 1.00 for all four industry groups (Table 9). Further, it can be observed from the correlation matrix that correlations between the explanatory variables are by and large low and multi-collinearity is unlikely to be an issue in our estimation (Table 10). Further, to eliminate the problem of heteroscedasticity in estimation, we adopted the procedure suggested by White and obtain the heteroscedasticity-corrected standard errors. Lastly, for checking the serial correlation problem in the panel data we adopted the test suggested by Wooldridge. Results of the Wooldridge test indicate that there is no first order autocorrelation in the data. Results and Discussion – By Industry Group Investment equation 1 is estimated separately for four industry groups: ‘textiles’, ‘chemicals’, ‘metals’, and ‘electrical machinery’. For each industry group, we furnished the results of FEM and REM. Depending on the direction of the Hausman test we use results of either FEM or REM while drawing statistical inferences. Tables 11 to 14 give results for industry groups textiles, chemicals, metals and electrical machinery. The results indicate that the estimated coefficient of internal funds has an expected positive sign for all industry groups. However, the same is statistically significant only with respect to the ‘textiles’ and ‘chemicals’ industry groups. On the contrary, the results suggest that internal funds are unimportant for industry groups ‘metals’ and ‘electrical machinery’, which are mostly involved in producing luxury goods. Relatively the ‘metals’ industry group, depends more on bank credit, as shown by the larger and significant coefficient. Bank credit is significant even for the other remaining industry groups. Equity capital is significant with respect to the ‘textiles’, ‘chemicals’ and ‘metals’ industry groups. 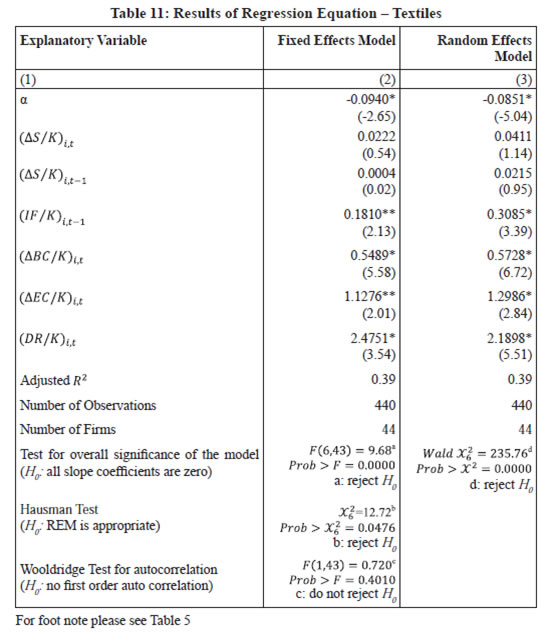 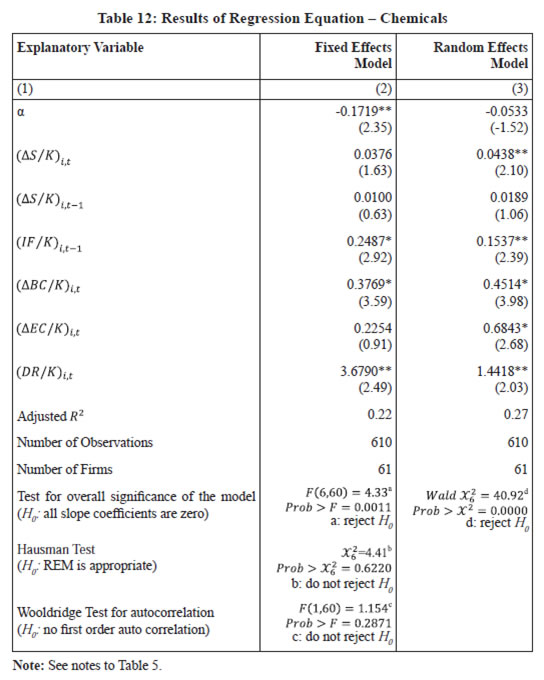 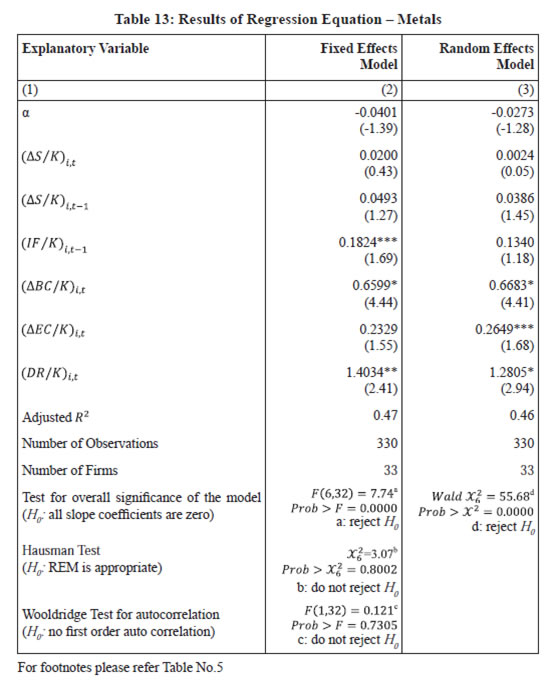 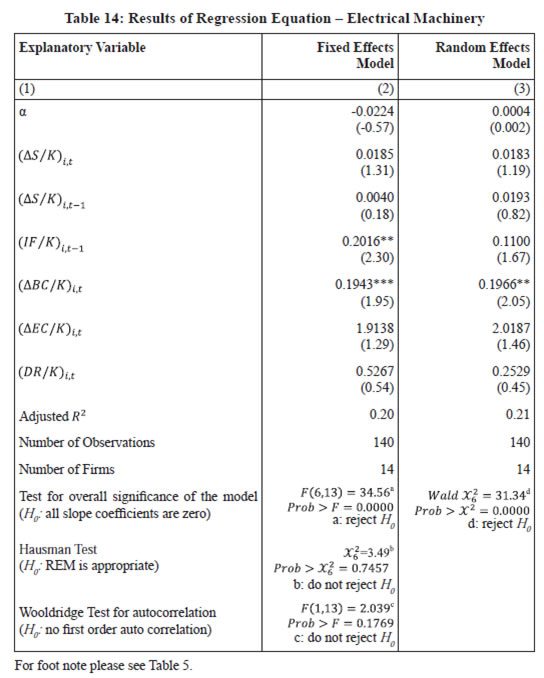 Accelerator variables have an expected right sign for all four industry groups considered for analysis. However, these are significant only in the case of the ‘chemicals’ industry group (result is consistent with Athey and Laumas 1994). Section IV
Conclusion The results confirm heterogeneity across size-classes and industry groups in the link between investment and financial indicators (internal funds, bank credit, equity capital). Our results suggest that relatively large firms depend more on bank credit and equity capital for financing their investments. Results for small firms indicate that bank credit plays a significant positive role in determining their investments in fixed assets. In other words, the finding suggests that bank credit channelized to small firms through directed credit policies has a significant impact on determining their investments (result consistent with Eastwood and Kohli 1999). Further, as expected, the results confirm that small firms appear to face information problems in raising funds from capital markets; accordingly equity capital turns out to be insignificant for these firms. Results across industry groups suggest that internal funds are statistically significant in the case of the ‘textiles’ and ‘chemicals’ industry groups. On the contrary, internal funds are unimportant for industry groups ‘metals’ and ‘electrical machinery’. Bank credit is significant for all four industry groups. However, relatively speaking industry groups ‘metals’ and ‘textiles’ depend more on bank credit. Lastly, the coefficient of equity capital is significant for three out of the four industry groups considered for the analysis. Our results pertaining to small firms reveal that bank credit plays an important role in stepping-up their investments in fixed assets. As small scale firms form an important segment of the Indian economic system with a sizeable share in nation’s output policymakers need to formulate policies to further inject credit into this sector for increasing its overall output in the country. Further, although the stock market liberalization process may be able to mobilize financial resources for firms to a great extent, our results lend support to the fact that small firms still suffer to raise funds from stock markets. This might have unfavourable implications when these firms need to address higher investment demands. Therefore, policymakers need to sketch policies so that these firms are not wiped out from raising funds through stock markets. References Athey, M. J. and P. S. Laumas (1994), ‘Internal Funds and Corporate Investment in India’, Journal of Development Economics 45: 287-303. Athey, M. J. and W. D. Reeser (2000), ‘Asymmetric Information, Industrial Policy and Corporate Investment in India’, Oxford Bulletin of Economics and Statistics 62 (2): 267-92. Athukorala, P. C. and Kunal Sen (2002), Saving, Investment, and Growth in India. India: Oxford University Press. Bhattacharyya, S. (2008), ‘Determinants of Corporate Investment: Evidence from Indian Manufacturing Firms’, Journal of Quantitative Economics 6 (1 and 2). Bilsborrow, E. R. (1977), ‘The Determinants of Fixed Investment by Manufacturing Firms in a Developing Country’, International Economic Review 18 (3): 697-717. Bond, S. and C. Meghir (1994), ‘Dynamic Investment Models and the Firm’s Financial Policy’, The Review of Economic Studies 61 (2): 197–222. Eastwood and R. Kohli (1999), ‘Directed Credit and Investment in Small-Scale Industry in India: Evidence from Firm-Level Data 1965-78’, Journal of Development Studies 35 (4): 42-63. Fazzari, M. S. and M. J. Athey (1987), ‘Asymmetric Information, Financing Constraints and Investment’, Review of Economics and Statistics 69 (3): 481-87. Fazzari, M. S. R., Glenn Hubbard and B. C. Peterson (1988), ‘Financing Constraints and Corporate Investment’, Brookings Papers on Economic Activity 1: 141-206. Harris, J. R., F. Schianterelli and M. G. Siregar (1994), ‘The Effect of Financial Liberalization on the Capital Structure and Investment Decisions of Indonesian Manufacturing Establishments’, World Bank Economic Review 8 (1): 17-47. Karim, Z. A. (2010), ‘Monetary Policy and Firm’s Investment in Malaysia: A Panel Evidence’, IIUM Journal of Economics and Management 18 (2): 221-53. Krishnamurty, K. and D. U. Sastry (1975), Investment and Financing in the Corporate Sector in India. New Delhi: Tata McGraw-Hill. Kumar, A. G., K. Sen and R. R. Vaidya (2001), ‘Outward Orientation, Investment and Finance Constraints: A Study of Indian Firms’, Journal of Development Studies 37 (4): 133-49. Kumar, A. G., K. Sen and R. R. Vaidya (2002), ‘Does the Source of Financing Matter? Financial Markets, Financial Intermediaries and Investment in India’, Journal of International Development 14 (2): 211-28. Oliner, S.D. and G.D. Rudebusch (1992), ‘Sources of Financing Hierarchy for Business Investment’, Review of Economic and Statistics 74 (4): 643-54. Reserve Bank of India (2006), Report on Currency and Finance: 2004-05. Mumbai: RBI. Salinger, M. and L. Summers (1983), ‘Tax Reforms and Corporate Investment’, in M. Feldstein (ed.), Behavioral Simulation Methods in Tax Policy Analysis. Chicago: University of Chicago Press, pp. 247-81. Sancak, C. (2002), ‘Financial Liberalization and Real Investment: Evidence from Turkish firms’, IMF Working Paper No. 02/100.
|