Purnima Shaw* Inflation expectations of households relate to their varying consumption baskets. This is often cited as a reason for expected inflation diverging from actual inflation, not only in India but also in other countries. As the paper finds that households’ inflation expectations in India do not satisfy the statistical conditions of rationality, it aggregates inflation expectations to estimate the mean of an optimal distribution derived from the literature. These mean estimates turn out to be rational, which could be useful to generate forecasts of the headline inflation. Based on an out-of-sample performance analysis, the paper establishes that raw expectations of Indian households, when transformed into rational inflation expectations, contain forward-looking information comparable with that of the professional forecasters. In addition, the width of the confidence band for transformed expectations is much narrower than those obtained from pure time-series forecasts. JEL Classification : C53, D84, E31 Keywords : Forecasting, inflation, rational expectations Introduction Households undertake future financial decisions based on their inflation expectations (Axelrod et al., 2018). Financial decisions include wage negotiations, expenditure, savings and investments, among others, and these in turn form one of the important determinants of future inflation (Bullard, 2016). Measuring and projecting inflation is one of the important aspects of conduct of monetary policy under an inflation targeting regime. Besides, gauging households’ inflation expectations is also important because one of the key objectives of monetary policy is to anchor inflation expectations, which in turn can help achieve the price stability objective. Additionally, inflation expectations may also help in improving the projections of actual inflation. Hence, inflation expectations form an essential input to the central banks’ policy framework. Different measures of inflation expectations include expectations of professional forecasters, households, firms as well as market-based measures of expectations. All of these have their own advantages and disadvantages. For example, professional forecasters and market participants are well-informed and are able to provide both short-term and long-term inflation expectations. On the other hand, data on market-based expectations are available for a long time-series and are expected to contain more information than the expectations of professional forecasters. Further, there have been recent studies on extracting inflation expectations at high frequency using real-time Google Trends data (Bicchal and Durai, 2019; Guzman, 2011). Unlike household surveys, the internet-based measure does not suffer from limitations of time, cost, requirement of designing an effective interactive questionnaire, and the need for efforts in extracting the true inflation expectations of the respondents. Data extraction from Google Trends is automated and can be computed at high frequencies. Guzman (2011) used Google Trends data to estimate inflation expectations and established that these estimates outperform the low frequency measures of expectations in terms of accuracy, predictive power and rationality1. On the other hand, inflation expectations using search query data in Google Trends are rational and bear a long-term relationship with actual inflation in the case of India (Bicchal and Durai, 2019). However, these high frequency data may help address the data gaps and also improve inflation forecasts, but they may never work as an alternative to households’ inflation expectations due to their lesser penetration and cross-sectional coverage than the latter. Thus, even with the availability of alternative measures of inflation expectations, the households’ inflation expectations will remain a vital input to the central banks for policymaking. The Reserve Bank of India (RBI) started conducting the Inflation Expectations Survey of Households (IESH) from September 2005. Other countries conducting such a survey at the time were the United States (US), Australia, United Kingdom (UK), New Zealand, Sweden, South Africa, the Czech Republic, and Indonesia (RBI, 2010). The survey captures household expectations on the direction of general price movement for three months-ahead and one year-ahead horizon at the aggregate level as well as for various product groups including food products, non-food products, household durables, cost of housing and the cost of services. Respondents’ perception on the current inflation rate and their expectations in quantitative terms are also recorded for both horizons. The survey, being currently conducted in 18 cities in India, covers different profiles of respondents. Other details about the survey are presented in the Appendix. There is a large amount of research on understanding the characteristics of inflation expectations and its formation, which includes Menz and Poppitz (2013), Ghosh et al., (2017), Vellekoop and Wiederholt (2017) and Sharma and Bicchal (2018) among the recent ones. Since households provide their expectations about inflation in the future, as a researcher one would like to check how efficiently they can foresee inflation and, therefore, how much relevance needs to be attached to their expectations. For Brazil and Turkey, the inclusion of survey-based expectations in a state-space framework model for inflation forecasting leads to superior forecasting performance compared with forecasting models without survey expectations (Altug and Çakmaklı, 2016). On the other hand, in the Indian case, quantification of directional expectations are found to track actual inflation better than the simple average of the quantitative expectations on the future inflation rate (Das et al., 2018). However, it is observed that although these estimates track inflation better than the raw responses and are comparatively much closer to the actual inflation, they are also biased and very often divergent. In light of this evidence, this paper examines the quantitative responses of Indian households’ inflation expectations. This paper utilises the idea of an optimal probability distribution discussed by Batchelor (2006). Each household is exposed to three kinds of information on inflation: the household-specific estimate based on its own consumption basket; an estimate of inflation based on its time-series history; and the policy target. Regarding the last two, Batchelor (2006) assumes that inflation at a given time point may either realise the value of the policy target with an unknown probability or realise the inflation projection based on its time-series history (subject to an error) with the remaining probability. This unknown probability is explained as the chance that the policy target will be attained and it is considered as an index of the credibility of policy. It differs across households due to various factors. If a household is rational in revealing its expectations while responding to the survey, then the distribution of the response coincides with an optimal distribution. It may be of interest to check whether households’ expectations coincide with the optimal distribution, implying that they are rational. If this is true, the expectations should provide a direct inflation forecast with an acceptable error level. If not, then it can be concluded that the survey provides only the first information, i.e., the household specific estimates and respondents do not make use of the remaining two pieces of information while revealing their inflation expectations. If the second statement is true, then the next question is whether household specific estimates can be aggregated in such a way that they satisfy the tests of rationality; and, third, whether this modified information can help in predicting the actual inflation. Section II explains the behaviour of the Indian inflation expectations data and checks for their rationality using tests from the literature. Theoretical background on the deduction of optimal distribution based on the literature, as presented by Batchelor (2006) is described in Section III. This forms the basis of empirical analysis of this paper. Section IV elaborates the methodology for estimation of various parameters of optimal distribution, followed by the performance of computed mean estimates of the optimal distribution using data on inflation expectations in India. The paper concludes with remarks on the main findings. Section II Inflation Expectations in India The analysis in the paper is based on data on three months-ahead mean inflation expectations of households from the IESH from September 2008. The Consumer Price Index Combined (CPIC) inflation series with base year 2012 is back-casted using the Consumer Price Index of Industrial Workers (CPIIW). The inflation expectations for the quarters for which they were expected and the quarterly averaged CPIC inflation is displayed in Chart 1. It is evident from the chart that inflation expectations in India are biased, i.e., there is an almost unidirectional yet varying gap between the expectations and the actual inflation. The reason for such a bias is often alluded to variability in the components, quality and quantity of items in the consumption baskets of the respondents. Inflation expectations of the households in the US also show an upward bias (Axelrod et al., 2018). Nevertheless, the inflation expectations have decreased from the December 2014 round onwards, in line with the generally declining trend in inflation from March 2014 onwards. 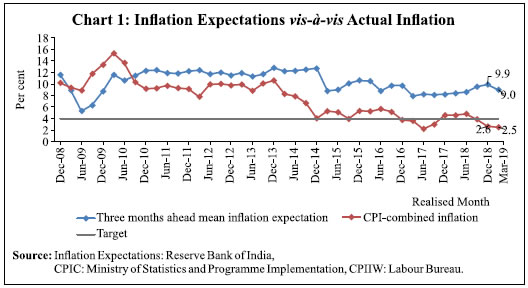 Inflation expectations are said to be weakly rational if they are unbiased and form efficient inflation forecasts (Sharma and Bicchal, 2018). Using Wholesale Price Index (WPI), CPIIW and CPI Food inflation, they establish that inflation expectations in India are not weakly rational. The same tests have been performed below using the CPIC inflation. The test for unbiasedness is as follows: The joint null hypothesis is tested using Wald test with autocorrelation-corrected standard errors using the Newey–West procedure (Newey and West, 1987). The results of this test, displayed in Table 1, indicate that inflation expectations are upward biased. | Table 1: Test for Unbiasedness of Inflation Expectations | | Parameter | Estimate | Standard Error | | α | 1.049 | 5.251 | | β | 0.622 | 0.451 | | Adjusted R-squared = 0.101 | | P value for F-statistic for the joint hypothesis α = 0, β = 1 is 0.000 | An alternative form of the test for unbiasedness suggested by Holden and Peel (1990) is: The null hypothesis is tested using the Wald test with corrected standard errors using the Newey–West procedure. The results of this test displayed in Table 2 corroborate the results in Table 1. The robustness of the above results is then checked by decomposing the mean squared forecast error in its bias, variance and covariance proportions following Sharma and Bicchal (2018). The bias proportion of 0.455 in Table 3 is large, indicating high systematic errors in the households’ inflation expectations. In order to test the efficiency of inflation expectations, the following test is considered: | Table 2: Alternative Test for Unbiasedness of Inflation Expectations | | Parameter | Estimate | P value | | α | -2.867 | 0.002 |
| Table 3: Decomposition of mean squared forecast error | | Bias Proportion | Variance Proportion | Covariance Proportion | | 0.455 | 0.112 | 0.433 |
| Table 4: Test for Efficiency of Inflation Expectations | | P value for F-statistic for the joint hypothesis α = β1 = β2 = β3 = β4 = 0 | = 0.000 | | Adjusted R-squared | = 0.685 | The joint hypothesis is tested using the Wald test and the results are reported in Table 4. The rejection of the joint hypothesis implies that the inflation expectations are not efficient. Also, past errors committed by the households in their inflation expectations explain about 68 per cent of the information about the current error. This information remains largely unused. It may be concluded from the above analysis that the households’ inflation expectations are not weakly rational. Therefore, further tests for strong rationality are not undertaken. These results indicate that households do not make use of all the available information. In such a scenario, the objective of this paper is to explore whether the households’ inflation expectations can be aggregated in a different manner based on a theoretical framework and then verify whether this modified information turns out to be rational. Section III Theoretical Background This section explains the concept of optimal distribution of inflation expectations empirically as deduced by Batchelor (2006). As explained above, households are exposed to three types of information on inflation. The first information is the household’s estimate of future inflation based on its own consumption basket. Let yit be the specific estimate of inflation of ith household or ith group of respondents for time t made at time (t – 3). Let yt be the target variable, i.e., inflation at tth time point. The household-specific estimate is modelled as:
If a respondent is rational in his/her expectation about future inflation, then he/she should use all the above mentioned information to arrive at a statistically optimal conditional distribution based on DeGroot (1970) as given below: Section IV Estimation of Parameters Section V Performance of Estimates The mean estimates of the optimal distribution, their standard errors and confidence bands are computed using equations (11) – (16) considering three months-ahead mean inflation expectations from IESH data to predict inflation from March 2017 onwards to March 2019, i.e., for 9 quarters. These estimates are plotted along with the mean of original inflation expectations and the CPIC inflation in Chart 2. The next step of the analysis is to check whether the estimates pass the tests for weak rationality which were performed on the raw expectations in Section II. The two tests for unbiasedness using equations (1) and (2) and test for efficiency are performed on these 9 mean estimates of the optimal distribution (Tables 5, 6 and 8, respectively). Table 7 demonstrates the decomposition of the mean squared forecast errors for the 9 estimates. All the results indicate that the new estimates are unbiased. Also, the errors committed earlier do not have explanatory power to explain the current error. Hence, it may be concluded that the new estimates obtained from the raw expectations using the optimal distribution are weakly rational. | Table 5: Test for Unbiasedness of Inflation Expectations | | Parameter | Estimate | Standard Error | | α | 0.876 | 1.200 | | β | 0.642 | 0.264 | | Adjusted R-squared = 0.068 | | Pvalue for F-statistic for Wald Test for the joint hypothesis α = 0, β = 1 is 0.151 |
| Table 6: Alternative Test for Unbiasedness of Inflation Expectations | | Parameter | Estimate | P value | | α | -0.602 | 0.086 |
| Table 7: Decomposition of mean squared forecast error | | Bias Proportion | Variance Proportion | Covariance Proportion | | 0.324 | 0.085 | 0.591 |
| Table 8: Test for Efficiency of Inflation Expectations | | Pvalue for F-statistic for Wald Test for the joint hypothesis α = β1 = β2 = 0 | = 0.275 | | Adjusted R-squared | = 0.243 | It may also be important to check whether the inflation expectations directly help in predicting inflation in a standard time-series framework. It was discussed in Section II that the expectations do not help in predicting the three months-ahead actual inflation as they are not rational. However, as both the series i.e., the actual inflation and the expectations, are found to be I(1) i.e., integrated of order one, the same exercise may be undertaken for first differenced series for the same study period as in Section II. The results of the empirical exercise, reported in Table 10, suggests that the coefficient of the third lag of inflation expectations is statistically significant but negative, which is counter-intuitive. Using the equation in Table 10, the out-of-sample three months-ahead forecasts and their standard errors were generated. These forecasts, named ‘regression estimates’, are then compared with the ‘new estimates’ obtained earlier using the optimal distribution (Table 11). As the IESH is conducted only in urban areas, the new estimates and the regression estimates’ were also generated and compared for the CPI urban inflation (Table 12). | Table 11: Comparison of Estimates for CPI Combined | | Estimate | Average Absolute Deviation | Average Width of 95 per cent Confidence Band | | New Estimates | 86.8 | 105.5 | | Regression Estimates | 68.9 | 445.9 |
| Table 12: Comparison of Estimates for CPI Urban | | Estimate | Average Absolute Deviation | Average Width of 95 per cent Confidence Band | | New Estimates | 71.9 | 98.4 | | Regression Estimates | 64.9 | 468.1 | It is evident from the comparison that the new estimates are more representative for CPI urban inflation as the average deviation is lower in the case of the latter. This was expected because the survey is urban-based. Comparison between the new estimates and the regression estimates for both combined and urban inflation clearly indicates that the performance of the regression estimates is better than the new estimates. However, the efficiency of new estimates is much better than that of the regression estimates as the width of the confidence interval for the latter is much wider. This was anticipated because the use of prior information makes the new estimates more efficient. Thus, it may be concluded from the above discussion that the information derived from raw expectations using optimal distribution can predict inflation more efficiently than some of the other available measures. Section V Conclusion The Reserve Bank conducts a survey of households’ expectations of inflation on a quarterly basis. The objective of this paper was to examine whether the outcome of these surveys can be used to predict the actual inflation and if it is possible to arrive at some transformation of expectations to obtain an alternative measure that can efficiently predict the actual inflation. It is observed that the survey results do not provide accurate information about the actual inflation. The empirical exercise in the paper suggests that households’ expectations are often biased and do not pass the tests of rationality because the households do not fully incorporate the information available to them on inflation. The paper, however, finds that it is possible to derive relevant information from the inflation expectations surveys which can be used to predict the actual inflation more efficiently than some of the other available measures. To be more specific, the expectations can be aggregated to estimate the mean of an optimal distribution which can be used to predict the actual inflation. The resultant estimates were found to be rational and provided a forecast of inflation with a gain in efficiency as compared to forecasts based either on past values of realised inflation or raw expectations. The efficiency of the measure based on optimal distribution was better than even the three months-ahead mean projections of the professional forecasters as reflected in the narrower confidence interval in case of the former. The efficiency of the transformed estimates based on raw expectations was empirically confirmed when they were compared with the out-of-sample projections for the period March 2017 to March 2019. Nevertheless, the robustness of these findings needs to be further validated as more data become available in future.
References Altug, S., and Çakmaklı, C. (2016). “Forecasting inflation using survey expectations and target inflation: Evidence for Brazil and Turkey”, International Journal of Forecasting, 32(1), 138–153. Axelrod, S., Lebow, D., and Peneva, E. (2018). “Perceptions and expectations of inflation by U.S. households”, Finance and Economics Discussion Series 2018-073, Washington: Board of Governors of the Federal Reserve System. Batchelor, R. (2006). “How robust are quantified survey data? Evidence from the United States”, Cass Business School, City of London, January. Bicchal, M., and Raja Sethu Durai, S. (2019). “Rationality of inflation expectations: An interpretation of Google Trends data”, Macroeconomics and Finance in Emerging Market Economies, 1-11 (https://doi.org/10.1080/17520843.2019.1599980). Bullard, J. (2016). “Inflation expectations are important to central bankers, too”, President’s Message, Federal Reserve Bank of St. Louis. Das, A., Lahiri, K., and Zhao, Y. (2018). “Inflation expectations in India: Learning from household tendency surveys”, Working Paper Series No. 2018-03, Towson University, Department of Economics. DeGroot, M. H. (1970). Optimal Statistical Decisions, New York: McGraw Hill. Ghosh, T., Sahu, S., and Chattopadhyay, S. (2017). “Households’ inflation expectations in India: Role of economic policy uncertainty and global financial uncertainty spill-over”, WP-2017-007, Indira Gandhi Institute of Development Research. Guzman, G. (2011). “Internet search behavior as an economic forecasting tool: The case of inflation expectations”, Journal of Economic and Social Measurement, 36(3), 119–167. Holden, K., and Peel, D.A. (1990). “On testing for unbiasedness and efficiency of forecasts”, The Manchester School, 58(2), 120–127. Menz, J. O., and Poppitz, P. (2013). “Households’ disagreement on inflation expectations and socioeconomic media exposure in Germany”, Discussion Paper, No 27/2013, Deutsche Bundesbank. Muth, J. F. (1961). “Rational expectations and the theory of price movements”, Econometrica, 29(3), 315–335. Newey, W., and West, K. (1987). “A simple positive semi-definite, heterosckedasticity and autocorrelations consistent covariance matrix”, Econometrica, 55(3), 703-708. Reserve bank of India (RBI) (2010). “Inflation Expectations Survey of Households”, Reserve Bank of India, Quarterly Publications, April. Sharma, N. K., and Bicchal, M. (2018). “The properties of inflation expectations: Evidence for India”, EconomiA, 19(1), 74–89. Vellekoop, N., and Wiederholt, M. (2017). “Inflation expectations and choices of households: Evidence from matched survey and administrative data”, in 2017 Meeting Papers (No. 1449), Society for Economic Dynamics.
Appendix Inflation Expectations Survey of Households (IESH) The Inflation Expectations Survey of Households or IESH is conducted quarterly by the Reserve Bank of India (RBI) since September 2005. In addition to the quarterly rounds, two additional rounds, in November and May each year, are also being conducted since November 2016. Till June 2018, a quota sampling procedure was followed to ensure appropriate representation of different occupational categories. The sample sizes were fixed at 500 households in metro cities and 250 in other centres. However, from September 2018 onwards, a two-stage probability sampling scheme has been implemented. Further, city-wise sample sizes have been revised in proportion to the number of households in each city as per Census 2011. Over the rounds, the coverage of the survey has been expanded and currently it covers a sample size of about 6,000 urban households in specific cities, namely Delhi, Kolkata, Mumbai, Chennai, Ahmedabad, Bengaluru, Bhopal, Bhubaneswar, Chandigarh, Guwahati, Hyderabad, Jaipur, Lucknow, Nagpur, Patna, Raipur, Ranchi, and Thiruvananthapuram. The questionnaire consists of four blocks: Block 1 for the respondent’s details like name, gender, age, category of respondent, etc.; Block 2 and 3 containing qualitative questions about price expectations for general and various product groups for three months and one year ahead, respectively; Block 4 containing quantitative questions on current and expected inflation rates for three months and one year ahead horizons. The response options for the questions in Blocks 2 and 3 are ‘Prices will increase’, ‘Price increase more than current rate’, ‘Price increase similar to current rate’, ‘Price increase less than current rate’, ‘No change in prices’ and ‘Decline in prices’. For the quantitative questions in Block 4, the response options range from ‘less than 1 per cent’ to ‘16 per cent and above’, with intermediate class intervals of size 100 basis points. The salient results of all the survey rounds as well as the unit-level data are available in the RBI website (www.rbi.org.in).
|