Sarthak Gulati, Utsav Saksena, Avdhesh Kumar Shukla,
V. Dhanya and Thangzason Sonna* Using the India KLEMS database, this paper undertakes a detailed sectoral analysis of total factor productivity (TFP). It examines the suitability of aggregation methodologies, inter-sectoral growth and their contributions to aggregate TFP growth in India from 1981-82 to 2016-17. The paper finds Information and Communications Technology (ICT) using industries like business services and financial services having emerged as drivers of productivity during the period 2008-09 to 2016-17. On the other hand, trade and construction industry remained as laggards during this period. Furthermore, this paper finds empirical evidence of convergence and spillover of TFP from the leading industries to the laggards at a faster pace during 2008-09 to 2016-17 than in earlier years. JEL Classification: D24, E24, O47 Keywords: Total factor productivity, Domar aggregation, Harberger plot, convergence and spillover Introduction “Productivity isn’t everything, but in the long-run, it is almost everything. A country’s ability to improve its standard of living over time depends almost entirely on its ability to raise its output per worker” (Krugman, 1997). Cross-country differences in income growth and levels are often attributed to the differences in productivity (Easterly and Levine, 2000). Productivity has re-emerged at the forefront of economic debate post the global financial crisis of 2008. There has been a broad-based slowdown in productivity growth in the post-crisis period across advanced economies, emerging market economies and low-income countries (Adler et al., 2017). While India’s economic growth largely remained resilient amidst a fiscal stimulus provided after the crisis, there have been concerns about productivity slowdown in the Indian economy (Kumar and Soumya, 2010). The literature in this area mostly focuses on single-factor productivity (primarily labour or capital productivity) and multi-factor/total factor productivity (TFP) while analysing country-specific productivity. Single-factor productivity measures provide ease of measurement and comparability (OECD, 2001). For example, labour productivity is a better measure for examining trends in an economy over a short period or making cross country comparisons, as methodologies to construct measures of productivity of capital and labour differ significantly across countries (Sargent and Rodriguez, 2000). However, single-factor productivity measures provide only a partial assessment of productivity (capital or labour) and also reflect the joint influence of multiple factors, leading to interpretation problems. On the other hand, TFP, though difficult to measure, provides a more comprehensive representation. The availability of a productivity database like KLEMS1 (The India KLEMS Database, 2019) has made cross-country comparison possible. India KLEMS, which follows the methodology of EU KLEMS, allows detailed sectoral analysis of productivity. In a growth accounting framework like that of KLEMS, TFP is measured as a residual (ECB, 2007; Jorgenson et al., 2007), after adjusting for growth in labour and capital (and if appropriate, intermediate inputs). The theoretical foundation of TFP dates back to Robert Solow who described it as arising from exogenous technological shock (Solow, 1956). Against this backdrop, this study explores sectoral productivity trends based on the methods and tools used in the India KLEMS database. In order to examine the dynamics of TFP growth, the Schumpeterian growth framework is used following Aghion and Howitt (2006) and Aghion et al. (2014). The Schumpeterian growth theory is based on Joseph Schumpeter’s theory of creative destruction wherein productivity growth is an outcome of innovations. According to this, TFP growth is a catching-up phenomenon and involves the gradual adoption of new technologies by laggards from the leading sectors (Morrow et al., 2010). The paper examines productivity spillover across industries in the Indian economy to see if there is any evidence of convergence and the potential for catching-up. The rest of the paper is organised as follows. Section II provides a brief on the theory behind measuring productivity. Section III gives an overview of the India KLEMS database used in the paper and presents stylised facts on recent trends. Section IV discusses the relevant literature. Section V focuses on aggregation methodology. Section VI presents a disaggregated sectoral and industry-level analysis, while Section VII checks for convergence in TFP in India. Section VIII concludes the paper. Section II
Theory Productivity, in general terms, may be defined as a ratio of a volume measure of output to a volume measure of inputs (OECD, 2001). Among different measures of productivity, labour and capital productivity are the most commonly used measures of single-factor productivity to understand the efficiency of inputs used. Labour productivity is defined as output/ value-added per labour hour. It gives an estimate of the efficiency of labour to generate output with the available stock of capital. According to neoclassical theory, which assumes that returns to factors of production equal to their productivity – higher labour productivity is associated with higher returns to labour in the form of higher real wages (Dearden et al., 2006). Improvement in labour productivity may occur due to: (a) capital deepening (measured as capital stock per worker); (b) rise in efficiency of the existing capital stock; (c) improvement in quality of labour supply; and (d) TFP (RBI, 2019). While capital deepening refers to an increase in capital stock per unit of labour, efficiency in utilisation of capital may improve due to better procedures or technological developments which may, in turn, increase labour productivity. In addition, improvement in the quality of labour in the form of better education, adequate skill sets and better health outcomes also contributes to labour productivity. The residual component TFP, is often considered similar to the Hicksian ‘technology’ parameter used in the neoclassical production function. Increases in TFP are considered to be equivalent to shifts in isoquants of production function (Syverson, 2011). TFP contribution to growth represents an increased efficiency in use of inputs, rather than an increased use of input themselves (Solow, 1956). Solow explained TFP as arising from disembodied, and exogenous technological shock. The subsequent theoretical development treated it as arising endogenously from improvement in human capital and productive public spending (Barro, 1990; Lucas, 1988; Romer, 1987). In addition to technological progress, TFP also includes the impact of various other changes in the economy such as government policy decisions, political shocks, the impact of technology on wage efficiency and even weather-related shocks (Bosworth and Collins, 2008). In contrast to the above, Schumpeterian growth theory relies on the notion of creative destruction in explaining the determinants of productivity growth. It emphasises the distance from technological frontier as a key driver of productivity growth (Aghion and Howitt, 2006). According to Aghion et al. (2014), economic growth in the Schumpeterian model, is generated by (i) innovations, (ii) entrepreneurial investments, motivated by the possibilities of monopoly rents, leading to innovations, and (iii) new innovations replacing the older ones through the process of creative destruction. The Schumpeterian production function is specified at the industry level, and the aggregate output is a simple sum of industry-specific outputs. In this model, innovations can interact with each other across sectors; innovations made in one industry could be implemented across other industries and laggard industries will try to fill the gap from frontier industries. With a suitable policy framework, the Schumpeterian model envisages the role of spillovers of innovations and catch-up by laggards in increasing aggregate productivity in the economy. Section III
Data and Stylised Facts The India KLEMS database is part of a global initiative to promote and facilitate analysis of growth and productivity patterns, based on a growth accounting framework. The India KLEMS project provides value-added based TFP growth and gross output based TFP growth for the period 1981-82 to 2016-17 at a disaggregated level across 27 industry groups. In line with the National Industrial Classification (NIC)2, the 27 industry groups include ‘agriculture, hunting, forestry and fishing’, ‘mining and quarrying’, the manufacturing sector comprising 13 industry groups, ‘electricity, gas and water supply’, ‘construction’ and the services sector comprising 10 industry groups. The KLEMS database was used to analyse productivity at the sectoral level – manufacturing and services – as well as at the level of 27 industry groups. Labour productivity measured as output of goods and services per worker, has increased sharply in India post-economic reforms in the last decade of the twentieth century. From an average growth of 2.0 per cent during the period 1981-82 to 1992-93, average labour productivity growth increased sharply to 3.9 per cent during 1993-94 to 2007-083. Chart 1 shows that the faster growth in labour productivity post-economic reforms was driven by higher contributions of capital deepening and TFP. Capital deepening is inclusive of the contribution from improvement in efficiency of the existing capital stock. During the period 2008-09 to 2016-17, average labour productivity growth further accelerated to 4.5 per cent from 3.9 per cent during 1993-94 to 2007-08, with higher contributions from capital deepening even as TFP growth decelerated. The deceleration in TFP was mainly due to a contraction in TFP in the post-financial crisis period 2008-09 to 2013-14 when TFP growth4 declined to -0.1 per cent. It rebounded to 2.6 per cent during 2014-15 to 2016-17. From 2008-09 to 2016-17, the contribution of capital deepening increased by 3.3 percentage points per annum compared with 2.5 percentage points per annum during 1993-94 to 2007-08. During this period, the growth of capital stock in the Indian economy has been faster than that in the 15-year period before the crisis while employment growth has slowed down. The contribution of labour quality has remained subdued throughout the period indicating that labour quality has not kept pace with the changing needs of the growing economy. Investment measured in terms of changes in capital stock showed a structural shift from 2002-03 onwards, when it started growing consistently, reaching its peak in 2007-08 and gross value added (GVA) growth also improved during this period (Chart 2). However, growth in capital stock during the period 2006-07 to 2014-15 was higher than that of GVA growth, reflecting a decline in capital efficiency. At the same time, employment growth decelerated, resulting in an improvement in capital deepening. Both capital stock and employment growth decelerated after 2014-15. With employment growth declining sharply and capital accumulation slowing down, TFP drove economic growth during 2015-16 and 2016-17. Improvement in TFP growth was visible across all the sectors. Section IV
Review of the Literature The empirical literature on productivity is vast encompassing methodology and sectoral analysis. Jorgenson and Griliches (1967) first distinguished between the different types of capital and labour inputs, thereby extending the interpretation of the Solow residual to ‘non-embodied’ technological change. Kuznets (1978) interpreted the Solow residual as exogenous technological innovation – a factor that would increase the marginal product of both labour and capital in the production process. Jorgenson et al. (2007) presented three alternative methods to construct economy-wide estimates of sources of growth. They asserted that the production possibility frontier, which recognises differences in output prices across industries, remains the most appropriate methodology for aggregating industry data. The studies in India have mostly focussed on aggregate productivity dynamics or looked at specific examples of firms, sectors or regions. Sector-specific studies include productivity in manufacturing (Kathuria, 2000), agriculture (Ghatak and Roy, 2007), banking (Fujii et al., 2014) and trade (Topolova and Khandelwal, 2011). Krishna et al. (2018) compared TFP rates for both informal and formal sectors in the Indian manufacturing sector (13 industries) using the India KLEMS database from 1980 to 2011. They found that within the formal manufacturing, ‘Coke and Refined Petroleum products’, ‘Food, Beverages and Tobacco products’, ‘Chemicals and Chemical products’ industries are large contributors to total TFP growth, while within informal manufacturing, increases in TFP are driven by ‘Textiles and Leather products’ and ‘Wood and Wood products’. Their results showed that TFP rates are much lower in informal manufacturing. Comparing the Domar aggregation method with the production possibility frontier (PPF) framework, they found that Domar aggregation results in lower levels of TFP growth for both the formal and informal manufacturing sectors. Das et al. (2014) analysed productivity growth in India during three periods: 1980-1989, 1992-1999, 2000-2011, classifying the traditional sectors (manufacturing, non-manufacturing and services) into high, medium and low intensity (manufacturing), market and non-market (services). They showed that market services have seen an improvement in TFP growth in the 2000s over that in 1990s with Post and Telecom, Textiles and Transport Equipment industries emerging as the best performers during the 2000s. Das et al. (2019) and Krishna et al. (2016a) found that capital deepening has been the major contributor to gains in labour productivity in India since 1980-81. Gains in overall labour productivity have largely accrued through market services. They also found the labour reallocation effect in India to be positive; and it has increased in the 2000s, suggesting a structural transformation which is growth-enhancing. Krishna et al. (2016b) compared the TFP growth rates for India and China from 1991 to 2012. Their results indicated that the services sector has registered a negative contribution to overall TFP, whereas manufacturing and construction sectors have seen positive contributions (except for the period 2004-2012) in the case of China. In contrast, aggregate TFP growth in India has seen a higher contribution from the services sector, while the manufacturing and construction sectors have exhibited lower TFP growth during multiple periods. Manufacturing TFP growth has been more stable compared to services TFP growth for China, while the opposite is true for India. They also noted that China’s service sector TFP growth was impacted more in the immediate aftermath of the global financial crisis than that of the service sector in India. Section V
Aggregation of TFP This section examines the various methodologies for aggregating industry-level TFP growth and the suitability of these methodologies for Indian productivity data. Aggregation of TFP for the entire economy as well as for the manufacturing and services sectors is critical for further analysis. The literature discusses three methods to aggregate TFP across industries based on Jorgenson et al. (2007): aggregate production function (PF) approach, aggregate production possibility frontier (PPF) approach and the Domar/direct approach. Of these three approaches, the PF approach is the most restrictive, imposing restrictions on both output and input aggregation. This approach assumes: -
There exists a value-added function for each industry which is a function of capital, labour and technology. -
This value-added function is identical across industries and hence it can be aggregated across industries. -
The functions that aggregate heterogeneous types of capital (tractors, computers, etc.) and labour (factory workers, bankers, etc.) are the same across industries. -
Each specific type of capital and labour receives the same price in each industry. Here, TFP is calculated as a residual after accounting for changes in labour and capital inputs from aggregate value-added. The aggregate PPF approach relaxes the second assumption of identical value-added functions across industries. By weighing each industry’s growth in value added by nominal price component, this approach captures the variability in output price for each industry. Growth in aggregate value added using PPF approach is given as: Domar/direct aggregation relaxes assumptions 2, 3 and 4, and only assumes the existence of a value-added function for each industry. This approach is a ‘bottom-up’ methodology – individual industry TFP growth rates are weighted by Domar weights7 to arrive at an aggregate TFP growth rate. Domar weights usually sum up to more than one, implying that aggregate productivity growth will be more than a simple average of industry TFP. TFP increase in intermediate industries has a double effect on aggregate TFP: a direct increase and an indirect increase in TFP of downstream industries through forward linkages and vice versa. TFP growth level for industry i and time t is given by the Translog production function: This weighted TFP term, however, assumes same marginal productivity in all industries, something that is unlikely to hold in the case of developing economies (Wu and Liang, 2018). To counter this fact, ‘labour reallocation’ and ‘capital reallocation’ effects are also calculated and reported along with the Domar weighted TFP measure to provide a more comprehensive measure of aggregate TFP. These terms capture the impact of movement of labour and capital from a relatively low productive to high productive industry (or vice versa) on aggregate productivity growth in the economy. In the Domar/direct aggregation method, TFP is calculated as a sum of Domar-weighted industry TFP plus capital and labour reallocation terms. By relaxing assumption 4, direct aggregation opens up the possibility of stickiness in movements of factor inputs. Using the three approaches, the TFP growth for manufacturing and services were aggregated. First, we focus on the PF and PPF approaches (where only assumption 2 is relaxed). PF and PPF approach provide almost identical measures for TFP growth for the manufacturing sector, while there is divergence8 in the aggregated TFP calculated for the services sector using these two approaches (Charts 3a and 3c). This suggests that assumption 2 of identical value added functions might be binding for services but not for manufacturing in India. By allowing for different value-added functions across different service industries, we get a higher estimate of aggregate services TFP. Further, comparing aggregate TFP for manufacturing and services using PPF and Domar approaches – where Domar involves relaxing assumptions 3 and 4 – which require that the functions to aggregate heterogeneous capital and labour are same and each specific type of capital and labour receives the same price in each industry, divergence was observed in the TFP growth estimates for manufacturing sector and minimal or no divergence for services. This divergence in PPF and Domar estimates for manufacturing is statistically significant9. This might suggest that input types and input markets are more heterogeneous for manufacturing than services and factor movements are relatively smoother in services. Analysing TFP growth estimates using these three approaches for the disaggregated services sector, we find divergence in PF and PPF estimates for market services10 (not statistically significant) but no divergence for non-market services. Further relaxing input market restrictions, we find divergence in TFP growth estimates for PPF and Domar approaches for both market (statistically significant at 5 per cent level) and non-market services (statistically significant at 1 per cent level) (Chart 4). This might suggest that while there is some evidence of homogeneity in value-added functions, assuming identical functions to aggregate heterogeneous inputs and same prices for heterogeneous inputs across industries is restrictive for all service industries – market and non-market. 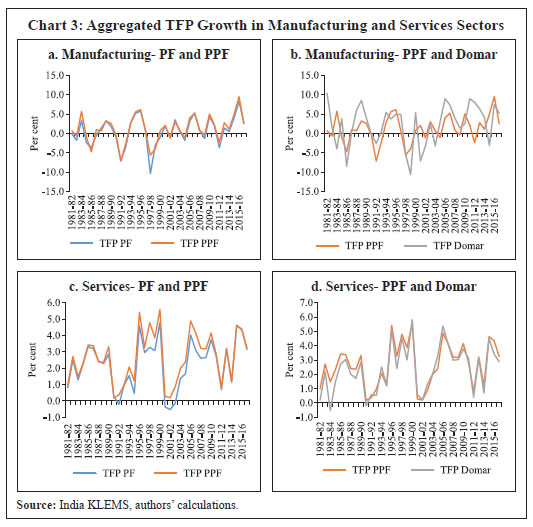 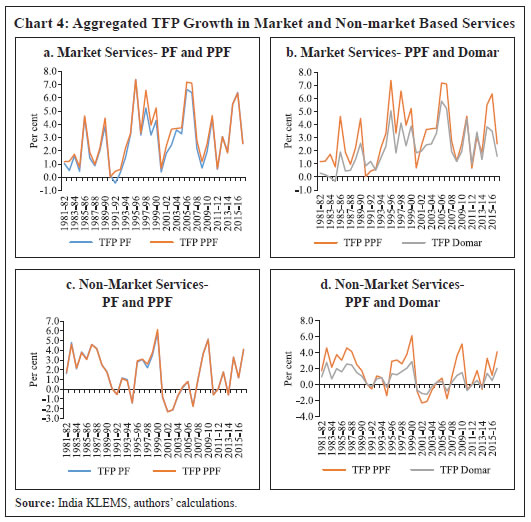 An analysis of labour and capital reallocation effects calculated using the Domar aggregation approach provides some interesting insights into the Indian economy. Charts 5a and 5b indicate that while there is a positive labour reallocation effect for the economy as a whole, such effect is negligible for the economy without agriculture. This may be explained by productivity boost due to labour moving out of agriculture to manufacturing and services, somewhat offset by the assimilation of labour into the construction sector, which remains negative contributor to aggregate productivity throughout the sample period. Also, while the capital reallocation effect is positive for both the economy as a whole and economy without agriculture, it is higher in case of the latter (Charts 5a and 5b). 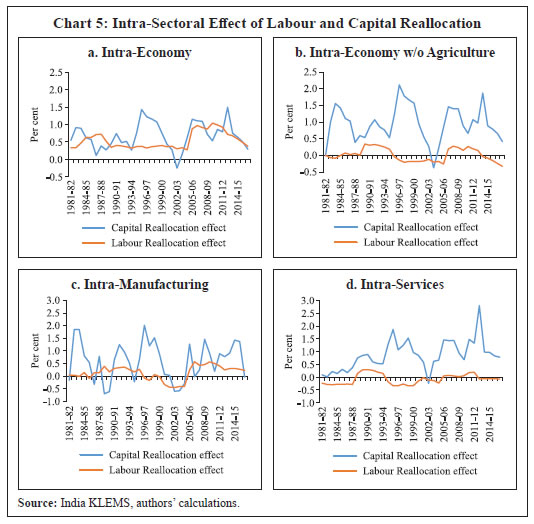 Comparing intra-sectoral reallocation effects within manufacturing and services, we find that productivity boost from reallocation of capital is higher in both manufacturing and services industries. While the capital reallocation effect is volatile within manufacturing, it was positive and growing at a robust pace within the services sector during 2002-03 to 2016-17. Charts 5c and 5d suggest that despite indication of heterogeneous inputs and inputs markets for manufacturing, labour reallocation was positive in this sector. On the other hand, there was a very limited labour reallocation effect in services, possibly reflecting the distinct nature of activities within the services sector. Section VI
Disaggregated Analysis Agriculture, Manufacturing and Services This section analyses the contribution of TFP to GVA growth for the three broad sectors of the economy - agriculture, manufacturing and services. Growth in value-added in the agricultural sector has largely been driven by TFP growth, reflecting the lower contribution of factor inputs in shaping agricultural performance. This also reflects the residual nature of TFP and hence may be reflective of role of factors like the monsoon, policy interventions and other shocks in the performance of Indian agriculture. Compared to agriculture, the gap in value-added growth and TFP contribution is marked for both manufacturing and services, reflecting the higher contribution of labour and capital inputs to valued-added in these two sectors. The gap between value-added growth and TFP growth has come down for manufacturing but increased marginally for services in the recent period 2008-09 to 2016-17. During this period, GVA growth slowed down for manufacturing, while TFP contribution grew at a faster pace than the earlier period. In the case of the services sector, both value-added growth and TFP growth for services increased in the recent period but increase in the growth of GVA was higher reflecting the higher contribution of factor inputs (Chart 6). Industry Groups Examining further the productivity growth across industry groups, an analytical exercise to understand both the leaders and draggers of aggregate TFP growth in the economy among the 27 industry groups is carried out. Harberger plots (first called as ‘sunrise diagrams’ by Harberger, 1997) which give a visual representation of the contribution of various sectors in overall TFP growth is used for the analysis. These plots visually demonstrate the difference in industry contributions to TFP growth in comparison to their share in overall GVA. This approach has been used by Krishna et al. (2017) to understand how widespread or localised productivity growth and changes in growth within the Indian economy are. Our results are broadly in line with their analysis for different time periods. We plot Harberger diagrams10 for two periods, i.e., 1993-94 to 2007-08 (Chart 7a) and 2008-09 to 2016-17 (Chart 7b). 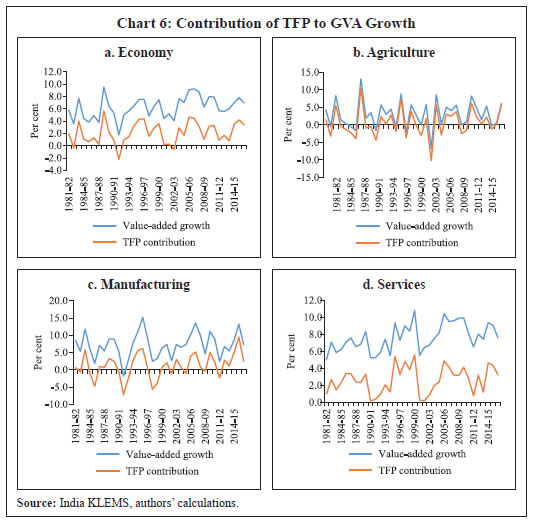 In the first period (Chart 7a), post and telecommunication, public administration and defence, transport and storage, and trade and financial services emerge as the leading industries in terms of their contribution to TFP growth. These industries, with 23.3 per cent share in GVA, contributed 90 basis points (bps) to the total TFP growth of 1.16 percentage points during this period. Telecom, financial services and public administration were among the first adopters of Information and Communications Technology (ICT) in the country, and these industries account for the majority of productivity gains in the period immediately after the economic reforms. 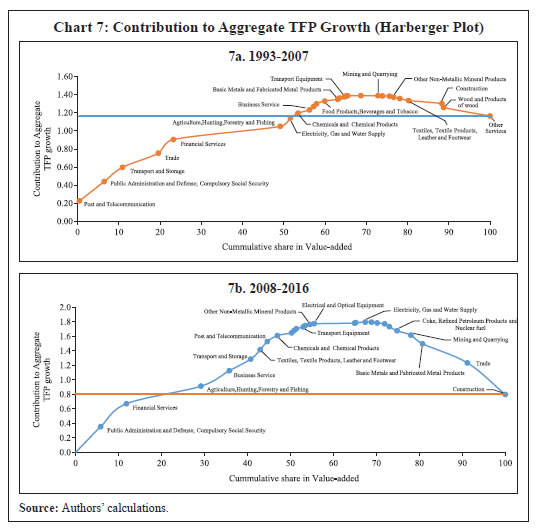 Industries, according to their ICT adoption, are usually classified in the literature into ICT-using and ICT-producing industries (Ark et al., 2003). In industrialised nations, ICT-producing sectors contribute higher to output, and also to productivity (both directly and as intermediate input to other industries). On the other hand, for developing countries, ICT-using (usually concentrated in services sector) have a higher contribution, given that most ICT-production occurs in advanced countries (Erumban and Das, 2016). In India, ICT adoption has occurred primarily in the services (i.e., ICT-using sectors), led by the financial services industry (Erumban and Das, 2016). Post and telecommunication, one of the earliest to produce and adopt IT/ICT technology contributed the highest to TFP growth in the initial part of the sample period of this paper. However, in the latter period, their share declined due to faster increase in other ICT using industries like business and financial services which adopted new technologies - with high levels of human capital and positive network externalities being the primary factors (Hall and Khan, 2003). Explaining productivity in public administration is relatively difficult since wages in this industry are administered and are not driven by the market. Hence, the ratio of output to input does not necessarily reflect productivity (Das et al., 2019). During the second period (Chart 7b), business services, among the second adopters of ICT, emerged as one of the new leaders in driving TFP growth and the contribution of financial services and public administration further increased. Agriculture with the largest share in value-added individually contributed relatively lesser to total TFP growth in both periods. Other than the leading industries mentioned above, there are some industries that consistently contributed to TFP growth like chemical and chemical products and transport and storage. On the other hand, the contribution of some industries like ‘basic metals and fabricated metal products’ and ‘electricity, gas and water supply’ have declined in the recent period (Table 1). The most noticeable decline in TFP contribution during the period 2008-09 to 2016-17 is seen in the trade and construction industries. These two industries have assimilated a large labour force that has moved out of agriculture, with construction emerging as more labour absorbing than trade in the recent years. Trade and construction together accounted for 43 per cent (17 per cent and 26 per cent, respectively) of total non-agricultural employment in 2016-17 (Chart 8). | Table 1: Industry Contribution to Aggregate TFP Growth | | (Percentage points) | | Industry | 1993-94 to 2007-08 | 2008-09 to 2016-17 | Difference in Contribution | | Business Service | 0.04 | 0.21 | 0.18 | | Financial Services | 0.15 | 0.32 | 0.17 | | Textiles, Textile Products, Leather and Footwear | -0.02 | 0.13 | 0.15 | | Public Administration and Defense; Compulsory Social Security | 0.21 | 0.36 | 0.14 | | Other services | -0.09 | 0.01 | 0.10 | | Agriculture, Hunting, Forestry and Fishing | 0.15 | 0.24 | 0.10 | | Wood and Products of wood | -0.04 | 0.01 | 0.05 | | Education | 0.00 | 0.04 | 0.04 | | Rubber and Plastic Products | 0.00 | 0.03 | 0.03 | | Chemicals and Chemical Products | 0.05 | 0.08 | 0.03 | | Other Non-Metallic Mineral Products | -0.01 | 0.02 | 0.03 | | Manufacturing, nec; recycling | 0.01 | 0.02 | 0.01 | | Health and Social Work | -0.01 | 0.00 | 0.01 | | Transport Equipment | 0.01 | 0.02 | 0.01 | | Pulp, Paper, Paper products, Printing and Publishing | 0.01 | 0.02 | 0.00 | | Transport and Storage | 0.16 | 0.16 | 0.00 | | Machinery, nec | 0.00 | -0.01 | -0.01 | | Electrical and Optical Equipment | 0.03 | 0.01 | -0.02 | | Food Products, Beverages and Tobacco | 0.03 | -0.01 | -0.04 | | Coke, Refined Petroleum Products and Nuclear fuel | 0.00 | -0.06 | -0.05 | | Mining and Quarrying | 0.00 | -0.06 | -0.06 | | Hotels and Restaurants | 0.04 | -0.04 | -0.07 | | Electricity, Gas and Water Supply | 0.09 | 0.01 | -0.09 | | Post and Telecommunication | 0.23 | 0.11 | -0.11 | | Basic Metals and Fabricated Metal Products | 0.02 | -0.12 | -0.14 | | Construction | -0.03 | -0.44 | -0.40 | | Trade | 0.16 | -0.26 | -0.42 | | Source: India KLEMS, authors’ calculations. | However, Chart 9 shows that, in the recent years, trade has witnessed substantial accumulation of capital and a significant reduction in labour force. Accordingly, the growth witnessed in the trade industry is attributed more to capital deepening than to contributions from labour or TFP. On the other hand, capital deepening in the construction industry has come to a complete standstill during 2008-09 to 2016-17 compared to the previous period. Also, without a commensurate increase in the contribution of labour, GVA growth has fallen in the construction industry during this period. Section VII
TFP Convergence and Spillover After analysing the dynamics of productivity in the three major sectors and 27 industry groups in the Indian economy, we check for convergence and spillover of TFP among industries. As discussed in the section on theory, this analysis draws from the Schumpeterian growth theory (Aghion and Howitt, 2006; Aghion et al., 2014). The methodology used to test convergence is similar to Morrow et al. (2010) and Inklaar (2016). The Schumpeterian model provides the theoretical foundation for analysing multisectoral convergence and spillover of TFP whereby innovations in one sector are built on the knowledge of the other sectors (Aghion et al., 2014). The knowledge spillover from the ICT industry to other industries is one such example of productivity spillover. Biatour et al. (2011), in the context of Belgium, found positive domestic inter- industry research and development (R&D) spillovers on TFP growth. With a view to look at convergence across industries, two methods are followed: i) k-means clustering11 and ii) panel regression. While the former checks only for convergence, the latter looks into convergence and spillover across industries. Under k-means clustering, 27 industry groups are divided into four clusters minimising total intra-cluster variance (Appendix Chart A.1), based on their average productivity growth in the two time periods 1993-94 to 2007-08 and 2008-09 to 2016-17. Post and telecommunication was an outlier with very high TFP growth in both the periods (not shown in Chart 10 as it is placed out of scale on the right top corner) and represented a cluster by itself. All the other industries were divided into three clusters shown in yellow, green and red colours in Chart 10. The horizontal axis measures average productivity growth in the period 1993-94 to 2007-08 while the vertical axis measures average productivity growth in the period 2008-09 to 2016-17.  Among the three clusters, the yellow cluster represents those industries whose average TFP growth was low in both the time periods. Industries whose average TFP growth has fallen significantly in the second period compared with the first period are represented by the red cluster, while the green cluster indicates those industries where TFP growth has risen significantly in the later period. It must be noted that both green and red clusters had almost equal average TFP growth in the first period. While the green cluster has taken off in the second period, the red cluster’s TFP growth has been depressed. ICT-using industries like financial services and business services form part of the green cluster. Further, out of 10 industries with lowest TFP levels in 2008-09, five form part of the green cluster while three belong to the yellow cluster. This provides the initial motivation for examining convergence as industries lagging behind with low levels of productivity in the first period experienced faster TFP growth in the second period. This convergence is later tested empirically with a panel regression. To calculate TFP levels, we make use of the concept of ‘relative TFP’ as mentioned in Inklaar (2016). TFP for a given industry is calculated relative to the overall economy, treating it as a benchmark. For a given year, the TFP level for industry i is given as follows – In order to empirically check the convergence and spillover hypothesis, a panel regression across industries is estimated in the form of following specification given by European Commission (2014). The methodology to test convergence is similar to Morrow et al. (2010) and Inklaar (2016).  In this specification, TFPgap captures the impact of the convergence channel between the leading industry and other industries. A larger negative value of TFPgapi implies a wider gap between the industry i and the frontier and hence larger potential gain for laggard industry by adopting enhanced technology and advanced managerial practices. On the other hand, TFPmax captures spillover effects from the leading industry. Our results show that the channels of convergence and spillover are contributing to total factor productivity growth in India. The negative sign of TFPgap coefficient suggests that industries far away from the frontier are growing faster which also supports the results of cluster analysis. A positive sign of TFPmax coefficient suggests the existence of spillover of TFP from leading industry to others (Table 2). Further, coefficient of TFPgap has the highest value in the last period which supports the potential of higher TFP growth by assimilating improved technologies and managerial practices by the laggard industries. The spillover effect was significant all through the sample period, with fastest spillover witnessed in the period (2009-10 to 2016-17)12, when financial services emerged as the industry with the highest level of TFP. | Table 2: Industrial Convergence and Spillover of TFP | | Variable | 1981-2016 | 1981-1992 | 1993-2007 | 2009-2016 | | 1 | 2 | 3 | 4 | | TFPGap | -0.05* | -0.27*** | -0.07* | -0.43*** | | | (0.023) | (0.063) | (0.038) | (0.107) | | TFPmax | 0.14** | 0.37*** | -0.85* | 2.76*** | | | (0.619) | (0.111) | (0.492) | (0.577) | | Constant | -0.07** | -0.39*** | -0.10** | -0.57*** | | | (0.282) | (0.091) | (0.046) | (0.136) | | Year fixed effects | Yes | Yes | Yes | Yes | | Observations | 972 | 324 | 405 | 216 | | R-squared | 0.08 | 0.24 | 0.07 | 0.29 | | Number of Industry | 27 | 27 | 27 | 27 | Note: Robust standard errors in parentheses. *** p<0.01, ** p<0.05, * p<0.1
Source: Authors’ calculations. | A similar analysis is done separately for the manufacturing and services sectors. Both manufacturing and services shows presence of convergence and spillover channels (Appendix Table A.1). Section VIII
Conclusion This paper analysed the trends and dynamics of productivity in India during the period 1981-82 to 2016-17. After examining the usefulness and suitability of three aggregation approaches for manufacturing and services in the Indian context, we identify the industries that have been driving productivity growth in India during the last three decades. The findings of the paper suggest that the industries which have adopted ICT were the key drivers of overall aggregate productivity. The paper also found evidence that the channels of convergence and spillover are contributing to the TFP growth in India. Furthermore, the convergence and spillover analysis showed that productivity in India has a high potential to grow at faster rates as there is a wide gap in TFP across industries. The industries lagging behind can benefit from other industries by adopting better technologies and managerial strategies. This is particularly important for the services sector, which has emerged as the growth driver of the Indian economy. At the same time, the contribution of TFP to services sector growth is lower than other sectors, reflecting that the sector is yet to reach its potential. Analysis of factor reallocations calls for an enabling environment for free movement of labour and capital across sectors. The government can boost productivity through pro-active regulations that can facilitate labour and capital reallocation and enable spillover effects from leading industries to the laggards.
References Adler, G., Duval, R., Furceri, D., Celik, S., Koloskova, K., & Poplawski-Ribeiro, M. (2017). Gone with the headwinds: Global productivity. IMF Staff Discussion Note (SDN/17/14). Aghion, P., & Howitt, P. (2006). Joseph Schumpeter Lecture Appropriate Growth Policy: A Unifying Framework. Journal of the European Economic Association, 4(2-3), 269-314. Aghion, P., Akcigit, U., & Howitt, P. (2014). What do we learn from Schumpeterian growth theory? In P. Aghion, & S. N. Durlauf (Eds.), Handbook of economic growth (Vol. 2, pp. 515-563). Ark, B. v., Inklaar, R., & McGuckin, R. H. (2003). The contribution of ICT-producing and ICT-using industries to productivity growth: A comparison of Canada, Europe and the United States. International Productivity Monitor, 6, 56-63. Barro, R. J. (1990). Government spending in a simple model of endogeneous growth. Journal of Political Economy, 98, 103-125. Biatour, B., Dumont, M., & Kegels, C. (2011). The determinants of industry-level total factor productivity in Belgium. Federal Planning Bureau Working Paper 7-11. Bosworth, B., & Collins, S. (2008). Accounting for growth: Comparing India and China. Journal of Economic Perspectives, 22(1), 45-66. Das, D. K., Erumban, A. A., Aggarwal, S., & Sengupta, S. (2014). Productivity Growth in India under Different Policy regimes: 1980-2012. Presentation at 3rd World KLEMS Conference, May 19-20. Tokyo, Japan. Das, D. K., Aggarwal, S. C., Erumban, A. A., & Das, P. C. (2019). What is new about India’s economic growth? An industry level productivity prospective. Indian Growth and Development Review, 13(1). Dearden, L., Reed, H., & Van Reeen, J. (2006). The impact of training on productivity and Wages: Evidence from British panel data. Oxford Bulletin of Economics and Statistics, 68(4), 397-421. Easterly, W., & Levine, R. (2000). It’s not factor accumulation: Stylised facts and growth models. Washington, DC: World Bank. Erumban, A. A., & Das, D. K. (2014). Role of capital in India’s economic growth: Capital stock versus capital services. Paper prepared for the IARIW 33rd General Conference, August 24-30. Rotterdam, The Netherlands. Erumban, A. A., & Das, D. K. (2016). Information and Communication Technology and Economic Growth in India. Telecommunications Policy, 40(5), 412-431. European Central Bank (ECB). (2007). Sectoral patterns of total factor productivity growth in the euro area countries. European Central Bank Monthly Bulletin, October 2007, 57-61. https://www.ecb.europa.eu/pub/economic-bulletin/mb/html/index.en.html European Commission. (2014). The drivers of total factor productivity in catching-up economies. Quarterly Report on the Euro Area, 13(1), 7-19. Fujii, H., Managi, S., & Matousek, R. (2014). Indian bank efficiency and productivity changes with undersirable outputs: A disaggregated approach. Journal of Banking and Finance, 38, 41-50. Ghatak, M., & Roy, S. (2007). Land reform and agricultural productivity in India: A review of the evidence. Oxford Review of Economic Policy, 23(2), 251-269. Hall, B., & Khan, B. (2003). Adoption of New Technology. In D. C. Jones, New Economy Handbook (pp. 1-19). Amsterdam: Elsevier Science. Harberger, A. (1997). Studing the Growth Process: A Primer. Paper prepared for Conference on Capital Formation and Economic Growth. The Hoover Institution, Stanford University. India KLEMS database. (2019). Version 5. Available at https://www.rbi.org.in/Scripts/KLEMS.aspx Inklaar, R. (2016). Searching for convergence and its causes: An industry perspective. In D. W. Jorgenson, K. Fukao, & M. P. Timmer, The world economy: Growth or stagnation? (pp. 508-234). Cambridge: Cambridge University Press. Jorgenson, D., & Griliches, A. (1967). The explanation of productivity change. Review of Economic Studies, 34(99), 249-280. Jorgenson, D., Ho, M., Samuels, J., & Strioh, K. (2007). Industry Origins of American Productivity Resurgence. Economic Systems Research, 19(3), 229-252. Kathuria, V. (2000). Productivity spillovers from technology transfer to Indian manufacturing firms. Journal of International Development, 12(3), 343-369. Krishna, K. L., Das, D. K., Erumban, A., Aggarwal, S., & Das, P. (2016a). Productivity Dynamics in India’s Service Sector: An Industry-Level Perspective. Working Paper No. 216, Center for Development Economics, Delhi School of Economics. Krishna, K. L., Wu, H. X., Das, D. K., & Das, P. C. (2016b). How do Asian Giants China and India compare on Growth and Productivity? 4th World KLEMS Conference, May 23-24. Madrid, Spain. Krishna, K. L., Erumban, A. A., Das, D. K., Aggarwal, S., & Das, P. C. (2017). Industry Origins of Economic Growth and Structural. Working Paper No. 273, Center for Development Economics, Delhi School of Economics. Krishna, K. L., Goldar, B., Aggarwal, S. C., Das, D. K., Erumban, A. A., & Das, P. C. (2018). Productivity growth and levels: A comparison of formal and informal manufacturing in India. Working Paper No. 291, Center for Development Economics, Delhi School of Economics. Krugman, P. (1997). The age of diminished expectations: US economic policy in the 1990s. Cambridge, MA. MIT Press. Kumar, R., & Soumya, A. (2010). Fiscal policy issues for India after the global financial crisis (2008-2010). Asian Development Bank Institute Working Paper 249. Kuznets, S. (1978). Technological innovations and economic growth. In P. Kelly, & M. Kanzberg (Eds.), Technological innovation: A critical review of current knowledge (pp. 335-356). San Francisco: San Fancisco Press. Lucas, R. E. (1988). On the mechanics of economic development. Journal of Monetary Economics, 3-42. Morrow, K. M., Röger, W., & Turrini, A. (2010). Determinants of TFP growth: A close look at industries driving the EU-US TFP gap. Structural Change and Economic Dynamics, 21, 165-180. Organisation for Co-operation and Development (OECD). (2001). Measuring productivity: OECD manual. Paris: OECD. Reserve Bank of India (RBI). (2019). Annual report 2018-19, Reserve Bank of India, Mumbai. https://rbidocs.rbi.org.in/rdocs/AnnualReport/PDFs/0ANNUALREPORT2018193CB8CB2D3DEE4EFA8D6F0F6BD624CEDE.PDF Romer, P. M. (1987). Growth based on increasing returns due to specialization. The American Economic Review, 77(2), 56-62. Sargent, T., & Rodriguez, E. (2000). Labour or Total Factor Productivity: do we need to choose? International Productivity Monitor, 1, 41-44. Solow, R. (1956). A contribution to the theory of economic growth. Quarterly Journal of Economics, 70(1), 65-94. Syverson, C. (2011). What determines productivity? Journal of Economic Literature, 49(2), 329-365. Topolova, P., & Khandelwal, A. (2011). Trade liberalization and firm productivity: The case of India. Review of Economics and Statistics, 99(3), 995-1009. Wu, H. X., & Liang, D. T. (2018). Accounting for the role of information and communication technology in China’s productivity growth. In Deb Kusum Das (Ed.), Productivity dynamics in emerging and industrialzed countries (pp. 331-362). London, UK. Routledge.
Appendix Average productivity growth in the two time periods- 1993-2007 and 2008-16 is used to cluster 27 industries. Elbow chart to select value of k while minimising WCSS (within-cluster sum of squares) is shown below. Table A.1: Convergence Regressions 1) Manufacturing | Variable | 1981-2016 | 1981-1992 | 1993-2007 | 2008-2016 | | (1) | (2) | (3) | (4) | | TFPGap | -0.105*** | -0.339*** | 0.133*** | -0.593*** | | | (0.021) | (0.103) | (0.030) | (0.090) | | TFPmax | 0.370** | 0.375** | 1.274*** | 5.375*** | | | (0.124) | (0.169) | (0.272) | (1.374) | | Constant | -0.075*** | -0.519*** | 0.227*** | -0.315*** | | | (0.017) | (0.160) | (0.060) | (0.063) | | Observations | 468 | 156 | 195 | 117 | | R-squared | 0.177 | 0.305 | 0.187 | 0.370 | | Number of Industry | 13 | 13 | 13 | 13 | | Year FE | YES | YES | YES | YES | | Note: Robust standard errors in parentheses. *** p<0.01, ** p<0.05, * p<0.1 | 2) Services Sector | Variable | 1981-2016 | 1981-1992 | 1993-2007 | 2008-2016 | | (1) | (2) | (3) | (4) | | TFPGap | 0.021*** | -0.103 | 0.090*** | -0.285*** | | | (0.005) | (0.084) | (0.027) | (0.056) | | TFPmax | 2.405** | 1.924 | 0.487 | 2.198*** | | | (0.969) | (1.241) | (0.483) | (0.484) | | Constant | -0.008 | -0.088 | 0.018 | -0.331*** | | | (0.013) | (0.054) | (0.031) | (0.071) | | Observations | 360 | 120 | 150 | 90 | | R-squared | 0.203 | 0.406 | 0.283 | 0.525 | | Number of Industry | 10 | 10 | 10 | 10 | | Year FE | YES | YES | YES | YES | | Note: Robust standard errors in parentheses. *** p<0.01, ** p<0.05, * p<0.1 |
|