Ranajoy Guha Neogi and Harendra Behera* Received on: May 30, 2020
Accepted on: December 15, 2020 This paper examines the role of regulatory bank capital in influencing credit flows and GDP growth. Using a theoretical model and empirical estimates from a sign restricted vector autoregression (VAR) model, it provides evidence of a positive effect of bank capital on credit supply and output growth. Higher capital tends to lower risk premium and overall cost of liabilities of banks, while enhancing their capacity to undertake risky lending. Regulatory capital to risk weighted assets ratio (CRAR) is also found to work like a macro-prudential tool as a higher CRAR triggers loan portfolio reallocation in banks away from unsecured high risk loan towards secured and low risk loans. JEL Classification: E43, E44, E50, E58 Keywords: Bank capital, Basel III, financial stability, leverage, CRAR, sign-restricted VAR, Bayesian estimates Introduction The role of regulatory bank capital gained prominence in the Indian context from the days of the Basel Accord. Research on the role of adequate bank capital in ensuring financial stability and mitigating losses from future crises has gained further traction at a global level in the post-subprime crisis period. Our focus in this paper is on the macro-financial implications of increased regulatory capital requirements. The net marginal benefit of bank capital can be assessed by determining the benefits of bank capital due to reduced crisis probability and the output loss because of higher capital maintenance by banks. In Cline (2016, 2017) and BCBS (2019), the positive effect of higher capital adequacy is defined in terms of reduced expected loss from crisis and the negative effect is in terms of output loss (drag). If k is capital adequacy, net marginal benefit (k) = reduced crisis probability (k) x crisis cost – output drag (lending spread (k)). We examine the macroeconomic implications by revisiting the theory and empirics, with a focus on the output (drag) effects of regulatory capital. Despite the potential benefits of higher bank capital, greater equity financing raises banks’ weighted average cost of capital (WACC) (BCBS, 2010; 2019; Birn et al. 2020). This leads to a rise in the interest rate spread and therefore clogs credit supply to the non-financial firms. Due to imperfect substitutability between bank credit and other forms of credit under asymmetric information in the market, this further results in subdued investment and lowers economic growth. Heightened capital adequacy1 supposedly entails cost in terms of loss in GDP growth due to costlier bank credit. On the other hand, going by the Modigliani-Miller (MM) theorem2, equity financing may not increase the cost of lending as it does not matter whether the bank finances its lending by issuing equity or borrowing in the form of debt. Therefore, a rise in capital adequacy is costless to ensure a safer balance sheet (of the banks) under perfect realisation of the Modigliani-Miller theorem. This is because the rise in cost of equity, due to higher capital adequacy, exactly balances out by the fall in funding cost, leading to no additional net cost to the banks and hence no adverse impact on the economy. However, the MM theorem seldom holds (at least fully) in reality. Thus, based on the extant studies, BCBS (2010) considers zero Modigliani-Miller offset (MM offset, henceforth).3 Also, BCBS (2019) in their updated survey, on the basis of latest findings from a number of recent articles, concluded that the cost of equity could fall by around fifty per cent of what MM theorem may suggest. Thus, all the existing literature covered in BCBS studies generally concludes that the funding cost of banks rises, with negative implications for economic growth of varied extent depending upon the degree of fall in the cost of equity. Gambacorta and Shin (2018) and Muduli and Behera (2020), however, showed that higher capital adequacy raises credit supply of the banks. Gambacorta and Shin (2018) found a steep fall in the cost of funds for better capitalised banks, due to their sounder balance sheets. They attributed this finding to the possibility of a larger MM offset due to falling cost of debt financing. Thus, sounder financial health along with a fall in cost of funds could lead to a rise in loan supply as against BCBS (2019)’s finding of a reduction in credit supply by banks due to rise in lending spread. Our aim in this paper is to theoretically analyse and empirically examine the impact of increased regulation-induced higher capital position of banks on credit flows under partial MM offset. As against the perceived notion of bank equity financing to be costlier and therefore could lead to dampen the loan growth and economic output, we examine whether higher CRAR could lead to higher growth in loan supply and thereby higher economic growth. To study this hypothesis, we first theoretically show the possibility of reduction in WACC of the banks due to lower leverage, with higher CRAR, contributing to higher flow of bank credit and resultant rise in GDP growth. In the empirical analysis, we find that a positive bank capital shock (i.e., higher capital adequacy) can push the GDP growth up and reduce risky lending. We use an aggregate measure of CRAR (a weighted average of bank level CRARs) to capture the effects of regulatory change on system level bank capital as a whole. We also verify the robustness of the results by treating a different version of aggregate CRAR series, based on median of bank level CRARs. The subsequent sections are organised as follows. Section II summarises the bank capital environment in India and Section III discusses the literature review. Section IV provides a theoretical exposition, Section V explains the data and the estimation methodology while Section VI discusses empirical results, and Section VII concludes the paper. Section II
Bank Capital Environment in India The Basel framework evolved over time since the introduction of Basel I norms in 1988 and thus necessitated banks to maintain capital as a percentage of their credit risk exposures. Subsequently, the risk coverage of the capital framework was expanded to include other risks on the banks’ balance sheet such as market risk and operational risk. In the post global financial crisis (GFC) period, systemic risk as a separate category also gained traction to address the risk of financial contagion. Clearly, credit risk has drawn the highest attention as an increase in defaults can abruptly lead to illiquidity and insolvency problems. Over time, the RBI has broadly moved as per the evolving frameworks of the BCBS to ensure financial stability. Capital regulation under Basel-III was further strengthened to increase the quantity and quality of capital, enhance the risk coverage and introduce macro prudential elements such as leverage ratio, countercyclical buffers and liquidity ratios. As against the international norms of 8 per cent CRAR, the Reserve Bank has stipulated banks in India to maintain a higher minimum CRAR of 9 per cent, in addition to capital conservation buffer (CCB) of 2.5 per cent and counter-cyclical capital buffer. Banks in India had to maintain CCB of 2.5 per cent by March 31, 2019 in tranches of 0.625 percentage points, which was deferred to March 31, 2020. Considering the potential stress on account of COVID-19, the Reserve Bank further deferred the implementation of the last tranche of 0.625 per cent of the CCB from March 31, 2020 to September 30, 2020 and subsequently to April 01, 2021. It has been further deferred to October 1, 2021. India being a bank dominated economy, capital regulation has a major role to ensure financial stability. Due to the rise in stressed assets of banks in India, maintaining capital adequacy becomes critical. As discussed earlier and found by Muduli and Behera (2020), an increase in CRAR is expected to raise economic growth by enhancing credit supply. It is argued that higher CRAR, by improving the financial health of banks, reduces their cost of borrowing, which in turn helps them to supply more loans at a cheaper price. The median cost of borrowings of banks are plotted against the median values of bank level CRARs for the period 2004-05 to 2018-19 (Chart 1). The chart shows that the cost of borrowing declines with rise in capital of banks in India. Similarly, lending rate of banks is also found to be lower for banks with higher capital ratios. The sensitivity of borrowing cost to CRAR is found to be greater than sensitivity of lending rate to CRAR as evident from a steeper trend line for the former. Thus, an increase in the capital position of banks help them to not only access funds at cheaper costs but also increase credit as they reduce their lending rate. 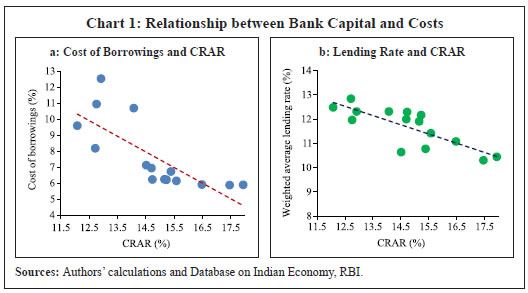 At the aggregate level, non-food bank credit growth has decelerated, despite the increase in capital ratio (Chart 2). In the Indian context, Muduli and Behera (2020) reported that elevated level of gross non-performing assets (GNPA) has impacted the credit growth of banks negatively while high CRAR has contributed positively. A statistically significant and negative correlation coefficient (-0.50) between credit growth and GNPA ratio clearly indicates that credit supply of banks is constrained due to high stressed assets in recent years. As large volume of literature has documented that a rise in capital requirement could lead to lower credit growth, one may argue that the lower credit growth in India is also because of increase in regulatory capital requirements. As a counter view, it is important to explore whether the rise in CRAR has any positive effect on credit growth, as found in a few studies. 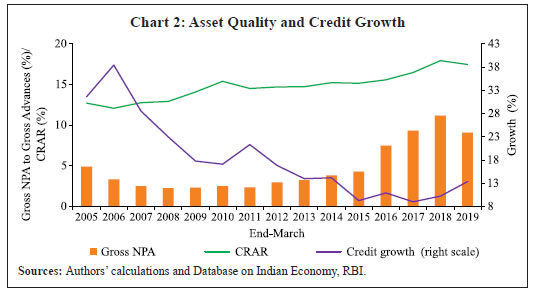 In the next section, we review the literature to provide an overview of the microeconomic as well as macroeconomic consequences of bank capital regulation, the methodological limitations in separating bank capital shock from other shocks and the empirical findings on the effects of this shock. Section III
Review of Literature The literature on bank capital shock posits that an exogenous rise in regulatory capital requirement causes a fall in credit supply. This is because the rise in capital requirement leads banks to rebalance their portfolio towards secured assets as they gradually increase their capital levels. On the contrary, the ‘microprudential’ literature dealing with bank level data finds a strong positive effect on credit supply from a rise in equity component in bank’s balance sheet (Catalán et al. 2017; Gambacorta and Shin 2018; Cantú et al. 2019; Muduli and Behera, 2020). Although cost of equity is generally more than the cost of debt funding, increase in equity significantly reduces the average cost of equity due to fall in risk premium. The overall cost of debt-financing also falls due to an improvement in creditworthiness, which along with a fall in average cost of equity leads to a reduction in the overall cost of finance, as a major portion of bank liabilities are in the form of deposits or debts. The profitability of banks possibly rises from falling spread as banks’ credit supply is observed to shoot up with increased CRAR (RBI, 2019). The observed CRAR induced positive credit supply shock consequently should lead to higher growth in GDP. Some studies, using both microprudential approach and macroprudential approach, find that the impact of a rise in capital requirement on bank lending is negative but short-lived (Fang et al. 2018; Budnik et al. 2019); the effect depends on the distribution of capital across banks in the financial system (Catalán et al. 2017); and, on the state of the business cycle (Bedayo et al. 2018). The effect of change in economy-wide bank capital in the macroeconomic context is categorised in BCBS (2019) from the benefit-side (reducing probability of crisis and hence the cost of the crisis) and the cost-side (output drag due to the rise in lending spread originating from the rise in the WACC of banks due to shift towards costlier equity financing). The effect on the cost side of higher bank capital is the loss of output, grounded on the assumption of a partial MM offset. Full MM offset refers to the fall in the unit cost of equity with the rise in capitalisation (due to fall in the underlying risk of leverage causing cost of equity to fall) which exactly balances out the increase in the average cost of capital due to shift to greater equity financing. The full MM offset makes the bank capital regulation costless. BCBS (2019) and its surveyed papers point out that MM offset does not hold true, at least fully, resulting in macroeconomic costs in terms of output loss. BCBS (2019) concludes that MM offset is somewhere between 30 to 60 per cent. This wide agreement in the literature on the cost of higher capital is solely based on fall in equity prices, where the cost of debt is taken as invariant to changes in leverage. For example, Miles et al. (2013), Angelini et al. (2015) and Cline (2016, 2017) estimate the loss in GDP due to higher bank capital. We revisit this in the subsequent sections to check if WACC indeed falls due to reduction in cost of debt that depends on underlying leverage as against the perceived notion of cost of debt financing as risk-free or completely inelastic to leverage in most studies. Bank capital itself is endogenous and it can also have effects on the macro-financial variables. Therefore, bank capital for individual banks and any aggregate measure of the same used to comprehend the role of regulatory capital requirements can be susceptible to endogeneity problem, which complicates its proper estimation and the analysis of regulatory changes. Therefore, separation of exogenous bank capital shock from other shocks is important to know the true effects of regulatory bank capitalisation. In the literature, many researchers have isolated shocks to bank capital from losses due to bursting of the housing market bubble or stock market collapse (Bernanke and Lown, 1991; Hancock et al. 1995; Peek and Rosengren, 1997; Watanabe, 2007; Mora and Logan, 2012; Liu and Molise, 2019); a few researchers separated regulatory shocks to bank capital as bank-level shock from system-wide shock (Peek and Rosengren, 1995; Woo, 2003; Francis and Osborne, 2009; Aiyar et al. 2012; Bridges et al. 2014; Jimenez et al. 2017; Mesonnier and Monks, 2015; Maurin and Toivanen, 2012). The above literature faces the criticism of unaddressed endogeneity problem. This is because regulatory capital also responds to changes in macro-financial variables. For example, Mahakud and Dash (2013) find a counter-cyclical behaviour of capital buffer in response to a change in business cycle in the Indian context. As most of the studies in these categories use single equation framework, they are prone to the possibility of undetected endogeneity. However, several recent studies in later stage used time-series models, viz., structural vector autoregression (SVAR) models to addresses the endogeneity issue (Lown and Morgan, 2006; Berrospide and Edge, 2010; Noss and Toffano, 2014; Meeks, 2017; Gross et al. 2016; Kanngiesser et al. 2017). In this type of literature, the dynamic interactions across asset classes and between the macro-financial variables are captured, and the capital adequacy ratio is introduced as a variable to account for exogenous bank capital shock. Kanngiesser et al. (2017) aptly categorises the literature on the effect of bank capital on macro-financial variables based on the mechanism used to weed out the endogeneity issue. In a similar fashion, Gerali et al. (2010) develops a DSGE model with financial frictions and imperfectly competitive banks and showed that a negative credit supply shock reduces bank capital to which banks react by increasing interest rates that subsequently reduces loan demand and hence consumption and investment. In the Indian context, there are only a few studies that examine the effects of bank capital shock. Ghosh and Das (2005) point out in the Indian context that higher capital adequacy significantly brings down the borrowing cost of the banks. Similarly, in a related study, Das and Ghosh (2006) shows that the financially sound banks are more efficient and have less non-performing loans; Ghosh (2008) and Nachane et al. (2006) found that the effectiveness of monetary policy to influence lending depends on the capital position of banks. A more direct approach to study the implications of bank capital (RBI, 2019) shows that higher bank capital raises credit supply. Using bank level data for the period 2008-18, Verma and Herwardkar (2019) shows that the relationship between bank capital and credit growth is positive and non-linear. Muduli and Behera (2020) found that higher equity to total asset ratio reduces the cost of funding and thereby increases credit supply. These findings are similar to the evidences provided by Gambacorta et al. (2018) and Bridges et al. (2014) who showed that the cost of external financing of bank’s borrowing reduces with increases in their capital adequacy, which in turn increases credit supply. The underlying cause of fall in average cost of borrowing by banks is the improvement in their creditworthiness, led by enhanced equity component in their liabilities. This leads to a reduction in risk premium on debt (due to fall in leverage) and stronger balance sheets provides confidence to the shareholders to subscribe to the equity even at higher prices. In addition to this, banks being largely dependent on deposits and certificate of deposits, a small fall in borrowing cost due to the fall in risk premium can substantially reduce the average borrowing costs. To sum up the findings from the literature, the bank capital shock can have beneficial effects; however, the isolation of bank capital shock from other shocks is important to observe this effect. A CRAR shock, to the aggregate measure of CRAR, in a VAR framework can mimic an exogenous change in the regulatory capital requirements. The change in regulatory capital requirement acts through the change in credit supply that affects the real economy. Novelty lies in identifying it from the shock emanating from the change in regulatory CRAR. It helps to pinpoint the source of the shock to discover its policy implications. Section IV
Theoretical Exposition Gambacorta et al. (2018) observe the effect of falling cost of debt-financing in banks, especially due to falling cost of certificate of deposits, etc., under greater capitalisation since it signals deeper financial soundness at the bank level. However, Cline (2016, 2017) found evidence of partial MM offset of about 45 per cent. Hence, greater equity-financing cannot be a free lunch for the banks under any situation as it surely raises the WACC to some extent, which dents the profitability of the bank, raises spread, chokes credit supply from banks and consequently impacts output growth adversely. We depart from the framework of Cline (2016, 2017) by including dependence of cost of debt financing on the underlying leverage of the bank and show that even with zero MM offset, there can be a fall in the average cost of capital from increased equity financing if the sensitivity of cost of debt to leverage is very high. The share of equity financing is defined as, And the debt to equity ratio as, It follows from the MM Theorem that for a given class of firms (the banking sector in our case), the return on equity is 4, Due to the observed partial MM offset (as concluded in Birn et al., 2020; Cline, 2016; 2017), we define: 
 Gambacorta et al. (2018) and Muduli and Behera (2020) have shown that the fall in the leverage or higher capitalisation can significantly bring down the cost of debt financing of the banks. Indeed, Modigliani and Miller (1958) had conjectured as an extension of the benchmark model in their seminal paper that the bond yield curve for the given class of firms is likely to depend on the underlying leverage of the firm. In Birn et al. (2020) and the related literature this channel is not factored in the calculation of the average cost of bank capital. Miles et al. (2013) termed the assumption of the cost of debt-financing being invariant to leverage as the “conservative assumption” and a similar approach was also followed by Cline (2016; 2017). However, this stands in contrast to the conjecture of Modigliani and Miller (1958) about the importance of the linkage between debt-financing cost and the leverage. Thus, the role of the cost of debt financing might not be trivial. As the cost-benefit analysis of bank capital takes the effect of rising WACC of the banks due to costlier equity financing as the channel leading to fall in GDP, we should ensure if the implications hold true if the cost of debt is taken as sensitive to leverage. Therefore, we introduce cost of debt as a function of equity to total assets ratio, in line with the observations by Modigliani and Miller (1958). Hence,  Now, following Cline (2016; 2107) framework factoring in the cost of debt being a function of equity to total assets ratio, it follows from (6), Clearly (8) is similar to Cline (2016; 2017) except the last term that comes due to the dependence of cost of debt on the equity to total asset ratio. Now, the change in the weighted average cost to capital is as follows from (1), Substituting, (9), in the framework of CES production function as in Miles et al. (2013), it readily follows that5, Thus, it follows that: Proposition 1: No Free Lunch Under partial MM offset, (with cost of debt being risk free or perfectly independent of leverage) i.Higher capitalisation raises WACC ii. Higher capitalisation reduces GDP growth (due to higher WACC of banks affecting firms dependent on bank credit). This implies that in a bank level study, with higher capitalisation, the WACC shall always rise and the credit supply from the banks fall. This subdued and costlier credit supply brings down the GDP as the cost of production rises for the non-financial firms. The above finding is in sharp contrast to the bank level evidence provided by Gambacorta et al. (2018). They find a strong positive relationship between underlying leverage of the bank and the debt-financing cost. Proposition 2: Hypothetical Free Lunch i.Higher capitalisation reduces WACC ii. Higher capitalisation raises GDP growth The channel of bank capital shocks is provided in the flow chart below. The chart exhibits that the overbearing presence of debt being the main component of liabilities of the bank, an increase in the equity component can have a significant fall in the cost of debt financing for the under-capitalised bank and brings down overall cost of funding and increases availability of funds, which subsequently augments the bank’s profitability as the scale effect of the fall in the cost of debt outweighs the rise in cost due to increase in equity financing which possibly reduces WACC even under partial MM offset, reduces spread, and augments credit supply. Thus, hypothetically an exogenous rise in regulatory capital translates into a positive credit supply shock over a certain range. Section V
Data and Methodology V.1 Data For empirical estimation, we use quarterly data of the relevant macro-financial variables for the period 2009-10:Q1 to 2017-18:Q4. The variables used are real GDP, consumer price index (CPI), policy repo rate, real non-food bank credit (RNFBC, henceforth), spread (calculated by taking the difference between weighted average lending rate and repo rate), and CRAR. The RNFBC is derived by deflating nominal non-food bank credit with CPI. Real GDP, CPI and non-food bank credit are transformed into seasonally adjusted annualised growth form while repo rate is expressed in first difference form. The aggregated CRAR is calculated by taking the weighted average of bank level CRARs wherein the weights are based on their advances. We also use median of the bank level CRARs to check the robustness of our findings. For analysing the effect of CRAR on different types of risk weighted assets, we subsequently also consider loans to housing sector and industries separately. V.2 The Model We follow Bayesian approach to estimate the sign-restricted VAR model. While the VAR addresses the issues related to endogeneity, the Bayesian framework is the appropriate technique to handle limitations in a short sample. In order to be agnostic, we use flat/diffuse normal inverse-Wishart priors (improper priors) in our estimation. 1. The reduced form coefficients are estimated using the Bayesian method with flat (diffuse) normal-inverse-Wishart priors. 3.It is checked whether orthogonal impulse responses satisfy full sign restrictions. 4.If yes, the orthogonal impulse responses are saved. 5. If not, drop that model and repeat steps 2 and 3. Continue till sufficient models are accepted. We follow the QR decomposition method of Rubio-Ramirez et al. (2010) and Arias et al. (2018) for the identification7. This is a type of set-identification, and we restrict only to partial identification with only regulatory capital shock being identified by QR decomposition by Householder transformation approach a la Rubio-Ramirez et al. (2010) and Arias et al. (2018). We augment the standard VAR method used for monetary policy analysis with the relevant banking variables to estimate the impact of bank capital shock. The effect of shock in the bank capital is tricky to estimate since capital is endogenously related to other variables. Therefore, to measure its exogenous change we address the endogeneity issue through VAR and we identify the exogenous bank capital shock using sign-restrictions. Sign-restricted identification, being less restrictive, is more aligned to economic theory as sign restrictions are imposed only to identify the theoretical linkages while remaining invariant to the order of the variables. We identify the bank capital shock based on our preliminary analysis of the data and inferring from the findings of Gambacorta and Shin (2018) and Muduli and Behera (2020). V.3 Shock Identification In contrast to the recursive identification scheme commonly followed in the literature to estimate the bank capital shock, we have used sign-restrictions to identify the bank capital shock as proposed by Kanngiesser et al. (2017). This is because recursive VAR models are sensitive to variable ordering and could produce mis-leading results (Mumtaz et al. 2015). The sign-restricted VAR has been used extensively to identify monetary policy shock, fiscal policy shock, technology shock, oil price shock, etc. Recently, a few studies have employed sign-restricted VAR to identify the financial shocks (Caldara et al. (2016); Meinen and Roehe (2018); Furlanetto et al. (2019)) credit supply shocks (Hristov et al. (2012); Duchi and Elbourne (2016)) and bank capital shocks (Kanngiesser et al. (2017); Kanngiesser et al. (2019)). As our objective is to know whether bank capitalisation has any positive effect on loan supply and thereby on economic activity, the sign-restricted VAR is the only available option to identify the effects of such shocks in macroeconomic analysis. Shock to CRAR captures a change in regulatory CRAR that transmits to the banking sector. This ends up raising the equity (and equity to asset ratio as well) component in the liability side of the banks. We identify the effect of bank capital shock on CRAR, spread, credit and economic activity. The signs of the effect are based on the findings in the literature, our theoretical findings and the preliminary evidence as discussed in Section II. However, we remain agnostic about its effect on CPI inflation and monetary policy. While imposing restriction on impact, we also remain agnostic about its effect on the propagation of shocks over time (Table 1). Due to a regulatory capital shock, CRAR increases. Higher CRAR, by improving creditworthiness, reduces WACC and spread, and increases credit supply and thereby output. We do not dispute the mechanism of a bank capital shock mentioned in the macro-prudential literature that higher capital requirement reduces loans with higher risk weights and increases bank capital holding (which is supposedly costlier to finance and thus dents bank’s profitability). What we argue is that the positive effect of CRAR can outweigh the negative effects (on credit due to costlier equity financing and the regulatory risk weights). A net increase in credit supply would consequently let the niche firms reliant on bank credit to expand (already envisaged and established in the literature of bank lending channel). | Table 1: Sign restrictions to identify the effects of bank capital shock | | Dimensions and Shock | CRAR | Spread | RNFBC | Economic Activity | Inflation | Policy rate | | Bank Capital shock (CRAR shock) | + | - | + | + | | |
| Table 2: Alternative Sign restrictions | | Dimensions and Shock | CRAR | Spread | RBCI | RBCH | Economic Activity | Inflation | Policy rate | | Bank Capital shock | + | - | - | + | + | | | As found in the literature, the response of the credit supply could be asymmetric depending on the regulatory risk weights. Because of higher weights assigned to risky assets, banks may respond to the capital shock by reducing loan supply to the risky sectors. To examine the differential impact of bank capital shock on risky and less-risky lending, we estimate separately the VAR with loan to housing (RBCH) and industry (RBCI).We analyse the model with two credit variables with positive restriction imposed on the growth rate of credit to housing sector and negative restriction on growth rate of credit to industry, on the impact (Table 2). Section VI
Results VI.1 The Macroeconomic Impact of Changes in Capital As mentioned in the previous section, we have estimated a VAR model with six variables, viz., CRAR, spread, real credit growth, GDP growth, CPI inflation and change in repo rate. A shock to bank capital could lead to re-pricing of bank credit, affecting the quantity of loans provided, on top of the impact coming from the bank capital shock itself (Kanngiesser et al. 2019). Thus, spread is included along with policy rate in the set of variables. Under a partial identification, with only an exogenous rise in economy wide CRAR due to regulatory changes, we look out for the macroeconomic implications with a positive sign on real credit, negative sign on spread and a positive sign on GDP, all restrictions being only on the impact. The identification method followed here is robust as compared to the widely used penalty function approach as the latter has certain shortcomings that might vitiate policy inferences (Arias et al. 2018). The sign-restricted VAR is estimated using Bayesian methods for the period 2009-10:Q1 to 2017-18:Q4. 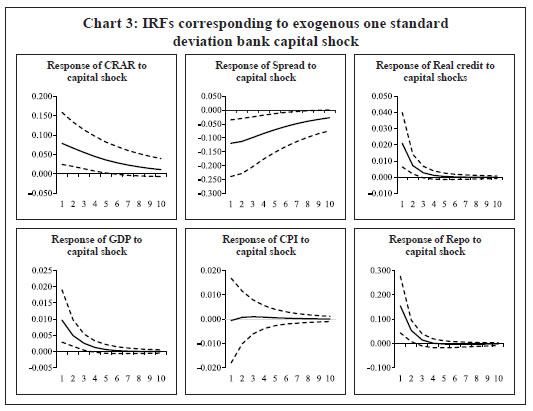 Based on the estimated VAR, the impulse responses of endogenous variables to a one standard deviation rise in bank capital is reported in Chart 3. The impulse responses are the median values (solid lines) of the accepted draws which are plotted along with their 16% and 84% Bayesian credibility bands (dotted lines). On impact, the CRAR increases by about 9 basis points (bps) in response to one standard deviation economy-wide bank capital shock; and the effects remain for a substantial period. The bank lending spread declines noticeably and sustained over ten quarters possibly because of the increase in credibility due to improvement in their balance sheets. The reduction in risk premium provides the banks access to greater pool of funds at cheaper price. As banks adjust their lending rate downward, it leads to higher credit growth. Thus, the real credit growth rate shoots up over four quarters and consequently GDP growth rate remains buoyant over six quarters. The shock to bank capital increases credit growth by 40 bps and GDP growth by about 24 bps over a period of one year. While the response of inflation to bank capital shock remain almost nil, the policy rate increases possibly reflecting the rise in demand. In sum, banks react to structural bank capital shock by raising their equity capital, which in turn helps them to reduce their risk premium. This results in a reduction in bank lending spread and a rise in credit growth and ultimately higher growth in the economy. How bank capital shock has contributed to the variation in different variables over time are presented in Chart 4. Particularly, the historical decomposition allows us to evaluate the importance of structural shocks on the evolution of the variables in the VAR at a particular point in time where the historical contribution is worked out by taking the structural shocks and the orthogonalised IRFs. The results show that CRAR had increased during 2010Q1 – 2012Q1 as banks increased their capital position to meet Basel III requirements. However, the capital shock turned adverse, possibly due to the rise in stressed assets in banking sector in the subsequent period. Starting from 2017Q1, the recapitalisation efforts by the government have contributed positively to the CRAR of the banking sector. As can be seen from the Chart 4, both credit growth and GDP growth were positive during the corresponding quarters of positive bank capital shocks. Moreover, it is clear that a rise in bank capital has contributed positively to GDP growth since 2017Q1, the period after substantial capital infusion by the government to improve the balance sheet of the public sector banks. The above results remain almost unchanged when we replace weighted average CRAR with median value of bank level CRAR (Appendix). 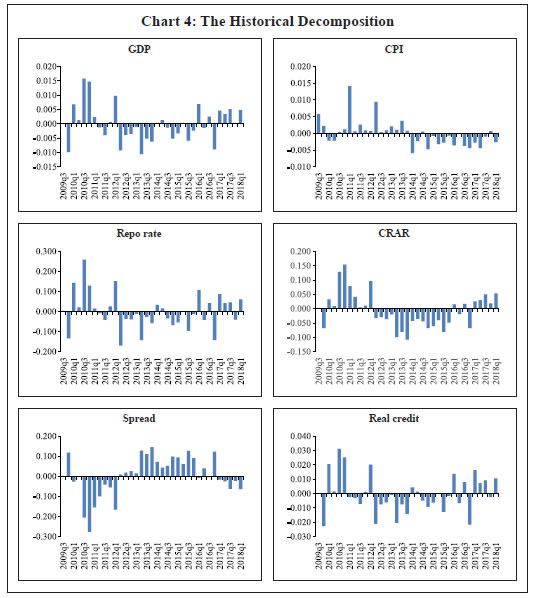 We can also observe from the historical decomposition that a decline in bank lending spreads is contributed by a positive bank capital shock during 2010Q3 – 2012Q1 and 2017Q1 -2018Q1. Hence, we conclude that an increase in bank capital has a positive effect on the economy by reducing bank lending spread and enhancing credit growth. VI.2 The Role of CRAR as a Leverage Tax The above findings are in line with that of Gambacorta et al. (2018) but it raises the question on the role of CRAR as a financial stabiliser in the economy. The rise in credit due to a positive bank capital shock does not guarantee the fall in risk weighted assets and the tuning down the financial cycle of leverage. The immediate macro-prudential goal for financial stability lies in cutting down excessive leverage. Taming unsustainable credit growth is a policy objective and as a policy tool, CRAR is supposed to be counter-cyclical to reduce the proliferation of more risky credit. However, the efficiency of CRAR as a check on leverage is augmented if it can selectively minimise unsecured loans of the banks while increasing aggregate credit. We check if a bank capital shock, without any bank-specific regulations, is also capable to operate as a leverage tax to reduce unsecured lending through the differential risk weights assigned to the assets based on their underlying risk. To study the differential impact of bank capital shock on credit, we examine whether banks reduce their lending to industry (which is predominantly unsecured) and raise secured loans in response to a rise in bank capital requirement. We use the credit extended to the housing sector as a measure of mortgage backed lending and credit to industry as a proxy of aggregate unsecured lending by banks. Therefore, we replace the aggregate real credit growth by the growth in real credit to housing (RBCH) and to industry (RBCI) in our empirical exercise. Recent fall in the growth of bank credit to industry in India could be a result of increased stressed assets in that sector and consequent apprehension of higher default. It could also be due to higher risk weight on loans to industry, which under increased regulatory capital requirement incentivises banks to cut down on risky assets with higher weights. The VAR is re-estimated with new variables and sign-restrictions as provided in Table 2. The impulse responses show that credit growth to industry falls while loan growth of housing sector increases in response to a positive shock to bank capital (Chart 5). As banks readjust their portfolios by reducing the riskier assets due to higher capital requirements and increasing mortgage backed securities like housing loans, the overall credit may increase as found earlier. Thus, banks reduce higher risk weighted assets due to regulatory checks on leverage through CRAR. The growth rate of credit to industry falls over three quarters while growth of credit to housing sector increases over four quarters. The role of CRAR as a macro-prudential tool for financial stability thus holds true. 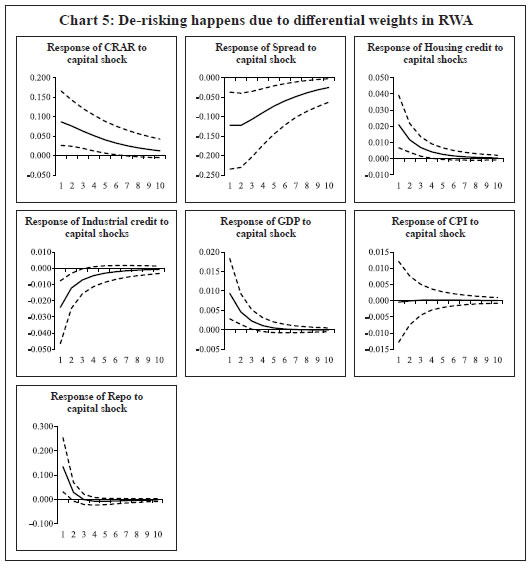 Section VII
Conclusion In this paper, we examine the role of bank capital in boosting credit supply and GDP growth. We develop a theoretical model and show that the overall borrowing cost of banks falls in response to a rise in regulatory capital requirement even under a zero MM offset if the cost of debt financing is elastic to leverage. The fall in cost of capital, thus, reduces lending spread and augments credit supply. In addition to the fall in WACC, banks with higher capital ratios may feel less constrained to lend as they are less likely to reach the regulator’s minimum floor. The Bayesian impulse responses and historical decomposition results also confirm the positive effect of bank capital on loan supply and GDP growth. Regulatory bank capital shock in the Indian context renders a positive credit-led push to GDP growth by strengthening the balance sheets of banks and the consequent reduction of their overall cost of borrowings. This seems like an idealistic situation as the benefits of mitigating crisis through raised capital comes with the added fillip to GDP growth. This output-enhancing effect of greater capital holding by banks does not defeat viable macro-prudential role of capital adequacy as a leverage tax on risky lending. Under a regulatory capital shock, banks readjust their risky loans and shift towards assets that carry lesser risk weights that ultimately raises aggregate credit flows. These empirical results should be taken with the caveat that it cannot be generalised if CRAR gets increased by a large amount and the empirical results obtained in this paper may not hold under other contexts and for other countries. At times, a statistically significant negative effect of bank capital shock on credit and GDP growth may also materialise. A future research question to explore would be to further identify the exact transmission channel(s) of a bank capital shock impacting lending spread or credit supply.
References Arias, J. E., Rubio-Ramírez, J. F., & Waggoner, D. F. (2018). Inference Based on Structural Vector Autoregressions Identified with Sign and Zero Restrictions: Theory and Applications. Econometrica, 86(2), 685-720. Aiyar, S., C.W. Calomiris & Wieladek, T. (2012). Does Macro-pru Leak? Evidence from a U.K. Policy Experiment. NBER Working Paper, No. 17822, National Bureau of Economic Research, Cambridge, MA. Angelini, P., Clerc, L., Cúrdia, V., Gambacorta, L., Gerali, A., Locarno, A., & Vlček, J. (2015). Basel III: Long-term Impact on Economic Performance and Fluctuations. The Manchester School, 83(2), 217-2517 Basel Committee on Banking Supervision (2010). Assessing the Macroeconomic Impact of the Transition to Stronger Capital and Liquidity Requirements. Bank for International Settlements, Basel, August. --- (2019). The Costs and Benefits of Bank Capital – A Review of the Literature. Working Paper No. 37, Bank for International Settlements, June, Basel. Bedayo, M., Estrada, A., & Saurina J. (2018). Bank Capital, Lending Booms, and Busts. Evidence from Spain in the last 150 years. Banco de España Working Paper, No. 1847. Bernanke, B.S. & Lown, C.S. (1991). The Credit Crunch. Brookings Papers on Economic Activity, No. 2, Broookings Institution, 205-39. Berrospide, J.M. & Edge, R.M. (2010). The Effects of Bank Capital on Lending: What Do We Know, and What Does It Mean? International Journal of Central Banking, 6(4), 5-53. Birn, M., de Bandt, O., Firestone, S., Gutiérrez Girault, M., Hancock, D., Krogh, T., & Straughan, M. (2020). The Costs and Benefits of Bank Capital – A Review of the Literature. Journal of Risk and Financial Management, 13(74), 1-25. Bridges, J., Gregory, D., Nielsen, M., Pezzini, S., Radia A. & Spaltro, M. (2014). The Impact of Capital Requirements on Bank Lending. Working Paper, No. 486, Bank of England. Budnik, K. B. et al. (2019). The Benefits and Costs of Adjusting Bank Capitalisation: Evidence from Euro Area Countries. Banco de Espana Working Paper, No. 1923, July 15, doi: http://dx.doi.org/10.2139/ssrn.3419995 Caldara, D., Fuentes-Albero, C., Gilchrist, S., & Zakrajšek, E. (2016). The Macroeconomic Impact of Financial and Uncertainty Shocks. European Economic Review, 88, 185-207. Cantú, C., Lobato, R., López, C. & Lopez-Gallo, F. (2019). A Loan-Level Analysis of Bank Lending in Mexico. BIS Working Paper, No. 802, July. Catalán, M., Hoffmaister, A., & Harun, C.A. (2017). Bank Capital and Lending: An Extended Framework and Evidence of Nonlinearity. IMF Working Paper, No. 252, September, doi: https://doi.org/10.5089/9781484325995.001. Cline, W. R. (2017). The Right Balance for Banks: Theory and Evidence on Optimal Capital Requirements. Columbia University Press. Cline, W. R. (2016). Benefits and Costs of Higher Capital Requirements for Banks. Working Paper No. 16-6, Peterson Institute for International Economics. Das, A. & Ghosh, S. (2006). Financial Deregulation and Efficiency: An Empirical Analysis of Indian Banks during the Post reform Period. Review of Financial Economics, 15(3), 193-221. Dieppe, A., Legrand, R., & Van Roye, B. (2016). The BEAR Toolbox, ECB Working Paper, No. 1934, European Central Bank, July. Duchi, F., & Elbourne, A. (2016). Credit supply shocks in the Netherlands. Journal of Macroeconomics, 50, 51-71. Fang, X., Jutrsa, D., Peria, M. M. S. M., Presbitero, A., Ratnovski, M. L., & Vardy, M. F. J. (2018). The Effects of Higher Bank Capital Requirements on Credit in Peru. IMF Working Paper, No. 222, September. Francis, W. & Osborne, M. (2009). Bank Regulation, Capital and Credit Supply: Measuring the Impact of Prudential Standards. Occasional Paper Series, No. 36, U.K. Financial Services Authority, London. Furlanetto, F., Ravazzolo, F., & Sarferaz, S. (2019). Identification of Financial Factors in Economic Fluctuations. The Economic Journal, 129(617), 311-337. Gambacorta, L., & Shin, H. S. (2018). Why Bank Capital Matters for Monetary Policy. Journal of Financial Intermediation, 35, 17-29. Gerali, A., Neri, S., Sessa, L., & Signoretti, F. M. (2010). Credit and Banking in a DSGE Model of the Euro Area. Journal of Money, Credit and Banking, 42, 107-141. Ghosh, S. & Das, A. (2005). Market Discipline, Capital Adequacy and Bank Behaviour. Economic and Political Weekly, 1210-1215. Ghosh, S. (2008). Capital requirements, bank behavior and monetary policy-a theoretical analysis with an empirical application to India. Indian Economic Review, 205-227. Gross, M., Kok, C. & Zochowski, D. (2016). The Impact of Bank Capital on Economic Activity: Evidence from a Mixed-Cross-Section GVAR Model, ECB Working Paper, No. 1888. Hancock, D., Laing, A.J. & Wilcox, J.A. (1995). Bank Capital Shocks: Dynamic Effects on Securities, Loans, and Capital. Journal of Banking & Finance, 19, 661-77. Hristov, N., Hülsewig, O. & Wollmershäuser, T. (2012). Loan Supply Shocks During the Financial Crisis: Evidence for the Euro Area. Journal of International Money and Finance, 31, 569–592. Jiménez, G., Ongena, S., Peydró, J. L., & Saurina, J. (2017). Macroprudential Policy, Countercyclical Bank Capital Buffers and Credit Supply: Evidence from the Spanish Dynamic Provisioning Experiments. Journal of Political Economy, 125(6), 2126-2177. Kanngiesser, D., Martin, R., Maurin, L., & Moccero, D. (2017). Estimating the Impact of Shocks to Bank Capital in the Euro Area. ECB Working Paper, No. 2077, June. Kanngiesser, D., Martin, R., Maurin, L., & Moccero, D.N. (2019). The Macroeconomic Impact of Shocks to Bank Capital Buffers in the Euro Area. The B.E. Journal of Macroeconomics, 20(1), doi: https://doi.org/10.1515/bejm-2018-0009. Liu, G., & Molise, T. (2019). Housing and Credit Market Shocks: Exploring the Role of Rule-based Basel III Counter-cyclical Capital Requirements. Economic Modelling, 82, 264-279. Lown, C. & Morgan, D.P. (2006). The Credit Cycle and the Business Cycle: New Findings using the Loan Officer Opinion Survey. Journal of Money, Credit and Banking, 37(6), 1575-97. Mahakud, J. & Dash, S. R. (2013). Impact of Business Cycle on Bank Capital Buffers: Evidence from India. Economics, management and Financial Markets, 8(2), 110. Maurin, L. & Toivanen, M. (2012). Risk, Capital Buffer and Bank Lending: A Granular Approach to the Adjustment of Euro Area Banks. ECB Working Paper, No. 1499. Meeks, R. (2017). Capital Regulation and the Macroeconomy: Empirical Evidence and Macroprudential Policy. European Economic Review, 95, 125-141. Meinen, P., & Roehe, O. (2018). To Sign or not to Sign? On the Response of Prices to Financial and Uncertainty Shocks. Economics Letters, 171, 189-192. M´esonnier, J-S. & A. Monks (2015). Did the EBA Capital Exercise Cause a Credit Crunch in the Euro Area? International Journal of Central Banking, 11(3), 75-117. Miles, D., Yang, J., & Marcheggiano, G. (2013). Optimal Bank Capital. The Economic Journal, 123(567), 1-37. Miller, M. H. (1995). Do the M & M Propositions apply to Banks? Journal of Banking & Finance, 19(3-4), 483-489. Modigliani, F. & Miller, M. H. (1958). The Cost of Capital, Corporation Finance and the Theory of Investment. The American Economic Review, 48(3), 261-297. Mora, N. & Logan, A. (2012). Shocks to Bank Capital: Evidence from UK Banks at Home and Away. Applied Economics, 44, 1103-19. Muduli, S. & Behera, H. (2020). Bank Capital and Monetary Policy Transmission in India. RBI Working Papers Series (No. 12/2020),. Mumtaz, H., G. Pinter, & Theodoridis, K. (2015). What do VARs Tell Us about the Impact of a Credit Supply Shock? An Empirical Analysis. Working Paper, No. 716, Queen Mary University of London. Nachane, D. M., Ghosh, S. & Ray, P. (2006). Basel II and Bank Lending Behaviour: Some Likely Implications for Monetary Policy. Economic and Political Weekly, 1053-1058. Noss, J. & Toffano, P. (2014). Estimating the Impact of Changes in Aggregate Bank Capital Requirements during an Upswing. Working Paper, No. 494, Bank of England. Peek, J. & Rosengren, E.S. (1995). The Capital Crunch: Neither a Borrower nor a Lender Be. Journal of Money, Credit and Banking, 27(3), 625-38. Peek, J. & E.S. Rosengren (1997). The International Transmission of Financial Shocks: The Case of Japan. The American Economic Review, Vol. 87, No. 4, pp. 495-505. Reserve Bank of India (2019). Annual Report 2018-19. Mumbai, p. 50. Rubio-Ramirez, J.F., Waggoner, D.F. & Zha, T. (2010). Structural Vector Autoregressions: Theory of Identification and Algorithms for Inference. Review of Economic Studies, 77, 665-96. Verma, R., & Herwadkar, S. (2019). Bank Recapitalisation and Credit Growth: The Indian Case. MPRA Paper No. 97394, url: https://mpra.ub.uni-muenchen.de/97394/ Watanabe, W. (2007). Prudential Regulation and the “Credit Crunch”: Evidence from Japan. Journal of Money, Credit and Banking, 39(2-3), 639-65. Woo, D. (2003). In Search of “Capital Crunch”: Supply Factors behind the Credit Slowdown in Japan. Journal of Money, Credit and Banking, 35(6), 1019-38.
Appendix
|