Rajib Das, Narayan Chandra Pradhan and Rajat Malik* Received on: February 12, 2021
Accepted on: July 29, 2021 This paper examines the impact of post-Global Financial Crisis of 2007-08 liquidity conditions and implementation of regulatory reforms on the ‘over-the-counter’ (OTC) derivatives market activity in select emerging market and developing economies (EMDEs). Results based on a panel regression analysis suggest that the regulatory changes in the OTC derivatives market have resulted in the reduction of systemic risk in EMDEs. Cross-border liquidity flows and specific derivatives market reforms are found to stimulate OTC market volumes. Some evidences of regulatory burden coming in the way of greater volumes in OTC markets is also observed. JEL Classification: G11, G14, G18, G23 Keywords: Over-the-counter markets, financial instruments, government policy and regulation Introduction Many of the world’s largest financial markets remain decentralised with bulk of the derivatives trading taking place ‘over-the-counter’ (OTC). These contracts are negotiated bilaterally, and the customised nature of such contracts is a hallmark of OTC derivatives. Modern electronic exchanges, in turn, are easily accessible and often involve lower transaction costs. In comparison, OTC trading is relatively costly for the need to agree on prices and lower order of automation. Despite this, an increasing portion of trades occurs in OTC. OTC markets are mostly self-regulated and industry associations such as the International Swaps and Derivatives Association (ISDA) provide the OTC markets with standard legal contracts and some advantages over organised exchange markets. Duffie et al. (2005) in their seminal work mentioned that the decentralised OTC market structure probably entails better price discrimination. OTC markets are also characterised by the absence of a centralised trading mechanism. In contrast, listed exchanges typically use a central limit order book to aggregate the trading interests of buyers and sellers. This permits participant in listed markets to trade with each other safely as well as anonymously (BIS, 1998). Advances in electronic trading platforms have changed the trading process in many OTC markets, and this has sometimes blurred the distinction between traditional OTC markets and exchanges (Tuttle, 2014). On the other hand, there is a risk of imposing regulatory burden in the developing markets. Therefore, an attempt has been made in this study to assess the overall impact of these regulatory reforms on the EMDEs. After the Global Financial Crisis (GFC) of 2007-08, there were regulatory concern regarding the interconnectedness among market participants and systemic risk propagation involving several large institutions. The third meeting of the G20 at Pittsburgh in September 2009 discussed the ways to strengthen the international financial regulatory system, including through fundamental changes to the regulations for OTC derivatives markets. The intent was to increase the disclosure of OTC operations so as to decrease the probability of a crisis. The G20 reform programme stressed that, ‘where appropriate’, trades involving standardised OTC derivatives must be executed on exchanges or electronic trading platforms and cleared through a central clearing counterparty (CCP). It also imposed higher capital requirements for non-centrally cleared trades and the reporting of all OTC derivatives trades to trade repositories (G20, 2009). The G20 had assigned the responsibility to monitor and assess the implementation of these reforms to the Financial Stability Board (FSB). In addition, after the GFC, the G20 economies agreed on several financial reforms aimed at reducing systemic risk, improving transparency in the derivatives market and protecting against market abuse. These reforms included mandating centralised trading and clearing for standardised OTC derivatives, requirement of margins for derivatives that are not centrally cleared, and regulatory reporting of all derivatives transactions. Accordingly, several changes have been observed in OTC derivatives markets that are consistent with the G20 objectives of promoting central clearing and enhancing systemic stability. The clearing reforms created a series of new operational and risk management processes involving trade execution and contract settlement to minimise risks. Central counterparties emerged as the entities providing clearing and settlement services for seamless execution of trade, much like an exchange (FSB, 2018). Central clearing of derivatives can support financial stability in several ways. It may create greater opportunities for netting of derivatives and reducing counterparty credit risk. Technological advances enabled the creation of several electronic platforms for trading standardised OTC products, some of which seem very close to the system of central limit order book framework being operated on exchanges (Smyth and Wetherilt, 2011). In these platforms, the trade execution arrangements are constantly evolving and can still be quite complex. One of the aims of FSB regulations is to reduce the complexity of the OTC contracts. Bilaterally negotiated smaller and customised derivatives contracts are, however, the trademarks of conventional OTC derivatives. The relative attractiveness of OTC markets can be ascribed partly to the fact that OTC markets now yield many of the benefits of exchanges (Hull, 2018). The operational aspects of OTC derivatives markets had no centralised trading, clearing, or settlement mechanisms earlier. Transparency and even database is generally limited, other than the semi-annual central-bank surveys [by the Bank for International Settlements (BIS)]. Information about market concentration and distribution of risks is generally unavailable (Schinasi et al., 2000). FSB reforms have addressed some of the operational hindrances. Apart from the safety of trade, it has partially relieved participants of the costs usually involved in search for trading opportunities in OTC derivatives market (Duffie et al., 2007). The introduction of CCP has also changed the features of OTC derivatives market significantly in terms of the management of counterparty (credit) risk, centralised limits on individual positions, restrictions in terms of leverage, or margining, etc., where there were no formal rules for risk and burden sharing earlier and, therefore, of the market stability and integrity for safeguarding the interests of the participants (Duffie et al., 2017). In the Indian context, Gopinath (2010) mentions that unlike the developed financial markets, the OTC derivatives market in India have evolved within a regulated space. The major elements of this regulatory framework include a broad specification of products to be permitted, nature of participants in the markets, distinct responsibilities for market makers and users for all OTC derivatives, effective reporting systems for capturing systemic information and focus on developing market infrastructure for post-trade clearing and settlement. Within this space, interest rate and forex derivatives will continue to operate in a regulated manner with increased transparency. A recent paper (Kumar and Kamate, 2020) provides empirical evidence on the presence of considerable price discrimination in the Indian OTC currency derivatives market through an analysis of transaction level data. In contrast to Gopinath (2010), it finds that a large majority of all clients (83 per cent) transacted with a single dealer. The authors have made a case for improving market access to enhance competition, which may result in better pricing for clients with lower transaction costs. The G20 Leaders together made five commitments to reform OTC derivatives market (G20, 2009). These are: (i) standardised OTC derivatives should be centrally cleared; (ii) non-centrally cleared derivatives should be subject to higher capital requirements; (iii) non-centrally derivatives should be subject to minimum standards for margin requirements; (iv) OTC derivatives should be reported to trade repositories; and (v) standardised OTC derivatives should be traded on exchanges or electronic trading platforms, where appropriate. There is a broad acceptance that the G20 reform measures have helped strengthen the resilience of large financial institutions, and that meaningful progress has been made towards mitigating systemic risk (FSB, 2017). The remainder of this paper is organised as follows: Section II presents an analysis of OTC derivatives volumes trends, globally as well as in select EMDEs, and in relation to the global liquidity. Data, methodology and empirical findings are reported in Section III. Section IV concludes the paper by highlighting key policy implications. Section II
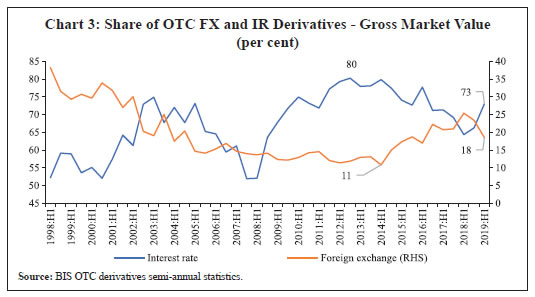
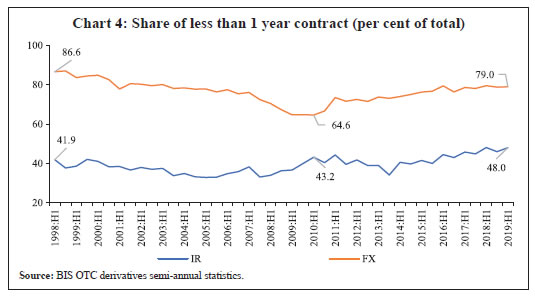
OTC Derivatives Market and Global Liquidity II.1. Analysis based on BIS semi-annual data The risk related to an OTC derivatives contract depends on various factors, such as the concentration of positions and the volatility of the underlying asset. Notional amount and gross market values are two of the several metrics used to calculate the risk exposure of OTC derivatives. However, both measures show a decline from respective pre-crisis peaks as also since the G20 Pittsburgh Summit in 2009, when major reform measures on OTC derivatives were introduced. The gross market value1 of derivatives contracts, which provides a more meaningful measure of amounts at risk, has continued on its declining trend since the GFC of 2007-08. According to the BIS semiannual data2, the notional amounts of global OTC derivatives have increased from USD 544 trillion in December 2018 to USD 640 trillion in June 2019, which marks a continuation of the rising trend generally evident since end-2016. The gross market values of all outstanding OTC derivatives fell to USD 9.7 trillion by end-December 2018 from the peak of USD 35 trillion at end-December 2008, before witnessing a rebound to USD 12 trillion in June 2019. In both the cases, this was led mainly by interest rate derivatives, both USD and Euro denominated contracts and generally in the short-term contracts. OTC derivatives have witnessed structural changes in the past decade with the rise of central clearing as a major driver (Chart 1). This change has gone hand in hand with an increase in trade compression – the elimination of economically redundant derivatives positions – both of which primarily affected interest rate contracts, driving down their market values. 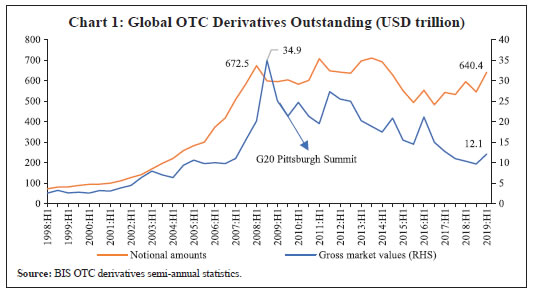 OTC derivatives are mainly dominated by the foreign exchange (FX) and interest rate (IR) derivatives with their combined share at about 97 per cent of the overall outstanding global OTC notional amounts, up from 90 per cent in June 2009. Similarly, their share in terms of gross market values has also risen from 66 per cent in June 2008 to 91 per cent in June 2020. This was driven entirely by IR contracts, despite its share falling marginally from its recent peak. The gross market value share of IR contracts fell from 80 per cent at end-June 2014 to 66 per cent at December 2018 before rising to 73 per cent in H1 2019, while that of FX contracts rose sharply from 11 per cent to 23 per cent and falling subsequently to 18 per cent in H1 2019 (Charts 2 and 3). Much of the increase in notional amounts for IR derivatives occurred in short-term contracts (less than 1-year). The total IR derivatives rose from USD 481 trillion in June 2018 to USD 524 trillion in June 2019, while the segment with maturity up to and including one year rose from USD 231 trillion to USD 253 trillion in the same period. The share of short-term IR derivatives fluctuated at around 40 per cent before witnessing a moderate rise to 48 per cent by June 2019 (Chart 4). For the FX derivatives, this number witnessed a constant decline from 87 per cent in 1998 to 65 per cent in June 2009 before recovering to 79 per cent by June 2019. The predominance of short-term FX contracts may be a reflection of the response to quantitative easing (QE) adopted by several systematically important central banks. On the other hand, the share of short-term IR derivatives can be reflective of a prolonged period of low interest rates as compared to the pre-GFC phase. 
 The composition of instruments within FX as well as IR derivatives has undergone changes over the past two decades. In the FX derivatives, the change is considerable (Chart 5). The share (per cent of total notional outstanding) of outright forwards and swaps declined from 69 per cent in June 2000 to 49 per cent in December 2009, before recovering to 60 per cent in June 2019. On the other hand, the share of currency swaps has risen from 10 per cent in June 1998 to 30 per cent in December 2017, and this has been offset by a decline in the share of options from 23 per cent in 1998 to 13 per cent in June 2019. Within the IR OTC derivatives (Chart 6), the composition has changed only marginally. As of June 2019, the share of swaps remains dominant at around 74 per cent, while the share of forward rate agreements (FRAs) and options stood at 17 per cent and 9 per cent, respectively. 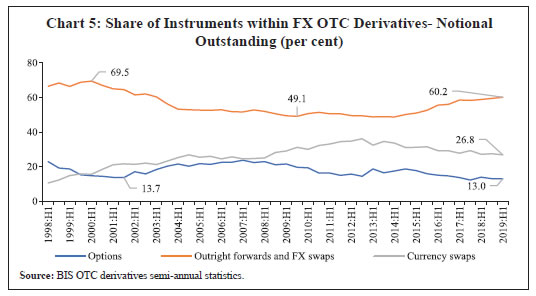
 Central clearing is steadily expanding in the OTC derivatives market for many years. The share of outstanding OTC derivatives cleared through central counterparties remained over 78 per cent for IR contracts as against only 3 per cent for FX derivatives during 2019:H1 (Chart 7). The relatively low share of FX derivatives can be explained by differences in regulations. Regulators in most of the major derivatives markets require certain standardised OTC derivatives to be centrally cleared, particularly IR swaps, Credit Default Swaps (CDS) and non-deliverable FX forwards; deliverable FX derivatives and equity derivatives are generally not covered. Also, some instruments, such as options, are currently not offered for clearing by CCPs. That said, regulators continue to expand clearing requirements, and many are also starting to require higher capital and margins for non-centrally cleared derivatives (FSB, 2016). Overall, the CCP led changes possibly enabled lower market concentration especially in the case of IR derivatives. During the period, June 2009 to June 2019, the Herfindahl index3 for IR declined from 892 to 603; for FX it came down from 575 to 525 (Chart 8). 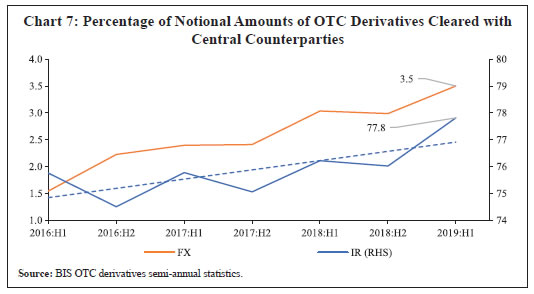 II.2 Analysis based on BIS triennial survey data As the previous analysis is confined to aggregate data, this sub-section focuses on OTC derivatives of EMDEs. As on June 2019, the 12 jurisdictions covered under semi-annual data reporting by BIS accounts for about 92 per cent of global notional outstanding OTC derivatives positions and 87 per cent in gross market value terms. These 12 jurisdictions, however, are all advanced economies (Australia, Canada, France, Germany, Italy, Japan, Netherlands, Spain, Sweden, Switzerland, UK and US) Thus, to understand the remaining roughly 8 per cent of the global OTC derivatives positions, one needs to depend on the BIS triennial survey on trade volume data of additional 33 jurisdictions which cover many EMDEs. Although, the overall share of remaining countries is about 6 per cent, their share in FX derivatives is relatively higher at around 14 per cent. 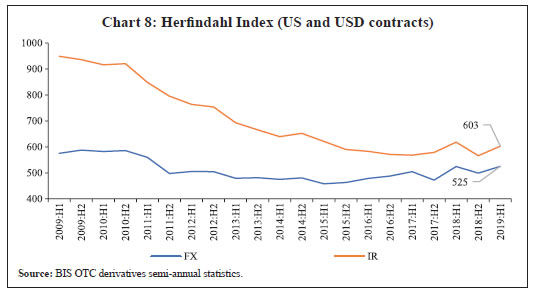 A cursory look at the trade volume data from the BIS triennial survey for select EMDEs reveals the impact of global reforms on these markets over a period, the magnitude of which varies from country to country based on the level and timeline of implementation of reforms. In the EMDEs, the turnover of OTC derivatives (IR as well as FX) has been volatile, though the trend has been rising even before the implementation of reforms (Charts 9 and 10). A further examination of the triennial survey in terms of the relative turnover share of different categories of countries shows that the EMDEs4 gained turnover shares in FX, which rose from 2.0 per cent in 1998 to 4.5 per cent in 2019 (Table 1). 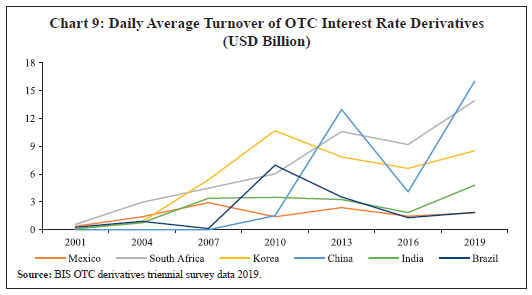 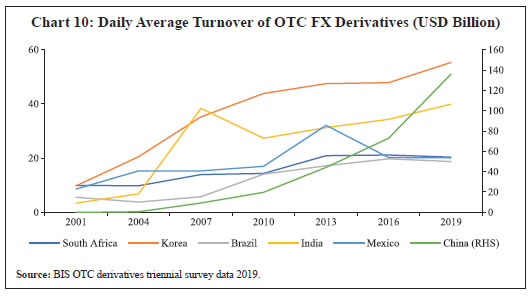 Notably, the increase in EMDEs share in FX derivatives has been at the expense of diminishing share of the G20 nations other than the US and the UK. Again, among 11 EMDEs, the rise in EMDEs share has come mostly due to expansion of share by China. In fact, the FX derivatives share of 10 EMDEs other than China declined from 3.7 per cent in 2013 to 2.9 per cent in 2019, when most of them implemented global reforms in OTC derivatives market. Similar pattern is also seen in case of IR derivatives, although the US and the UK have remained the most dominant in IR derivatives trade. In fact, for both FX and IR contracts, the shares in trade of the US and the UK increased to 59.6 and 82.4 per cent, respectively, by 2019. Rest of the G20 countries lost their shares in both IR and FX derivatives. | Table 1: OTC Derivatives in EMDEs by Market Values | | | FX Contract (in per cent) | IR Contract (in per cent) | | US and UK | 11 EMDEs | China | Rest G20 (ex-EU) | US and UK | 11 EMDEs | China | Rest G20 (ex-EU) | | 1998 | 50.9 | 2.0 | - | 20.9 | 52.8 | 0.3 | - | 33.3 | | 2001 | 47.8 | 3.2 | - | 24.0 | 52.3 | 0.1 | - | 32.3 | | 2004 | 51.1 | 3.7 | 0.02 | 22.4 | 66.2 | 0.5 | - | 21.6 | | 2007 | 52.1 | 4.2 | 0.2 | 17.7 | 68.2 | 0.8 | - | 19.1 | | 2010 | 54.7 | 4.1 | 0.4 | 16.9 | 70.8 | 1.1 | 0.1 | 16.7 | | 2013 | 59.7 | 4.4 | 0.7 | 14.1 | 73.1 | 1.5 | 0.5 | 16.2 | | 2016 | 56.5 | 4.6 | 1.1 | 14.1 | 79.7 | 0.8 | 0.1 | 10.9 | | 2019 | 59.6 | 4.5 | 1.6 | 11.0 | 82.4 | 0.7 | 0.2 | 7.4 | | Source: BIS. | II.3 Analysis based on BIS global liquidity data The above analysis provides a snapshot on the size and structure of global derivatives markets and motivates us to explore the possible drivers shaping the same, e.g., cross border flow of liquidity and G20 reforms. Global liquidity is one of the factors which may directly be related to the OTC derivatives in EMDEs in terms of creating risky exposures driving volumes in OTC derivatives, particularly for FX derivatives through demand for currency cover and risk to marketable securities. The demand for IR derivatives could also be coming from the faster interest rate movements driven by the international investors including institutional investors. Overall, the global liquidity flow to a country can be driven by a combination of global factors, capitals flows to EMDEs, country specific developments like financial market regulations and the state of derivatives markets. USD credit to non-bank borrowers from non-residents grew continuously since 2001 and reached approximately USD 12 trillion by March 2019. Within this, credit to EMDEs increased to USD 3.7 trillion as of March 2019. Moreover, the USD denominated credit to EMDEs constitutes about 80 per cent of the total credit in EMDEs by March 2019 (Chart 11). 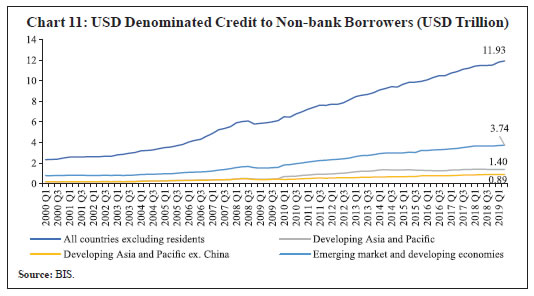
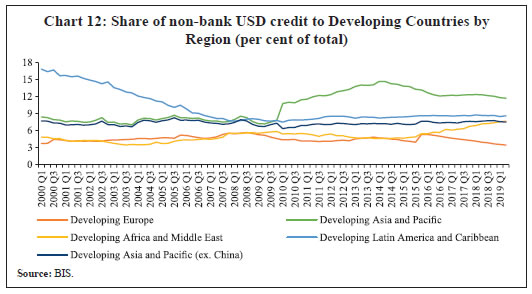 Amongst the developing countries, the share of non-financial credit to developing countries by region reflects the rise in share of Developing Asia and Pacific after the GFC. However, almost the entire rise in the share of credit could be explained by China as the credit share of Developing Asia and Pacific excluding China remained by and large steady for the entire period. The rise in credit share to China happened post 2008-09, while a considerable drop was seen for the Latin America and Caribbean region pre-2008 (Chart 12). The share of Africa and Middle East also increased in more recent period to 8 per cent in June 2019, while for the other regions it remained nearly constant. Overall, the share of EDMEs in USD credit has clearly gone up, which holds true even if the EMDEs share is calculated excluding China. EMDEs share of credit grew from 25 per cent in 2010 to 27 per cent in 2019 excluding China (25 per cent to 31 per cent if China is included) (Chart 13). To understand the impact of global liquidity on average OTC (IR+FX) trade volumes, it may be useful to plot data for eleven EMDEs (Annex 1). It may be observed that while there is a general correspondence between OTC derivatives trade volumes and global liquidity, the strength of the relation varies across countries. While there could be several other factors behind these differences, we believe that the difference in the pace and intensity of adoption of G20 OTC reforms could be one of them. The OTC volumes and global liquidity seem to be somewhat correlated in the case of India, South Korea and China, but not so in the case of Mexico and Brazil. II.4 Parameters of G20 OTC Derivatives Reforms by FSB The FSB has been coordinating and periodically assessing the state of implementation of G20 reforms in the OTC markets. FSB assesses member countries in terms of identifiable parameters and publishes their status of reform compliance through annual or more frequent publications titled ‘OTC Derivatives Market Reforms’, known as the FSB Progress Report on Implementation. Although definitions of compliance on each of the parameters are evolving over various FSB progress reports based on the course of reforms at the time of assessment, for the sake of analysis and quantification of its assessment, it is possible from its various reports to identify if an EMDE is fully, partially or not complied on any parameter of reforms at a given year. Broadly, the current definition of these assessments can be laid down in broader terms as: -
Full compliance of FSB reform, which implies some final statute, regulation, rule, policy statement, standard, etc. are already operative (at least 90 per cent of the transactions) in member countries as assessed by FSB; -
Where final statute, regulation, etc. are enacted or published but it is either not fully operative and/or does not have been in its full effect, it is treated as partially complied by the FSB; -
Reform measures are taken as not complied if members have failed to create any new or use existing authorities/framework to implement them, if so assessed by FSB. Based on the FSB reports over the years, it is possible to create a matrix on the state of reforms by various member countries in respect of all these parameters. Table 2 brings out the state of reforms implementation across the EMDEs, for years of BIS Triennial Survey, which is later mapped to OTC trade volumes. Some of the observations that can be derived from Table 2 are as follows: -
Among EMDEs, the best track record on reform implementation appears to be in Mexico, Brazil and South Korea, who could fully implement 4 of the 5 major reforms. Brazil and South Korea have only partial compliance with respect to platform trading, while Mexico lags on margin implementation. By implementing more difficult reforms like platform trading, central counterparties and margin requirements on non-centrally cleared derivatives (NCCDs), the EMDEs, could be argued, to be moving towards a level playing field between standardised/centrally cleared product versus customised/non-standardised bilaterally traded products without compromising systemic concerns. However, the challenging nature of these reforms in terms of infrastructure developments and compliance cost can have short-term impact on OTC trade volumes, which has been examined more closely later in the paper. -
On the other hand, China, systemically the most important EMDE in terms of liquidity flows and OTC trade volumes, seems to have a relatively inconsistent track record of reform implementation. It is the only FSB member country until 2018 to not even initiate margin related reform on NCCD. The early focus on standardisation effort to fully implement platform trading was in 2013; however, it was given up by 2016 for reasons not fully understood. | Table 2: Status of Reform Implementation in 11 EMDEs | | | Implementation* | 2010 | 2013 | 2016 | 2019 | | Trade Reporting | Full Compliance | 0 | 6 | 8 | 9 (excluding South Africa) | | Partial Compliance | 4 (Brazil, China, India, Indonesia) | 10 | 11 | 11 | | Central Clearing | Full Compliance | 0 | 1 (China) | 4 (Brazil, China, South Korea, Mexico) | 5 (South Africa +4) | | Partial Compliance | 2 (Argentina, China) | 6 | 11 | 11 | | Platform Trading | Full Compliance | 0 | 1 (China) | 1 (Mexico), China no more Full Compliance | 1 (Mexico) | | Partial Compliance | 3 (Argentina, China, Indonesia) | 5 | 11 | 11 | | Higher Capital on NCCD | Full Compliance | 0 | 7 | 11 | 11 | | Partial Compliance | 0 | 9 | 11 | 11 | | Margin on NCCD | Full Compliance | 0 | 0 | 1 (Saudi Arabia) | 3 (Saudi Arabia, South Korea, Brazil) | | Partial Compliance | 0 | 2 (Argentina, India) | 10 (China, non-compliant) | 11 | *: Reform implementation status of a year corresponds to the status in subsequent year’s available report.
Source: BIS. | - Most of the other EMDEs fall in between, generally remaining compliant on higher capital requirement on NCCD and trade reporting, while avoiding/delaying platform trade and margin requirement on NCCD related reforms owing to infrastructure/cost challenges they impose. There is a risk that partial implementation of reforms could be driving de facto standardisation through higher capital and lack of margining on NCCD, while greater incentives were created under the reforms for clearing through central counterparties. For instance, FX standardisation of India can be considered very high as market participants are often required to clear products through central counterparties.
From the above discussions, it may be inferred that the pace of reform process across the nations has varied because the challenges faced by EMDEs are different from that by the advanced countries in terms of the nature and evolution of the OTC derivative markets, the nature of participants, the systemic risks and regulatory priorities. For instance, as pointed out by Gopinath (2010), in India, unlike many of the developed financial markets where OTC derivative markets epitomised complex, unregulated financial innovations and grew exponentially during 1990-2010, the markets have generally continued to evolve slowly within a conservatively regulated space, serving more of retail and customised contracts. The approach included many prudential restrictions on participation and requirements such as requirements of an underlying exposure for undertaking OTC derivative transactions. The above facts necessitate a deeper understanding of the precise relation between global liquidity and OTC trade through the prism of FSB reforms. As expected, it turns out that the identified reform leaders have lost out on OTC trade volumes post implementation vis-à-vis the relatively slow implementers (Charts 14, 15, 16 and 17). In the next section, we study the impact of global liquidity and FSB reforms on OTC derivatives trade of selected EMDEs in a panel regression framework.
Section III
Data and Empirical Analysis A panel regression model is used to ascertain the impact of global liquidity and FSB reforms on FX and overall OTC derivatives for the period 1998 to 2019 (the latest available data from BIS). Aggregate level information on average turnover in FX and IR instruments are obtained by summing up these two series in each BIS triennial surveys. To obtain information on the course of FSB reforms and their implementation, various FSB Progress Reports on OTC derivatives market reforms have been used for each country covering all the five parameters Trade Reporting – (TR), Central Clearing (CC), higher capital (CAP), Platform Trading (PT) and Margin requirements (M) – classifying them either full, partial, or not compliant - as per the assessment. For liquidity mapping to BIS Triennial Survey OTC derivatives trade data, BIS global liquidity indicators — the country-wise information on total credit to non-bank borrowers by currency of denomination (USD, Euro and JPY), cross-border and local financing in foreign currency and loans and debt securities issuance by non-banks — have been aggregated on a 3-year average basis. Accordingly, the following generic equation has been used to quantify the impact of liquidity and reforms on OTC volumes under alternate data. where, OTC i,t stands for OTC daily average overall (FX + IR) or FX volumes (in USD Billion) for the ith country and tth year. GLiq measures Global liquidity as a combination of USD, Euro and JPY credit or only USD Total Credit. Reg2010 is a Dummy taking value ‘1’ for 2010 or after and ‘0’ otherwise. RegPIj is the jth OTC regulation: (TR, CC, CAP, PT and M) taking a value ‘1’ when a country implements them partially and ‘0’ otherwise. RegFIj is the jth OTC regulation (TR, CC, CAP, PT, M) taking a value ‘1’ when a country implements them fully and ‘0’ otherwise. Panel estimations are made with country specific effects with cross section GLS weights but without taking any time dummy. The panel of equations covers eleven EMDEs: Argentina, Brazil, China, India, Indonesia, Mexico, Russia, Saudi Arabia, South Africa, South Korea, and Turkey. Besides pooling partial and full implementation, the fixed effects model is also estimated for 1998-2019 with either partial or full status of implementation as assessed by FSB, i.e., θ = 0 and µ= 0. The results of the OTC specifications of regressions are provided in Table 3. It is possible that the above regression with overall OTC derivatives may turn out to be inefficient due to thin trading of IR derivatives in EMDEs and aggregation of liquidity in various currencies. Therefore, the generic regressions are conducted on only FX derivatives and USD liquidity as also various other specifications which yield broadly unchanged results. The results of the FX OTC trade specifications as a function of USD liquidity regressions are provided in Table 4. The panel regression results suggest that global liquidity is a prime driver of OTC trade volumes (Tables 3 and 4). The association is stronger for USD liquidity and for FX products (Table 4). This is along the expected lines as cross border liquidity is expected to raise the demand for cover against market risks. As discussed earlier in Section II.3, the USD credit to non-bank borrowers from non-residents to developing countries increased to USD 3.7 trillion by March 2019, while the trade in OTC derivatives in the 11 EMDEs under consideration rose to USD 418.4 billion during the same period. The rise has not been similar across countries, especially for the OTC volumes, which could be due to the country specific conditions relating to the timeline and impact of the FSB reforms. | Table 3: Dependent Variables - All OTC (FX + IR) Daily Average Volumes and Total Global Liquidity (USD billion) | | Indicators | Variable | Coefficient | | (Full + Partial) | (Only Full) | (Only Partial) | | Global Liquidity | ALL Liquidity (USD + Euro + 0.01JPY) in USD billion | 0.120*** | 0.107*** | 0.08*** | | Global regulation | Post 2010 | 6.03** | 6.89*** | 8.01** | | Higher Capital on NCCD | Full Compliance | -5.15 | -3.25 | - | | Partial Compliance | 6.38 | - | -4.53 | | Central Clearing | Full Compliance | 13.33*** | 10.64*** | - | | Partial Compliance | 9.21 | - | 10.76* | | Margin on NCCD | Full Compliance | 1.47 | -1.89 | - | | Partial Compliance | -7.34 | - | -1.10 | | Platform Trading | Full Compliance | -23.72*** | -23.04*** | - | | Partial Compliance | -9.74 | - | -10.9* | | Trade Reporting | Full Compliance | -8.44** | -4.38 | - | | Partial Compliance | 4.64 | - | 3.88 | | Adj. R Square | | 0.82 | 0.82 | 0.81 | | F-statistic | | 17.01 | 20.80 | 20.50 | | Prob (F-statistic) | | 0.00 | 0.00 | 0.00 | | Durbin-Watson stat | | 1.703 | 1.71 | 1.28 | | ***: Significant at 1 per cent. **: Significant at 5 per cent. *: Significant at 10 per cent. | The FSB regulations are found to have a strong impact on the OTC trade volumes, both at the aggregate as also for OTC FX trade, which perhaps indicates the possible impact of reforms either through the associated benefits of a robust regulatory set up or via compliance costs. The trade volumes are impacted generally by the timeline of reforms implementation and also specifically by the process of reforms. Overall, the regulation dummy has a favourable impact in terms of pushing up trade for general OTC and OTC FX. In addition, some of the individual parameters of reforms are also seen to help enhance the OTC trade volumes - overall or only FX. However, certain other parameters of reforms like platform trading and trade reporting tend to pull down the volumes of OTC trade – general or FX trade - as evident from their respective coefficient values. | Table 4: Dependent Variables: OTC FX Daily Average volumes and USD global liquidity in billion USD | | Indicators | Variable | Coefficient | | (Full + Partial) | (Only Full) | (Only Partial) | | USD Liquidity | USD Liquidity in billion USD | 0.134*** | 0.120*** | 0.09*** | | Global regulation | Post 2010 | 6.89*** | 6.06*** | 7.92*** | | Higher Capital on NCCD | Full Compliance | -4.27 | -3.6* | - | | Partial Compliance | 5.16 | - | -0.67 | | Central Clearing | Full Compliance | 9.76*** | 7.12** | - | | Partial Compliance | 7.6 | - | 7.71 | | Margin on NCCD | Full Compliance | 0.15 | -2.08 | - | | Partial Compliance | -3.77 | - | -0.34 | | Platform Trading | Full Compliance | -20.84*** | -18.44*** | - | | Partial Compliance | -9.35 | | -8.28 | | Trade Reporting | Full Compliance | -5.23* | -3.42 | - | | Partial Compliance | -9.35 | - | -2.08 | | Adj. R Square | | 0.81 | 0.80 | 0.78 | | F-statistic | | 15.76 | 19.87 | 17.46 | | Prob (F-statistic) | | 0.00 | 0.00 | 0.00 | | Durbin-Watson stat | | 1.82 | 1.78 | 1.54 | | ***: Significant at 1 per cent. **: Significant at 5 per cent. *: Significant at 10 per cent. | As discussed in section II.4, the average daily OTC derivatives volumes in 11 EMDEs have witnessed a rise from USD 5.3 billion in 2001 to USD 38 billion in 2019. Our results suggest that the central clearing is particularly improving trade volumes by reducing credit risk in bilateral trade. However, much of the positive impact is outweighed by the adverse impact of regulation on platform trading and trade reporting, particularly the former. In some cases, this impact is visible even with partial implementation. While trade reporting could be acting as a barrier to more trade by increasing the compliance costs, the negative impact of platform trade could be appearing from reluctance of the market to standardise OTC products beyond a point. This is more impactful as most of the EMDEs are lagging on margin requirement but are generally compliant with higher capital requirement on NCCD. This is possibly prompting participants against any required customisation of OTC trade, while encouraging standardisation for platform trade and central clearance, wherever possible, to economise on capital. This could have enhanced safety of trade but only at the cost of giving up the required customisation and innovation of OTC markets in most EMDEs. There is no independent impact of margin as well as higher capital requirement of NCCD on the total OTC volumes in the results. One of the possible reasons for this could be that they are shifting the composition of trade from bilateral to platform and central counterparties, appearing in the regression coefficients separately with a net negative impact. While every country could fully introduce higher capital charges on NCCD, only a few of them could introduce margin on NCCD, leading to a lack of level playing field between standardised and customised products. Absence of netting attracts imposition of capital charge on gross positions of market participants in most of the countries. Also, non-standardised products attract higher margin on platform/central clearings. No consistent patterns could be observed while trying similar regressions on IR OTC derivatives volumes. The market size of IR is quite limited as compared to FX in EMDEs and still evolving in almost all EMDEs. Despite small volumes, they are standardised and collateralised and, therefore, the impact of FSB regulations could not be observed. Thus, the global reforms since 2010 have led to some benefits along with a few pressing unintended consequences. Our results also reflect a few unintended impacts of the reforms on the volumes of the OTC derivatives market for EMEs. Section IV
Concluding Observations An empirical assessment of the impact of G20 OTC derivatives market reforms on market volumes in EMDEs is the focus of the study. More specifically using panel regression the impact of global liquidity and OTC derivatives market reforms is studied on the volumes of the OTC derivatives - both foreign exchange and interest rate derivatives separately - for 11 systemically important EMDEs. The analysis also segregates the marginal impacts of each reform parameter on trade volumes. The results suggest that cross-border liquidity flows provide necessary impetus to the OTC derivatives market in EMDEs. Global liquidity is found to be influencing OTC volumes, which is more prominent for USD liquidity and FX derivatives products. In addition, global regulatory reforms undertaken by FSB are also observed to be helping in promoting an orderly development of the market. The FSB regulations impact OTC FX volumes when the implementation is assessed as complete. Irrespective of the individual dimension of reforms, there has been an overall increase in trade volumes since the onset of reforms. Particularly, we observe that central clearing helped improve trade volumes significantly. The effect of trade reporting as well as platform trading, however, is found to reduce OTC trade volumes in EMDEs. It is possibly showing the reluctance and inability of markets to standardise instruments beyond a point. Also, there could be added costs due to enhanced disclosures and regulatory reporting standards. There is no independent impact that could be measured due to higher capital requirement of non-centrally cleared derivatives and implementation of margining requirement as they may be impacting the composition of trade more than total volumes of the trade. Overall, we find some evidence of regulatory burden that is coming in the way of greater OTC trade activity in EMDEs. In a broader sense, there are many challenges and adjustment costs associated with these reforms especially for EMDEs. A few of these may be short term in nature while others have proved long lasting, which explains why some of the suggested reforms have taken greater time and costs and witnessed hesitancy on the part of countries before full implementation. Overall, one may argue that a more flexible, phased and country specific implementation strategies could have been better, keeping in view the varied state of markets, maturity levels and ability to adjust, even though the observed broad benefits and resilience in terms of rising trading volumes in EMDEs. References BIS (1998). OTC derivatives: Settlement procedures and counterparty risk management, Basel: Bank for International Settlements. Duffie, D., Gârleanu, N., & Pedersen, L. H. (2005). Over‐the‐counter markets. Econometrica, 73(6), 1815-1847. Duffie, D., Gârleanu, N., & Pedersen, L. H. (2007). Valuation in over-the-counter markets. The Review of Financial Studies, 20(6), 1865-1900. Duffie, D. (2017). Financial regulatory reform after the crisis: an assessment. Management Science. Available at: http://pubsonline.informs.org/doi/abs/10.1287/mnsc.2017.2768. FSB (2016). OTC derivatives market reforms: eleventh progress report on implementation, August 2016. FSB (2017). Review of OTC derivatives market refo rms: Effectiveness and broader effects of the reforms, June. Basel: Financial Stability Board. Available at: www.fsb.org/2017/06/review-of-otc-derivatives-market-reform-effectiveness-and-broader-effects-of-the-reforms/. FSB (2018). Incentives to centrally clear OTC derivatives: A post-implementation evaluation of the effects of the G20 financial regulatory reforms, Basel: Financial Stability Board. Gopinath, S. (2010). Over-the-counter derivative markets in India – issues and perspectives. URL: http://www.bis.org/review/r100803d.pdf. G20 (2009). Strengthening the international financial regulatory system, Leaders’ statement at the G-20 Summit on Financial Markets and the World Economy, Pittsburgh, PA, September 24–25. https://www.g20.org/sites/default/files/g20_resources/library/Pittsburgh_Declaration.pdf Hull, J. (2018). Options, futures, and other derivatives. New York: Pearson Education, 10th edition. Kumar, A., and V. Kamate (2020). Price discrimination in over-the-counter currency derivatives, RBI Working Paper No. 13, Mumbai: Reserve Bank of India. Schinasi, G., R. Craig, B. Drees, and C. Kramer (2000). Modern banking and OTC derivatives markets, IMF Occasional Paper No. 203, Washington: International Monetary Fund. Smyth, N., and A. Wetherilt A. (2011). Trading models and liquidity provision in OTC derivatives markets, Quarterly Bulletin, Bank of England, Vol. 51, Fourth Quarter, pp. 331-340. Tuttle, L. A. (2014). OTC Trading: Description of Non-ATS OTC Trading in National Market System Stocks. White Paper, US Security and Exchange Commission.
Annex 1: Global Liquidity and Average Daily OTC Volumes (USD billion)
(Three-year averages are given in right hand side)
|