Siddhartha Nath, Sreerupa Sengupta and
Sadhan Kumar Chattopadhyay* Received on: January 15, 2022
Accepted on: May 18, 2022 Research and Development (R&D) has been considered as a major driver of productivity to achieve higher economic growth. The low participation of the private corporate sector in R&D activities continues to pose a major challenge, despite significant government initiatives undertaken to strengthen India’s innovation ecosystem. A panel data analysis covering ten emerging market economies and eleven advanced economies shows that a country’s quality of institutions (intellectual property rights, addressing inefficiencies in the legal framework for settling disputes and challenging regulations, and easing of doing business conditions), physical and financial infrastructure, extent of downstream commercialisation (proxied by high-tech exports) and the degree of openness can influence R&D expenditure. Going ahead, further improvements on business regulations, investment in human capital and addressing a range of bottlenecks affecting stalled projects could help to strengthen the innovation ecosystem in India. JEL Classification: O31, O38, O47 Keywords: Innovation, Research & Development, Productivity Introduction The Indian economy witnessed a slowdown in economic growth during 2017-18 to 2019-20 as India’s average annual growth of GDP fell to 5.7 per cent during this period after growing at an average rate of 7.9 per cent during 2014-15 to 2016-17. Evidence based on India’s KLEMS (Capital, Labour, Energy, Materials, and Services) data suggests that this slowdown was mostly driven by the slowdown in total factor productivity (TFP) growth, which broadly measures the growth rates in technology and productivities in an economy. The contribution of TFP to India’s aggregate GDP growth has come down from over 30 per cent to 13 per cent between 2014 and 2017. The neo-classical branch of economics pioneered by Solow (1956), and subsequent literature in endogenous growth theories established that TFP growth is the key driver of economic growth in the long run. More recent empirical studies (e.g., OECD, 2015; ADB, 2017) found empirical support for these hypotheses. Therefore, the slowdown in India’s TFP growth and its shrinking contribution to aggregate GDP growth raises some doubts about the sustainability of India’s growth over the long-term. The endogenous growth theories popularised since the mid-1980s have brought in the concept of productivity of an economy as an endogenous process where investments in human capital, knowledge-based capital, and innovation capacities assume precedence. The endogenous growth models linking innovation to growth were developed in three distinct phases. In the first phase, the AK model of growth hypothesised that higher growth rates of an economy depend on thrift, some of which would finance higher productivity and lead to growth (Romar, 1987; Rebelo, 1991). In the second phase, the endogenous growth model developed by Romar (1990) hypothesised that innovation drives the development of new varieties of intermediate goods, and the greater supply and variety of innovative intermediate goods leads to higher growth. In the third phase, endogenous growth models followed the Schumpeterian approach, where vertical innovations would drive technological knowledge, increase productivity and generate economic growth. Innovation in these Schumpeterian approach-based models is a result of investment in research and development activities. As innovation forms an important pillar for raising productivity, emerging economies have rapidly increased their policy attention to innovation in recent years. India has shown significant advancement in transforming its economy into a knowledge-based economy and turned into one of the prominent global hubs of offshore Information Technology related activities. India has also performed remarkably well in exports of Information and Communication Technology (ICT) based services. Several momentous reforms directed at enhancing the production capacity and raising the trend growth trajectory of the economy are also introduced from time to time. India, however, lags in terms of its expenditure on Research and Development (R&D) relative to other major economies in both public and private sectors (OECD, 2015). Against this backdrop, the paper reviews the progress of innovation activities in India compared to other emerging and developed countries in the recent decade. The main objective of the study is to motivate policy discussions on the state of innovation activities in India. We, therefore, document the more recent patterns of R&D expenditures across countries, and how they compare with the institutions, human, and physical capital across countries. To the best of our knowledge, the latest coverage on India’s aggregate R&D expenditure along similar lines was done by Herstatt et al. (2008). In this paper, we aim to provide an updated comparison of India’s aggregate R&D expenditure vis-à-vis the global leaders and peer countries focusing on the recent decade. An attempt has been made to assess whether the R&D expenditures in aggregate and by the businesses align with several macroeconomic factors like quality of institutions, physical and financial infrastructure, stages of external openness, etc. using data on 21 major emerging and advanced nations between 2007 and 2016. Although our empirical framework broadly follows Furman et al. (2002), to the best of our knowledge, our paper is the first attempt to look at a mixed sample of both emerging and developed nations on this topic1. Even with a mixed sample of developing and developed countries, we find evidence that the variation in R&D expenditure arises due to the quality of institutions, degree of external openness, and level of downstream commercialisation in respect of exports and absorptive capacity. The study is divided into seven sections. Section II provides a brief review of the literature. Section III presents some stylised facts on the status of innovation activities in India and related challenges at an aggregate level. In Section IV, macroeconomic factors explaining the stylised facts have been analysed. Section V describes the data and method of the emperical model. Section VI presents the results. In Section VII, the government measures taken so far in India to boost innovations are discussed. Section VIII concludes the paper with policy suggestions. Section II
Review of Literature – Innovation for Productivity led Growth Innovation is the primary driver of long-term productivity growth and development (Schumpeter, 1934; Freeman and Louçã, 2001). Despite being risky, and prone to failure, innovation is still essential for boosting a firm’s survival, competitiveness, and market power (Porter, 1990; Dodsgon, 2017). Many empirical studies have tried to find the relationship between indicators of innovation (namely R&D expenditure and patenting) and productivity growth. For instance, Westmore (2013) for a set of 19 OECD countries, found a positive link between innovation intensity, and multifactor productivity. Donselaar and Koopmans (2016) established that a 10 per cent increase in R&D investment leads to productivity gains in the range of 1.1 – 1.4 per cent. Coe et al. (2009) found for a sample of 22 developed countries that productivity gains through R&D activities depend on the domestic stock of knowledge as well as R&D spillovers from foreign countries. Some cross-country studies find a virtuous circle where innovation, productivity, and growth reinforce each other. Galindo and Mẻndez (2014) using panel data for 13 developed countries for the period 2002 to 2007, examined the relationship between three variables- entrepreneurship, innovation, and economic growth. The analysis of the study shows that innovation and entrepreneurship have a positive effect on economic growth and also there exists a circular relationship whereby all variables exert a positive effect on each other. Economic activity encourages entrepreneurship and innovation, which in turn, again enhances economic activity. Using firm-level micro data and innovation surveys, Crespi and Zuniga (2012) find a positive association between technological innovation and labour productivity for six Latin American countries- Argentina, Chile, Columbia, Costa Rica, Panama, and Uruguay. For developing countries, a positive association between innovation and productivity has also been found for Malaysia (Hegde and Shapira, 2007); Taiwan (Yan Aw, Roberts, and Yi Xu, 2008); China (Jefferson, Huamao, Xiaojing, and Xiaoyun, 2006); Argentina (Arza and Lo´pez, 2010); and Brazil (Raffo, Lhuillery, and Miotti, 2008). Contrary to the above findings, many recent studies have contested that there exists an ‘innovation-productivity paradox’, which shows that despite rapid progress in existing new technologies like artificial intelligence, digitalisation, and robotics, the trend of global productivity slowdown continues with no signs of reversal in the near short term (Bitard, Edquist, and Hommen, 2008; Lengyel and Leydesdorff, 2011; Fragkandreas, 2013; Fragkandreas, 2021). Studies find that an ageing population, increase in capital deepening, reduced dependence on global value chains, rising income inequalities, and declining business dynamism have led to productivity slowdown worldwide (Syverson, 2017; Crafts, 2018; Goldin et al., 2020). Various studies have tried to identify the factors that drive innovation. The literature shows that firm-level innovation is affected by the development of financial markets (Amore, Schneider, and Zaldokas, 2013; Cornaggia, Mao, Tian, and Wolfe, 2015), institutional ownership (Aghion et al., 2013), bankruptcy laws (Acharya and Subramaniam, 2009) and labour laws (Acharya et al., 2014). Although the literature on factors influencing innovation is quite vast, it is very limited for India. One pioneering study made for India is Herstatt et al. (2008) which examined the elements and inherent strengths and weaknesses of India’s innovation system, particularly in knowledge-intensive sectors. Kale and Rath (2018) is another macro-level study that constructs an innovation index at an aggregate level and finds a cointegrating relationship between innovation and total factor productivity for India. There are some other studies available for India but those are at the firm level. For instance, studies by Parameswaran (2009), Goldberg et al. (2010), and Topalova and Khandelwal (2011) for manufacturing firms have found that the import of foreign technology has a positive impact on a firm’s productivity. Studies have shown that R&D investment leads to a higher market value of a firm’s stocks than investment in tangible assets (Chadha and Oriani, 2009). Most of these studies are sector-specific covering pharmaceutical and electronic industry sectors (Sarkar and Sarkar, 2005; Chatterjee, 2007) and do not cover the macro scenario that affects innovation capacity across all sectors of the economy. To fill this gap in the literature, this paper analyses the macroeconomic determinants of innovation with a special focus on India. It is important to note here that this paper does not look into innovation -productivity linkage but tries to identify the macroeconomic characteristics that affect the innovation capacity of a country. The empirical analysis in the paper takes R&D expenditure for a set of countries as a proxy for innovation and tries to understand the association of R&D expenditure with macroeconomic characteristics like strengths of a country’s institutions, physical and financial infrastructures, quality of governance, human and physical capitals, and absorptive capacities. Section III
Stylised Facts Better productivity performance of a nation can be directly linked with higher innovation activities (Hall, 2011). To set the context of our paper, we first compare the total factor productivity (TFP) indices for the years 2014-19 with the base year 1950 for major countries (Chart 1). It shows that India’s TFP remained below the major developed and emerging economies in this period. In terms of productivity contribution to output growth, during 1995- 2001, TFP accounted for about 23 per cent of the aggregate GDP growth in India (Chart 2). This ratio fell to below 10 per cent between 2002 and 2015. Notably, between 2000 and 2011, India witnessed a significantly high rate of growth in aggregate GDP, barring two years of the Global Financial Crisis. This incremental growth was driven largely by factor accumulation, mainly the capital stock. The role of technological progress and productivity in aggregate growth has been, in fact, muted in recent decades. 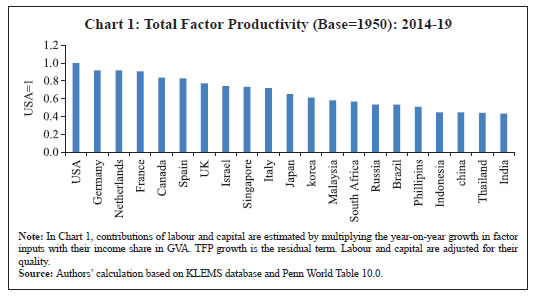
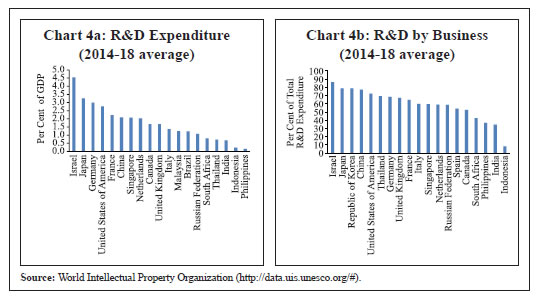
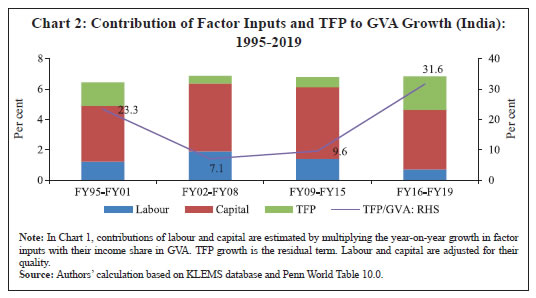 Chart 3 indicates that India ranks very low in terms of patent applications. The filing of Intellectual Properties (IP) in categories of trademarks and industrial designs during the last decade has remained far below that of other major economies (Table 1). Although the levels of patent applications have been lower in India than in other countries, but opportunities do remain. The Intellectual Property Patent and Trademark filings by India have grown on an average by 9.8 per cent and 8.5 per cent per year in the year 2007 and 2019, respectively, much faster than the developed countries such as the USA, the UK, Japan, and Germany. In the category of Industrial design too, India has experienced an annual average growth of 6.8 per cent during the same period (Table 1).  The innovation process in India is plagued by low investment. The R&D expenditures in India stood at 0.68 per cent of GDP between 2014 and 2018, compared with, for example, over 2 per cent for both China and Singapore, and over 3 per cent for Japan and Israel (Chart 4a)2. The participation by industries and corporations particularly is remarkably low, as compared to the other emerging economies (Chart 4b). Herstatt et al. (2008) mentioned that the industrial sector devoted only 0.47 per cent of its sales turnover to R&D efforts during most of the early 2000s. Perhaps, one possible explanation of why R&D expenditure in India in relation to its GDP is lower than the other emerging economies is the low participation of industries and corporates in the R&D activities. Moreover, it was observed that in India, the linkages between industry and academia are far from optimal (Forbes, 2016). Often, universities lack adequate resources and incentives - plagued with limited interaction with the industries and markets (CII, 2007). One of the major challenges in scaling up innovation in India, therefore, is to ensure the larger participation of industries and corporates in R&D activities. | Table 1: IP Fillings (Residents+ Abroad) | | (in ’000) | | Types | Year | 2007 | 2010 | 2014 | 2017 | 2018 | 2019 | Annual Average Growth between 2007 and 2019
(per cent) | | Patent | India | 10.5 | 14.9 | 22.4 | 28.0 | 30.0 | 34.1 | 9.8 | | China | 161.3 | 308.3 | 837.8 | 1306.1 | 1460.2 | 1328.1 | 17.6 | | USA | 437.7 | 433.1 | 509.5 | 525.5 | 515.2 | 521.7 | 1.5 | | UK | 50.1 | 50.9 | 52.6 | 53.8 | 56.2 | 54.8 | 0.8 | | Japan | 508.3 | 468.4 | 466.0 | 460.8 | 460.4 | 453.8 | -0.9 | | Germany | 163.9 | 173.7 | 179.5 | 176.4 | 180.1 | 178.4 | 0.7 | | Trademark | India | 125.1 | 181.6 | 218.8 | 262.0 | 319.2 | 348.7 | 8.5 | | China | 656.7 | 1054.8 | 2147.4 | 525.9 | 606.8 | 642.8 | -0.2 | | USA | 780.7 | 726.3 | 902.1 | 975.0 | 1024.9 | 1071.3 | 2.6 | | UK | 310.8 | 298.3 | 432.4 | 421.2 | 438.7 | 440.1 | 2.9 | | Japan | 206.6 | 194.4 | 220.4 | 275.2 | 270.5 | 279.0 | 2.5 | | Germany | 574.9 | 629.9 | 656.6 | 742.3 | 748.5 | 765.8 | 2.4 | | Industrial Design | India | 4.8 | 5.0 | 7.4 | 9.2 | 10.5 | 10.9 | 6.8 | | China | 262.4 | 421.4 | 575.3 | 722.1 | 825.8 | 900.7 | 10.3 | | USA | 76.9 | 86.9 | 111.2 | 128.1 | 132.4 | 133.5 | 4.6 | | UK | 54.0 | 51.2 | 57.0 | 65.6 | 55.7 | 54.9 | 0.1 | | Japan | 68.4 | 67.6 | 70.3 | 71.5 | 68.1 | 66.8 | -0.2 | | Germany | 109.4 | 118.6 | 128.7 | 130.9 | 125.1 | 124.6 | 1.1 | Note: Applications by residents includes application filed with an IP office by an applicant residing in the country/region in which that office has jurisdiction.
Source: World Intellectual Property Organization. |
 Section IV
Macro Economic Factors affecting Innovation The seminal work by Solow (1956) pointed out that technological progress is the primary factor which results in sustained growth in total factor productivity. In the empirical literature, the aggregate R&D expenditures and the number of patent applications have continued to remain predominant indicators of how a country makes effort towards technological progress (see OECD, 2015). In this vein, our paper attempts to understand the recent progress made in innovation. We emphasise on two questions: (i) what the broad patterns in R&D expenditures across the major economies are and where exactly does India stands; and (ii) how do the R&D expenditures across the countries compare when we consider the differences in their socio-economic factors. A large body of empirical literature including Jones (1981), North (1980, 1981), Fischer et al. (1996), Easterly and Levine (2003), Rodrik et al. (2004), Beck and Laeven (2006), etc. suggest that good institutions promote innovation and foster economic growth. Furman op. cit. (2002) explains that better institutions promote R&D productivity by enhancing IP protection, enhancing openness to international trade and investment that enable technological diffusion from globally frontier firms to domestic leaders (OECD, 2015), creating an environment for better collaboration between different types of institutions and fostering competition, etc. This literature adequately argues why institutions might be associated with innovation capabilities. Hence, in our subsequent discussions, we focus on several measures of institutions to draw upon the cross-country variations in R&D expenditures. As regards the role of investment and finance, this can be broadly divided into two aspects. First, how the country fares with the rest in terms of its initial conditions. This can be demonstrated through the availability of good physical infrastructure, e.g., roads, railways, communication, etc. that facilitate the movement of goods, people, and ideas. Second, how much the country can support the further development of these infrastructure facilities, that is measured by the development of financial infrastructure. In this regard, Huffman (2007, 2008) suggested theoretical frameworks that demonstrate the role of investment-specific technological progress in the aggregate growth process by incorporating innovation into endogenous growth theories. The simulations by Bishnu et al. (2016) extend support for the investment-led innovation and growth process suggested by Huffman (2008), drawing upon the role of efficient taxation of capital on innovation processes. This motivates us to look at the variables like FDI, physical and financial infrastructure, and corporate tax rates in explaining the variation in R&D expenditures. The works of Lucas (1988) built on Uzawa (1965) proposed a theoretical framework where technological change is being driven by human capital in an economy, where human capital is associated with better utilisation of existing knowledge and technologies. Hartwig (2014) extends support to the Uzawa-Lucas hypothesis and highlights the cross-country differences in public education expenditure as a factor behind variations in economic growth among the OECD countries. This motivated us to look at variations in school enrollments and public expenditures across countries and compare them with their aggregate R&D expenditures. Furman op. cit. (2002) suggested that the per-capita GDP and the downstream commercialisation i.e., the share of high-tech exports as a percentage of GDP act more as the factors driving the demand for improved technologies, and therefore are included in our estimates too. Based on the available estimates, we too expect positive relationships of per-capita GDP and the high-tech exports’ share in GDP with the aggregate R&D expenditures. Our empirical estimations are motivated by Furman op. cit. (2002), which provide estimates for the effects of these above-mentioned factors, namely the institutions, physical capital and human capital, on innovation outcomes. An analysis of macroeconomic characteristics affecting innovation suggests that India’s lower rank in gross expenditure on R&D as per cent of GDP (8th out of 11) in recent years is broadly consistent with the country’s weaker relative position in terms of its institutions, infrastructure, human capital and per-capita income among the emerging economies. It is worth noting that although India’s rank is very low in terms of aggregate R&D expenditure, it is relatively better placed in terms of institutions (7th), infrastructure (4th), and financial development (5th). The government’s endeavour in enhancing human capital is visible through considerable expenditure on education. India ranks 7th out of 11 economies in terms of government expenditure on education as a percentage of GDP despite its low rank in per-capita GDP. India ranks slightly better in aggregate R&D spending (8th out of 11) as compared to business participation in R&D (9th out of 10 -Table 2). India lags behind several peer-economies in the protection of intellectual property and minority shareholders’ interest, time taken to start a business, the corporate taxation policy, etc. (Table 3). India also lags in auditing and reporting standards and efficacy of corporate boards. Notably, the country is placed significantly ahead of other emerging economies in university-academia collaboration, ethical behaviour of firms, efficiencies of the legal framework in challenging regulation and settling disputes, and in protecting investors. | Table 2: Macroeconomic Characteristics and Innovation (2014-2018 average) | | Country | R&D Exp (% of GDP) | R&D Exp by Business (% of Total) | Institution related to Business GCI Rank (World) | Infrastructure GCI Rank (World) | Financial Development GCI Rank (World) | School Enrollment, Tertiary (% Gross) | Fiscal Balance (% of GDP) | Govt. Spending on Education (% of GDP) | GDP Per Capita (Logarithm) | | Brazil | 1.2 | - | 92 | 79 | 54 | 43.1 | -8 | 6.2 | 9.6 | | China | 2.1 | 77.3 | 62 | 32 | 31 | 47.2 | -3.2 | 1.9 | 9.5 | | India | 0.7 | 34.6 | 52 | 66 | 36 | 34.5 | -6.8 | 3.8 | 8.7 | | Indonesia | 0.2 | 8.2 | 49 | 73 | 53 | 26.9 | -2.3 | 3.4 | 9.3 | | Israel | 4.5 | 86.5 | 26 | 22 | 23 | 64.4 | -1.9 | 5.9 | 10.5 | | Malaysia | 1.2 | 50.8 | 25 | 31 | 15 | 44.1 | -2.6 | 4.8 | 10.2 | | Philippines | 0.2 | 36.9 | 96 | 95 | 41 | 35.6 | -0.2 | 2.5 | 9 | | Russia | 1.1 | 58.7 | 75 | 51 | 89 | 81.1 | -1.3 | 4.1 | 10.2 | | Singapore | 2.1 | 59.5 | 3 | 1 | 3 | 85.9 | 4 | 2.9 | 11.4 | | South Africa | 0.8 | 42.6 | 60 | 65 | 17 | 49.7 | -4.3 | 6 | 9.4 | | Thailand | 0.7 | 69.4 | 65 | 63 | 14 | 21.7 | -0.1 | 4.1 | 9.7 | | India's rank among 11 EMEs | 8 | 9 | 7 | 4 | 5 | 9 | 10 | 7 | 11 | Notes: i) GCI: Global Competitiveness Index.
ii) A higher figure for the rank indicates a weaker position.
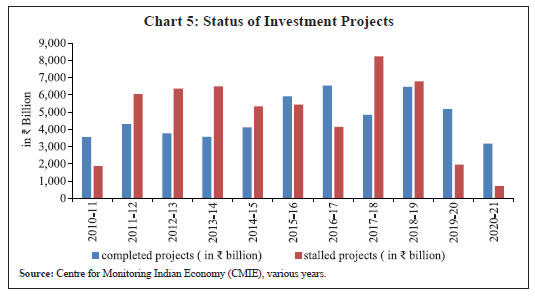
Source: Global Competitiveness Reports, various issues; IMF, OECD, and WIPO. | India ranks 63rd within a set of 190 countries3 on Ease of Doing Business4, and has improved its ranking by 79 positions in five years from 2014 to 2019. Despite improvements in the Ease of Doing Business rank, Indian companies face challenges in the procurement of construction permits. The number of ‘stalled’ projects5 also corroborate the fact that there exist impediments which hinder the progress of businesses in India. Based on the data released by the Centre for Monitoring Indian Economy (CMIE), the number of completed projects declined in 2019 -20 and 2020-21 as compared to previous years (Chart 5). Almost 1/5th of those projects are ‘stalled’ due to various reasons, such as ‘land acquisition problems’, and ‘lack of environmental clearances’. Table 3: Institutions Affecting Business and Innovation: World Ranking of Emerging Economies
(Average 2014 to 2018) | | Country | IP Protection | Investor Protection | Minority Shareholders’ Interest | Univ.- Industry collaboration | Auditing & reporting standards | Efficacy of Corporate boards | Challenging Regulations | Settling disputes | Ethical behaviour of firms | Days to start business | Total tax rate (% of profits) | | Brazil | 78 | 40 | 67 | 67 | 60 | 75 | 101 | 117 | 124 | 136 | 134 | | China | 57 | 101 | 56 | 31 | 75 | 106 | 47 | 48 | 54 | 118 | 131 | | India | 52 | 15 | 56 | 38 | 83 | 95 | 34 | 42 | 51 | 110 | 125 | | Indonesia | 47 | 58 | 44 | 30 | 76 | 61 | 42 | 48 | 44 | 122 | 42 | | Israel | 24 | 9 | 27 | 5 | 21 | 56 | 33 | 39 | 38 | 74 | 37 | | Malaysia | 25 | 4 | 16 | 12 | 27 | 23 | 16 | 17 | 24 | 39 | 75 | | Phillippins | 71 | 114 | 49 | 58 | 47 | 40 | 76 | 95 | 64 | 117 | 93 | | Russia | 110 | 75 | 115 | 56 | 103 | 67 | 94 | 91 | 68 | 66 | 106 | | Singapore | 4 | 2 | 7 | 6 | 5 | 8 | 15 | 1 | 3 | 5 | 15 | | South Africa | 26 | 15 | 9 | 30 | 8 | 11 | 18 | 17 | 45 | 109 | 34 | | Thailand | 111 | 25 | 34 | 43 | 48 | 75 | 66 | 55 | 90 | 110 | 35 | | India's rank among 11 EMEs | 6 | 5 | 9 | 7 | 10 | 10 | 5 | 5 | 6 | 7 | 9 | Note: A higher figure for the rank indicates lower performance.
Source: Global Competitiveness reports, various issues. |
 Section V
Empirical Model, Data and Methodology V.1 Methodology Available literature suggests that innovation activities are largely driven by the strengths of a country’s institutions, physical and financial infrastructures, quality of governance, human and physical capitals, and ‘absorptive capacities’ (Furman et al., 2002; Castellacci and Natera, 2013). In this section, we examine whether the differences in innovation activities across a set of developed and emerging countries can be explained by their differences in these characteristics. We estimate an econometric model to test whether certain country-specific characteristics can explain the cross-country variations in R&D expenditures. Our first empirical specification broadly follows Furman et al. op. cit. (2002) except that we replace the number of patent applications as used in the mentioned study with R&D expenditure as per cent of a country’s GDP as the dependent variable in the model. Model 1: The model is as follows: 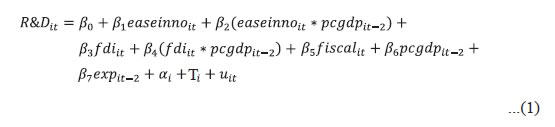 where, subscripts i and t represent country and year, respectively. Our data is panel data that consists of annual estimates of R&D expenditure and some country characteristics for 10 emerging economies6 and 11 developed economies7 between 2007 and 2016. The explanatory variable easeinno summarises the qualities of a country’s institutions viz the quality of governance, physical infrastructure, and financial infrastructure. This variable is a linear combination of country scores on the qualities of institutions, physical infrastructure, and financial infrastructure as provided by the World Economice Forum. The explanatory variables fdi and fiscal are net foreign direct investment (FDI) inflows as per cent of a country’s GDP to approximate a country’s openness to foreign technologies, and fiscal balance as per cent of GDP as a proxy measure of the government’s fiscal space while proxies for fiscal space towards undertaking expenditure on R&D, respectively. The variable pcgdp is the log of real per capita GDP at purchasing power parity, which is a proxy for a country’s ‘absorptive capacity’. According to Castellacci and Natera (2013), higher aggregate income creates demand for improved goods and services in the long run, incentivising innovation. So, in the long run, we should observe a positive association between R&D expenditure and the country’s per capita GDP. The variable exp is the exports of high-tech manufactured goods as per cent of a country’s GDP. According to Furman op. cit. (2002), innovation “influences downstream commercialisation, such as achieving a high market share of high-technology export markets”. In the long run, therefore, one can expect some positive association between ‘downstream commercialisation’ and aggregate innovation activities. We use exports of high-tech manufactured items as per cent of GDP as a measure of ‘downstream commercialisation’. We also include interaction terms of all these explanatory variables with the 2-years lagged per capita real GDP at purchasing power parity to see if these effects vary depending on the stage of development (Furman et al., 2002; World Bank, 2018). In our panel data, we control for any unobserved time-invariant country-specific characteristics through the country-specific dummy variable αi and unobserved year-specific shocks that are common across all countries by year-specific dummy variable Tt. There can be potential bi-directional causality between R&D expenditure and per capita GDP and between R&D expenditure and exports of high-tech manufactured products (Mowery and Oxley, 1995; Furman et al., 2002). In order to avoid this problem, we have included only second lags of both the variables pcgdp and exp in our set of explanatory variables. We used only the contemporaneous form of the other variables like institutions and infrastructure as they evolve over a very long period of time and thus are less likely to be correlated with any shocks to the innovation at period t. Model 2: In the second model, we replace the dependent variable R&D with R&Dbus which measures the percentage share of R&D expenditure by the private corporate sector in a country’s aggregate R&D expenditure. The explanatory variables, set of countries and the sample period, however, remain same as in Model (1). Model (2) takes the following form: In our models, the dependent variables are in percentage form, i.e., R&D expenditure as per cent of GDP, or per cent of aggregate R&D expenditure coming from the private corporate sector. Hence these variables vary between 0 and 1. As the assumption of normally distributed residuals would no longer be valid, the statistical tests on ordinary least square coefficients would become invalid. Therefore, we provide maximum likelihood estimates for these models that are consistent and asymptotic normal (Gourieroux and Monfort, 1981), enabling us to interpret the standard tests of statistical significance.8 The issue of endogeneity could arise due to the correlation of error term with any of the explanatory variables, viz., the FDI inflows, the fiscal balances, exports and per-capita GDP. This occurs when some unobserved factor determining the dependent variable (R&D expenditures in this case) is also correlated with these explanatory variables. In most empirical research, it becomes difficult to directly control for these factors, and therefore, they become part of the error term, in turn making the error term correlated with the regressors. The presence of this ‘endogeneity’, would make the coefficients biased and inconsistent. The scope of research are also not free from this issue. In the presence of endogeneity, we could have used a Generalised Method of Moments (GMM) or any other instrumental variable approaches. However, in our case, we could not use them since we have data only for a limited number of years. So, we use the following steps to make sure that our estimates are free from biases as much as possible. First, in a panel setup, we use year-specific dummy variables as regressors that account for any year-specific unobserved shocks. So, any unobserved common shocks across all countries are accounted for. Second, any factor that consistently influences the regressors could be very well related to the characteristics of the institutions in that country evolving over time. In most empirical research, it becomes challenging to quantify the time-varying characteristics of the institutions and, therefore, they remain missing from the regressions. However, the unique feature of the data that we use is that it enabled us to directly control for the institutions over time, that we disscuss in the next sub-secton. Since this variable captures a large part of the institutional qualities over time, the presence of any unobserved factor affecting the other macroeconomic variables viz. FDI and fiscal balance are minimised. Therefore, in our belief, we reduce the possibilities of ending up with endogeneity on FDI and fiscal balance to a large extent. Third, we have used the second lags of exports and per-capita GDP as our regressors. Any contemporaneous unobserved shocks would not have any correlation with the two-years lagged exports and per-capita GDP. Therefore, these two coefficients are likely to be free from the bias that may occur due to endogeneity. V.2 Data The data for the empirical analysis is obtained from multiple sources. The explanatory variable easeinno is a linear combination of country scores on the quality of institutions, physical infrastructure, and financial infrastructure. The scores on the quality of physical and financial infrastructures are directly available from several rounds of Global Competitiveness Reports published by the World Economic Forum. For country score on the quality of institutions, we take the average of individual scores on the following aspects: protection of intellectual properties, minority shareholders’ interest, investor strength, efficiencies of legal frameworks in settling disputes and challenging regulations, ethical behaviour of firms, the strength of auditing and reporting standards, the efficacy of corporate boards, taxes on profits, number of days to start businesses, and university-industry collaboration. The country scores on each of these aspects of the institutional quality are directly available from the Global Competitiveness Reports. Finally, we take a linear combination of the constructed country score on the quality of institutions, and the country scores on the physical and financial infrastructures obtained from the Global Competitiveness Reports. We use 0.88, 0.59 and 1.00 as the weights for country scores on financial infrastructure, physical infrastructure, and institutions, respectively. To obtain these weights, we use a principal component analysis (PCA) for these variables across all countries from the period 2007 to 2016. These weights are the corresponding factor loadings from this PCA. Therefore, our constructed explanatory variable easeinno is an underlying common factor that summarises variations in the quality of institutions, financial and physical infrastructure. We obtain net FDI inflows as per cent of GDP from the World Development Indicators, World Bank and gross fiscal balance as per cent of GDP from the IMF’s World Economic Outlook database. We obtain real per capita GDP at purchasing power parity from the World Development Indicators database, World Bank. The export of high-tech manufactured goods is obtained from the UNComtrade database and includes chemicals (except Pharmaceutical, fertilisers, and explosives), electrical equipment, electronics, rail, automobile, ships and aircraft equipment, clocks, watches, musical instruments, toys, and games accessories9. We exclude exports of items, such as explosives, weapons, etc., where cross-border applies. Section VI
Results We present the estimation results from the first model (equation (1) in the previous section) in Table 4. Our estimates in Table 4 suggest that the availability of better institutions and infrastructure are associated with higher aggregate R&D spending as per cent of GDP. The estimated coefficients of easeinno are positive and statistically significant in both Models 1 and 2. The interaction of easeinno with lagged per-capita real GDP suggests that the richer countries generally tend to have a lower impact of additional improvement in their institutions and infrastructure on their innovation activities than the developing countries. In other words, developing countries tend to benefit more from their institutional reforms and infrastructure up-gradation, than their developed counterparts. Higher net FDI inflows as per cent of GDP are estimated to be positively associated with higher aggregate R&D expenditure as per cent of GDP for the set of countries and the coefficient is robust in all the specifications. The interaction of this variable with lagged per-capita real GDP suggests that the richer countries generally tend to have a lower impact of FDI inflows on their innovation activities than the developing countries. The aggregate R&D expenditure is estimated to be positively associated with both ‘absorptive capacity’ measured by real per capita GDP and ‘downstream commercialisation’ measured by the share of high-tech manufacturing products as per cent of a country’s GDP. Our estimates suggest that a better fiscal balance, or a lower fiscal deficit, is associated with higher R&D expenditure as per cent of GDP. However, the coefficient has a high standard error, which indicates that the relationship may vary significantly across countries. We observed a positive association between corporate tax rate and aggregate R&D expenditure, but the coefficient is very small. This finding indicates that the tax rate may not be a deterrent to higher R&D expenditure. Lastly, the higher time required to start a business is associated with reduced aggregate R&D expenditure as per cent of GDP. | Table 4: Macroeconomic Characteristics and R&D Expenditure-Cross Country Evidence | | | (1) | (2) | | Baseline Model | Additional Controls | | Dependent Variable: R&D Expenditure as per cent of GDP | | Factor: Ease of Innovation | 1.05***
(0.28) | 1.04***
(0.27) | | Ease of innovation interacted with Log of per capita real GDP at PPP(-Lag 2) | -0.12***
(0.028) | -0.11***
(0.027) | | Net FDI inflows as per cent of GDP | 0.33***
(0.087) | 0.38***
(0.085) | | Net FDI inflows as per cent of GDP interacted with Log of per capita real GDP at PPP-Lag 2 | -0.031***
(0.0081) | -0.036***
(0.0079) | | Fiscal balance as per cent of GDP | 0.0098*
(0.0054) | 0.0093*
(0.0052) | | Exports of high-tech manufactured goods as per cent of GDP(-Lag 2) | 0.011***
(0.0032) | 0.011***
(0.0031) | | Log of per capita real GDP at PPP(-Lag 2) | 2.38***
(0.33) | 2.43***
(0.32) | | Tax on Business | | 0.0049**
(0.0025) | | Time to Start Business | | -0.10***
(0.035) | | Number of observations | 192 | 192 | | LR chi2 | 267.9 | 282.32 | | Prob> LR chi2 | 0.00 | 0.00 | Notes: (i) ***, ** and * indicate statistical significance of the coefficients at 1, 5 and 10 per cent, respectively. Standard errors are in parentheses.
(ii) PPP: Purchasing Power Parity.
(iii) We carried out Hausman specification tests following Hausman (1978) that failed to reject random effects. The unit root tests for the explanatory variables suggested that all are stationary at their levels. For the dependent variables, as there are missing observations, no formal test for unit root could be performed. Hence, we include the deterministic trend in all our models. The deterministic trends, however, turned out to be statistically insignificant and is not reported. | In the previous section, we have discussed the issues of probable biases in these estimates that can arise due to several factors such as two-way causalities, the unobserved factors that strongly influence both R&D and the regressors, etc. We have also discussed how we make our best attempts to overcome them. Now, even if we are left with any unobserved factor that may be positively associated with the aggregate R&D expenditures, can also be assumed to have a positive association with the explanatory variables. When there is a positive correlation between the explanatory variables and the error terms, the estimated coefficients tend to be biased downward. In our case, our estimated coefficients in Table 4 are positive, even with a negative bias. Had we been able to completely remove the endogeneity, the coefficients would have been higher (or more positive). Therefore, in our present case, despite any possible endogeneity issue, the evidence suggest that higher aggregate R&D expenditures are generally associated with better institutions, higher exports, per-capital GDP and FDI inflows. As a study focused mostly on examining whether cross-country variation in R&D expenditures are consistent with the country-characteristics, we tolerate some degree of endogeneity as long as it does not hamper the main takeaway on the public policy guidance. The estimated coefficients from the second model (i.e., equation (2) in the previous section) are provided in Table 5. In this model, we regress the same set of explanatory variables as in the previous model (i.e., equation (1)) on R&D expenditure by the private corporate sector as per cent of total R&D expenditure in a country. Unlike in Table 4, our estimates in Table 5 do not suggest any significant association of business participation in overall R&D activities with the country’s institutions, infrastructure, and ‘absorptive capacities’. In an alternative specification in Table 5 (model 3), we control for the stochastic trend in the dependent variable. The coefficients of the other dependent variables, however, do not show much improvement. The ‘downstream commercialisation’, on the other hand, is estimated to be positively associated with higher participation by businesses in R&D. The coefficients are observed to be robust and statistically significant in alternative specifications. The coefficients of net FDI inflows and fiscal balance, both as per cent of GDP, are not found to be robust across different specifications. | Table 5: Macroeconomic Characteristics and Business participation in R&D-Cross Country Evidence | | | (1) | (2) | (3) | | Baseline Model | Additional Controls | With R&D Lag | | Dependent Variable: Share of Private Corporate in Aggregate R&D | | Factor: Ease of Innovation | -8.84
(7.91) | -8.06
(7.79) | -10.9*
(6.34) | | Ease of innovation interacted with Log of per capita real GDP at PPP- Lag 2 | 0.71
(0.79) | 0.62
(0.77) | 1.01
(0.62) | | Net FDI inflows as per cent of GDP | 4.31*
(2.53) | 3.11
(2.53) | 3.14*
(1.88) | | Net FDI inflows as per cent of GDP interacted with Log of per capita real GDP at PPP- Lag 2 | -0.40*
(0.24) | -0.29
(0.24) | -0.29*
(0.18) | | Fiscal balance as per cent of GDP | 0.29*
(0.17) | 0.28*
(0.17) | 0.19
(0.12) | | Fiscal balance as per cent of GDP - Lag 2 | 0.048
(0.15) | 0.10
(0.15) | -0.071
(0.11) | | Exports of high-tech manufactured goods as per cent of GDP- Lag 2 | 0.28***
(0.090) | 0.28***
(0.089) | 0.24***
(0.062) | | Log of per capita real GDP at PPP - Lag 2 | 1.71
(9.19) | 0.69
(9.05) | -6.65
(6.69) | | Business R&D as per cent of GDP- Lag 2 | | | 0.61***
(0.068) | | Tax on Business | | -0.082
(0.070) | 0.027
(0.050) | | Time to Start Business | | 1.99**
(1.01) | 0.099
(0.73) | | Number of observations | 181 | 181 | 174 | | LR chi2 | 160.0 | 166.18 | 229.43 | | Prob> LR chi2 | 0.00 | 0.00 | 0.00 | Notes: (i) ***, ** and * indicate statistical significance of the coefficients at 1, 5 and 10 per cent, respectively. Standard errors in parentheses.
(ii) We carried out Hausman specification tests following Hausman (1978) that failed to reject random effects. The unit root tests for the explanatory variables suggested that all are stationary at their levels. For the dependent variables, as there are missing observations, no formal test for unit root could be performed. Hence, we include the deterministic trend in all our models. The deterministic trends, however, turned out to be statistically insignificant and is not reported. | Section VII
Role of Public Policy in Promoting Innovations The Government of India has played a promotive role in creating social and institutional infrastructure to foster innovations in the country, which can be divided broadly into two categories; first, in-house research carried out by several departments within the government and second, modernising National Innovation Systems to develop social and institutional infrastructure to create fair opportunities for innovations by commercial entities. India’s domestic institutions like the Indian Space Research Organization, Defence Research and Development Organisation, Centre for Development of Advanced Computing, etc. have achieved remarkable milestones of international standards. The government of India has created six departments, viz. the department of atomic energy, biotechnology, earth science, science and technology, scientific and industrial research, and the department of space, dealing exclusively with matters of innovations. Additionally, the ministries such as Defence, Agriculture and Farmers’ Welfare, Chemicals and Petrochemicals, etc. have carried out major R&D operations in the past. Together, these efforts have not only fostered technological progress in the concerned fields but also have built up a macro-environment which encourages innovations by the industries. The government’s major role in the innovation system rests in formulating policies that are conducive to innovation, reward industrial quest for innovative products, create institutional frameworks which support basic and advanced research in universities as well as industrial R&D, encourage innovations in small and medium scale enterprises, invite and incentivise foreign direct investment, to name a few. In this direction, the government of India has analysed and modified its policy stances from time to time to foster the ease of doing business, expanding operations, and thereby creating innovation opportunities. The government of India embarked on a path of ‘liberalisation’ way back in 1991, progressively reduced barriers to cross-border movements of goods, services and financial resources; and relaxed many of the internal barriers such as ‘industrial licenses’, which earlier controlled the setting up of new businesses and the expansion of existing ones. The Indian government has consistently worked towards providing appropriate legal framework by enacting laws to address emerging issues in the field of innovation. An example of this was enacting the ‘Electronic Commerce Act’ as early as 1998 and the ‘Information technology Act’ in 2000, which sought to ‘provide legal recognition for transactions carried out by means of electronic data interchange’ (Herstatt et al., 2008). Undoubtedly, these early measures helped India to become one of the leading exporters of Information Technology services in 21st country. Similarly, in the field of biotechnology, the government enacted the ‘Environment (protection) Act’ as early as 1986 to formulate legal protection for the sector. India has also taken decisive steps towards protecting the Intellectual Property Rights (IPRs) of the innovators by making several treaties with advanced countries, and multinational institutions concerning the IPRs. India’s pool of skilled labour is often cited as the single largest asset (Herstatt et al., 2008). The Indian government has also set a path for greater collaboration with foreign research institutions, such as the German Academic Exchange Service (DAAD), and the German Research Foundation (DFG), to name a few. India has consistently featured among the fastest-growing economies in the world since the early 2000s. According to the Global Competitiveness Report 2017-18, India ranked the 3rd largest potential market in the world and 29th for ‘innovation’ factors. In terms of research output, India witnessed significant growth in scientific research publications. The number of scientific publications increased by 50 per cent from 90,864 in 2011 to 1,36,238 in 2016 in SCOPUS database; by 36.5 per cent from 47,081 in 2011 to 64,267 in 2016 in Science Citation Index (SCI) database, and by 83.1 per cent from 74,143 in 2011 to 1,35,788 in 2018 in National Science Foundation (NSF) database. In 2018, India ranked 3rd, 5th and 9th in scientific publication output as per the NSF, SCOPUS and SCI databases, respectively (Chart 6). Through recent initiatives like ‘Aatmanirbhar Bharat’, ‘Make in India’, ‘Production Linked Incentives (PLI) schemes’, there has been a strong push to empower domestic manufacturing sectors and foster innovations. The basic objective of the ‘Make in India’ initiative is to play a bigger role internationally by enhancing participation within Global Value Chains by leveraging competitiveness in certain export-oriented activities (OECD, 2014)10. However, to achieve this huge investment in R&D is required, including all fields e.g., ICT, data, design, skills, branding, and new organizational processes (OECD, 2014 op. cit). India has launched several significant initiatives like ‘Accelerating Growth of New India’s Innovations’ (AGNi), ‘Startup India’ mission, and ‘Atal Tinkering Labs Initiative for fostering innovation capabilities etc. With around 50 thousand startups, India has become the third-largest startup economy after the USA and the UK11. As per the Global Innovation Index (by WIPO), India has climbed up to 46th position in 2021, from 81st position in 2015, driven by a vibrant start-up ecosystem. Further, the recently launched ‘Science, Technology and Innovation Policy’ (STIP), 2020 has the vision to position India among the top three scientific superpowers in the decades to come. 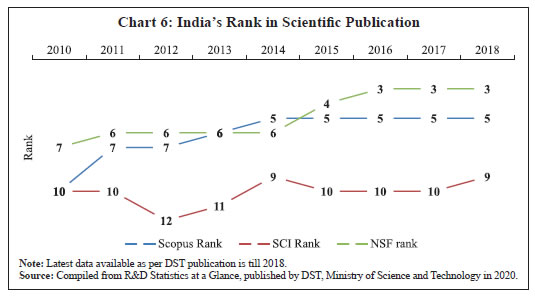 The government has a dominant share (over 60 per cent) in the nation’s aggregate R&D spending12. There are remarkable efforts made by the government and the industrial bodies to enhance the industry-academia collaboration and encourage innovations in the private sector. Industry associations such as the Federation of Indian Chamber of Commerce and Industry (FICCI), Confederation of Indian Industries (CII), National Association of Software and Services Companies (NASSCOM), Society of Indian Automobile Manufacturers (SIAM), etc. have periodically taken lead initiatives in academic collaboration, policy initiatives, process standardisation and improvement. To boost investment in innovation activities, several fiscal incentives are offered by the Government. Financial institutions like Small Industries Development Bank of India (SIDBI) and Industrial Development Bank of India (IDBI) lend support for innovation and entrepreneurship activities. The Technology Development Board (TDB), which is an important stakeholder in the Indian innovation ecosystem, provides soft loans and promotes the equity of Indian industry through the development and commercialisation of indigenous technologies. Biotechnology Industry Research Assistance Council (BIRAC) supports high-risk, early starters from academia, start-ups, or incubators that have exciting ideas in the nascent or planning stage. Several public-private partnership mechanisms such as National Skill Development Corporation (NSDC) and Global Innovation and Technology Alliance (GITA) also provide funding for skill development and bilateral and multilateral joint R&D programs, respectively. An improved ecosystem of IP protections, industry-academia collaboration and investor protection could pave the way for greater innovation activities in the private sector. Studies highlight that institutions and business sophistication are important pillars to improve innovation performance in developing countries (Acharya and Subramanian, 2009; Acharya et al. 2013, 2014). The Economic Survey 2021 rightly emphasised that aspects supported by estimates suggesting that one standard deviation improvement in the rank on ‘institution’ can lead to an improvement in the innovation output rank by 5 percentage points. Similarly, one standard deviation improvement in business sophistication rank can augment innovation output rank by 3 percentage points. Section VIII
Conclusion Though, India lags behind other emerging and developed nations in innovation activities, measured by the number of intellectual property applications for patents, trademarks, and industrial designs, the trend has been on upward trajectory. The low innovation activities are reflected in the country’s low aggregate R&D expenditure (as per cent of GDP). Business participation in overall R&D is particularly low in India compared to many other emerging economies. Empirical estimates suggest that the aggregate R&D activities are broadly influenced by the quality of the countries’ institutions, physical and financial infrastructures, ‘absorptive capacities’ for innovation, the extent of ‘downstream commercialisation’, and degree of openness. Improvements in business regulations and human capital can help in strengthening conditions to promote innovations in India.
References Acharya, V. V., Baghai, R. P., & Subramanian, K. V., (2010), Labour laws and innovation, NBER working paper series, no. 16484. Acharya, V. V., Baghai, R. P., and Subramanian, K. V. (2014). Wrongful Discharge Laws and Innovation. Review of Financial Studies, 27(1), 301-346. Acharya, V. V., and Subramanian, K. V. (2009). Bankruptcy Codes and Innovation. Review of Financial Studies, 22(12), 4949-4988. Acs, Z.J. and Autio, E., (2014), National Systems of Entrepreneurship: Measurement issues and policy implications, Research Policy, Volume 43, Issue 3, April, Pages 476-494. Kim, J. and Park, J. (2017). The role of total factor productivity growth in Middle Income Countries. ADB Working paper Series No 527, November 2017 ISSN 2313-6537 (Print), 2313-6545 (electronic) Aghion, P., Howitt, P., (1992). A Model of Growth Through Creative Destruction, Econometrica 60, no. 2: 323-351. Aghion, P., Ljungqvist, L., Howitt, P., Howitt, P. W., Brant-Collett, M., & García Peñalosa, C. (1998). Endogenous growth theory. MIT press. Aghion, P., Van Reenen, J., & Zingales, L. (2013). Innovation and institutional ownership. American economic review, 103(1), 277-304. Amore, M. D., Schneider, C., & Žaldokas, A. (2013). Credit supply and corporate innovation. Journal of Financial Economics, 109(3), 835-855. Arza, V., & Lo´pez, A. (2010). Innovation and productivity in the argentine manufacturing sector. IDB working paper no. 187. Washington, DC, United States: Inter-American Development Bank Beck, T. and Laeven, L., (2006), Institution building and growth in transition economies, Journal of Economic Growth, 11: 157–186. Bishnu M., Ghate C. and Gopalakrishnan P. (2016), “Factor income taxation, growth, and investment specific technological change”, Economic Modelling, 57, 133–152. Bitard, P., Edquist, C. and Hommen, L., (2008). Reconsidering the Paradox of High R&D Input and Low Innovation: Sweden. In: Small Country Innovation Systems: Globalization, Change and Policy in Asia and Europe, Edward Elgar Publishing. Castellacci, F. and Natera, J. M. (2013). The dynamics of national innovation systems: A panel cointegration analysis of the coevolution between innovative capability and absorptive capacity”, Research Policy, Volume 42, Issue 3, April, pages 579-594. Caselli, F., (2015). Accounting for Cross-Country Income Differences, Elsevier, Handbook of Economic Growth, Volume 1, Part A, pages 679-741. Chadha, A. and Oriani, R. (2009). R&D Market Value under weak Intellectual Property Rights protection: the case of India, Scientometrics, 82 (1): 59 – 74. Chatterjee, C. 2007. Fundamental Patent Reform and the Private Returns to R&D: The Case of Indian Pharmaceuticals, Working Paper Series, Carnegie Mellon University, Pittsburgh, 6: 1 – 58. Chung, S. (2002), Building a national innovation system through regional innovation systems, Technovation, Volume 22, Issue 8, August, Pages 485- 491. CII (2007) Innovate India: National Innovation Mission, Confederation of Indian Industries, New Delhi. Cornaggia, J., Mao, Y., Tian, X., & Wolfe, B. (2015). Does banking competition affect innovation? Journal of financial economics, 115(1), 189-209. Crespi and Zuniga (2011) Innovation and Productivity: Evidence from six Latin American Countries, World Development Vol 40, No 2, Elsevier. Donselaar, P. and Koopmans C., (2016), The Fruits of R&D: Meta-analyses of the Effects of Research and Development on Productivity, Research Memorandum, 2016-1, Free University of Amsterdam, Amsterdam. Dixit, A. K. and Stiglitz, J. E. (1977). Monopolistic Competition and Optimum Product Diversity, The American Economic Review, Vol. 67, No. 3, June, pp. 297-308. Drongelen, I. K., Nixon, B., Pearson, A. (2000). Performance measurement in industrial R&D, International Journal of Management Reviews, Volume 2, Issue 2, June, Pages 111-203. Easterly, W., & Levine, R. (2003). Tropic, germs and crops; How endowments influence economic development. Journal of Monetary Economics, 50, 3–40. Fagerberg, J. and Srholec, M., (2008). National innovation systems, capabilities and economic development, Research Policy, Volume 37, Issue 9, October, Pages 1417-1435. Fischer, S., Sahay, R., & Vegh, C. (1996). Stabilization and growth in transition economics: The early experience. Journal of Economic Perspectives, 10, 45– 66. Forbes, N., (2016), India’s National Innovation System: Transformed or Half-formed?, Centre for Technology, Innovation and Economic Research, No. WP/16/01, September. Fragkandreas, T., (2013). When innovation does not pay off: Introducing the “European Regional Paradox. European Planning Studies, 21(12), pp. 2078– 2086. Fragkandreas, Th. (2021). Innovation-Productivity Paradox: Implications for Regional Policy, Background paper for the OECD-EC High-Level Expert Workshop series “Productivity Policy for Places”. Freeman, C. (1987). Technology and Economic Performance: Lessons from Japan, London: Pinter. Furman, J. L., Porter, M. E., Stern, S. (2002). The determinants of national innovative capacity, Research Policy, Volume 31, Issue 6, August, pages 899- 933. Galindo, M. Á., & Méndez, M. T. (2014). Entrepreneurship, economic growth, and innovation: Are feedback effects at work? Journal of business research, 67(5), 825-829. Godin, B. (2006). The Linear Model of Innovation: The Historical Construction of an Analytical Framework. Science, Technology & Human Values, Vol 31, Issue 6. Gourieroux, C. and Monfort, A. (1981). Asymptotic Properties of the Maximum Likelihood Estimator in Dichotomous Logit Models, Journal of Econometrics, 17 (1): 83–97. Goldberg PK, Kumar KA, Nina P, Petia T. (2010). Imported intermediate inputs and domestic product growth: evidence from India. Q J Econ, 125:1727–1767. Guan, J. and Chen, K. (2012). Modeling the relative efficiency of national innovation systems, Research Policy, Volume 41, Issue 1, February, Pages 102-115. Haakonsson, S. J., Jensen, P., Mudambi, S. M. (2013). A co-evolutionary perspective on the drivers of international sourcing of pharmaceutical R&D to India, Journal of Economic Geography, Volume 13, Issue 4, 1 July, Pages 677–700. Hall H. B. (2011). Innovation and Productivity, National Bureau of Economic Research Working paper no 17178, August 2011 Hartwig J. (2014). Testing the Uzawa–Lucas model with OECD data, Research in Economics, Volume 68, Issue 2, Pages 144-156. Hegde, D., & Shapira, P. (2007). Knowledge, technology trajectories, and innovation in a developing country context: Evidence from a survey of Malaysian firms. International Journal of Technology Management, 40(4), 349–370 Herstatt C., Tiwari R., Ernst D. and Buse S. (2008). India’s National Innovation System: Key Elements and Corporate Perspectives, East-West Centre Working Papers, No. 96, August. Huffman, G.W. (2007). Endogenous growth through investment-specific technological change. Rev. Econ. Dyn. 10 (4), 615–645. Huffman, G.W. (2008). An analysis of fiscal policy with endogenous investment-specific technological change. J. Econ. Dyn. Control. 32 (11), 3441–3458. Jones, Charles. (1995). R&D-based Models of Economic Growth. Journal of Political Economy, Vol 103(4), 759-784. Jefferson, G. H., Huamao, B., Xiaojing, G., & Xiaoyun, Y. (2006). R&D performance in Chinese industry. Economics of Innovation and New Technologies, 15(4-5), 345–366. Jones, E. I. (1981). The European miracle: Environments, economies, and geopolitics in the history of Europe and Asia. New York: Cambridge University Press. Kale, S., & Rath, B. N. (2018). Does innovation matter for total factor productivity growth in India? Evidence from ARDL bound testing approach. International Journal of Emerging Markets. Lengyel, B. and Leydesdorff, L. (2011). Regional innovation systems in Hungary: The failing synergy at the national Level. Regional Studies, 45(5), pp. 677–693. Lucas, R. (1988). On the Mechanics of Economic Development, Journal of Monetary Economics, 22 (1): 3–42. Lundvall, B. (2007). National Innovation Systems—Analytical Concept and Development Tool, Industry and Innovation, Volume 14, Issue 1. Pages 95- 119. Mrinalini, N., Nath, P., Sandhya, G. D. (2013). Foreign direct investment in R&D in India, Current Science, Vol. 105, No. 6, September, pp. 767-773. Mowery, D. C., Oxley, J. E. (1995). Inward technology transfer and competitiveness: the role of national innovation systems, Cambridge Journal of Economics, Volume 19, Issue 1, 1 February, Pages 67–93. Nassif, A. (2007). National Innovation System and Macroeconomic Policies: Brazil and India in Comparative Perspective, Discussion Papers, UNCTAD, No. 184, May. North, D. (1981). Structure and change in economic history. New York: W.W. Norton. North, D. (1990). Institutions, institutional change, and economic performance. New York: Cambridge University Press. OECD (2015). The Future of Productivity, OECD, Paris. OECD (2014). Addressing Economic and Social Challenges through Innovation, India Policy Brief, November 2014 Patel, P. and Pavitt, K. (1994). National Innovation Systems: Why They Are Important, And How They Might Be Measured and Compared, Economics of New Innovation and Technology, Volume 3, Issue 1, Pages 77-95. Parameswaran M. (2009). International trade, R&D spillovers and productivity, evidence from Indian manufacturing industry. J Dev Stud, 45(8):1249–1266. Porter, M.E. (1990). The Competitive Advantage of Nations. New York: Free Press. Rajan, Y. S. (2012). Shaping the National Innovation System: The Indian Perspective, The Global Innovation Index, Ch. 7. Raffo, J., Lhuillery, S., & Miotti, L. (2008). Northern and southern innovativity: A comparison across European and Latin American countries. European Journal of Development Research, 20(2), 219–239. Rebelo, S. (1991). Long-run policy analysis and long-run growth. Journal of political Economy, 99(3), 500-521. Rodrik, D., Subramanian, A., & Trebbi, F. (2004). Institutions rule: The primacy of institutions over geography and integration in economic development. Journal of Economic Growth, 9, 131–165. Romer, Paul M. (1987). Growth Based on Increasing Returns Due to Specialization. American Economic Review, May, 77:2, 56–62. Topalova P, Khandelwal A. (2011). Trade liberalization and firm productivity, the case of India. Rev Econ Stat 93(3):995–1009. Sarkar, J. and Sarkar, S. (2005). Multiple Board Appointments and Firm Performance in Emerging Economies: Evidence from India. Working Paper Series, IGIDR, India, No. WP-2005- 001: 1 – 34. Solow, R, M. (1956). A Contribution to the Theory of Economic Growth, The Quarterly Journal of Economics, Vol. 70, No. 1., February, pp. 65-94. Tsvetkova, A., Schmutzler, J. and Pugh, R. (eds.), (2020). Entrepreneurial Ecosystems Meet Innovation Systems: Synergies, Policy Lessons and Overlooked Dimensions. Northampton, Edward Elgar Publishing. Uzawa, H. (1965). Optimum Technical Change in An Aggregative Model of Economic Growth, International Economic Review, 6 (1): 18–31. Westmore, Ben. (2013). R&D, Patenting and Growth: The Role of Public Policy, OECD Economics Department Working Papers, 1047. Wooldridge, J., M. (2013). Introductory Econometrics-A modern Approach, Cengage Learning, 5th Edition. Yan Aw, B., Roberts, M. J., & Yi Xu, D. (2008). R&D investment, exporting, and productivity dynamics. Mimeo.
Appendix | Table A1: Gross Expenditure on R&D by Entity-Selected Economies | | | 2000 | 2010 | 2015 | 2018 | | GERD- | GERD- | GERD- | GERD- | GERD- | GERD- | GERD- | GERD- | GERD- | GERD- | GERD- | GERD- | | Total | Enterprise | Govt. | Total | Enterprise | Govt. | Total | Enterprise | Govt. | Total | Enterprise | Govt. | | (% of Total) | (% of GDP) | (% of Total) | (% of Total) | (% of Total) | (% of Total) | (% of GDP) | (% of Total) | (% of Total) | (% of GDP) | (% of Total) | (% of Total) | | Emerging Economies | | Brazil | 1.0 | | | 1.2 | | | 1.3 | | | 1.2 | | | | China | 0.9 | 60.0 | 31.5 | 1.7 | 73.4 | 18.1 | 2.1 | 76.8 | 16.2 | 2.1 | 77.4 | 15.2 | | India | 0.8 | 18.0 | 77.9 | 0.8 | 34.8 | 61.1 | 0.6 | 43.6 | 52.5 | 0.7 | 36.8 | 56.1 | | Indonesia | 0.1 | 26.3 | 69.8 | 0.1 | 18.8 | 43.2 | 0.1 | 25.7 | 39.4 | 0.2 | 7.3 | 70.5 | | Israel | 3.9 | 80.5 | 3.2 | 3.9 | 83.0 | 2.1 | 4.3 | 85.1 | 1.7 | 4.9 | 88.3 | 1.5 | | Korea | 2.2 | 74.0 | 13.3 | 3.5 | 74.8 | 12.7 | 4.1 | 77.5 | 11.7 | | 80.3 | 10.1 | | Malaysia | 0.5 | 57.9 | 25.0 | 1.0 | 65.0 | 6.0 | 1.3 | 52.0 | 19.6 | 1.0 | 43.9 | 13.4 | | Philippine | 0.1 | 67.8 | 16.9 | 0.1 | 55.2 | 18.4 | 0.1 | 35.7 | 29.7 | - | - | - | | Russia | 1.0 | 70.8 | 24.4 | 1.1 | 60.5 | 31.0 | 1.1 | 59.2 | 31.1 | 1.0 | 55.6 | 34.4 | | South | 0.7 | 53.7 | 20.0 | 0.7 | 49.7 | 22.7 | 0.8 | 42.7 | 24.0 | - | - | - | | Thailand | 0.2 | 43.9 | 22.5 | 0.2 | 41.2 | 32.7 | 0.6 | 70.2 | 10.0 | - | - | - | | Advanced Economies | | Canada | 1.9 | 60.3 | 11.2 | 1.8 | 52.0 | 10.6 | 1.6 | 52.1 | 7.1 | 1.6 | 50.9 | 6.9 | | Hong Kong | 0.5 | 18.0 | 1.8 | 0.7 | 43.3 | 4.5 | 0.8 | 43.8 | 4.0 | 0.9 | 44.9 | 4.7 | | France | 2.1 | 62.5 | 17.3 | 2.2 | 63.2 | 14.0 | 2.3 | 63.7 | 12.8 | 2.2 | 65.4 | 12.5 | | Germany | 2.4 | 70.3 | 13.6 | 2.7 | 67.0 | 14.8 | 2.9 | 68.7 | 14.1 | 3.1 | 68.8 | 13.5 | | Italy | 1.0 | 50.1 | 18.9 | 1.2 | 53.9 | 13.7 | 1.4 | 58.2 | 13.1 | 1.4 | 62.1 | 12.7 | | Japan | 2.9 | 71.0 | 9.9 | 3.1 | 76.5 | 9.0 | 3.3 | 78.5 | 7.9 | 3,28 | 79.4 | 7.8 | | Netherland | 1.8 | 55.1 | 12.0 | 1.7 | 47.9 | 11.7 | 2.0 | 56.0 | 11.9 | 2.2 | 67.1 | 5.8 | | Singapore | 1.8 | 62.0 | 14.1 | 2.0 | 60.8 | 10.4 | 2.2 | 61.2 | 11.4 | - | | - | | Spain | 0.9 | 53.7 | 15.8 | 1.4 | 51.5 | 20.1 | 1.2 | 52.5 | 19.1 | 1.2 | 56.5 | 16.8 | | UK | 1.6 | 65.0 | 12.6 | 1.7 | 60.9 | 9.5 | 1.7 | 66.0 | 6.6 | 1.7 | 69.1 | 6.1 | | USA | 2.6 | 74.2 | 10.8 | 2.7 | 68.0 | 12.7 | 2.7 | 71.7 | 11.3 | 2.8 | 72.6 | 10.4 |
* Siddhartha Nath (siddharthanath@rbi.org.in), Sreerupa Sengupta (ssengupta1@rbi.org.in), and Sadhan Kumar Chattopadhyay (skchattopadhyay@rbi.org.in) are with the Department of Economic and Policy Research, Reserve Bank of India, Mumbai. The authors are thankful to Shri Avdhesh Kumar Shukla for his comments which helped in improving the quality of the paper. The views expressed in this paper represent that of the authors and do not represent the views of the institution they are affiliated with. 1 Furman et al. (2002) looked at only the OECD countries. 2 See Table A1 in the Appendix for historical data. 3 Based on an average DTF score, 2019. DTF is an abbreviation of Distance to Frontier, which scores a country’s performance in each parameter in comparison to the best and worst country. The best-performing country is considered as the ‘frontier’ in each parameter and in each year. A higher DTF score would indicate that a country is close to the frontier as compared to the countries with low scores. 4 The Ease of Doing Business Index 2020 developed by the World Bank provides scores to countries based on an array of institutional parameters which describe the ease with which a corporation sets up and conducts businesses. The parameters include the time required and procedural complexities in setting up new businesses, tax rates, access to power, access to finance, ease in conducting cross-border trades, etc. 5 The Centre for Monitoring Indian Economy (CMIE) defines ‘stalled’ projects as the projects which are under implementation (i.e., already started) but are stalled due to several policy and non-policy related reasons. Data has been collected from CMIE. 6 Brazil, China, India, Indonesia, Israel, Malaysia, Philippines, Russia, South Africa, and Thailand. 7 Canada, Hong Kong, France, Germany, Italy, Japan, Netherlands, Singapore, Spain, the UK, and the USA. Countries are selected based on the Gross Expenditure on R&D (source: UNESCO) in our sample. These countries, together with the developing countries incurred the largest R&D expenses in US$ (Purchasing Power Parity) between 2010 and 2015. 8 In our model we do not emphasize on any casual inference as establishing causal inference would require building models with adequate lags of dependent variable and independent variables. Due to insufficient vintage of the data (only about 11 years), we are not in a position to do that. Therefore, we restricted our inferences to the long-run association only, while paying significant attention to any biases due to ‘endogeneity’ of the explanatory variables. 9 HS Codes 28, 29, 85-92 and 95 are taken as high-technology items. 10 https://www.oecd.org/policy-briefs/India-Addressing-Economic-and-Social-Challenges-through-Innovation.pdf 11 Sarker John 2021, September 3, ‘India becomes third largest startup ecosystem in the world’ Times of India https://timesofindia.indiatimes.com/business/india-business/india-becomes-third-largest-startup-ecosystem-in-the-world/articleshow/85871428.cms 12 Table A1 in appendix. |