Shashi Kant, Madhuresh Kumar, Shahbaaz Khan and Somnath Sharma* Received on: March 30, 2022
Accepted on: June 22, 2022 This paper decomposes the total carbon dioxide (CO2) emissions in the manufacturing sector of India during the period 2009-10 to 2017-18 into factors, such as output growth, structural changes, energy intensity changes and fuel mix changes using the Logarithmic Mean Divisia Index (LMDI) method. It finds that while a reduction in energy intensity and structural changes in manufacturing activities have led to an overall reduction in CO2 emissions, growth in output and changing fuel mix have contributed to higher emissions. The dominance of coal and coal-powered electricity in fuel consumption remains the most significant cause of CO2 emissions in India, warranting a sustained policy thrust on renewable sources of energy for faster green transition. JEL Classification: Q41, Q54, O14, L60. Keywords: Decomposition, carbon emissions, CO2 emissions, energy intensity, climate change, LMDI. Introduction The manufacturing sector is one of the key drivers of India’s economic growth, contributing around 15 per cent to India’s Gross Value Added (GVA). It is also the second-largest contributor to carbon dioxide (CO2) emissions (25 per cent) after electricity generation (Biswas et al., 2019; Gupta et al., 2019). This sector is by nature energy-intensive resulting in large emissions of greenhouse gases and is also sensitive to technological change. These characteristics of the manufacturing sector may lead to changes in its CO2 emissions over time through changes in input requirements and improvements in energy efficiency. The annual Conference of Parties (COP) on Climate Change, popularly known as COP26, held in Glasgow from October 31 to November 13, 2021, called on all the stakeholder countries for a collective action towards a systematic reduction in greenhouse gases emissions. COP26 sought commitments from every country to cut CO2 emissions, with an end objective of becoming net-zero in a targeted timeframe. Such intended decoupling between economic growth and CO2 emissions is possible if significant steps are taken in the manufacturing sector towards the reduction of CO2 emissions. The first step towards this is understanding the major factors contributing to CO2 emissions in the manufacturing sector. In this paper, we decompose the increase in CO2 emissions from India’s manufacturing sector as a result of a rise in output levels, changes in the fuel mix, improvements in energy efficiency in the manufacturing processes and variations in the composition of the overall manufacturing output. As technologies improve over time, manufacturing units adopt new ways of production to save costs and increase efficiency. The overall compositional structure of the manufacturing industry also changes with time, altering the CO2 emissions from the manufacturing industry. Illustratively, if the composition of the manufacturing sector changes such that the share of industries emitting less CO2 increases, the overall CO2 emissions from the manufacturing sector may decline. In this paper, we also analyse the key patterns in fuel usage across various types of industries classified according to their sizes (micro, small, medium and large) to see if smaller industries produce the same amount of output with lesser emissions which may have wide implications for policy planning. The novelty of this paper lies in its use of granular plant-level fuel consumption data published as part of the Annual Survey of Industries (ASI), which has hitherto remained underutilised for research on green transition. We use the logarithmic mean divisia index (LMDI) decomposition technique that has been extensively used by researchers for the decomposition of CO2 emissions. We find that despite being carbon intensive in nature, the manufacturing sector is undergoing a faster green transition than the overall economy. Increasing output in the manufacturing sector is the biggest contributor to emissions. The contribution of the manufacturing sector to emissions is explained by the use of a more carbon-intensive fuel mix, but this effect is offset by energy efficiencies in manufacturing processes and a structural shift to cleaner industries. The rest of the paper is structured as follows. Section II reviews various studies that have used several decomposition techniques. Section III describes the LMDI methodology. Data processing is discussed in Section IV alongside some stylised facts using ASI data. Results of the decomposition analysis are discussed in Section V. Section VI concludes the paper. Section II
Literature Review Energy identities provide the basis to establish a quantitative relationship between CO2 emissions and, their contributing factors. Globally, studies have mainly used two techniques to decompose the change in CO2 emissions over time – structural decomposition analysis (SDA) and index decomposition analysis (IDA). Of the two methods, SDA is more rigorous and exhaustive based on input-output tables. The SDA model has been widely used to distinguish the direct and indirect socio-economic effects from intermediate production and final consumption perspectives (Wang and Wang, 2015). The limiting factor in its use for CO2 emissions decomposition is the availability of input data for fuels of various types, which are clubbed together as one entity in many cases. On the other hand, index decomposition analysis (IDA) has been extensively used as an analytical framework by researchers to quantify the impact of change in output, structure, and energy intensity of various economic activities on energy use trends. Since the early 1990s, IDA has been extended to CO2 emissions by including two additional variables, fuel mix and emission coefficient effects. The IDA methods mainly include the Laspeyres and the Divisia index decomposition methods (Qu, 2020). It may be noted that the Laspeyres index decomposition does not allow for a complete decomposition and leaves unexplained residual terms. However, the refined Laspeyres index methods viz., Fisher ideal index, Shapley and Sun decomposition methods allow for a complete decomposition and the final results obtained are more accurate. Logarithmic mean divisia index (LMDI) and arithmetic mean divisia index (AMDI) are the prominent methods belonging to the divisia index family. Ang (2004) lists four tests in index number theory to determine the desirability of a decomposition method, namely – factor-reversal, time-reversal, proportionality and aggregation tests.1 The factor reversal test is most important while choosing the appropriate method. Table 1 exhibits the properties of various decomposition methods. Fischer, Shapley/Sun and LMDI satisfy the factor reversibility test. However, LMDI has been used in this paper because of several reasons as enumerated in Ang (2004). The multiplicative LMDI also possesses the additive property in the log form. Theoretically, the results given by multiplicative decomposition and additive decomposition should be relatable. In addition, a major difference between the LMDI and the methods linked to the Laspeyres index approach is the ease of formulation. The number of terms in the formulation of the Shapley/Sun method grows manifold with the increase in the number of factors making its implementation difficult. As a result, LMDI methods are more popular in decomposition when the number of factors exceeds three (Ang, 2004). Also, there are no negative values in the dataset making LMDI method a suitable choice for decomposition. | Table 1: Properties of IDA Methods | | IDA Method | Factor Reversal Test | Time Reversal Test | Proportionality Test | Aggregation Test | Zero Value Robust | Negative Value Robust | | Laspeyres | No | No | Yes | Yes | Yes | Yes | | Modified Fisher Decomposition | Yes | Yes | Yes | No | Yes | Yes | | Shapley and Sun | Yes | Yes | Yes | Yes | Yes | Yes | | AMDI | No | Yes | Yes | No | No | No | | LMDI | Yes | Yes | No | Yes | Yes | No | Note: The LMDI used here refers to the logarithmic mean divisia method I (LMDI I). A related version, the LMDI II, has a weighting scheme slightly more complex than LMDI I (Ang et al., 2003).
Source: Ang (2004). | As regards studies conducted on emissions, the overall trend has been that the industrial sector of advanced economies has seen a substantial drop in carbon intensity owing to improvements in energy intensity and the transition to cleaner fuel. Further, China has achieved a considerable decline in CO2 emissions mainly due to the improved energy intensity (Zhang et al., 2009; Ma et al., 2018). Liaskas et al. (2000) have found that industrial CO2 emissions in 13 European Union countries have decreased during 1973-93. The stimulus for the reduction in the sub-period 1973-83 came from the oil crisis of 1973 which led to the reduction in energy intensity across all industries. In the second sub-period of 1983-93, the reduction primarily emanated from switching to cleaner fuels, reflecting growing environmental concerns. In India’s case, Sahu and Narayan (2010) used the generalised parametric divisia index (GPDI) to segregate the energy intensity effect and found that the energy intensity in India’s manufacturing sector has fallen during the period 1990-2000 due to the changing share of various industries in total industrial output. In another paper, Sahu and Narayan (2014) analysed the trends in CO2 emissions in India’s manufacturing sector, specifically at the firm level, from 2000 to 2011. They found that emission intensity differed as per various identifiable firm-level characteristics, such as age, size, capital intensity, labour intensity and technology. A brief overview of carbon decomposition studies done in various countries is enumerated in Table 2. | Table 2: Overview of Cross-Country Carbon Decomposition Studies | | Paper | Country | Method Used | Major Findings | | Akbostanci et al. (2011) | Turkish manufacturing sector (1995-2001) | LMDI | Changes in total industrial activity and energy intensity were the main factors for CO2 changes. | | Kim and Jeong (2013) | South Korea manufacturing sector (1991-2009) | LMDI | Structural effects and energy intensity effects play a major role in reducing energy consumption and greenhouse gas emissions, and the structural effect is greater than the energy intensity effect. | | Hammond et al. (2012) | UK manufacturing industry (1990-2007) | LMDI | The decline in energy intensity was the main factor in the reduction of carbon emissions. | | Lee and Kim (2021) | South Korea manufacturing sector (2006-2018) | LMDI | Output effect increased the CO2 emissions, which was mitigated by the energy intensity effect and structural effect. | | Zhang et al. (2015), Ma et al. (2018) | China’s manufacturing sector (2004-2014) | LMDI | Output effect had a positive effect on CO2 emissions, which was offset by the energy intensity effect. | | Sahu and Narayan, 2010 | India’s Manufacturing sector (1990-2000) | GPDI | Energy intensity in India’s manufacturing sector has fallen because of changing share of various industries in total industrial output. | | Paul et al. (2004) | India’s primary, secondary and service sectors (1980-1996) | Sun | Energy intensity reduces CO2 emissions in the industrial and transport sectors. | | Das and Roy (2020) | India’s Primary, Secondary and service sectors (1990-2013) | LMDI | Energy intensity effect was the main factor which offsets the output effect. | | Dasgupta et al. (2017) | Indian manufacturing sector (1973-2012) | LMDI | Energy efficiency has contributed to the decoupling of emissions from industrial activity growth. A major driver of growth in energy demand is due to the output effect with marginal impact from structural change. | | G. Ortega- Ruiz et al., (2018) | India’s primary, secondary and service sectors (1990-2015) | LMDI | The economic growth of India has been the dominating driving force contributing to the increase in CO2 emissions, while the improvement in energy intensity has been the major factor in reducing the emissions. | Section III
Methodology III.1 LMDI Decomposition Based on the energy identities, CO2 emissions from industry can be decomposed into five factors: output effect, structural effect, energy intensity effect, fuel mix effect and emission factor effect (Table 3). The decomposition identity is expressed as:
| Table 3: Decomposition of CO2 Emissions | | Decomposed Component | Description | | Output effect | Change in emissions explained by the change in output | | Structural effect | Change in emissions explained by the change in the structure of overall industry i.e., change in individual share of contribution to industrial GDP | | Emission intensity effect | Change in emissions due to change in energy intensity of individual sectors defined as the energy consumed per unit GVA output. This signifies efficiency in production techniques or the use of better capital equipments | | Fuel-mix effect | Change in emissions due to shifts to different fuel |
III.2 Data The Annual Survey of Industries (ASI) publishes fuel consumption data at the aggregate and firm levels. Being handy to use, aggregate data has found several applications in various national-level analyses. However, firm-level raw data have remained relatively unexplored by researchers on estimations of CO2 emissions. This paper distinguishes itself from previous studies in its use of granular firm-level data and the application of multipliers to arrive at the aggregate statistics. While the aggregate data combines many different fuel categories, thereby rendering it impossible to track the consumption of individual fuels, the granular data retains the fuel consumption segregation to a greater extent, and therefore, has been preferred for this analysis. The ASI survey is comprehensive with around 57,000, 58,000 and 67,000 establishments surveyed in 2009-10, 2013-14 and 2017-18, respectively, out of over 2 lakh firms in the ASI frame, which is a list of all factories/units registered with the government authorities and updated periodically by the National Statistical Office (NSO) in consultation with the Chief Inspector of Factories in states. We choose these panel years as they follow the same industrial classification code (National Industrial Classification (NIC)-2008) and yet have a sufficient gap between them to capture structural changes in CO2 emissions from manufacturing industries. The ASI provides a firm-level break-up of fuel inputs namely, electricity; coal; and gas in physical units. For petroleum products, expenditure incurred on petrol, diesel, furnace oil, lubricants and others is provided instead of quantities. Expenditure on other fuels, such as firewood, fuel oil, solar energy and others, is also provided. The physical quantities of petrol, diesel, furnace oil, lubricants, and other consumed fuels are unavailable. However, the combined expenditure incurred on these fuels has been provided. In order to estimate the quantity of individual fuels consumed from the consolidated fuel expenditure on petroleum products, we need to have two things – first, the historical prices of fuel in India for 2009-10 and 2017-18; and second, the proportion of expenditure incurred on each fuel type. As historical prices of individual fuel categories are not available, we back-calculated the prices using their current dealer prices on “Fuels India” website with the wholesale price index (WPI) published by the Office of Economic Advisor, Department for Promotion of Industry and Internal Trade (DPIIT), Government of India.3  Where the subscript hist stands for panel years 2017-18, 2013-14 and 2009-10. In the absence of the proportion of expenditure incurred on each fuel type, a simplifying assumption has been made that all sectors in the industry use different forms of petroleum fuels in roughly the same proportion. We have assumed a constant proportion of petroleum products across all industries as obtained from industrial consumption of petroleum products (Table 4). | Table 4: Consumption Pattern and Share of Petroleum at the Industrial Level | | (Consumption in ‘000 tonnes) | | Petroleum Fuel | Industrial Consumption (2017-18) | Share in Industry | Industrial Consumption (2013-14) | Share in Industry | Industrial Consumption (2009-10) | Share in Industry
(2009-10) | | High Speed Diesel | 1304 | 0.34 | 751 | 0.27 | 1645 | 0.27 | | Furnace Oil | 2400 | 0.63 | 1909 | 0.69 | 4360 | 0.72 | | Kerosene | 97 | 0.03 | 107 | 0.04 | 69 | 0.01 | | Sources: Energy Statistics of India; and Authors’ calculations. | For petroleum products, a wide array of fuels is available, for example, LPG, Natural Gas, Petrol, Kerosene, Aviation Turbine Fuel (ATF), High-Speed Diesel (HSD), Light Diesel Oil (LDO), Furnace Oil, low sulphur heavy stock (LSHS), Lubricants, Naphtha and others. Out of these, fuels commonly used in industry are – HSD, LDO, LSHS, and FO. Although widely used in the transportation sector, petrol does not find wide usage in industries as fuel.4 We have merged LDO with HSD, and LSHS with Furnace Oil to keep the calculations simple without affecting the results much. Further, their WPI indices are not available separately, and the difference in their emission factors is also not significant. We back-calculated the physical quantities of consumption of these fuels using average historical prices for the constituent fuel types. As fuel prices may vary for companies depending on wholesale contracts, regional taxes and other factors, an indicative price has been taken to keep the analysis simple. Using the price of various petroleum products prevailing at that time, the physical quantities of the fuels consumed have been estimated. The calorific value of the fuels is then used to calculate the energy content of the fuels (Table 5). The conversion into energy units brings all fuel types into the same unit (kWh), making them comparable across the board, which are otherwise expressed in different weight/volume/energy units. The emission factor of the fuels (CO2 emissions per unit of energy) is then multiplied with the energy units produced from the combustion of fuels. | Table 5: Calorific Value and Emission Factor of Various Fuels | | Fuel | Calorific Value
(kWh/MT) | Emission Factor
(kg CO2 per kWh) | | Diesel | 12,552 | 0.2496 | | Furnace Oil | 12,203 | 0.2496 | | Kerosene | 12,901 | 0.2566 | | Coal | 4,350 | 0.3230 | | LPG | 13,830 | 0.2106 | | Fuel Oil | 11,950 | 0.2491 | | Electricity | - | 0.82 | | Solar energy | - | 0 | Note: Emission factor of electricity has been documented to be constant in the period 2013-18 as given in CO2 Baseline Database for the Indian Power Sector User Guide December 2018 issued by Central Electricity Authority (CEA), Ministry of Power, Government of India, pp 27.
Sources: Bureau of Energy Efficiency (BEE); Environmental Protection Agency (EPA); and CEA. |
 It may be noted that electricity is a secondary source of energy which is generated using primary sources like coal, petroleum products, gas, and renewables and therefore, is not a clean form of energy in the true sense unless all the electricity produced in the country comes from a renewable source. We do not treat electricity as a clean source of energy. It has an emission factor of 0.82 which accounts for indirect emissions caused due to the combustion of coal and heat losses during its generation, and losses in the distribution network. Furthermore, the indirect energy consumed during electricity generation from primary energy sources like coal, gas, etc. does not form a part of energy intensity calculations. Section IV
Stylised Facts IV.1 Total Emissions across Sectors Basic metals, non-metallic minerals, chemicals, textiles, food industries and refineries are the largest contributors to CO2 emissions comprising around 80 per cent of the emissions from the manufacturing sector (Chart 1). These sectors play a vital role in creating employment and provide crucial support to the economic development of the country, but they also have high CO2 emissions per unit GVA. Amongst the key sectors, the manufacture of electrical equipment has undergone a reduction in aggregate emissions due to the reduction in energy consumption on account of greater energy-efficient production processes. It is noteworthy that the growing share of electricity in the energy consumption basket is also responsible for increasing CO2 emissions. It is because even though the direct emission from electricity is zero, the use of fossil fuels in power generation emits around 2.5 times more CO2 than the direct combustion of coal after accounting for the loss of heat during power generation and loss of electricity during transmission. IV.2 Energy Consumption and Carbon Intensity The energy consumption by industries has increased by 21.5 per cent accompanied by an increase of 39.9 per cent in CO2 emissions over the base period. These sectors have contributed to an increase of 78 per cent in GVA (Table 6). Carbon intensity, measured in terms of CO2 emitted per unit rupee GVA by the manufacturing sector, has decreased from 46g to 36g per rupee GVA which reflects a swifter green transition as compared to the overall economy for which the carbon intensity has only seen a decline from 22g to 18g per rupee GVA (Chart 2).
| Table 6: Aggregate Data for Manufacturing Firms in ASI Data | | Year | Energy
(billion kWh) | CO2
(million tonnes) | GVA
(2011-12 ₹ trillion) | Energy Intensity
(kWh per ₹ GVA) | Carbon Intensity
(g per ₹ GVA) | | 2009-10 | 947.2 | 327.9 | 7.13 | 0.133 | 46.0 | | 2013-14 | 1078.3 | 419.2 | 9.46 | 0.114 | 44.3 | | 2017-18 | 1151.4 | 458.9 | 12.69 | 0.091 | 36.2 | | Source: Authors’ calculations based on ASI data. | IV.3 Energy and Carbon Footprint of Micro, Small and Medium Enterprises (MSME) Industries In our analysis, we have used investment in plant and machinery and turnover to classify firms into micro, small and medium enterprises with residual firms being classified under the large category.5 For a uniform comparison across time horizon, we take the deflated values of thresholds for classification. We find that an increase in the size of MSME industries is associated with lesser energy and carbon intensities. However, large industries have high energy and carbon intensity almost at par with micro industries (Table 7). A salient decline in intensities is also observed across various sizes for different years. It indicates that firms can deploy more capital equipment with size and reap the benefits of scale. On the other hand, despite having economies of scale in production, large industries are inherently energy and carbon-intensive because of the distinct nature of output produced. This is corroborated by Sahu and Naraynan (2011), who found a non-linear (U-shaped) relationship between energy intensity and firm size, implying that both very large and very small firms tend to be more energy intensive as compared to the medium size firms. 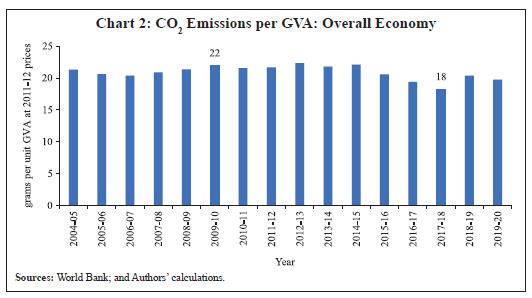
| Table 7: Energy and Carbon Intensity of MSME and Large Industries | | | Energy Intensity
(kWh per ₹ GVA) | Carbon Intensity
(g per ₹ GVA) | | 2009-10 | 2013-14 | 2017-18 | 2009-10 | 2013-14 | 2017-18 | | Micro | 0.12 | 0.11 | 0.09 | 50.7 | 48.4 | 39.2 | | Small | 0.10 | 0.09 | 0.08 | 43.1 | 40.2 | 34.3 | | Medium | 0.08 | 0.08 | 0.06 | 35.8 | 36.7 | 30.1 | | Large | 0.14 | 0.13 | 0.10 | 44.1 | 47.0 | 38.1 | | Source: Authors’ calculations based on ASI data. | IV.4 Fuel Mix of MSMEs Coal is the primary energy source for large firms making them less dependent on purchased electricity. Many large firms meet their electricity requirements through in situ production of electricity. The MSME sector, in comparison, uses much more purchased electricity in its fuel mix (Table 8). Electricity is increasingly gaining a greater share in the energy mix of industries. Also, a rise in the energy share of coal during the first sub-period is conspicuous; however, it declined during the latter sub-period. | Table 8: Fuel Mix of MSMEs | | (in per cent) | | | Period | Coal | Diesel | Gas | Furnace oil | Kerosene | Electricity | Others | | Micro | 2017-18 | 32.9 | 6.9 | 3.6 | 12.3 | 0.5 | 30.6 | 13.2 | | Micro | 2013-14 | 40.8 | 3.4 | 3.2 | 8.5 | 0.5 | 29.2 | 14.3 | | Micro | 2009-10 | 38.3 | 4.8 | 4.4 | 12.4 | 0.2 | 25.9 | 14.0 | | Small | 2017-18 | 29.9 | 7.8 | 6.7 | 14.0 | 0.6 | 32.8 | 8.3 | | Small | 2013-14 | 32.8 | 4.3 | 7.4 | 10.8 | 0.7 | 34.6 | 9.4 | | Small | 2009-10 | 26.8 | 6.0 | 7.4 | 15.5 | 0.3 | 32.0 | 12.1 | | Medium | 2017-18 | 24.1 | 6.8 | 7.1 | 12.1 | 0.5 | 39.1 | 10.2 | | Medium | 2013-14 | 30.6 | 4.2 | 5.2 | 10.4 | 0.6 | 38.3 | 10.6 | | Medium | 2009-10 | 25.0 | 6.2 | 3.8 | 15.9 | 0.3 | 34.2 | 14.6 | | Large | 2017-18 | 50.6 | 4.4 | 9.7 | 7.8 | 0.3 | 18.6 | 8.6 | | Large | 2013-14 | 52.0 | 2.1 | 10.5 | 5.1 | 0.3 | 16.8 | 13.2 | | Large | 2009-10 | 46.0 | 3.1 | 21.0 | 8.1 | 0.1 | 11.0 | 10.7 | | Source: Authors’ calculations based on ASI data. | Section V
Empirical Analysis V.1 Decomposition of Energy The results of the LMDI decomposition need to be interpreted as ceteris paribus effects. The LMDI decomposition of energy consumed by the manufacturing sector shows that the activity (output) effect would have led to a rise of 597 billion kWh in energy consumption, if all other things were constant. In the absence of structural and energy intensity effects, an increase in the output alone would have required an increase in energy consumption almost three times the actual change in energy consumption. Nevertheless, the energy demand was subdued mainly because of the negative energy intensity effect and the structural effect. We reproduce results obtained from the Shapley-Sun method for the robustness check (Table 9). While output and energy intensity effects are consistent with both methods, the effect of structural change on energy consumption seems less conclusive. Nevertheless, its magnitude is minuscule as compared to absolute base year emissions. | Table 9: Results of Additive Decomposition of Energy (billion kWh) (Period 2009-10 to 2017-18) | | Method | Base year emissions | Output effect | Structural effect | Energy intensity effect | | LMDI | 921 | 597 | -69 | -322 | | Shapley/Sun | 921 | 640 | 23 | -457 | | Source: Authors’ calculations based on ASI data. | V.2 Decomposition of CO2 Emissions For the decomposition of CO2 emissions, the LMDI may be extended to include two more variables, namely, the fuel mix effect and the emission factor effect. Since we assume no change in fuels’ emission factor in this period, we have decomposed CO2 emissions into output, energy intensity, structural and fuel mix effects. CO2 emissions from registered manufacturing industries have risen by 131 million tonnes (MT) during 2009-10 to 2017-18. The LMDI decomposition shows that total change in CO2 emission can be decomposed into a positive activity effect (+218 mt) and fuel mix effect (+58 mt), which is partially neutralised by a negative energy intensity effect (−119 mt) and the structural effect (−26 mt). The increased output activity is the most significant contributor to emissions. However, the actual increase in emissions is lower because of a reduction in sectoral energy intensity and structural changes in the manufacturing sector. Changes in fuel mix have also contributed positively to CO2 emissions implying greater use of carbon-intensive fuels over the years (Chart 3a). We break down the eight-year period into two equal sub-periods 2009-13 and 2013-17 to investigate the individual effects. We observe that while output and structural effects remain prominent, there is a radical shift in structural and fuel mix effects, and the reasons for these are explainede are explained in later sections (Chart 3b). V.3 Output Effect
V.4 Energy Intensity Effect Output growth is the primary driver of CO2 emissions, while improvement in energy intensity profoundly reduces CO2 emissions (Dasgupta and Roy, 2001; Dasgupta and Roy, 2017). The energy intensity effect alone, ceteris paribus, would have reduced 122 million tonnes of CO2. In other words, the total emission increase was 131 million tonnes during this period. Energy intensity (Energy consumption per unit GVA) has improved from 0.133 to 0.091 kWh/₹ (at 2011-12 prices). This amounts to a reduction of almost 31.5 per cent over the base year. In contrast, the energy intensity of India’s GDP declined by 14.5 per cent only from 0.076 kWh/₹ to 0.065 kWh/₹ at 2011-12 prices during 2009-10 to 2017-18 (Chart 4). A swifter transformation to energy-efficient processes is underway in the manufacturing sector as compared to the economy as a whole. 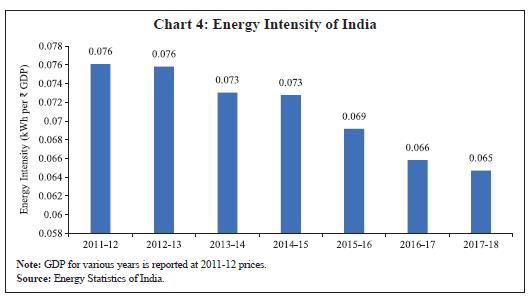 A large share of energy efficiency can be attributed to the continuous techno-economic improvements and firms catching up to the international best practice benchmarks. Another trend which is driving energy efficiency is the growing share of electricity. Electricity is a secondary energy source (produced from primary sources like coal, diesel, gas, renewables, etc.) which is highly efficient at the point of consumption vis-à-vis the in situ generation of heat and electricity from conventional fuels like coal, diesel and gas. The transformation losses, (i.e., losses when heat energy is converted into electrical energy) and transmission and distribution losses in electricity generation are even more significant than the in situ generation of heat and electricity. When we consider delivered energy at the point of consumption, electricity is the most efficient among all the fuels. However, the effect of electrification on CO2 emissions is not straightforward and is discussed later in the fuel mix section. The most energy-intensive industries are basic metals, non-metallic mineral industries, paper, chemical industries, and textiles. These industries used 73.5 per cent of energy while their contribution to GVA was only 31.3 per cent in 2017-18. A broad decline in energy intensity was observed across all sectors, as mirrored in the top five carbon-emitting sectors (Table 10). | Table 10: Energy Intensities of Top Five CO2 Emissions Industries (2017-18) | | Activity | 2009-10 | 2017-18 | Percentage reduction | | Manufacture of basic metals | 0.38 | 0.31 | 18.4 | | Manufacture of other non-metallic mineral products | 0.33 | 0.30 | 9.1 | | Manufacture of chemicals and chemical products | 0.13 | 0.11 | 15.4 | | Manufacture of textiles | 0.18 | 0.14 | 22.2 | | Manufacture of food products | 0.09 | 0.07 | 22.2 | Note: Energy intensity units are kWh per rupee GVA.
Source: Authors’ calculations based on ASI data. | V.5 Structural Effect Structural changes are not discernible over short horizons. Therefore, a long horizon of eight years (2009-10 to 2017-18) has been considered to visualise its effect. It essentially refers to the increase in the share of industries (Δalpha) with less carbon footprint, accompanied by a decrease in the share of high carbon-intensive industries in the aggregate output. The bi-pronged nature of structural shift can be visualised from the second and fourth quadrants of the scatter plot with Δalpha and carbon intensity depicted on the x and y-axis, respectively (Chart 5). Many industries with low carbon footprints such as manufacturing food products, motor vehicles, trailers and semi-trailers, pharmaceutical, apparel, medicinal and botanical products have gained a larger share in GVA output. On the other side, high carbon-intensive industries like basic metals and non-metallic minerals have witnessed a declining share in GVA. The mild structural effect indicates that the economy is slowly moving towards cleaner industries. However, it is unable to neutralise the increase due to the output effect. Upon breaking down into two equal sub-periods, the structural effect in the latter (2013-17) is conspicuously more prominent than the former (2009-13) as shown in Annex A1 with many sectors being concentrated in the fourth quadrant. V.6 Fuel Mix Effect A more significant share of cleaner fuels in the overall energy consumption basket causes a decline in CO2 emissions (Zhang et al., 2015; Muangthai et al., 2014). For Indian manufacturing, the share of coal and electricity in the overall energy mix has increased during the study period resulting in a positive contribution to emissions (Table 11). Notably, the usage of gas-based fuels in industry, which are cleaner fuels than coal, has come down mainly due to a fall in domestic production of natural gas (Safari et al., 2019). As India’s estimated reserves of natural gas resources are limited (less than 1 per cent of the global natural gas reserves), improving import logistics and infrastructure can help to increase the share of gas in domestic fuel consumption. A breakup of decomposition analysis for the periods 2009-13 and 2013-17 reveals that the fuel mix effect has drastically reduced in the latter period indicating a cleaner fuel mix. The large fuel mix effect in the period 2009-13 is on account of an increase in the share of coal and electricity, however, the negligible fuel mix effect in the latter period is due to the balancing effect of the increasing share of electricity and decreasing share of coal. | Table 11: Share of Fuels in the Indian Manufacturing Sector | | Fuel (as per cent of energy mix) | 2009-10 | 2013-14 | 2017-18 | | Coal | 40.8 | 47.2 | 45.0 | | Gas (LPG, Biogas, Natural Gas, Coal Gas) | 17.9 | 9.3 | 8.9 | | Diesel | 3.8 | 2.6 | 5.1 | | Furnace Oil | 9.8 | 6.4 | 9.1 | | Kerosene | 0.2 | 0.4 | 0.4 | | Electricity | 16.3 | 21.5 | 23.0 | | Other (Wood, Solar, Fuel Oil) | 11.3 | 12.6 | 8.5 | | Source: Authors’ calculations based on ASI data. | The curious case of electricity merits further attention. Electrification in transport and industry is hailed as the next big revolution combating climate change. Electricity is a very efficient source of delivered energy compared to other fossil fuels. However, countries that overwhelmingly use coal or lignite to fire their power stations eventually emit much higher CO2 per kWh of energy. In India, one kWh of grid electricity used at the point of consumption emits 0.82 kg of CO2 that is three to six times more polluting than other sources. In a traditional coal-fired power plant, the transformation loss (chemical energy of coal to heat energy to electrical energy) is around 70-73 per cent. Furthermore, 21 per cent of the remaining electricity is lost in transmission and distribution. The higher efficiency somewhat compensates for the higher emission factor, but on the net, grid electricity remains highly carbon-intensive in India. Section VI
Conclusions Using firm-level data on fuel consumption and expenditure from ASI survey, this paper finds that basic metals, non-metallic minerals, textiles, chemicals, food and refineries are the biggest contributors to CO2 emissions, together accounting for 80 per cent of the CO2 emissions from the formal manufacturing sector. India’s manufacturing sector, however, is undergoing a faster process of green transformation than the overall economy. The carbon intensity of the manufacturing sector has declined from 46g to 36g per rupee of GVA during the period 2009-10 to 2017-18 while that of the overall economy has reduced from 22g to 18g per rupee of GVA. Our decomposition analysis of CO2 emissions in the manufacturing sector in India shows that the manufacturing output and fuel mix effects have contributed to the increase in total CO2 emissions. In contrast, the energy intensity and structural effects have helped in abating total CO2 emissions. On a net basis, the effect of all four factors amounts to an increase of 131 million tonnes of CO2 emissions during 2009-10 to 2017-18. The findings of this paper are in line with other studies which show a significant role of output growth in driving the increased energy use and resultant CO2 emissions. Though the structural effect has led to a reduction in the CO2 emissions from the manufacturing sector, it has remained low. The shift towards greener industries can be further incentivised through appropriate fiscal measures involving taxes and subsidies. Energy intensity, on the other hand, is the largest factor which has led to a reduction in CO2 from the manufacturing sector as most manufacturing units use electricity as an input for production. While electricity generated from coal may be the most significant source of CO2 emissions, it could negate some of the benefits of reduced energy intensity through the fuel mix effect reported in this paper. Energy intensity can be further reduced through greater innovation in the field of green technology. It has been observed that innovation in greener technologies is mainly concentrated in developed countries. Increasing public spending on research and development, overseeing effective intellectual property rights regimes and fostering international collaboration can encourage innovation in greener technologies and help in further reduction of CO2 emissions in the long-term. Increasing the share of renewable energy (for example, hydro, solar, and wind) in electricity generation can be a game-changer. The effort to augment renewable energy use by notifying the rules for Promoting Renewable Energy through Green Energy Open Access by the Central Government is a step in the right direction towards adopting green energy alternatives. These rules will help in the transition to private renewable energy procurement.
References Akbostanci, E., Tunç, G. Ipek, & Turut-Asık, S. (2011). CO2 emissions of Turkish manufacturing industry: A decomposition analysis. Applied Energy, 88(6), 2273-2278. Ang, B. W. (2004). Decomposition analysis for policymaking in energy. Energy Policy, 32(9), 1131–1139. Ang, B. W. (2005). The LMDI approach to decomposition analysis: A practical guide. Energy Policy, 33(7), 867–871. Ang, B.W. & Choi, K.H. (1997). Decomposition of aggregate energy and gas emission intensities for industry: a refined Divisia index method. The Energy Journal, 18 (3), 59–73. Ang B.W. & Liu F.L. (2001). A new energy decomposition method: Perfect in decomposition and consistent in aggregation. Energy, 26 (6), 537-548. Ang B.W., Liu F.L. & Chew E.P. (2003). Perfect decomposition techniques in energy and environmental analysis. Energy Policy, 31(14), 1561-1566. Balk, B.M. (1996). Consistency-in-aggregation and Stuvel indices. Review of Income and Wealth, 42 (3), 353–363. Biswas, T., Ganesan, K., & Ghosh, A. (2019). Sustainable Manufacturing for India’s Low-carbon Transition: Four bets for Hard-to-abate Sectors. Issue Brief. New Delhi: Council on Energy, Environment and Water. Chung, H.S. & Rhee, H.C. (2001). Carbon Dioxide Emissions of Korea and Japan and Its Transmission via International Trade. International Economic Journal, Taylor & Francis Journals. Vol. 15(4), 117-136. Das, N. & Roy, J. (2020). India can increase its mitigation ambition: An analysis based on historical evidence of decoupling between emission and economic growth. Energy for Sustainable Development, 57, 189-199. Das Gupta, Meeth & Roy, Joyashree. (2001). Understanding Changes in Energy Consumption by Energy Intensive Manufacturing Industries in India. Staff Paper, CSO, Government of India. Dasgupta, Shyamasree & Roy, Joyashree. (2017). Analysing Energy Intensity Trends and Decoupling of Growth from Energy Use in Indian Manufacturing Industries during 1973–1974 to 2011–2012. Energy Efficiency. Issue 4/2017. G. Ortega-Ruiz, Mena-Nieto, A. & García-Ramos J.E. (2020). Is India on the right pathway to reduce CO2 emissions? Decomposing an enlarged Kaya identity using the LMDI method for the period 1990–2016, Science of the Total Environment, Volume 737. Gupta, V., Biswas, T., & Ganesan, K. (2017). Greenhouse gases emission estimates from the manufacturing industries in India State level estimates: 2005 to 2013. Council on Energy, Environment and Water (CEEW), India. Gupta, V., Biswas, T., Janakiraman, D., & Ganesan, K. (2019). Greenhouse gases emissions of India (subnational estimates): Manufacturing sector (2005-2015 series). CEEW. Hammond, G. P. & Norman, J. B. (2012). Decomposition analysis of energy-related carbon emissions from UK manufacturing. Energy, 41, 220–227. Jeong, K. & Kim, S. (2013). LMDI decomposition analysis of greenhouse gas emissions in the Korean manufacturing sector. Energy Policy, 62, 1245–1253. Kim, S. (2017). LMDI decomposition analysis of energy consumption in the Korean manufacturing sector. Sustainability, 9(2), 202. Lee, J. & Kim, J. (2021). A decomposition analysis of the Korean manufacturing sector: Monetary vs. physical outputs. Sustainability, 13(11), 6192. Liaskas, K., Mavrotas, G., Mandaraka, M. & Diakoulaki, D. (2000). Decomposition of industrial CO2 emissions, Energy Economics, 22(4), 383–394. Ma, L., Chong, C., Zhang, X., Liu, P., Li, W., Li, Z. & Ni, W. (2018). LMDI decomposition of energy-related CO2 emissions based on energy and CO2 allocation Sankey diagrams: The method and an application to China. Sustainability, 10(2), 344. Muangthai, I., Lewis, C. & Lin, S.J. (2014). Decoupling effects and decomposition analysis of CO2 Emissions from Thailand’s thermal power sector. Aerosol and Air Quality Research, 14, 1929-2938. Park, S.H. (1992). Decomposition of industrial energy consumption. Energy Economics, 14(4), 265–270. Paul, S. & Bhattacharya, R. (2004). CO2 emission from energy use in India: A decomposition analysis. Energy Policy, 32, 585-593. Qu, S. (2020). The decomposition analysis of carbon emissions: Theoretical basis, methods and their evaluations. Chinese Journal of Urban and Environmental Studies, 8(4), 2050020. Safari, A., Das, N., Langhelle, O., Roy, J. & Assadi, M. (2019). Natural gas: A transition fuel for sustainable energy system transformation? Energy Science & Engineering, 7(4), 1075–1094. Sahu, S.K. & Narayanan, K. (2010). Decomposition Of Industrial Energy Consumption In Indian Manufacturing: The Energy Intensity Approach. Journal of Environmental Management and Tourism, v. 1, n. 1, 22-38. Sahu, S.K. & Narayanan, K. (2011). Determinants of energy intensity in Indian manufacturing industries: A firm level analysis. Eurasian Journal of Business Economics, 4 (8), 13–30. Sahu, S. K. & Narayanan, K. (2014). Energy Use Patterns And Firm Performance: Evidence From Indian Industries. The Journal of Energy and Development, 40(1/2), 111–133. Vartia, Y. (1976). Log-change index numbers. Scandinavian Statistics, 3, 121–126. Wang, C. & Wang, F. (2015). Structural decomposition analysis of carbon emissions and policy recommendations for energy sustainability in Xinjiang. Sustainability, 7(6), 7548–7567. Zhang, M., Mu, H., Ning, Y., & Song, Y. (2009). Decomposition of energy-related CO2 emission over 1991–2006 in China. Ecological Economics, 68(7), 2122-2128. Zhang, X., Liu, Q., Liu, S. & Kong, L. (2015). Decomposition and decoupling analysis of energy - Related carbon emissions from China manufacturing. Mathematical Problems in Engineering, Hindawi Publishing Corporation.
|