India joined the global economy in an unprecedented contraction in 2020-21, dragged down by the COVID-19 pandemic. Headline inflation was elevated for most part of the year led by supply chain disruptions due to the pandemic and spikes in key food prices. Inflation, however, moderated subsequently due to seasonal easing in food prices since December 2020, albeit with an upside push from adverse base effects during February-March 2021. Monetary and credit conditions remained expansionary and financial market conditions eased considerably on the back of abundant liquidity. Public finances were impacted by a cyclical slowdown in revenues, which was exacerbated by COVID-19, while pandemic-induced fiscal measures pushed up expenditure. On the external front, the sizeable contraction in imports relative to exports, under deep recessionary conditions, led to a current account surplus; along with robust net capital inflows, this led to a large build-up of foreign exchange reserves. II.1 THE REAL ECONOMY II.1.1 In 2020, the global economic sky was overcast with COVID-19 - a virus of the size of 0.12 microns. By end-March 2021, the virus had resulted in over 128 million infections and over 2.8 million mortalities worldwide. The year 2021 has commenced with both hope and fear - several parts of the world are locking down and bracing against new waves of infections and speedily communicable mutations. At the same time, the approval of several vaccines has spurred vaccination drives worldwide, albeit at different speeds. Nearly 600 millions of vaccine doses have already been administered (March 31, 2021), even as vaccine producers struggle to tweak vaccines to keep pace with mutations. In the event, 2020 has gone down in human history as the year of the ‘Great Lockdown’1, with output losses dwarfing those suffered during the global financial crisis (GFC) of 2008-09. World trade declined by around 8.5 per cent, with the contraction in services trade outpacing the fall in merchandise trade. II.1.2 The year 2020 will also be memorable for unprecedented policy responses which, although not coordinated, turned out to be synchronised. A slew of conventional and unconventional measures was unleashed across the world, with monetary authorities slashing policy rates to zero and below in real terms - and even in nominal terms in some countries - while executing massive asset purchase programmes, payment deferral schemes, provision of public guarantees, emergency funding avenues and provision of ample liquidity to financial markets. The stimulus provided by fiscal authorities was equally unprecedented in scale and scope, amounting to US$ 16 trillion2 (15.3 per cent of the GDP). Of the total amount, US$ 10 trillion consisted of additional spending or foregone revenue, while US$ 6 trillion comprised liquidity support in the form of guarantees, loans, asset/debt purchases, and equity injections. This policy fightback led to a massive easing of financial conditions and imparted stability to the financial system, thereby containing downside risks to growth. II.1.3 Equity markets, in particular, have recovered exuberantly from the panic that set in when COVID-19 was declared a pandemic in March 2020. Cyclical stocks3 have led the rally, driven by optimism surrounding the arrival of vaccines and fresh rounds of fiscal stimulus in major economies. Crude oil prices and other commodity prices are also firming up on the back of these positive developments, with production restraints by the organisation of the petroleum exporting countries (OPEC) providing added momentum in February and March 2021 and creating conditions for the forming of a new commodity super-cycle. II.1.4 The agglutination of supply disruptions, the health crisis, an unparalleled mass migration and a hostile global environment took a heavy toll on the Indian economy. A cyclical slowdown had preceded the pandemic, causing real gross domestic product (GDP) growth to register a sequential deceleration since 2017-18, which slumped into contraction under the onslaught of COVID-19. Within two weeks of the World Health Organisation (WHO) declaring it a pandemic, India imposed a strict lockdown. The combination of demand compression and supply disruption that took hold in its wake caused severe debilitating effects on the economy in Q1:2020-21. By mid-September, the total number of COVID-19 cases crossed 50 lakh - the second highest caseload in the world, with over 0.8 lakh fatalities. It was a turning point, however; thereon, India bent the COVID-19 curve, with the seven-day rolling average of new confirmed cases dropping from 93,199 on September 16, 2020 to 11,145 on February 11, 2021 before rising sharply thereafter (62,019 on March 31, 2021). By the end of March 2021, the recovery rate was around 94 per cent and the number of active cases had surged to 5.8 lakh. II.1.5 With gradual lifting of restrictions and reopening of the economy, the pace of contraction moderated in Q2 and GDP returned to positive terrain in Q3 of 2020-21. Sensing the recovery gaining traction, equity markets became ebullient, with the BSE Sensex staging a V-shaped recovery and rising over 91 per cent by end-March 2021 from the lows of March 2020, buoyed by strong corporate performance in Q2 and Q3 of 2020-21, the roll-out of a massive vaccine programme, fiscal and monetary stimulus in place and surges of capital inflows. The prospects for the Indian economy though impacted by the second wave, remain resilient backed by the prospects of another bumper rabi crop, the gathering momentum of activity in several sectors of the economy till March, especially housing, road construction and services activity in construction, freight transportation and information technology (IT). Meanwhile, the activation of the production-linked incentive (PLI) scheme, spectrum auctions and considerable easing of financial conditions are helping to shape the turnaround. On the other hand, large and medium-scale industry, mining and quarrying and several contact-intensive sectors remain subdued. II.1.6 Against this backdrop, component-wise analysis of aggregate demand is set out in the following sub-section. Developments in aggregate supply conditions in terms of the performance of agriculture and allied sectors, value added in the industrial sector, and performance of services are sketched out in sub-section 3. The sub-section 4 presents analysis of employment based on high frequency indicators. The concluding sub-section offers some policy perspectives. 2. Aggregate Demand II.1.7 The second advance estimate (SAE) that were released by the National Statistical Office (NSO) in February 2021 revealed that aggregate demand, measured by real GDP, contracted by 8.0 per cent in 2020-21 (Table II.1.1 and Appendix Table 1). This is the first contraction experienced since 1980-81 and the severest ever. In fact, the contraction was of the order of 15.9 per cent in the first half of 2020-21 under the full brunt of the lockdown imposed to curb the transmission of COVID-19. II.1.8 Progressive restoration in demand conditions was evident with a sharp rebound in seasonally adjusted annualised growth rate (SAAR) in Q2:2020-21, indicating a recovery in momentum. This was sustained in the next quarter as well, reflected in an uptick in the three-quarter moving average (MA-SAAR) of GDP in Q3:2020-21 (Chart II.1.1 and Appendix Table 2). | Table II.1.1: Real GDP Growth | | (Per cent) | | Component | 2016-17 | 2017-18 | 2018-19 | 2019-20 | 2020-21 | | 1 | 2 | 3 | 4 | 5 | 6 | | I. Total Consumption Expenditure | 7.8 | 7.1 | 7.4 | 5.9 | -7.1 | | Private | 8.1 | 6.2 | 7.6 | 5.5 | -9.0 | | Government | 6.1 | 11.9 | 6.3 | 7.9 | 2.9 | | II. Gross Capital Formation | 3.7 | 10.8 | 9.7 | 2.3 | -12.9 | | Fixed Investment | 8.5 | 7.8 | 9.9 | 5.4 | -12.4 | | Change in Stocks | -48.8 | 68.3 | 27.2 | -39.7 | -3.5 | | Valuables | -18.6 | 40.2 | -9.7 | -14.2 | -38.0 | | III. Net Exports | | | | | | | Exports | 5.0 | 4.6 | 12.3 | -3.3 | -8.1 | | Imports | 4.4 | 17.4 | 8.6 | -0.8 | -17.6 | | IV. GDP | 8.3 | 6.8 | 6.5 | 4.0 | -8.0 | | Source: NSO. |
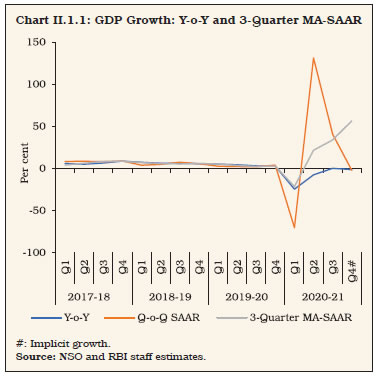 II.1.9 Underlying the vicissitudes in aggregate demand conditions in 2020-21 were compositional shifts among constituents. Private final consumption expenditure (PFCE) registered a contraction for the first time in the past four decades (Chart II.1.2). Government final consumption expenditure (GFCE) continued to provide support to aggregate demand; however, its contribution waned in 2020-21 as stress mounted on government finances. Gross fixed capital formation (GFCF) recorded a contraction, primarily due to prevailing uncertainty and the imposition of lockdown. There was a marked contraction in the external sector too; however, with imports declining sharper than exports, overall net exports made a positive contribution to aggregate demand. The contraction in GDP outpaced the retrenchment in gross value added (GVA) at basic prices on account of Food Corporation of India (FCI) food subsidies being reflected on the Union Budget. Consumption II.1.10 Private consumption - the mainstay of aggregate demand - was severely affected by the pandemic. Wilting from its innate resilience, PFCE contracted by 9.0 per cent in 2020-21, reflecting cliff effects of the impact of the stringent nation-wide lockdown and social distancing norms, heightened uncertainty as a result of transitory and permanent job losses, closures of small, micro and unincorporated businesses and wage resets. Discretionary consumption, particularly on transport, hotel and restaurants, recreation and culture, with a combined share of around 20 per cent in PFCE, remained much below pre-COVID-19 levels. Reverse migration of workers contributed to losses in disposable income, thereby negatively affecting domestic remittances and consumption. Although the deleterious ramifications were faced in both rural and urban areas, contraction in private consumption has been more pronounced in case of the latter. II.1.11 A sharp recovery in consumption has become evident from Q2. Passenger vehicle sales normalised since September 2020. In response to improving demand, production of consumer durables that remained sluggish during H1:2020-21, also witnessed a sharp revival in H2:2020-21. After a marked improvement in January, the March 2021 round of the Reserve Bank’s consumer confidence survey (CCS) showed a worsening consumer sentiment on the back of deteriorating sentiments on general economic situation, income and prices. The future expectations index (FEI) also indicated lower optimism for the year ahead. Going forward, the recovery of the economy from the COVID-19 will critically depend on the robust revival of private demand that may be led by the consumption in the short-run but will require acceleration of investment to sustain the recovery (Box II.1.1). II.1.12 Indicators of rural demand reveal a promising picture. The pandemic affected rural areas less than urban areas where population density is higher. Furthermore, agriculture and allied activities were generally exempted from the lockdown measures and exhibited resilience owing to a confluence of factors working in conjunction, viz., a bountiful monsoon, adequate soil moisture, replenished reservoir levels, improved labour availability during pandemic and favourable terms of trade for agricultural products. The acceleration in fertilizers production and tractor sales supported rural demand and brightened the outlook. After remaining in contraction for 19 consecutive months, motorcycle sales entered expansion territory in August 2020 and have since been robust. Investment and Saving II.1.13 The rate of gross domestic investment in the Indian economy, measured by the ratio of gross capital formation (GCF) to GDP at current prices, reduced to 32.2 per cent in 2019-20 from 32.7 per cent in the preceding year. Although data on GCF are not yet available for 2020-21, movements in its constituents suggest that the slowdown would continue. The ratio of real gross fixed capital formation (GFCF) to GDP decreased to 30.9 per cent in 2020-21 from 32.5 per cent in 2019-20, reflective of weak investment sentiment in the economy. GFCF registered a contraction of 12.4 per cent in 2020-21, in view of the prevailing uncertainty in the economy, waning business confidence and flagging entrepreneurial appetite for new investment. Fixed investment continues to be the Achilles’ heel of the economy and rekindling of animal spirits remains a top priority for policymakers. Box II.1.1
What Drives Recovery in Growth after a Crisis? For a self-sustaining GDP growth trajectory post-COVID-19, a durable revival in private consumption and investment demand together would be critical as they account for around 85 per cent of GDP. In view of the limited share of government consumption demand in GDP (at around 13 per cent in 2020-21), a rebound in private demand is essential to sustain the recovery. Typically, post-crisis recoveries have been led more by consumption than investment; however, investment-led recoveries can be more sustainable and can also lift consumption in parts by better job creation. In either case, private demand plays a pivotal role. In this context, the turning points in the growth cycle, determined by identifying the local maxima and minima - using the first and fourth quartiles of GDP growth, i.e., the lowest 25 per cent and the highest 25 per cent of the growth are examined. Additionally, a few censor rules are applied, such as eliminating back to back minima or maxima and ensuring that there is at least a one quarter gap between maxima and minima. These additional censor rules help to cleanly identify turning points in the GDP cycle (Chart 1). 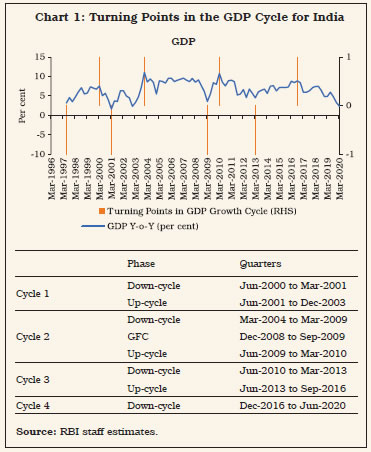
| Table 1: Models of GDP Growth | | Dependent Variable | GDP Growth | | Consumption Growth | Investment Growth | | 1 | 2 | 3 | | Estimation Period | Q2:1998-99-Q1:2020-21 | Q2:1998-99-Q1:2020-21 | | Consumption | 0.63*** | | | Consumption*up-cycle | 0.17* | | | Consumption*down-cycle | 0.42*** | | | Investment | | 0.32*** | | Investment*up-cycle | | 0.14* | | Investment*down-cycle | | 0.26*** | ***: Significant at 1 per cent level.
*: Significant at 10 per cent level.
Source: RBI staff estimates. | A group of AR(1) models of GDP growth, augmented by current period (i) private final consumption expenditure (PFCE) and (ii) investment [gross fixed capital formation (GFCF)] is estimated (Table 1). The analysis uses the GDP cycle dating algorithm to create dummies that capture upcycles and downcycles. The findings suggest that an increase in consumption and investment during a downcycle boosts GDP growth more than during an upcycle. The analysis also suggests that an increase in investment leads to higher consumption4, suggesting that an investment-led recovery could boost both output and consumption. A mix of policies may be needed, as very low capacity utilisation rates may leave little incentive for the private sector to start a strong investment cycle. Therefore, there will be a need for an increase in public investment spending that can crowd in private investment, while private consumption needs to be supported through improvement in consumer credit. As a robustness check, high-frequency lead indicators of consumption and investment demand confirm that an increase in investment and consumption contribute more to GDP growth during a downcycle than in an upswing5. While an increase in investment leads to higher consumption demand through positive income and employment effects, an increase in consumption does not cause an increase in investment. Both results highlight the role of an investment-led recovery for sustaining the post COVID-19 rebound. Reference: Bhadury, S., S. Ghosh and P. Kumar (2020), ‘Nowcasting Indian GDP Growth using a Dynamic Factor Model’, Working Paper No.3, Reserve Bank of India. | II.1.14 Among the components of GFCF, construction activity remained subdued in H1:2020-21. Apart from being affected by the pandemic, construction was throttled by a stringent lockdown, reverse migration of workers from the urban construction sites, a large inventory overhang, coupled with stressed liquidity conditions in the early part of the pandemic. This was also reflected in its proximate coincident indicators – steel consumption and cement production (Chart II.1.3). Infusion of liquidity helped arrest the deterioration, and housing and construction activity rebounded in the latter half of the year with a gradual revival in sales, primarily due to favourable interest rates, steep discounts by developers to liquidate inventory, and reduction in stamp duty by a few states. There was a collapse in investment in machinery and equipment, reflective of muted investment by the private sector. Both its proximate coincident indicators – imports and production of capital goods - registered a contraction in every month of H1:2020-21. 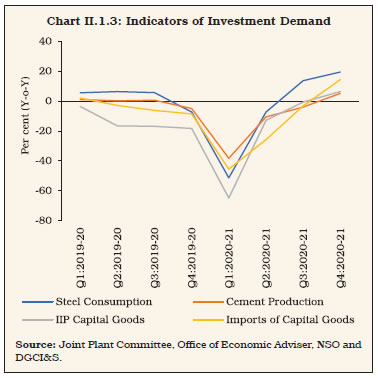 II.1.15 At a disaggregated level, fixed investment in dwellings, other buildings and structures decreased by 0.3 percentage points to 15.5 per cent of GDP in 2019-20, mainly due to public non-financial corporations and the household sector, which offset the gains made by the general government sector through its thrust on infrastructure and affordable housing (Chart II.1.4). There has been a steady growth in fixed investment in machinery and equipment from 10.5 per cent of GDP in 2014-15 to 12.8 per cent in 2019-20, primarily led by the household sector. Investment in intellectual property products (IPP) - expenditure on research and development; mineral exploration; computer software; and other intellectual property products by private non-financial corporations picked up sharply in 2019-20. 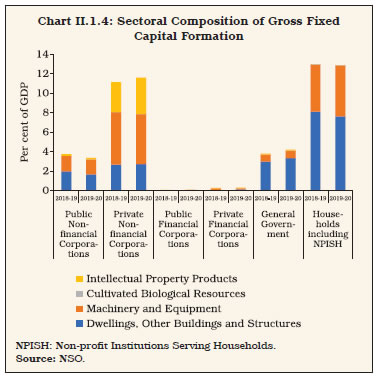 II.1.16 As per the order books, inventories and capacity utilisation survey (OBICUS) of the Reserve Bank, seasonally adjusted capacity utilisation in manufacturing recovered from a sharp drop to 47.9 per cent in Q1:2020-21 to 66.6 per cent in Q3, though still below the long-term average of 73.8 per cent. The inventory-to-sales ratio fell sharply in Q2:2020-21 as sales exhibited an improvement with revival in economic activity while inventories remained close to their level in the preceding quarter. With an increase in both sales and inventories, inventory-to-sales ratio increased marginally in Q3:2020-21. II.1.17 The 93rd round of the Reserve Bank’s industrial outlook survey (IOS) conducted during Q4:2020-21 points to further strengthening of production, order books and employment. While respondents’ sentiments on availability of finance through banks, internal accruals and overseas sources improved, they perceived higher cost pressures emanating from input purchases and salary outgoes. For the first three quarters of 2021-22, manufacturers are optimistic on improvement in production, capacity utilisation, employment conditions and the overall business situation. II.1.18 The rate of gross domestic saving picked up to 30.9 per cent of gross national disposable income (GNDI) in 2019-20 from 30.1 per cent a year ago. This increase was led by financial corporations - more pronounced in the public sphere - coupled with an uptick in financial saving of the household sector - the most important source of funds - by 0.7 percentage points to 7.8 per cent of GNDI in 2019-20, the highest in the past four years (Table II.1.2 and Appendix Table 3). Preliminary estimates show an upsurge in household financial savings to 21.0 per cent of GDP in Q1:2020-21 vis-à-vis 4.0 per cent in Q1:2019-20, owing to the COVID-19 led reduction in discretionary expenditure and the associated surge in precautionary saving despite stagnant/reduced income. The excess household financial savings, however, waned substantially and its rate dropped to 10.4 per cent of GDP in Q2:2020-21 as households switched from ‘essential only’ spending to discretionary spending with gradual reopening/unlocking of the economy. | Table II.1.2: Financial Saving of the Household Sector | | (Per cent of GNDI) | | Item | 2011-12 | 2012-13 | 2013-14 | 2014-15 | 2015-16 | 2016-17 | 2017-18 | 2018-19 | 2019-20 | | 1 | 2 | 3 | 4 | 5 | 6 | 7 | 8 | 9 | 10 | | A. Gross Financial Saving | 10.4 | 10.5 | 10.4 | 9.9 | 10.7 | 10.4 | 11.9 | 11.1 | 11.0 | | of which: | | | | | | | | | | | 1. Currency | 1.2 | 1.1 | 0.9 | 1.0 | 1.4 | -2.1 | 2.8 | 1.4 | 1.4 | | 2. Deposits | 6.0 | 6.0 | 5.8 | 4.8 | 4.6 | 6.3 | 3.0 | 4.2 | 4.2 | | 3. Shares and Debentures | 0.2 | 0.2 | 0.2 | 0.2 | 0.2 | 1.1 | 1.0 | 0.4 | 0.4 | | 4. Claims on Government | -0.2 | -0.1 | 0.2 | 0.0 | 0.5 | 0.7 | 0.9 | 1.1 | 1.3 | | 5. Insurance Funds | 2.2 | 1.8 | 1.8 | 2.4 | 1.9 | 2.3 | 2.0 | 1.9 | 1.5 | | 6. Provident and Pension Funds | 1.1 | 1.5 | 1.5 | 1.5 | 2.1 | 2.1 | 2.1 | 2.1 | 2.2 | | B. Financial Liabilities | 3.2 | 3.2 | 3.1 | 3.0 | 2.7 | 3.0 | 4.3 | 4.1 | 3.2 | | C. Net Financial Saving (A-B) | 7.2 | 7.2 | 7.2 | 6.9 | 7.9 | 7.3 | 7.5 | 7.1 | 7.8 | GNDI: Gross National Disposable Income.
Note: Figures may not add up to the total due to rounding off.
Source: NSO. | II.1.19 There has been a discernible narrowing in the saving-investment gap for the Indian economy since 2013-14, indicating that a larger part of investment funding requirement was being met through domestic resources (Chart II.1.5). The resource gap of non-financial corporations, both public and private, has registered a perceptible decline over the years, reflecting that their investment needs were increasingly being met through internal resources. The drawdown on saving by the general government sector remained at an elevated level and led to excessive draft on households’ financial surplus. 3. Aggregate Supply II.1.20 Aggregate supply, measured by gross value added (GVA) at basic prices, contracted by 6.5 per cent in 2020-21, after growing 4.1 per cent in the preceding year. Disentangling momentum from base effects, three-quarter moving average of seasonally adjusted annualised growth rate (MA-SAAR) of GVA exhibited an uptick in momentum in Q3:2020-21 with gradual easing of restrictions (Chart II.1.6). II.1.21 The deceleration in GVA growth was underpinned by a contraction in the industrial and the services sectors. While industrial GVA, driven by its largest constituent – manufacturing – moved out of contraction in Q3:2020-21, after having registered contraction in the preceding five quarters, the resilience of the agricultural sector provided a floor to the contraction in aggregate supply (Table II.1.3). 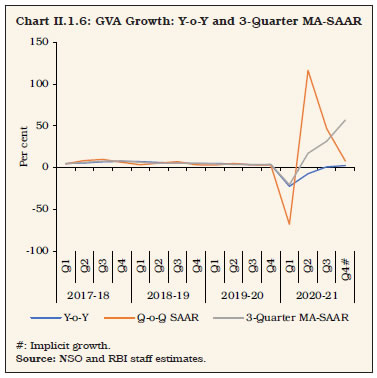
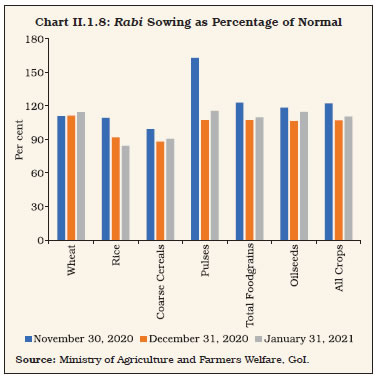
| Table II.1.3: Real GVA Growth | | (Per cent) | | Sector | 2016-17 | 2017-18 | 2018-19 | 2019-20 | 2020-21 | | 1 | 2 | 3 | 4 | 5 | 6 | | I. Agriculture, Forestry and Fishing | 6.8 | 6.6 | 2.6 | 4.3 | 3.0 | | II. Industry | 8.4 | 6.1 | 5.0 | -2.0 | -7.4 | | i. Mining and Quarrying | 9.8 | -5.6 | 0.3 | -2.5 | -9.2 | | ii. Manufacturing | 7.9 | 7.5 | 5.3 | -2.4 | -8.4 | | iii. Electricity, Gas, Water Supply and Other Utility Services | 10.0 | 10.6 | 8.0 | 2.1 | 1.8 | | III. Services | 8.1 | 6.2 | 7.1 | 6.4 | -8.4 | | i. Construction | 5.9 | 5.2 | 6.3 | 1.0 | -10.3 | | ii. Trade, Hotels, Transport, Communication and Services related to Broadcasting | 7.7 | 10.3 | 7.1 | 6.4 | -18.0 | | iii. Financial, Real Estate and Professional Services | 8.6 | 1.8 | 7.2 | 7.3 | -1.4 | | iv. Public Administration, Defence and Other Services | 9.3 | 8.3 | 7.4 | 8.3 | -4.1 | | IV. GVA at Basic Prices | 8.0 | 6.2 | 5.9 | 4.1 | -6.5 | | Source: NSO. | Agriculture and Allied Activities II.1.22 GVA by agriculture and allied activities registered a growth of 3.0 per cent in 2020-21, with record production in foodgrains. This was the only sector which remained in expansion zone in 2020-21, resulting in an increase in the share of agriculture in overall GVA by 1.5 percentage points to 16.3 per cent. II.1.23 The onset of the southwest monsoon (SWM) in 2020 was on time (June 1) and it progressed swiftly to cover the entire country by June 26, 2020, i.e., 12 days prior to its normal date. Notwithstanding a loss of momentum in the month of July due to less rains in north, east and central India, the rainfall revived subsequently and the cumulative SWM rainfall at the end of the monsoon season stood at 9 per cent above the long period average (LPA). As regards the spatial distribution, while 85 per cent of the subdivisions received normal and above normal rainfall, the cumulative rainfall in north-west India was 16 per cent below LPA. Aided by the good spatial and temporal coverage of the monsoon, the area sown was higher by 4.8 per cent year-on-year for kharif crops. II.1.24 The delayed withdrawal of SWM and the simultaneous start of north-east monsoon (NEM) [by October 28, 2020] created adequate soil moisture and reservoir levels. As on January 31, 2021, water storage stood at 63 per cent of the full reservoir level (FRL) capacity, up from the decadal average of 52 per cent (Chart II.1.7). This augured well for rabi sowing which got completed to the extent of 110 per cent of the five-year average (2013-14 to 2017-18) by January 31, 2021. The jump in rabi acreage this year is mainly driven by higher sowing under wheat, pulses and oilseeds (Chart II.1.8). Consequently, total foodgrain production in 2020-21 as per the second advance estimate (AE) is 3,033.4 lakh tonnes, 2.0 per cent higher than that in 2019-20 final estimate (FE) [Table II.1.4]. 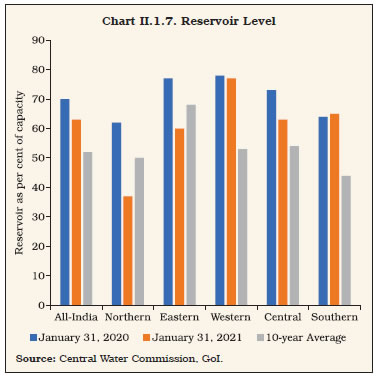
 II.1.25 The production of horticulture crops during 2020-21 was a record at 3,266 lakh tonnes (1st AE), 1.8 per cent higher than the final estimate of 2019-20, surpassing the foodgrain production for the ninth consecutive year (Table II.1.5). The record production in horticulture crops was led by an increase in area under cultivation by 2.7 per cent in 2020-21 over 2019-20 even though productivity declined by 0.9 per cent. Onion cultivation witnessed the highest area expansion at 11.5 per cent. | Table II.1.4: Agricultural Production 2020-21 | | (Lakh tonnes) | | Crop | Season | 2019-20 | 2020-21 | 2020-21 | | 2nd AE | FE | Target | 2nd AE | Variation (Per cent) | | Over 2019-20 2nd AE | Over 2019-20 FE | Over Target | | 1 | 2 | 3 | 4 | 5 | 6 | 7 | 8 | 9 | | Foodgrains | Kharif | 1,423.6 | 1,438.1 | 1,493.5 | 1,479.5 | 3.9 | 2.9 | -0.9 | | | Rabi | 1,496.0 | 1,536.9 | 1,516.5 | 1,554.0 | 3.9 | 1.1 | 2.5 | | | Total | 2,919.5 | 2,975.0 | 3,010.0 | 3,033.4 | 3.9 | 2.0 | 0.8 | | Rice | Kharif | 1,019.5 | 1,022.8 | 1,026.0 | 1,037.5 | 1.8 | 1.4 | 1.1 | | | Rabi | 155.3 | 165.9 | 170.0 | 165.7 | 6.7 | -0.1 | -2.5 | | | Total | 1,174.7 | 1,188.7 | 1,196.0 | 1,203.2 | 2.4 | 1.2 | 0.6 | | Wheat | Rabi | 1,062.1 | 1,078.6 | 1,080.0 | 1,092.4 | 2.9 | 1.3 | 1.1 | | Coarse Cereals | Kharif | 324.9 | 336.1 | 361.5 | 357.4 | 10.0 | 6.3 | -1.1 | | | Rabi | 127.5 | 141.3 | 116.5 | 136.3 | 6.9 | -3.5 | 17.0 | | | Total | 452.4 | 477.5 | 478.0 | 493.6 | 9.1 | 3.4 | 3.3 | | Pulses | Kharif | 79.2 | 79.2 | 106.0 | 84.6 | 6.8 | 6.8 | -20.2 | | | Rabi | 151.1 | 151.0 | 150.0 | 159.6 | 5.6 | 5.7 | 6.4 | | | Total | 230.2 | 230.3 | 256.0 | 244.2 | 6.1 | 6.0 | -4.6 | | Oilseeds | Kharif | 234.4 | 222.5 | 255.5 | 250.1 | 6.7 | 12.4 | -2.1 | | | Rabi | 107.5 | 109.7 | 114.5 | 123.0 | 14.4 | 12.1 | 7.4 | | | Total | 341.9 | 332.2 | 370.0 | 373.1 | 9.1 | 12.3 | 0.8 | | Sugarcane | Total | 3,538.5 | 3,705.0 | 3,900.0 | 3,976.6 | 12.4 | 7.3 | 2.0 | | Cotton # | Total | 348.9 | 360.7 | 360.0 | 365.4 | 4.7 | 1.3 | 1.5 | | Jute & Mesta ## | Total | 98.1 | 98.8 | 105.0 | 97.8 | -0.3 | -1.0 | -6.9 | #: Lakh bales of 170 kg each. ##: Lakh bales of 180 kg each. AE: Advance Estimate. FE: Final Estimate.
Source: Ministry of Agriculture and Farmers Welfare, GoI. |
| Table II.1.5: Horticulture Production | | (Lakh tonnes) | | Crop | 2018-19 | 2019-20 | 2020-21 | Variation (Per cent) | | Final Estimate (FE) | 1st AE | Final Estimate (FE) | 1st AE | 2019-20 FE over 2018-19 FE | 2020-21 1st AE over 2019-20 1st AE | 2020-21 1st AE over 2019-20 FE | | 1 | 2 | 3 | 4 | 5 | 6 | 7 | 8 | | Total Fruits | 979.7 | 957.4 | 1,020.3 | 1,032.3 | 4.1 | 7.8 | 1.2 | | Banana | 304.6 | 296.5 | 326.0 | 337.3 | 7.0 | 13.8 | 3.5 | | Citrus | 134.0 | 131.8 | 145.7 | 142.4 | 8.7 | 8.0 | -2.2 | | Mango | 213.8 | 212.9 | 202.7 | 211.2 | -5.2 | -0.8 | 4.2 | | Total Vegetables | 1,831.7 | 1,880.1 | 1,889.1 | 1,936.1 | 3.1 | 3.0 | 2.5 | | Onion | 228.2 | 244.5 | 260.9 | 262.9 | 14.3 | 7.5 | 0.8 | | Potato | 501.9 | 519.5 | 485.6 | 531.1 | -3.2 | 2.2 | 9.4 | | Tomato | 190.1 | 193.3 | 211.7 | 201.5 | 11.4 | 4.2 | -4.8 | | Plantation Crops | 165.9 | 164.1 | 156.8 | 157.7 | -5.5 | -3.9 | 0.6 | | Total Spices | 95.0 | 93.7 | 103.0 | 102.4 | 8.4 | 9.3 | -0.5 | | Aromatics and Medicinal | 8.0 | 8.2 | 7.3 | 8.1 | -7.7 | -1.2 | 10.6 | | Total Flowers | 29.1 | 28.7 | 30.0 | 27.9 | 3.1 | -2.8 | -6.9 | | Total Horticulture Production | 3,110.5 | 3,133.5 | 3,207.7 | 3,265.8 | 3.1 | 4.2 | 1.8 | | Source: Ministry of Agriculture and Farmers Welfare, GoI. | II.1.26 As in the previous three years, minimum support prices (MSPs) announced in 2020-21 for both rabi and kharif crops ensured a minimum return of 50 per cent over the cost of production. There has been an overall rise in the range of 2.1 to 12.7 per cent in MSPs announced during 2020-21 over the previous year. After record procurement of both rice and wheat in the kharif marketing season (KMS) 2019-20 (October 2019-September 2020) and rabi marketing season (RMS) 2020-21 (April-July 2020), respectively, the procurement of rice during 2020-21 is higher by 26 per cent over the previous year (Chart II.1.9). Despite a jump in offtake during March-November 2020 by 53 per cent over the corresponding period of the last year, the surge in foodstocks during 2020-21 has exacerbated the problem of plenty and brought to fore the inefficiencies in the food security system, with old stock not getting disposed due to inferior quality. As on March 31, 2021, the stocks of rice were 6.5 times the quarterly buffer norms and wheat at two times (Chart II.1.10). II.1.27 Concerted efforts were made so that harvesting and sowing cycles are not disrupted by the spread of COVID-19. Distribution of free foodgrains under the Pradhan Mantri Garib Kalyan Anna Yojana (PM-GKAY) and AatmaNirbhar Bharat Scheme (ANBS) helped budget constrained consumers maintain their consumption levels at a critical time when safety nets needed to be ramped up to mitigate COVID-19 related hardships. Around 8.7 crore farmers were paid the first instalment of ₹2,000 under Pradhan Mantri Kisan Samman Nidhi Yojana in April 2020 itself. Additionally, the Mahatma Gandhi National Rural Employment Guarantee Act (MGNREGA) wage was increased by ₹20 per day, implying supplementary income of around ₹2,000 per annum for around 13.6 crore rural families with an increased budgetary allocation of ₹40,000 crore for 2020-21. Under Pradhan Mantri Garib Kalyan Rojgar Abhiyaan (PMGKRA), provision was made for additional employment to returnee migrant workers for 125 days in six states6 facing high reverse migration. The dates for ongoing conversion of agricultural gold loan and other agricultural accounts into Kisan Credit Card (KCC) accounts were extended. The benefit of 2 per cent interest subvention to banks and 3 per cent prompt repayment incentive for all farmers was extended up to August 31, 2020 for all crop loans up to ₹3 lakh given by banks, due between March 1 and August 31, 2020. 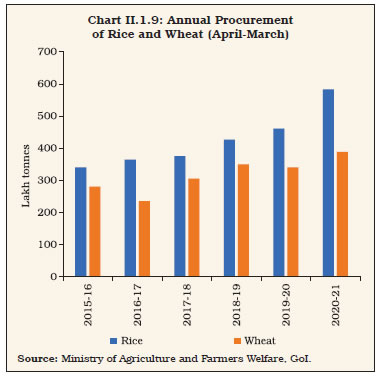 II.1.28 To facilitate transportation of perishable agricultural products, provisions were made for the deployment of railways at fast speed along with launch of Kisan Rath mobile app and All India Agri Transport Call Centre. Also, a fund with a corpus of ₹1 lakh crore has been proposed for development of agriculture infrastructure projects at farm-gate and aggregation points [such as cooperative societies and Farmer Producer Organisations (FPOs)].  II.1.29 Apart from providing immediate succour, the government pressed ahead with far reaching structural reforms to address the built-in inefficiencies associated with public interventions in the farm sector. The Parliament passed three farm bills with the aim of giving a boost to rural India by increasing farmers’ income. They covered delisting of various agricultural commodities from the Essential Commodities Act (ECA) to develop seamless marketing and promote storage infrastructure in agriculture; ‘The Farmers’ Produce Trade and Commerce (Promotion and Facilitation) Act, 2020’ to ensure barrier free trade of agriculture produce; and the ‘Farmers (Empowerment and Protection) Agreement on Price Assurance and Farm Services Act, 2020’ to empower the farmers to engage with processors, aggregators, wholesalers, large retailers, and exporters in a fair and transparent manner. The Farm Acts are currently suspended by the Supreme Court and a four-member expert panel is examining them. II.1.30 Further reforms in the agriculture sector are needed. The current agriculture storage capacity in India in terms of warehouses and cold storages is substantially lower in relation to agriculture production (Charts II.1.11 and II.1.12). Moreover, many of the existing cold storage facilities are either sick or on the verge of getting closed due to lack of capital to upgrade plant and machinery as well as technology. The warehousing storage capacities available with government agencies are primarily used for keeping the central stock of foodgrain for the buffer stock, public distribution systems (PDS) are overstretched due to excessive foodstocks and also need modernisation. This suggests that there is a need for massive investments in storage and supply chain infrastructure in India. 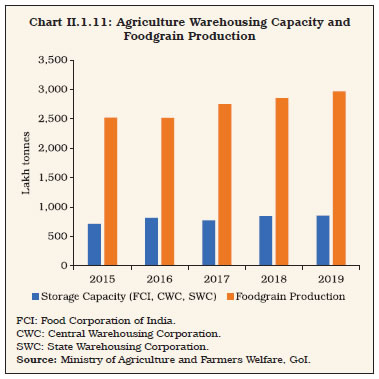 II.1.31 A key role can be played by agricultural extension services to enhance farmers’ awareness and market intelligence to help them make informed decisions, policy stability to give right market signals and incentivise private investments, building bargaining power of farmers through initiatives like development and skilling of FPOs, building a reliable system of recording data particularly related to trade happening outside the Agricultural Produce Market Committees (APMCs) to ensure transparency and effective evaluation in future. II.1.32 The Union Budget 2021-22 has emphasised on infrastructure development in rural areas and the agriculture sector, promotion of agricultural diversification along with enhancing credit flow to allied sectors and improvement in supply chains for perishables through extension of ‘Operation Green’ to 22 perishable commodities. Enhancement in the allocation to the Rural Infrastructure Development Fund (RIDF) from ₹30,000 crore in 2019-20 to ₹40,000 crore in 2021-22 along with doubling of micro-irrigation fund will have a favourable impact on the rural economy and farm infrastructure. The Agriculture Infrastructure and Development Cess (AIDC) on several items (such as fuels, crude oilseeds, pulses and apple) has been imposed to generate funds for improving agriculture infrastructure. This increase in cost, however, has been offset by equivalent amounts of reduction in the basic custom duties to keep prices unaffected for farmers and consumers. On the other hand, custom duties on items such as cotton, raw silk, silk yarn has been increased to help farmers get better prices. The extension of agriculture infrastructure fund to APMCs and integration of additional 1,000 APMC mandis with the electronic national agriculture market (e-NAM) are expected to enhance marketing efficiency in the agriculture sector, thereby benefiting farmers through better access and higher transparency in mandis in years to come. The budget has also focused beyond the traditional activities to generate value addition for the farming community by enhancing credit flow to allied sectors and giving a boost to fisheries and seaweed cultivation. 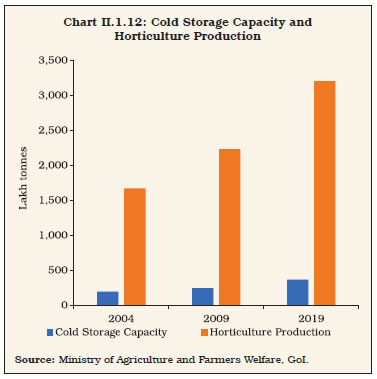
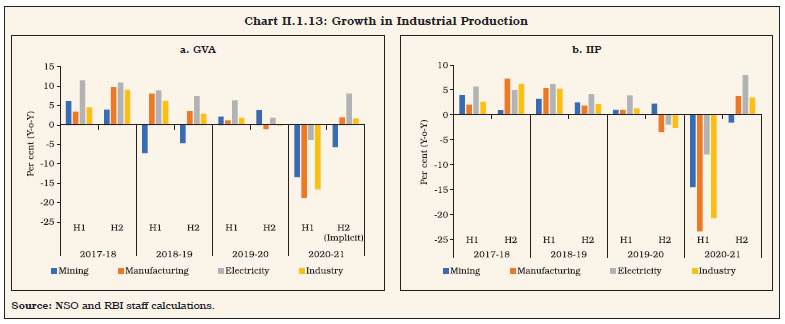 Industrial Sector II.1.33 GVA growth in industry contracted sharply on a y-o-y basis by 7.4 per cent in 2020-21. This is the fifth year of sequential deceleration, including two successive years of contraction in the industrial sector. During Q1:2020-21, industrial activity plummeted sharply, registering a contraction of 31.1 per cent. The turnaround in industrial activity since then has been volatile. IIP data show that the contraction was severe in case of consumer durables and capital goods, as consumers shunned discretionary expenditure while firms curbed investment. Cumulatively, the IIP declined by 8.6 per cent in 2020-21. At the sub-sectoral level, however, electricity, gas, water supply and other utility services recorded a growth of 1.8 per cent in GVA (Charts II.1.13a and II.1.13b) [Box II.1.2]. Box II.1.2
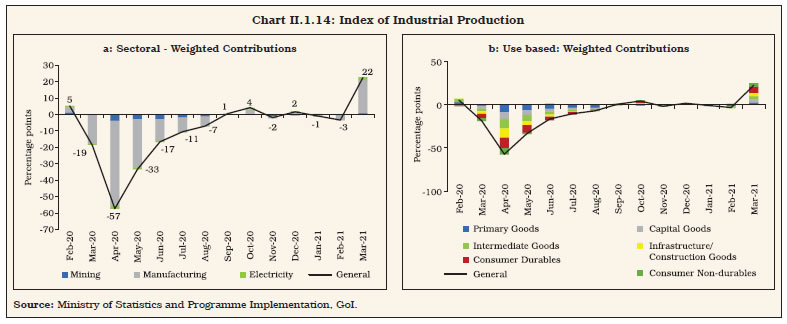
Impact of COVID-19 on Corporate Performance Following the announcement of a nation-wide lockdown on March 25, 2020 and restrictions on mobility that continued even after the gradual opening up of the economy, the corporate sector witnessed a sudden and sharp contraction in demand and also clogged supply chains due to stalled movement of goods, both for inputs used in production processes as well as final products meant for wholesale and retail sale. Survival of businesses in this environment of collapsing sales, vanishing cash flows and sticky operating expenses emerged as a key challenge. In Q1:2020-21, average revenue from sales contracted by 32 per cent for a sample of 2,536 listed firms. Firms resorted to aggressive cost cutting measures, enabling them to lower their total expenditure by 34 per cent. Profits nosedived, endangering their debt servicing capacity. Indian corporates, however, adjusted quickly to the altered business environment. As sales recovered in Q2:2020-21, cost cutting continued as the preferred path to regain efficiency and return to profitability. While revenue contraction moderated to 5.3 per cent, total expenditure (which includes costs) contracted by 12.5 per cent, enabling net operating profit to rise by 33.4 per cent in Q2. However, in Q3, revenue increased by 2.0 per cent and expenditure increased by 0.3 per cent that led to further increase in profits by 35.6 per cent. This in turn improved their capacity to service debt, as evident from the increase in interest coverage ratio (ICR) to 3.7 in Q2 and 4.5 in Q3 from 2.0 in Q1. As demand conditions in many segments normalised fully by the end of Q3:2020-21 to pre-COVID-19 levels, there was evidence of improvement in margins, on account of revenue recovery, cost saving and pass-through of increased costs to retail producer and retail prices. Therefore, profitability has improved further in Q3. In the three quarters of 2020-21 combined, revenues and expenditure declined by 11.6 per cent and 15.2 per cent, respectively, while operational profit (earnings before interest and taxes - EBIT) increased by 7 per cent year-on-year (Chart 1)7. The impact of COVID-19 has been varied for firms of different size/nature of operations. Evidence from both advanced and emerging economies show that smaller sized firms are relatively more vulnerable to extended periods of lockdown (Shen et al., 2020; OECD, 2020; Cowling et al., 2020). Larger firms may have found it easier to cut costs compared to smaller firms during the lockdown. 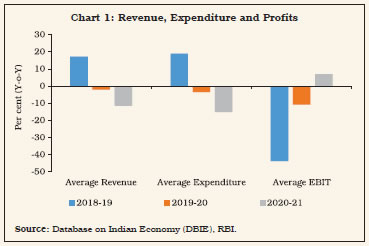 In India, although the interest coverage ratio (ICR) deteriorated for firms of all size categories in 2020-21, small firms appear to have been affected more by the lockdown in Q1:2020-21 (Chart 2)8. However, both small firms and large firms have improved their debt serviceability ratios in Q3 to levels which are higher than pre-pandemic period. Rise in profits and a sharp decline in borrowing costs contributed to the recovery in the interest coverage ratio. Industry-wise sectors which depend on discretionary spending by consumers were impacted more (such as hotels, recreation services, gems and jewellery), while sectors which were excluded from the lockdown (such as food and utilities) experienced relatively lower deterioration in ICR in Q1. References: 1. Cowling, M., R. Brown and A. Rocha (2020), ‘Did You Save Some Cash for a Rainy COVID-19 Day? The Crisis and SMEs’ International Small Business Journal, Vol. 38, No.7, Pages 593-604. 2. Shen, H., M. Fu, H. Pan, Z. Yu, and Y. Chen (2020), ‘The Impact of the COVID-19 Pandemic on Firm Performance’ Emerging Markets Finance and Trade, Vol. 56, No.10, Pages 2213-2230. 3. OECD Policy Responses to Coronavirus (COVID-19), [2020]: SME Policy Responses. | II.1.34 The decline in industrial activity was witnessed across countries (Table II.1.6). India witnessed the severest downturn and it was also one of the first to revive from contraction in September 2020, along with South Korea and Brazil, though growth remained volatile. II.1.35 The growth was supported by improvement in consumer durables and non-durables, especially consumer electronics and white goods, benefitting from pent-up demand (Charts II.1.14). II.1.36 The industrial recovery has also gradually become broad-based (Chart II.1.15). The manufacture of basic metals and motor vehicle segment, which were the largest negative contributors to manufacturing IIP during the lockdown period, saw revival since September 2020. Passenger vehicles and two wheelers, which were facing contraction even before the onset of COVID-19, registered a pronounced uptick since September 2020. 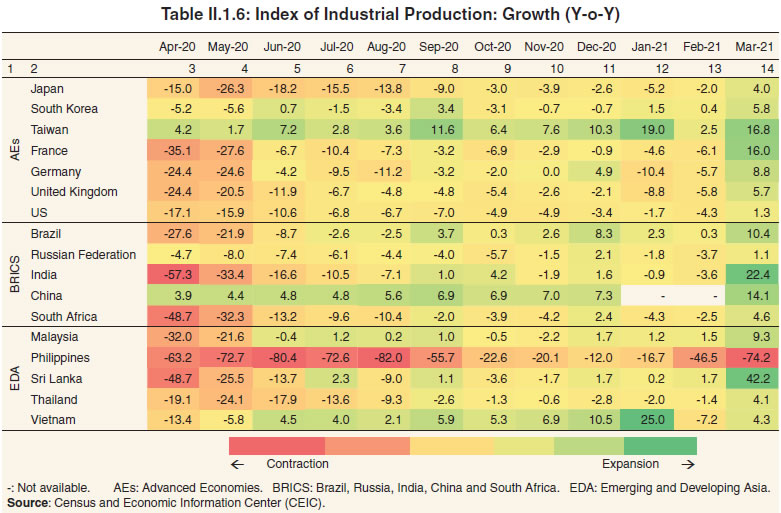
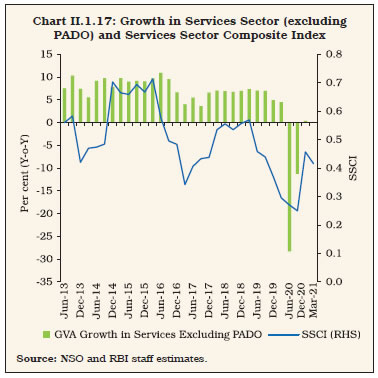
 II.1.37 The mining sector also contracted sharply due to restrictions imposed on movement, lack of demand and labour supply shortages in H1:2020-21. An exception was the coal sector that showed relative resilience as it was exempted from the lockdown. Electricity generation also contracted in H1:2020-21, particularly in Q1, with lockdown restrictions halting manufacturing. With IIP manufacturing improving in the latter half, electricity demand also picked up. Hydro electricity and thermal generation contracted in 2020-21; however, thermal generation grew at a rate of 12.4 per cent in Q4:2020-21. II.1.38 The manufacturing capacity utilisation also remains at low levels (Chart II.1.16). Services Sector II.1.39 The contraction in the services sector in 2020-21 is unprecedented in independent India’s history. Even during the GFC, the services sector remained resilient. In 2020-21, however, construction suffered in the aftermath of the pandemic due to an inventory overhang in residential housing, coupled with stressed liquidity conditions which restricted new launches. The situation was exacerbated by imposed social distancing norms which led to construction activity in Q1:2020-21 getting reduced by half year-on-year. However, the revival of housing sector in H2:2020-21 has been a sharp ‘V’, with sales almost doubling in Q3:2020-21 sequentially, supported by favourable interest rates, adequate liquidity and steep discounts by developers to clear inventory, besides reduction in stamp duty by a few states. With new launches also registering a sharp rebound, the inventory overhang has dropped sharply. II.1.40 The contraction was severe in contact-intensive sectors as activities in hotels, restaurants, and passenger transport remained much below pre-COVID-19 levels. There has been a swift recovery in trading activities as evident in the collection of the goods and services tax (GST) and issuance of E-way bills. This has also imparted a boost to freight traffic. The performance of information technology (IT) companies has been better than their counterparts in the hospitality and the aviation segments. II.1.41 Sector-wise GVA trend estimates for the services show that realised growth in 2019-20 was below trend growth for trade, hotels, transport, communications and services relating to broadcasting and financial, real estate and professional services. In 2020-21, COVID-19 brought major services activities to a near halt and the sector contracted in a broad-based manner by 24.8 per cent in Q1:2020-21 and 10.9 per cent in Q2:2020-21, but in Q3:2020-21, services sector output returned broadly to its level a year ago. Domestic trading activities, railway freight traffic, port cargo, construction activities, and automobiles sales indicators for Q4:2020-21 suggested improvement in services sector. However, with the onslaught of second wave, many indicators showed a moderation though it was not to the extent of last year (Table II.1.7). II.1.42 The Reserve Bank’s services sector composite index (SSCI)9, which tracks activity in construction, trade, transport and financial services and is a coincident indicator of GVA growth in the services sector excluding public administration, defence and other services (PADO), witnessed a marginal decline in Q4:2020-21 after registering an uptick in the previous quarter (Chart II.1.17). 4. Employment II.1.43 As per the annual Periodic Labour Force Survey (PLFS), the labour force participation rate (LFPR) was estimated at 37.5 per cent in 2018-19, which was an increase of 0.6 percentage points over 2017-18. In terms of gender divide, the annual PLFS report suggested that the LFPR for females continues to be lower at 18.6 per cent (rural: 19.7 per cent and urban: 16.1 per cent) in 2018-19, compared to the rate of 55.6 per cent for males (rural: 55.1 per cent and urban: 56.7 per cent). Some of the reasons cited for low female labour force participation include higher educational enrolment, higher household income and absence of suitable employment opportunities. More recent information on LFPR, as available from the Centre for Monitoring Indian Economy (CMIE) database, shows that it increased to 40.2 per cent in March 2021 from 35.6 per cent in April 2020 (Chart II.1.18). 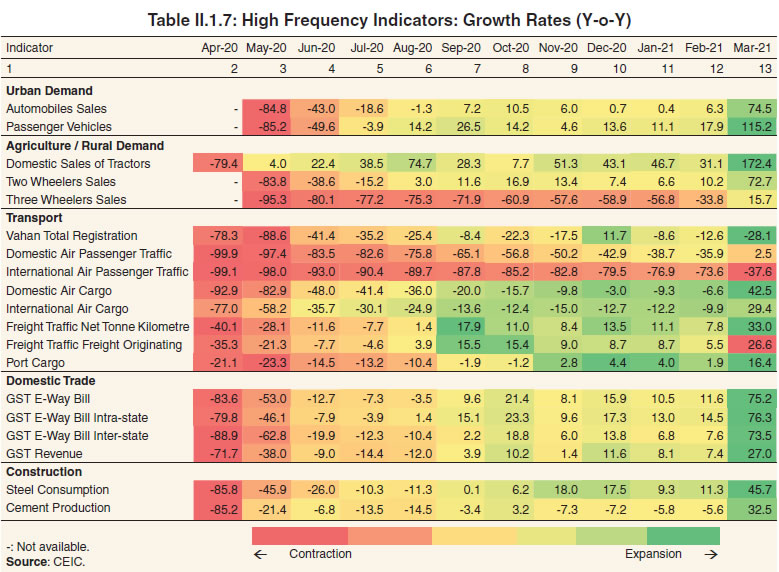
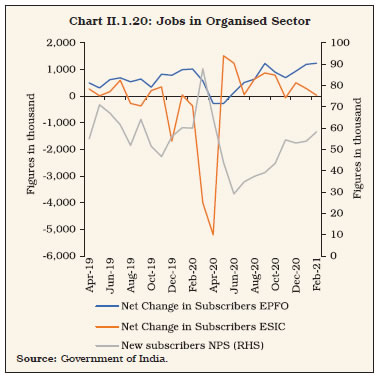
 II.1.44 The majority of states recorded an improvement in employment conditions in the post-lockdown phase, supported by faster recovery in rural employment (Charts II.1.19a and II.1.19b). For the majority of states, LFPR has reached pre-lockdown period levels, with the exception of Delhi, Kerala, Tamil Nadu and Tripura. 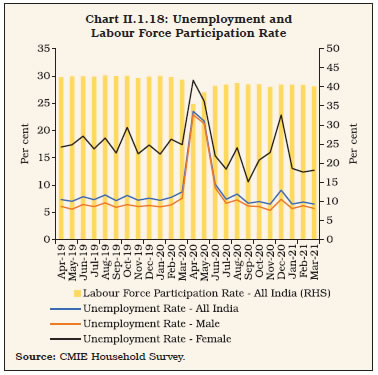 II.1.45 Updated data on organised sector employment measured by payroll data presents a mixed picture with regards to job creation in 2020-21 (Chart II.1.20). On a cumulative basis, the average of net subscribers added to Employees’ Provident Fund Organisation (EPFO) per month decreased marginally to 6.42 lakh in April-March 2021 from 6.55 lakh in the previous year. On the other hand, the average number of members who paid their contribution to Employees’ State Insurance Corporation (ESIC) expanded by 0.64 lakh in April-February 2021 as compared with a contraction of 0.93 lakh in the corresponding period of the previous year. New subscribers to the National Pension Scheme (NPS) also decreased during the same period. 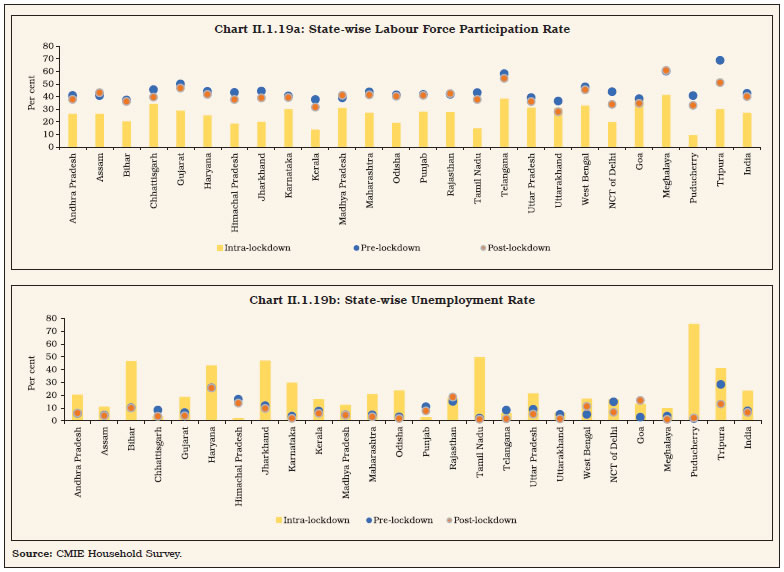
 II.1.46 Several policy initiatives are being taken by the government to promote industrial production and generate employment opportunities. Apart from the measures taken under AatmaNirbhar Bharat Abhiyan, the Government of India introduced PLI scheme worth ₹1.45 lakh crore for 10 key sectors with the objective to attract investments, drive domestic manufacturing, create economies of scale and facilitate their integration with the global supply chain. 5. Conclusion II.1.47 Going forward, reform measures in various areas are likely to uplift India’s growth potential on a sustainable basis. To bring in transparency and credibility in land records and also for facilitating use of property as a financial asset, the government in October 2020 launched the Survey of Villages and Mapping with Improvised Technology in Village Areas (SVAMITVA) scheme. The scheme aims to reduce property litigations and transaction costs and improve the ease of doing business by bringing clarity in land ownership. In September 2020, three labour codes - Industrial Relations Code Bill, 2020, Code on Social Security Bill, 2020 and Occupational Safety, Health and Working Conditions Code Bill, 2020 were passed which would promote harmonious industrial relations, higher productivity and more employment generation. These measures would benefit workers of both formal and informal sectors and positively contribute to mitigate the distress of labour market in India. II.1.48 The launch of the proposed National Monetisation Pipeline will enhance the viability of potential brownfield infrastructure projects and is also likely to help real sectors significantly while freeing resources to finance further investment. The National Highways Authority of India (NHAI) and the Power Grid Corporation of India Limited (PGCIL) have already sponsored one Infrastructure Investment Trust (InvIT) each, with investment of ₹5,000 crore and ₹7,000 crore, respectively. II.1.49 Moving forward, outturn predictability has turned a bit turbid. The growth prospects essentially depend on how fast India can arrest the second wave of COVID-19 pandemic. While the economy has not moderated to the extent during the first wave, the surrounding uncertainties can act as a deterrent in the immediate period. On the supply side, agriculture has proven its resilience, enduring the shock of the pandemic, thus providing support to rural demand and the economy at large. In case of services, recovery has been varied, with revival in construction, trade, freight transportation and information technology (IT) related activities. While performance of contact-intensive sectors is still sub-par, it is also improving. Going ahead, as the vaccination drive picks-up and cases of infections fall, a sharp turnaround in growth is likely, supported by strong favourable base effects. II.2 PRICE SITUATION II.2.1 The global inflation environment remained benign during 2020, with weak aggregate demand outweighing the impact of supply disruptions on commodity prices caused by the pandemic. Inflation in advanced economies dipped in 2020, while in emerging markets it remained sticky at around the previous year’s level. Producer prices softened through the year, but commodity prices rebounded since the second-half, raising concerns about a rise in global inflation on the back of cost push pressures. By March 2021, the World Bank energy price index was 2.7 times its April 2020 low, while ‘metals and minerals’ and agriculture commodity price indices were also up by 68.1 per cent and 26.6 per cent, respectively. Commodity prices have rallied on the back of the slush of global liquidity. Non-energy prices were up by 38.4 per cent, more than offsetting the pandemic-induced weakening of demand. II.2.2 While prices of food and medical supplies rose during the early phase of the lockdown, crude oil and metals prices became the drivers of reflation as rising discretionary consumer spending was unleashed when economies reopened and activity normalised. II.2.3 In India, headline inflation10, breached the upper tolerance band of the inflation target during June-November 2020 due to a sharp spike in food inflation and elevated core (excluding food and fuel) inflation on a combination of adverse developments, i.e., excess rains and supply disruptions; safe haven impelled increase in the prices of gold; and several rounds of hikes in pump prices of petrol and diesel on the back of firming crude oil prices and higher excise duties (Chart II.2.1)11. II.2.4 Although average inflation has remained high in 2020-21, its volatility measured by the standard deviation of the consumer price index (CPI) inflation was lower than a year ago (Table II.2.1). The intra-year distribution of inflation had a high negative skew, reflecting low food inflation prints during December 2020-February 2021, amidst persistently elevated inflation during the rest of the year. Furthermore, kurtosis turned less negative, suggesting few instances of large deviations from mean inflation, which was also reflected in the less wide gap between maximum and minimum inflation during the year. 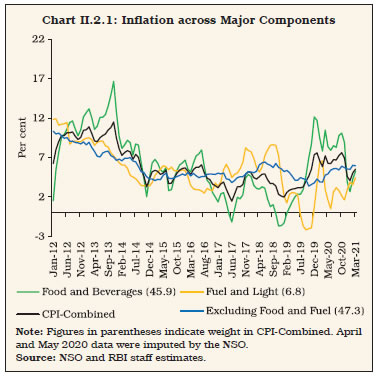
| Table II.2.1: Headline Inflation – Key Summary Statistics | | (Per cent) | | | 2012-13 | 2013-14 | 2014-15 | 2015-16 | 2016-17 | 2017-18 | 2018-19 | 2019-20 | 2020-21* | | 1 | 2 | 3 | 4 | 5 | 6 | 7 | 8 | 9 | 10 | | Mean | 10.0 | 9.4 | 5.8 | 4.9 | 4.5 | 3.6 | 3.4 | 4.8 | 6.2 | | Standard Deviation | 0.5 | 1.3 | 1.5 | 0.7 | 1.0 | 1.2 | 1.1 | 1.8 | 1.1 | | Skewness | 0.2 | -0.2 | -0.1 | -0.9 | 0.2 | -0.2 | 0.1 | 0.5 | -0.7 | | Kurtosis | -0.2 | -0.5 | -1.0 | -0.1 | -1.6 | -1.0 | -1.5 | -1.4 | -0.7 | | Median | 10.1 | 9.5 | 5.5 | 5.0 | 4.3 | 3.4 | 3.5 | 4.3 | 6.5 | | Maximum | 10.9 | 11.5 | 7.9 | 5.7 | 6.1 | 5.2 | 4.9 | 7.6 | 7.6 | | Minimum | 9.3 | 7.3 | 3.3 | 3.7 | 3.2 | 1.5 | 2.0 | 3.0 | 4.1 | *: Excluding the imputed data for April-May 2020, the mean works out to 6.1, standard deviation: 1.2, skewness: - 0.5, kurtosis: -1.1, median: 6.5, maximum: 7.6 and minimum: 4.1. Annual inflation is the average of the monthly inflation rates during the year and, therefore may vary from the annual inflation calculated from the average index for the year.
Note: Skewness and Kurtosis are unit-free.
Source: NSO and RBI staff estimates. | II.2.5 Against this backdrop, sub-section 2 assesses developments in global commodity prices and inflation. Sub-section 3 discusses movements in headline inflation in India, followed by a detailed analysis of its major constituents in sub-section 4. Other indicators of prices and costs are analysed in sub-section 5, followed by concluding observations. 2. Global Inflation Developments II.2.6 International food prices firmed up from June 2020, primarily led by edible oils (palm oil; sunflower oil; and soybean oil) prices, driven by supply shortfalls as well as depreciation of the US dollar (Chart II.2.2). Prices of wheat (tightening supplies among major exporters and a Russian export tax as well as export quota), rice (tight Thai and Vietnamese availability), maize (weaker than expected harvest in the US and South America), meat (protein demand) and sugar also witnessed noteworthy increases. In the non-food category, metal prices recouped losses experienced during the beginning of COVID-19 pandemic and firmed up in consonance with the recovery in the global economy. Supply disruptions in Latin America and pick-up in industrial demand in China and other advanced economies added further upsides. Prices of precious metals, which surged in the beginning of the pandemic, remained elevated on safe-haven demand amidst heightened global uncertainties. By September 2020, however, these prices stabilised as demand for safe haven assets declined due to improving economic conditions. Global crude oil prices, which were on an easing trajectory during January-April 2020 due to the pandemic, picked up significantly from May 2020 on sharp oil supply cuts by the organisation of the petroleum exporting countries (OPEC) and their allies (OPEC plus) by 9.7 million barrels per day (bpd) [amounting to about 10 per cent of global oil supply] beginning May 2020 to be tapered gradually over a period of two years. Successful COVID-19 vaccine trials, and prospects of a faster than expected economic recovery lifted crude prices even further. Average Indian crude oil basket prices almost trebled, reaching US$ 65 per barrel in March 2021 from the low of US$ 20 per barrel in April 2020. Rising crude oil prices were supported by monetary policy easing by advanced economy central banks, supply restraints effected by OPEC plus and geopolitical events in March 2021 on account of attacks on Aramco oil facilities that sent oil prices soaring past US$ 70 per barrel. Demand for oil is expected to rise as global economic activity returns to pre-pandemic levels by 2022. 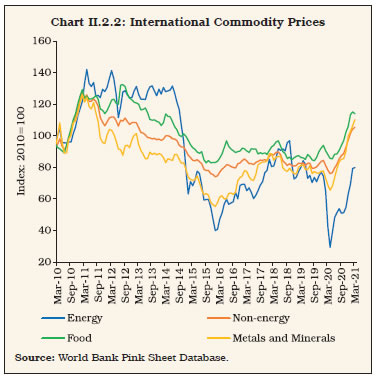 II.2.7 Reflecting these global commodity price developments, consumer price inflation in emerging market and developing economies (EMDEs) picked up after having declined sharply in the beginning of the pandemic, while inflation in advanced economies (AEs) remained below pre-pandemic levels as the effects of weak aggregate demand outweighed the impact of supply interruptions in these countries. 3. Inflation in India II.2.8 A nationwide lockdown was announced in India on March 24, 2020 to contain the spread of COVID-19. The initial lockdown was announced for 21 days effective from March 25, 2020 to April 14, 2020, but it was extended in phases till May 31, 2020, as the number of confirmed positive cases kept rising. Effective from June 1, 2020, announcements for relaxations in lockdown were made as part of “Unlock 1”. Further relaxations were announced in phases to resume services, bringing the economy back to normal as the number of new confirmed positive cases started to decline. As a result of the restrictions imposed during the lockdown, NSO could collect partial data largely through telephonic enquiries from the designated outlets and supplemented it by information collected through personal purchases of field staff of the NSO. Following the principles of adequacy12, indices for all sub-groups under food and beverages (barring meat and fish for April 2020, and prepared meals, snacks, sweets, etc. for April and May 2020), fuel and light, housing and health sub-group under the miscellaneous group were reported by the NSO during April-May 2020. II.2.9 In order to address the non-availability of data for several sub-groups during April-May 2020, the NSO undertook a separate exercise, based on the imputation methodology recommended in ‘Business Continuity Guidelines’ of the Inter-Secretariat Working Group on Price Statistics (ISWG-PS) in May 2020. Broadly, this approach advocated imputing the missing (due to non-availability of data) sub-group index with the index computed at the next higher level of aggregation. This imputation methodology mostly involved the items in the core or non-food non-fuel category, as transactional data for these items were not available during the lockdown. II.2.10 Headline inflation, which started picking up in H2:2019-20, remained elevated during 2020-21 and reached a multi-year peak of 7.6 per cent in October 2020 (highest in 77 months) [Chart II.2.3]. Supply disruptions during the nationwide lockdown, non-availability of labour at mandis, impediments to transportation, and excess rains during the kharif harvest period led to crop damages and pushed up food prices, especially those of vegetables. Subsequently, with the ebbing of these pressures and encouraging prospects for the rabi crop, food inflation started easing from November 2020 and reached 2.7 per cent in January 2021 from 10.1 per cent in October 2020, before increasing to 5.2 per cent in March 2021 largely due to adverse base effects. II.2.11 Fuel prices remained subdued during 2020-21 due to a fall in prices of liquefied petroleum gas (LPG) and non-PDS kerosene; however, LPG prices started increasing from December 2020 onwards. II.2.12 On the other hand, inflation excluding food and fuel, hardened during the year and reached a peak of 6.0 per cent in February 2021 from the historic low of 3.4 per cent in October 2019. This elevation was driven by near double-digit inflation in prices of transport and communication, personal care and effects, and pan, tobacco and intoxicants. II.2.13 For the year 2020-21, inflation picked up to average 6.2 per cent, 140 basis points higher than the previous year (Appendix Table 4). Reflecting the uptick in headline inflation from October 2019, households’ median inflation expectations hardened during 2020-21 by 159 basis points (bps) three months ahead and by 120 bps a year ahead as compared with March 2020 round readings. This upturn in expectations is also corroborated by more forward-looking assessments of professional forecasters. 4. Constituents of CPI Inflation II.2.14 The drivers of CPI headline inflation exhibited distinct shifts during 2020-21 with food group remaining the major contributor along with an increase in the contribution of transport and communication group (Chart II.2.4). Food price inflation moderated during May-June 2020 with the gradual relaxation of lockdown conditions and easing supply constraints, but it picked up again during August-October 2020 as excess rains led to crop damage. Food inflation again eased sharply during November 2020-January 2021 on seasonal ebbs in key prices and as a result, food inflation which had hovered over headline inflation during April-November 2020, trended below it from December 2020. Inflation excluding food and fuel generally remained elevated. Inflation in fuel prices remained subdued and below headline inflation throughout the year. Food II.2.15 Inflation in prices of food and beverages (weight: 45.9 per cent in CPI) crossed 6 per cent in October 2019 and remained elevated till November 2020, contributing 54.8 per cent to overall inflation in 2020-21. This was primarily driven by animal protein items and vegetables because of adverse supply shocks from lockdowns and crop damage caused by excess rains during the monsoon season (Chart II.2.5). Consumers resorted to panic buying and stocking durable food items like cereals and pulses at the beginning of the lockdown. Initial difficulties in transportation, despite food items being exempted from the lockdown related restrictions, and limited availability of labour at the mandis, led to sharp spike in food prices in April 2020. 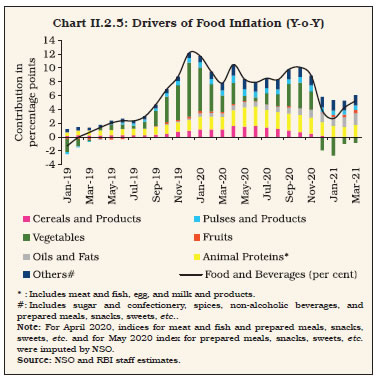
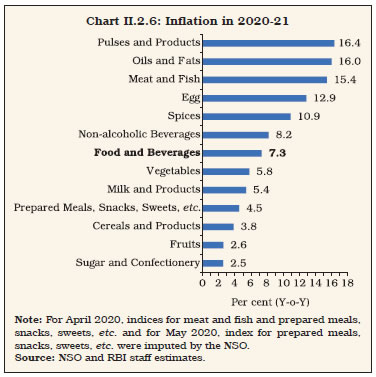 II.2.16 Within food and beverages group, price pressures remained high and broad-based over the ensuing months, with five out of the twelve sub-groups witnessing double digit inflation (pulses, oils and fats, meat and fish, eggs, and spices) [Chart II.2.6]. However, vegetables’ prices went into deflation from December 2020 as prices of onions, tomatoes and potatoes eased seasonally on the back of fresh crop arrivals, leading to a sharp softening in overall food inflation. Inflation increased again during February-March 2021 largely due to adverse base effects and sustained price pressures in oils and fats, pulses, prepared meals, snacks, sweets, etc., and non-alcoholic beverages. II.2.17 At the sub-group level, prices of vegetables (weight: 13 per cent in CPI-Food and beverages) remained the key pressure point during April-November 2020. Excluding vegetables, food inflation would have averaged 96 bps lower during this period. Supply chain disruptions, excess rains and production shortfalls (in the case of potatoes) resulted in higher margins and similar build-up of momentum as in the previous year (Chart II.2.7a). 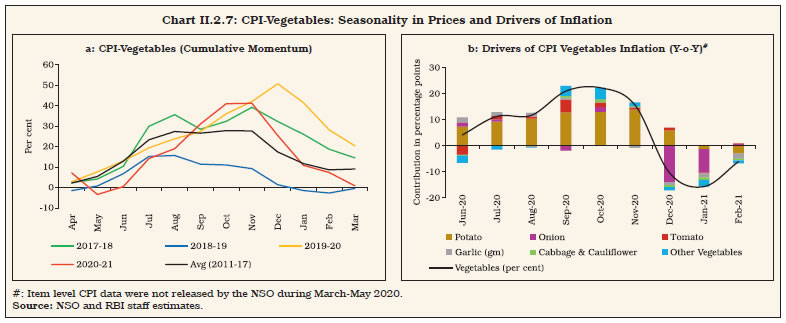 II.2.18 Onion prices underwent an uptick during September-November 2020, reflecting significant damages to kharif crops and late harvesting in major producing states due to excess rains. Higher exports during April-September 2020 by 35 per cent over the corresponding period of previous year also contributed to the ascent. As in the past, the government responded by banning the export of all varieties of onion on September 14, 2020 (lifted in January 2021); increasing imports of better quality (similar to the local variety); relaxing import norms [conditions for fumigation and additional declaration on the Phytosanitary Certificate (PSC) under the Plant Quarantine (PQ) Order, 2003] during October 21, 2020 to January 31, 2021; releasing buffer stocks; and imposing stock limits on wholesalers and retailers to curb market speculation and hoarding. These well-timed steps and fresh arrivals resulted in containing price pressures and onion prices moderated during December 2020-March 2021, barring February 2021 when prices increased due to lower arrivals. II.2.19 In the case of tomatoes, prices picked up during the lean season, i.e., June-July 2020, due to lower supplies on account of pre-monsoon rains related damages to crops and lower plantation than a year ago. Excess rains during the south-west monsoon again lifted prices in September 2020; thereafter tomato prices eased with fresh supplies entering the market. II.2.20 Inflation in potato prices surged from 2.3 per cent in November 2019 to 107.0 per cent in November 2020, which propelled vegetable group inflation to double digits during July-November 2020 (Chart II.2.7b). The two major potato producing states witnessed weather related disturbances - unseasonal rains in Uttar Pradesh in March 2020 and cyclone-related damage to the crop in West Bengal in May 2020 - leading to considerable supply disruptions and lower production [by 3.2 per cent as per final estimates (FE) 2019-20 over 2018-19 FE]. This was further aided by panic buying during the initial months of the lockdown, labour shortages at mandis and lower stock availability in cold storages. However, in October 2020, the government revised down the import duty on potato from 30 per cent to 10 per cent for a quota of 10 lakh tonnes until January 31, 2021 to improve the domestic availability along with relaxation of import norms similar to onions. Reflecting this and fresh arrivals, potato prices eased from December 2020. II.2.21 Inflation in prices of cereals and products (weight: 21 per cent in CPI-Food and beverages) presented mixed dynamics - it remained above 6 per cent for the first four months, followed by moderation in the next eight months of 2020-21 even reaching into the deflation territory during February-March 2021, reflecting market distortions from a complex interplay of massive buffer stocks imparting downward pressure and higher procurement pushing up prices. At the item level, panic buying during lockdown, pick up in rice exports (81 per cent during April-February 2020-21), distribution of wheat and rice under Pradhan Mantri Garib Kalyan Anna Yojana (PMGKAY), record production of both rice and wheat [higher by 1.2 per cent for rice and 1.3 per cent for wheat as per 2nd Advance Estimates (AE) 2020-21 over 2019-20 (FE)], and moderate growth in minimum support prices (MSPs) [2.9 per cent and 2.6 per cent for rice and wheat, respectively] remained the major price drivers in this tangled development. II.2.22 Among protein-rich items such as eggs, meat and fish (weight: 8.8 per cent in CPI-Food and beverages), historically high build-up of price momentum was observed, leading to double digit inflation of 12.9 per cent and 15.4 per cent in the case of eggs and, meat and fish, respectively (Chart II.2.8). Initial fears caused by pandemic resulted in lower consumption demand for eggs and chicken during February-March 2020 which resulted in distress sale by poultry farmers to avoid making losses. As rumours cleared and demand picked up fiercely because of the perception that protein rich items are immunity boosting, supply could not match demand. Supply constraints caused by transport disruption and reverse migration also led to the price pick-up. Meat and fish prices, however, eased in December 2020 in contrast to the usual winter pick-up in prices, reflecting restoration of supplies in the poultry industry. The outbreak of bird flu in several states in January 2021 led to a fall in demand and further easing in prices of poultry items during January-February 2021. The price of chicken picked up sharply in March 2021 reflecting a recovery in demand amid short supply. 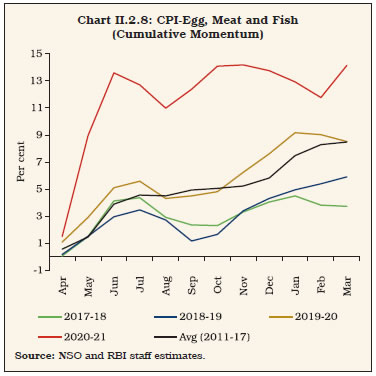 II.2.23 Oils and fats (weight: 7.8 per cent in CPI-Food and beverages) went through a sharp price build-up, leading to a historically high inflation of 24.9 per cent in March 2021 (Chart II.2.9). Precautionary buying on account of the pandemic and rise in international prices of edible oils led to this adverse development. In order to contain the price escalation, import duty in the form of Basic Customs Duty (BCD) on crude palm oil (CPO) was revised down to 27.5 per cent from 37.5 per cent with effect from November 27, 2020, and revised further to 32.5 per cent [including the Agricultural Infrastructure Development Cess (AIDC)] in the Union Budget 2021-22. However, increasing global prices, increase in export levy on crude palm oil by Indonesia from December 2020 and imposition of 8 per cent export tax on crude palm oil by Malaysia from January 2021 kept prices high. 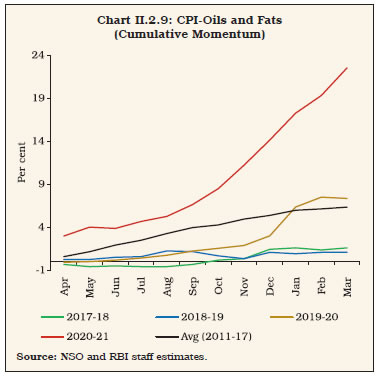 II.2.24 Prices of pulses (weight: 5.2 per cent in CPI-Food and beverages) recorded a 45 month-high inflation of 22.8 per cent in April 2020 primarily led by tur (arhar) and urad (Chart II.2.10). Prices witnessed robust growth during the months of April-May and September-November 2020, reflecting stockpiling by consumers, lockdown and rain related supply disruption and a decline in kharif pulses production (lower by 2.1 per cent as per 2019-20 FE over 2018-19 FE and especially urad production by 43.6 per cent), higher exports and lower imports during April-February 2020-21 [27.2 per cent and (-)14.8 per cent, respectively]. Consequently, the government responded with an array of supply side measures, such as releasing 2 lakh tonnes of tur from the buffer stock through open market sales (OMS), extending the time limit for import of tur under an import quota of 4 lakh tonnes for 2020-21 as on December 31, 2020, expediting imports of urad under the already issued import quota of 1.5 lakh tonnes and extending the memorandum of understanding (MoU) with Mozambique for import of 2 lakh tonnes of tur for another five years. With pulses production rising by 6 per cent for 2020-21 (2nd AE) over 2019-20 (FE), tur, gram and masur prices eased during December 2020-February 2021. 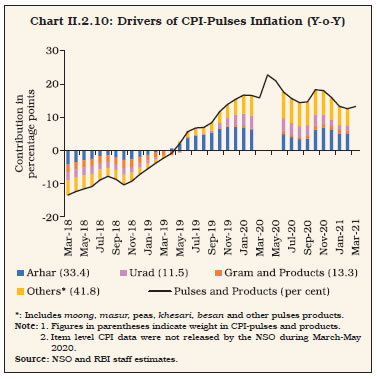 II.2.25 Inflation in fruits (weight: 6.3 per cent in CPI-Food and beverages) remained subdued during a large part of 2020-21, supported by robust production growth of 4.1 per cent in 2019-20 and 1.2 per cent in 2020-21 (as per 1st AE 2020-21 over 2019-20 FE). Inflation in sugar and confectionery (weight: 3.0 per cent in CPI-Food and beverages) also remained subdued and averaged 2.5 per cent in 2020-21 reflecting higher domestic production. Fuel II.2.26 The contribution of the fuel group (weight of 6.8 per cent in CPI) to headline inflation increased to 2.9 per cent in 2020-21 from 1.9 per cent in the previous year. Fuel inflation eased from 6.6 per cent in March 2020 to 0.5 per cent in June 2020 largely due to easing in domestic LPG - which tracked international price movements - and kerosene prices (Chart II.2.11 and Chart II.2.12). Fuel inflation eased again during September-November 2020 due to favourable base effects and continued deflation in kerosene PDS prices. Inflation in firewood and chips and electricity remained moderate during the year, reflecting favourable base effects and possibly subdued demand during the lockdown period. Reflecting these developments, fuel inflation moderated to 1.6 per cent in November 2020 before rising to 4.4 per cent in March 2021 on the back of increase in LPG and kerosene prices.
Inflation Excluding Food and Fuel II.2.27 Inflation excluding food and fuel picked up over 2019-20 levels to an average of 5.5 per cent in 2020-21, with an intra-year peak of 6.0 per cent in February 2021 (Chart II.2.13). Inflation in this category continued to increase till October 2020 on the back of gold prices, hikes in taxes on liquor, and the hike in excise duties on petrol and diesel by the government in May 2020 (Chart II.2.14). It eased to 5.5 per cent by January 2021 due to favourable base effects, before picking up again to close the year at 5.9 per cent as favourable base effects waned and price pressures continued.
II.2.28 Among the major constituents of this group, inflation in miscellaneous category increased to 7.0 per cent in August 2020 and broadly remained elevated thereafter. II.2.29 Housing inflation moderated to 3.3 per cent in 2020-21 (4.5 per cent in 2019-20), reflecting the impact of favourable base effects and lower demand during the lockdown period. A historic low of 2.8 per cent was recorded in September 2020. Net of housing, inflation excluding food and fuel averaged 6.2 per cent in 2020-21, up from 3.9 per cent a year ago. II.2.30 Inflation in clothing and footwear remained moderate averaging 3.4 per cent in 2020-21, largely reflecting muted input costs and weak demand conditions. International prices of cotton, a major input into clothing production, as measured by the Cotton A Index, were affected by the outbreak of COVID-19 and registered a fall during February-April 2020, before recovering gradually thereafter. 5. Other Indicators of Inflation II.2.31 During 2020-21, sectoral CPI inflation, based on the consumer price index of industrial workers (CPI-IW), moderated to 5.1 per cent in May-June 2020 as the impact of the seventh central pay commission (CPC) on housing inflation dissipated and clothing inflation moderated. It dissipated and clothing inflation moderated. It increased during July-October 2020, reflecting increase in food prices. The Labour Bureau released CPI-IW with a new base (2016=100 from 2001=100) in October 2020 with data beginning from September 2020, reflecting the latest consumption pattern of industrial workers. It adopts a broadly similar classification of sub-groups/major groups as in CPI-C/CPI-Urban(U) (base: 2012=100) released by the NSO. Inflation based on the consumer price index for agricultural labourers (CPI-AL) and the consumer price index for rural labourers (CPI-RL), which do not have housing components, also eased to 6.3 per cent and 6.1 per cent in September 2020 from 8.8 per cent and 8.5 per cent in April 2020, respectively, due to favourable base effects, before increasing in October 2020 due to broad based price pressures especially in the case of food prices. All three measures witnessed easing in inflation in November 2020-January 2021 due to favourable base effects and easing in food prices before increasing again during February-March 2021 partly on the back of adverse base effects. II.2.32 Inflation, measured by the wholesale price index (WPI), remained subdued during 2020-21. It went into deflation during April-July 2020 and reached an intra-year low of (-) 3.4 per cent in May 2020 (lowest in 54 months) as prices of non-food primary articles, minerals, crude petroleum and natural gas, mineral oils and manufactured products declined due to a fall in global commodity prices and decrease in demand during the lockdown. Softer WPI inflation, however, did not pass-through to CPI inflation as mark-ups increased amidst social distancing and frozen markets. WPI inflation picked up during August 2020-March 2021, barring December 2020, and reached 7.4 per cent in March 2021 driven by price pressures mainly in fuel and power and manufactured products groups along with adverse base effects. On an annual average basis, WPI inflation softened to 1.3 per cent in 2020-21 from 1.7 per cent in 2019-20. The GDP deflator inflation, however, hardened to 4.6 per cent in 2020-21 from 3.6 per cent in 2019-20.  II.2.33 The divergence between WPI and CPI inflation reflected the behaviour of food inflation. CPI food inflation surged, following the imposition of a nation-wide lockdown even as food price inflation captured in the WPI eased, reflecting the role of supply chain disruptions and opportunistic pricing in raising mark-ups. The extent of retail price increase in the post-lockdown period was also much higher than the usual summer uptick in food prices (Chart II.2.15a). The gap between retail and wholesale price inflation – a proxy for retail margins or mark-ups also remained unusually high (Chart II.2.15b). Since the expected easing of supply disruptions got delayed even after the gradual opening up of the economy due to excess rain induced crop damages, mark-ups played a dominant role in the evolution of the inflation trajectory during 2020-21 (Box II.2.1). II.2.34 After the increases in MSPs during 2019-20 for kharif and rabi crops, there was another moderate hike in 2020-21. The extent of MSP increases varied across crops, ranging from 2.1 per cent in the case of moong and safflower to 12.7 per cent for nigerseed. MSPs of rice and wheat were increased by 2.9 per cent and 2.6 per cent, respectively. II.2.35 Wage growth for agricultural and non-agricultural labourers witnessed a major spike during the year, averaging 7.8 per cent and 7.2 per cent, respectively, during May-March 2020-21, reflecting the shortage of labourers during the lockdown period, and the hike in wages under the Mahatma Gandhi National Rural Employment Guarantee Act (MGNREGA) 2005 by ₹20 effective from April 1, 2020 announced by the central government. However, the growth rates moderated to 6.8 per cent and 5.6 per cent, respectively, in November 2020 from their peaks of 10.5 per cent and 9.9 per cent in June 2020 and July 2020, respectively, before increasing marginally during December 2020-March 2021. Box II.2.1
Post-COVID-19 Surge in Mark-ups and Food Inflation Surprise The Department of Consumer Affairs (DCA) collects, monitors and publishes daily prices of 22 essential food items for 135 centres spread across the country. The DCA data show an increase in retail margins for the 22 food items during the lockdown period (Chart 1a) which varied across centres depending to some extent on the degree of mobility (Chart 1b). An empirical exercise to understand the causal impact of lockdown-induced supply disruptions on price margins of 22 food items across 80 centres13 using a panel regression model14 based on the difference in difference (DID) strategy (Varshney, Roy and Meenakshi, 2020) is evaluated for two sub-samples - centres which experienced comparatively stricter lockdowns vis-à-vis others. Variation in lockdown intensity across centres is measured using Google mobility indices. A high mobility centre (low intensity of lockdown) is defined as the one which witnessed a lower than median fall in the mobility index during the lockdown period. The results show that the interaction term corresponding to the lockdown phase is positive and significant, indicating that the lockdown led to an increase in margins (Table 1). The results also indicate that the increase in margins predominantly originated from low mobility (high lockdown intensity) centres. | Table 1: Price Margin Across Centres | | | All Centres | High Intensity Lockdown Centres | Low Intensity Lockdown Centres | | 1 | 2 | 3 | 4 | | 2020=1 × March 25-May 31=1 | 0.441*** | 0.602*** | 0.136 | | | (0.0914) | (0.116) | (0.142) | | 2020=1 × June-Nov=1 | 0.312** | 0.372* | 0.228 | | | (0.144) | (0.191) | (0.185) | | Adjusted R2 | 0.779 | 0.776 | 0.800 | | Observations | 834133 | 573750 | 260383 | Note: Centre × Commodity FE, State × Month FE, State × Year FE, Commodity × Month FE, and Commodity × Year FE are included in all the above specifications. Standard errors are clustered at the commodity-centre level. Standard errors in parentheses.
***: Significant at 1 per cent level. **: Significant at 5 per cent level.
*: Significant at 10 per cent level.
Source: RBI staff estimates. |
Reference: Varshney, D., D. Roy, and J. V. Meenakshi (2020), ‘Impact of COVID-19 on Agricultural Markets: Assessing the Roles of Commodity Characteristics, Disease Caseload and Market Reforms’, Indian Economic Review, Vol. 55, Pages S83-S103. | 6. Conclusion II.2.36 In sum, headline inflation remained elevated, having tested the upper tolerance level during June-November 2020. The substantial wedge between wholesale and retail price inflation during the year pointed to persistence of supply-side bottlenecks and higher retail margins, underscoring the importance of supply management. Pressures from food items like pulses and edible oils are likely to persist in view of supply-demand imbalances, while cereals’ prices may continue to soften with the bumper foodgrains production in 2020-21. Crude oil prices have picked up on optimism of demand recovery and continuation of OPEC plus production cuts; and are expected to remain volatile in the near-term. Cost-push pressures have also emanated from non-energy commodity prices and could firm up further as economic activity normalises and demand picks up. As pandemics typically leave markets less competitive, the increase in number of active COVID-19 cases with the beginning of second wave from March 2021 along with the associated effects on supply chains amid containment measures could also affect inflation going forward. II.3 MONEY AND CREDIT II.3.1 Monetary conditions eased during the year with the sharp compression in aggregate demand imposed by the pandemic, especially during H1:2020-21 even as ample liquidity was engendered by the Reserve Bank’s operations, both conventional and unconventional. Reserve money (RM) adjusted for first round effects of cash reserve ratio (CRR) expanded strongly, bolstered by a build-up of net foreign assets (NFA) of the Reserve Bank and its proactive liquidity management. The banking system experienced liquidity leakages on account of a substantial upsurge in precautionary currency demand in response to COVID-19 pandemic led uncertainties. Currency hoarding was accompanied by a sharp drop in the velocity of money reflecting pandemic-depressed demand and extreme uncertainty. Money supply (M3) was bolstered by a surge in aggregate deposits with the virtual drying up of spending. Bank credit growth remained subdued as demand languished and risk aversion continued to grip the banking system. Since November 2020, however, incipient signs of credit revival began to show up alongside green shoots of recovery in economic activity, facilitated by favourable liquidity conditions and a gradual unlocking of the economy. With the allaying of illiquidity fears in response to the measures taken by the Reserve Bank, interest rates and spreads eased across financial market instruments and rating categories and, along with expansionary monetary movements, supported congenial financial conditions to nurture the economic recovery. II.3.2 Against this backdrop, sub-section 2 delves into the dynamics underlying movements in RM and, thereby, the shifts in the Reserve Bank’s balance sheet as it went into a crisis management mode. Sub-section 3 examines developments in money supply in terms of its components and sources, throwing light on the movements in assets and liabilities of the banking sector in exceptional times. The underpinnings of bank credit are covered in sub-section 4, followed by concluding observations. 2. Reserve Money15 II.3.3 Reserve money - a stylised depiction of the Reserve Bank’s balance sheet that focuses on its ‘moneyness’16 comprising currency in circulation, bankers’ deposits and other deposits with the Reserve Bank - increased by 14.2 per cent in 2020-21, higher than 9.8 per cent a year ago as well as its decennial average (2011-20) of 10.6 per cent [Chart II.3.1]. Adjusted for the reduction in CRR by 100 basis points (bps) effective March 28, 2020 - which reduced RM statistically by around ₹1,37,000 crore - RM grew by 18.0 per cent during the year17, as against 9.4 per cent a year ago. II.3.4 Among its components, currency in circulation (CiC) constituted around 82 per cent of RM in 2020-21. Although the contribution of currency in determining the overall expansion in RM peaked in April 2020, CiC accounted for 97 per cent of the expansion in RM during the year (110 per cent a year ago), below the decennial average (2011-20) of 109 per cent. II.3.5 The demand for CiC normally follows a predictable intra-month pattern – expansion during the first fortnight due to transactions by households, followed by a contraction in the second fortnight due to flow back of currency from households to the banking system (Chart II.3.2). II.3.6 There was an unusual rise in month-over-month (M-o-M) CiC variation during April-June 2020 vis-à-vis the corresponding period of previous years due to the onset of the COVID-19 pandemic and a panic-driven surge in precautionary demand for cash as cushion in a health crisis (Chart II.3.3 & Chart II.3.4). Subsequently, with the epidemiological curve bending downwards from mid-September 2020 to February 2021 and in the light of the optimism surrounding the mass vaccination programme, the variations in CiC were mostly determined by seasonal factors. Nonetheless, a sudden spurt in the number of confirmed cases of corona virus infection in its second wave from March 2021 onwards may impact variation in CiC for the next financial year. 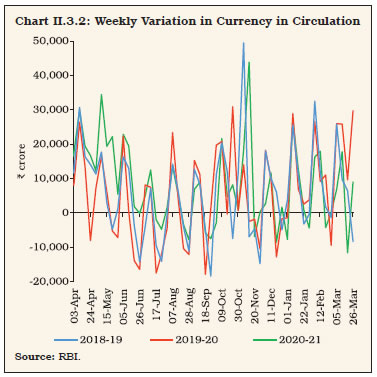
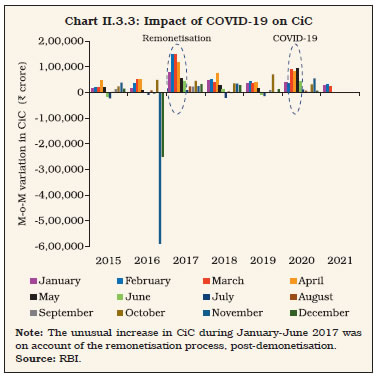 II.3.7 The pandemic-induced dash for cash was superimposed on the usual seasonal spurt in currency demand in Q1:2020-21 which is associated with rabi procurement and kharif sowing. In the following quarter, despite an overall slowdown in economic activity and the seasonal slack in demand from cash-intensive sectors such as construction and agriculture, the fear of virus kept CiC at an elevated level. In Q3:2020-21, CiC expanded, reflecting rise in currency demand for festivals, kharif harvest and the legislative assembly election in one state (Chart II.3.5). Further expansion in CiC was evident during Q4:2020-21 due to harvest of rabi crops, various festivals, run up to the legislative assembly elections in four states and one Union Territory and resumption in construction activities in the real estate sector. The higher CiC growth at 17.2 per cent in 2020-21 (14.0 per cent a year ago) resulted in the currency-GDP ratio increasing to 14.7 per cent (12.0 per cent last year) as cash-intensity in the economy increased in the wake of the pandemic (Chart II.3.6). 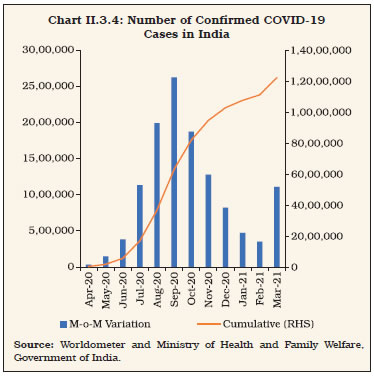
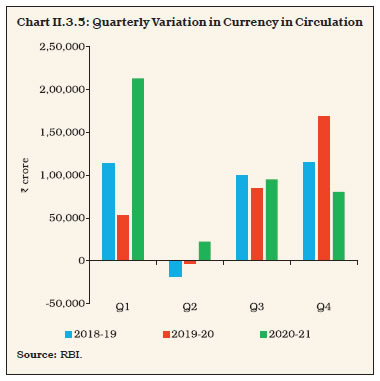
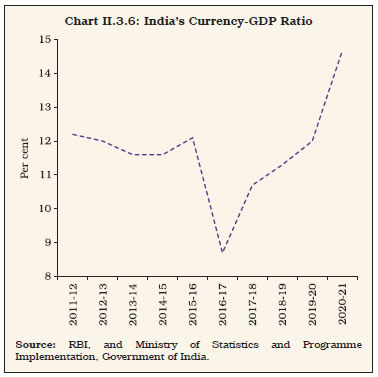 II.3.8 Growth in bankers’ deposits with the Reserve Bank increased marginally by 0.8 per cent in 2020-21 as against a decrease of 4.2 per cent in the previous year, primarily due to the reduction in CRR by 100 bps to 3.0 per cent18, effective March 28, 2020 (Chart II.3.7). II.3.9 The liquidity drain due to expansion in CiC during the year was more than offset by the expansionary effects of accumulation of net foreign assets (NFA) [Chart II.3.8a]. During 2020-21, net purchases from authorised dealers stood at ₹5,16,389 crore vis-à-vis ₹2,96,943 crore in the previous year. Consistent with the accommodative stance of monetary policy, liquidity management operations boosted net domestic assets (NDA) of the Reserve Bank (Chart II.3.8b). 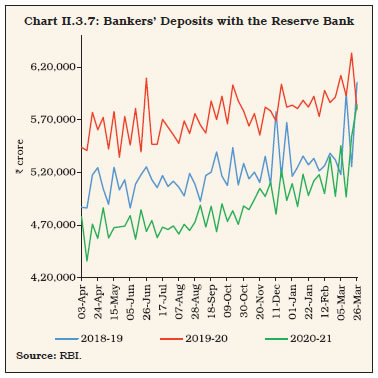
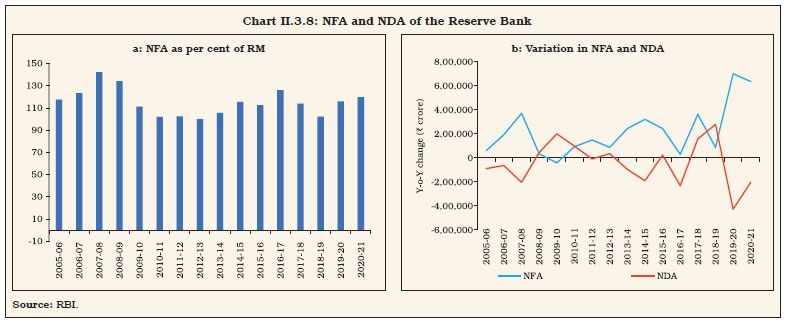 II.3.10 In particular, although net open market purchases (including auctions of special OMOs involving simultaneous purchase and sale of securities for liquidity distribution across the yield curve and OMOs in state development loans) amounted to ₹3.13 lakh crore, the net Reserve Bank credit to the government contracted by ₹1,12,071 crore during 2020-21 – mainly counterbalanced by accretion of massive government surplus balances. On the other hand, contraction in the Reserve Bank’s net credit to banks and the commercial sector (mainly PDs) primarily reflected net liquidity adjustment facility (LAF) absorption aimed at sterilising forex operations and managing the large overhang of liquidity in the system19 (Chart II.3.9). II.3.11 The net LAF position remained in reverse repo mode throughout 2020-21, supplemented by repayment of long-term repo operations (LTROs) [availed during February-March 2020] as well as of targeted LTROs (TLTROs) worth ₹1,23,572 crore and ₹37,348 crore, respectively (Chart II.3.10a and Chart II.3.10b). 3. Money Supply20 II.3.12 Stabilising from a prolonged decline till 2016-17, M3 - comprising currency with the public (CwP), aggregate deposits (AD) and other deposits with the Reserve Bank - recorded a growth of 11.8 per cent during the year (8.7 per cent a year ago) driven by AD, especially time deposits (Chart II.3.11). 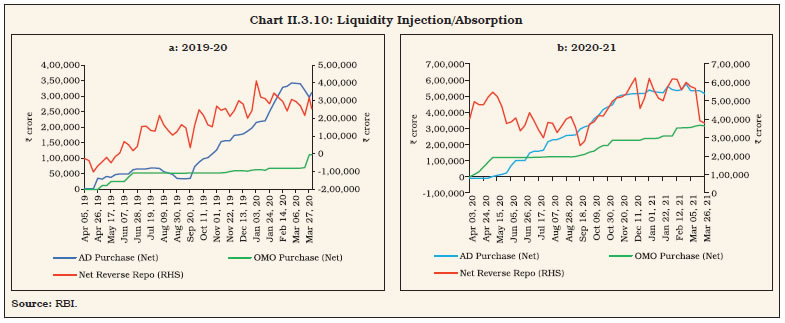
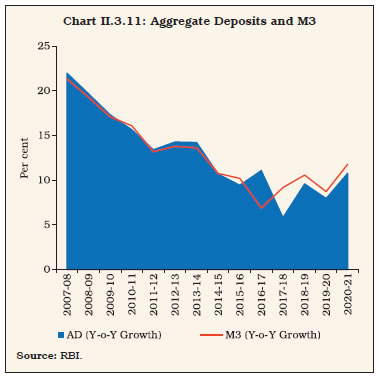 II.3.13 On the components side, M3 expansion was driven by AD, as stated earlier, its largest constituent (85 per cent share). In fact, AD accounted for 79 per cent of the increase in M3 during 2020-21, with time deposits growing at 10.3 per cent in spite of considerable moderation in interest rates, reflecting risk averse behaviour of depositors and lack of lucrative alternative investment avenues (Chart II.3.12). As usual, demand deposits remained volatile (especially during the fortnight ended April 10, 2020 which coincided with the 21 days nation-wide lockdown announced to contain the spread of COVID-19 pandemic) largely mirroring the variations in currency with the public which grew by 17.8 per cent in 2020-21 vis-à-vis 14.0 per cent in the previous year (Chart II.3.13). 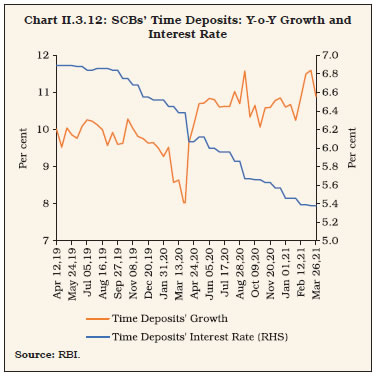 II.3.14 Net foreign exchange assets of the banking sector, net bank credit to the government and bank credit to the commercial sector led the expansion in M3 from the sources side during 2020-21 (Chart II.3.14). The net bank credit to the government grew, with commercial/cooperative banks augmenting their SLR portfolios in search of safe haven, and consequently, their investment in government securities increased by 18.7 per cent in 2020-21 as compared with 10.6 per cent a year ago. On the other hand, bank credit to the commercial sector - the largest constituent of M3 from the sources side - grew at a rate lower than a year ago, reflecting passive liquidity surpluses (Table II.3.1). Growth of NFA of the banking sector mirrored NFA in RM.
Key Monetary Ratios II.3.15 The money multiplier stood at 5.4 in 2020-21, which is marginally below its decennial average (2011-20) of 5.5. However, adjusted for the reverse repo - analytically more meaningful and akin to banks’ deposits with the central bank - money multiplier turned out to be lower at 4.7 in 2020-21, explaining the slowdown in money creation under subdued credit demand conditions. As a result, a substantial expansion in RM (adjusted for the first-round effects of CRR changes) did not translate into a commensurate increase in M3 (Chart II.3.15 & Chart II.3.16). II.3.16 The currency-deposit ratio stood at 17.3 per cent in 2020-21, slightly above its decennial average (2011-20) of 15.1 per cent. The shift in the public’s preference towards stashing cash, the most liquid asset, was in response to the uncertainties relating to the pandemic. The reserves-deposit ratio at 3.7 per cent (4.0 per cent a year ago), reflected the impact of CRR reduction during 2019-20 (Chart II.3.17). | Table II.3.1: Monetary Aggregates | | Item | Outstanding as on March 26, 2021
(₹ crore) | Year-on-Year Growth Rate
(in per cent) | | 2018-19 | 2019-20 | 2020-21 | | 1 | 2 | 3 | 4 | 5 | | I. Reserve Money (RM) | 34,90,233 | 15.1 | 9.8 | 14.2 | | II. Money Supply (M3) | 187,73,142 | 10.6 | 8.7 | 11.8 | | III. Major Components of M3 | | | | | | III.1. Currency with the Public | 27,57,847 | 16.7 | 14.0 | 17.8 | | III.2. Aggregate Deposits | 159,67,947 | 9.6 | 8.0 | 10.8 | | IV. Major Sources of M3 | | | | | | IV.1. Net Bank Credit to Government | 56,92,569 | 11.1 | 14.2 | 12.5 | | IV.2. Bank Credit to Commercial Sector | 116,10,050 | 12.7 | 6.3 | 5.2 | | IV.3. Net Foreign Assets of the Banking Sector | 45,11,386 | 5.1 | 22.4 | 20.1 | | V. M3 net of FCNR(B) | 186,24,899 | 10.6 | 8.7 | 12.1 | | VI. Money Multiplier | 5.4 | | | | Note: Data are provisional.
Source: RBI. |
4. Credit II.3.17 With the extant policy prescription of 3.5 per cent and 18 per cent for CRR and SLR, respectively, around 79 per cent of the deposits were available with the banking system for extending credit. However, SCBs’ credit-deposit ratio moderated to 72.4 per cent in 2020-21 from 76.4 per cent a year ago, largely reflecting the subdued credit demand conditions in the economy even as deposit mobilisation remained robust (Chart II.3.18 & Chart II.3.19). 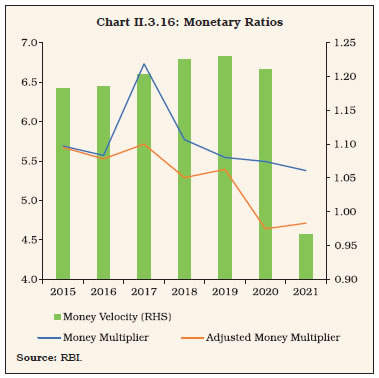
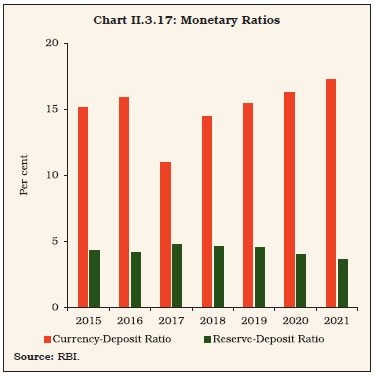
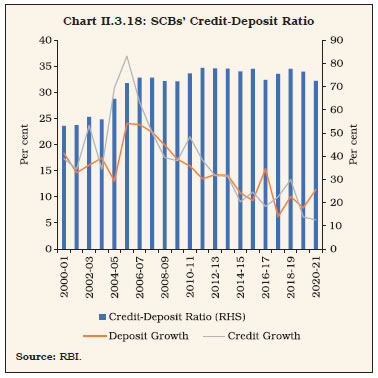
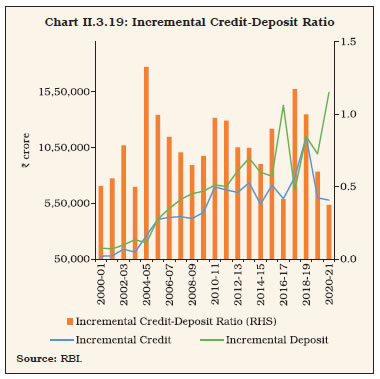 II.3.18 The y-o-y growth in SCBs’ credit, which started slowing down in 2019-20, was further impacted during H1: 2020-21 in the wake of COVID-19 pandemic related restrictions and stood at 5.1 per cent for October 2020 (the lowest since May 2017). However, the worst seems to be over as it gradually recovered lost pace, backed by resumption in economic activity. During 2020-21, as per Section 42 returns, financial year variation in SCBs’ credit turned positive for the first time in November 2020 and its growth stood at 5.6 per cent on a year-on-year basis for 2020-21 as compared with 6.1 per cent a year ago. A positive momentum in credit offtake since November 2020 reflects recovery in economic activity that has been supported by the cumulative reduction in the policy repo rate by 250 bps since February 2019, and 115 bps since March 2020, as well as various liquidity enhancing measures undertaken by the Reserve Bank, and supported by several sector specific measures announced by the government during the year (Chart II.3.20). The credit-to-GDP gap narrowed as at end-September 2020 (Chart II.3.21); however, the gap still continues to be large, reflecting the persisting slack in credit demand in the economy. 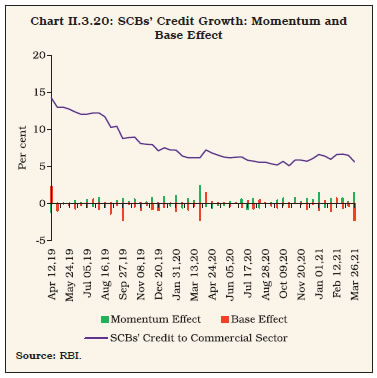 II.3.19 The slowdown in SCBs’ credit growth during 2020-21 has been broad-based across all major sectors, except agriculture. According to data on the sectoral deployment of bank credit21 for March 2021, credit growth to agriculture and allied activities accelerated to 12.3 per cent in March 2021 (4.2 per cent a year ago), the highest since April 2017. Credit growth to industry decelerated marginally to 0.4 per cent (0.7 per cent a year ago) mainly due to credit to large industries, which contracted by 0.8 per cent in March 2021 (as compared with a growth of 0.6 per cent a year ago). This is primarily on account of large industries obtaining financial resources from non-bank sources, while the silver lining has been provided by the robust performance of credit to medium industries which registered a growth of 28.8 per cent in March 2021 (as compared to contraction of 0.7 per cent a year ago), reflecting the positive effects of various measures taken by the Government of India and the Reserve Bank for the micro, small and medium enterprises (MSME) sector. Credit growth to micro and small industries has witnessed marginal growth in the recent period (Table II.3.2). 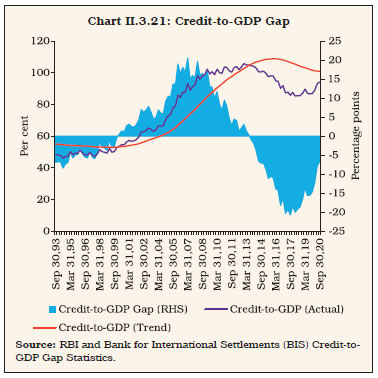 II.3.20 Insofar as credit to industrial sub-sectors is concerned, credit to food processing; textile; leather and leather products; wood and wood products; paper and paper products; glass and glassware; and gems and jewellery registered accelerated growth in 2020-21 on a year-on-year basis. However, credit growth to mining and quarrying; rubber, plastic and their products; as well as vehicles, vehicle parts and transport equipment decelerated. Industries such as beverages and tobacco; petroleum, coal products and nuclear fuels; chemicals and chemical products; basic metal and metal products; cement and cement products; all engineering and construction witnessed contraction in credit offtake. | Table II.3.2: Credit Deployment to Select Sectors | | Sectors | Outstanding as on March 26, 2021
(₹ crore) | Year-on-Year Growth (Per cent) | | 2018-19* | 2019-20# | 2020-21## | | 1 | 2 | 3 | 4 | 5 | | Non-food Credit (1 to 4) | 96,62,022 | 12.3 | 6.7 | 4.9 | | 1. Agriculture & Allied Activities | 12,99,914 | 7.9 | 4.2 | 12.3 | | 2. Industry (Micro & Small, Medium and Large) | 29,18,028 | 6.9 | 0.7 | 0.4 | | 2.1. Micro & Small | 3,83,854 | 0.7 | 1.7 | 0.5 | | 2.2. Medium | 1,36,054 | 2.6 | -0.7 | 28.8 | | 2.3. Large | 23,98,121 | 8.2 | 0.6 | -0.8 | | (i) Infrastructure | 10,91,624 | 18.5 | -0.2 | 3.6 | | of which: | | | | | | (a) Power | 5,66,455 | 9.5 | -1.6 | 1.2 | | (b) Telecommunications | 1,13,080 | 36.7 | 24.4 | -21.3 | | (c) Roads | 2,36,947 | 5.2 | 0.7 | 34.4 | | (ii) Chemicals & Chemical Products | 1,86,911 | 17.5 | 6.0 | -7.9 | | (iii) Basic Metals & Metal Products | 3,28,663 | -10.7 | -5.7 | -6.2 | | (iv) Food Processing | 1,65,669 | 1.1 | -1.9 | 7.5 | | 3. Services | 26,30,566 | 17.8 | 7.4 | 1.4 | | 4. Personal Loans | 28,13,513 | 16.4 | 15.0 | 10.2 | *: March 2019 over March 2018. #: March 2020 over March 2019. ##: March 2021 over March 2020.
Note: Data are provisional.
Source: RBI. |
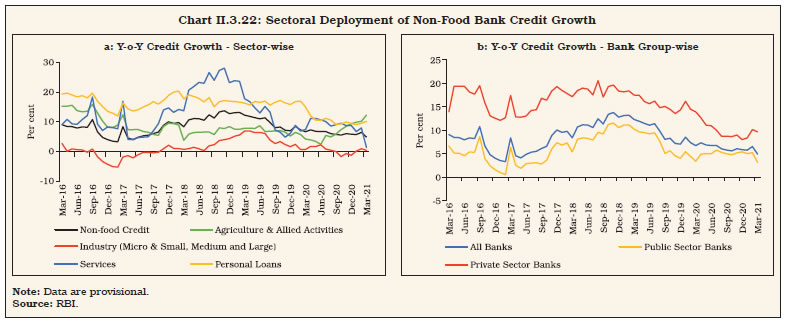 II.3.21 After witnessing a marginal contraction in 2019-20, credit growth to infrastructure, which accounts for around 37 per cent of industrial credit, showed some improvement during 2020-21, mainly due to significant acceleration in credit growth to roads, reflecting government’s push for this segment. However, credit to telecommunications witnessed a significant contraction, while credit to power showed some recovery. Credit growth to the services sector decelerated to 1.4 per cent during 2020-21 from 7.4 per cent in the previous year, primarily driven down by sharp deceleration in credit growth to NBFCs after a spurt in the preceding year and contraction in credit to professional services. However, credit to wholesale trade bucked the downtrend, registering accelerated growth. Personal loans growth decelerated during the year but remained in double digits. II.3.22 As per sectoral deployment of bank credit database22, on March 26, 2021, non-food credit (NFC) growth decelerated to 4.9 per cent from 6.7 per cent a year ago. Among bank groups, public sector banks registered credit growth of 3.1 per cent in March 2021 (3.4 per cent a year ago), whereas, credit extended by private sector banks grew by 9.6 per cent (13.9 per cent a year ago) mainly due to deceleration in credit growth in the personal loans segment (Chart II.3.22.a and Chart II.3.22.b). 5. Conclusion II.3.23 To sum up, despite a surge in currency demand with the onset of COVID-19 pandemic, monetary conditions eased on account of proactive liquidity management measures undertaken by the Reserve Bank through conventional and unconventional measures. A gradual pick up in economic activity during the second half of 2020-21 pulled up credit growth. Going forward, accommodative liquidity conditions and interest rates, several growth enhancing measures announced by the government and commencement of the mass vaccination drive are likely to nurture the recovery which, in turn, is expected to have a favourable bearing on credit demand and supply. II.4 FINANCIAL MARKETS II.4.1 After the pandemic shock in H1:2020, global financial markets quickly regained normalcy over the ensuing period, drawing support from liquidity flushed in by global central banks and unprecedented fiscal support by governments. Financial conditions eased and the return of risk appetite enhanced the demand for financial assets across risk and rating categories with equity markets turning exuberant and scaling fresh heights in several countries. Emerging market economies (EMEs) like China and India received surges of portfolio flows. The US dollar weakened, paving the way for appreciation of other currencies in tandem with improvement in risk sentiment. Bond markets recorded sharp falls in yields, supported by liquidity infusion and policy rate cuts by central banks. However, global bond yields seemed to have bottomed out. The yield on US 10-year G-sec has risen by 123 basis points (bps) since its low in early-August (till March 31, 2021). Indian generic 10-year G-sec yield firmed up 39 bps over the same period. II.4.2 In India, the equity market made a sharp V-shaped recovery in sync with global markets on the back of massive fiscal and monetary stimuli and gradual easing in COVID-induced restrictions. The Reserve Bank announced liquidity measures aggregating ₹13.6 lakh crore (6.9 per cent of nominal GDP for 2020-21) during February 6, 2020 - March 31, 2021. This shrank spreads and pushed market rates down. On the back of policy support, the Sensex gained 91 per cent from its post-pandemic lows during 2020-21, which was among the highest worldwide. The rally was, however, interrupted intermittently by the rise in COVID-19 cases and simmering India-China border tensions. Domestic equities scaled all-time peak in H2:2020-21 on record foreign portfolio investment (FPI) inflows, better than expected corporate earnings, pick-up in economic activity and roll-out of vaccines in the country and abroad. Indian Rupee depreciated to touch a historical low of 76.91 on an intra-day basis on April 22, 2020 due to unprecedented FPI outflows induced by the pandemic. The Indian rupee subsequently appreciated in line with other emerging market currencies, led by strong FPI inflows, as risk appetite returned for EME assets amidst pick-up in economic activity, progress on vaccine discovery and inoculation and easing of COVID-19 related restrictions. Moreover, India was the only major country among emerging markets (excluding China) that received equity FPI inflows in calendar year 202023. II.4.3 Money market developments are detailed in sub-section 2. G-sec yields are discussed in sub-section 3. Sub-section 4 presents developments in the corporate bond market wherein yields eased significantly in 2020-21. Sub-section 5 profiles developments in the domestic equity market, followed by a discussion on movements in the Indian rupee in the foreign exchange market in sub-section 6, and finally followed by the concluding sub-section on some forward-looking perspectives. 2. Money Market II.4.4 After the global market turmoil during March 2020 when financial spreads spiked and the money market rates firmed up, the money market stabilised through the rest of 2020-21 amidst proactive liquidity management by the Reserve Bank, using several instruments at its command. II.4.5 To address any liquidity shortage during the pandemic and the unusual expansion in currency in circulation due to pandemic-stricken tendency to hold cash, the Reserve Bank conducted liquidity management operations through a variety of conventional and unconventional instruments as set out in chapters III and V. II.4.6 Furthermore, as part of the AatmaNirbhar Bharat programme announced by the Government of India (GoI) in May 2020, the Reserve Bank notified a special liquidity scheme at the repo rate to improve the liquidity position of Non-Banking Financial Companies/Housing Finance Companies (NBFCs/HFCs) to avoid any potential systemic risks to the financial sector on July 1, 2020. The aggregate principal amount invested by the Reserve Bank under the scheme stood at ₹7,126 crore. II.4.7 The weighted average call rate (WACR) in the unsecured call money market – the operating target of monetary policy – remained within the policy corridor with a downward bias till mid-October 2020 before slipping below the reverse repo rate, reflecting surplus liquidity conditions (Chart II.4.1). The average spread of the WACR over the policy repo rate increased to (-) 63 bps in 2020-21 from (-) 9 bps in 2019-20 as surplus liquidity in the banking system prevailed during the entire year. In H2: 2020-21, overnight collateralised and uncollateralised rates, and at times 91-day treasury bills (T-Bills) and commercial paper (CP) rates, fell below the reverse repo rate. 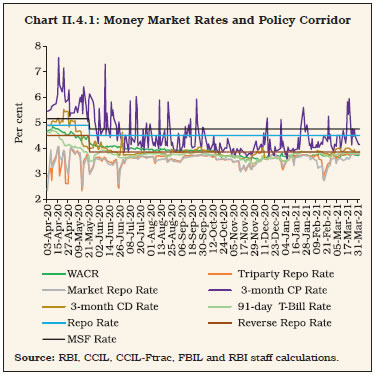 II.4.8 During 2020-21, volatility in the call moneymarket, measured by the coefficient of variation24 of the WACR, increased to 8.34 from 7.55 in 2019-20, reflecting swings in liquidity conditions. The triparty repo as well as the market repo rates remained below the WACR by 37 bps and 38 bps, respectively, on an average. II.4.9 The average daily volume in the money market (call money, triparty repo and market repo taken together, excluding Saturdays) increased by 39 per cent to ₹3,36,371 crore during 2020-21 from ₹2,42,658 crore in 2019-20 (April-March). Volumes in the triparty repo and market repo segments increased and they accounted for 69 per cent and 28 per cent, respectively, of the total money market volume (call/triparty repo and market repo) during 2020-21 as compared with 68 per cent and 25 per cent, respectively, in 2019-20 (Chart II.4.2). In the call money segment, average daily volumes decreased by 34 per cent during the year to ₹10,993 crore (from ₹16,558 crore), reducing market share to 3 per cent from 7 per cent in the previous year. 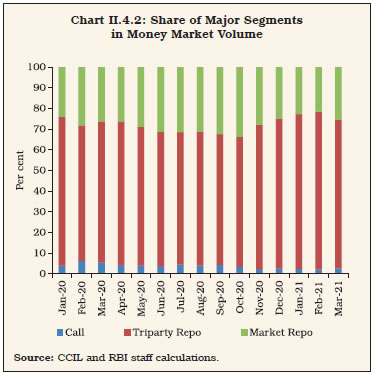 II.4.10 Interest rates on other money market instruments, viz., 91-day T-Bills, certificates of deposit (CDs) and CPs generally softened on account of surplus liquidity during 2020-21. With the decrease in the policy repo rate and proactive liquidity augmenting measures by the Reserve Bank, the spread of CD rates over T-bill rates narrowed significantly from 44 bps in Q1:2020-21 to 7 bps during Q2:2020-21, but widened marginally during Q3:2020-21 to 8 bps. Spreads of CD rates over T-bill rates, however, narrowed to 6 bps in Q4: 2020-21 (Chart II.4.3). II.4.11 The average daily spread of 3-month CP(NBFC) rates over the 91-day T-bill rates decreased from 31 bps during Q2:2020-21 to 22 bps in Q3:2020-21, before increasing to 35 bps in Q4:2020-21. The weighted average discount rates in the primary CP market, which hardened in end-September 2020 to 4.6 per cent, softened thereafter by about 100 bps to 3.7 per cent as at end-December 2020, before inching up thereafter to 4.7 per cent by end-March 2021 (Chart II.4.3). Similarly, the 3-month CP rates for both NBFCs and non-NBFCs hardened as well. The 3-month CP (NBFC) rate increased from 3.4 per cent at end-December 2020 to 3.5 per cent by end-March 2021. Concomitantly, the 3-month CP (non-NBFC) rate increased from 3.3 per cent at end-December 2020 to 3.7 per cent at end-March 2021. 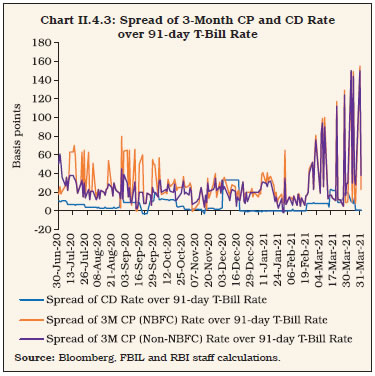 II.4.12 In the primary market, fresh issuance of CDs decreased to ₹1.3 lakh crore during 2020-21 as compared with ₹3.9 lakh crore in the previous year (April-March). New issuance of CPs in the primary market also decreased to ₹17.4 lakh crore in 2020-21 from ₹22.0 lakh crore in 2019-20 (April-March). 3. G-sec Market II.4.13 In April 2020, the G-sec yields hardened initially due to selling pressure from FPIs, expectation of increase in government borrowing, rise in US treasury yields and adverse developments in mutual fund sector leading to redemption stress and intensified liquidity pressures. However, yields softened later tracking the Reserve Bank’s announcement of special liquidity facility for mutual funds (SLF-MF), conduct of OMOs and decline in crude oil prices. In the month of May 2020, bond yields again rose due to upward revision of gross market borrowings of GoI for 2020-21 to ₹12 lakh crore from the budgeted level of ₹7.8 lakh crore but fell subsequently after the monetary policy committee (MPC) reduced the repo rate by 40 bps. In June 2020, G-sec yields hardened as market sentiment was dampened by the downgrade in India’s sovereign rating to a negative outlook by Moody’s Investor service from Baa2 to Baa3, escalation of Indo-China border tensions and selling pressure from FPIs. Movement in US treasury yields and crude oil prices also weighed on the yield movements. Overall, during Q1:2020-21, the 10-year generic G-sec yield softened by 25 bps to close lower at 5.89 per cent on June 30, 2020. II.4.14 During Q2:2020-21, the 10-year generic G-sec yield hardened by 13 bps, tracking higher than expected CPI data prints for June 2020 and July 2020, status quo on the policy rate in the August 2020 meeting of the MPC and subsequent MPC minutes reflecting concerns on elevated inflation. Subsequently, a series of measures announced by the Reserve Bank to foster orderly market conditions on August 31, 2020 led to a sharp decline in bond yields. Furthermore, bond yields drew comfort from a series of OMOs carried out by the Reserve Bank. The release of lower-than-expected CPI data for August 2020 and reports that the GoI is unlikely to announce additional market borrowings in H2:2020-21 supported bond yields. II.4.15 In Q3:2020-21, softening of G-sec yield continued, and it declined by 13 basis points in October 2020 in response to an unchanged borrowing calendar for the second half of 2020-21, announcement of conduct of OMO in State Development Loans (SDL), increase in size of OMO purchases, and extension of held-to-maturity (HTM) benefit by one more year up to March 31, 2022. During November 2020, G-sec yields moved in a narrow range and hardened marginally by 3 basis points. In December, yields declined marginally as upward pressure on yields due to increase in crude oil prices and profit booking was more than offset owing to reduced supply pressure as the Reserve Bank decided not to accept any bids for benchmark paper in primary auction in end-December. Overall, the 10-year generic G-sec yield declined by 15 bps in Q3:2020-21. II.4.16 In Q4:2020-21, the G-sec yield initially softened on the back of buying support by mutual funds and foreign banks. It rebounded thereafter and remained elevated after the government announced additional borrowing of ₹80,000 crore for 2020-21 and indicated elevated borrowing of around ₹12 lakh crore for 2021-22. The increase in US Treasury yields and rebound in crude oil prices also contributed to the upward movement in bond yields. In Q4, the 10-year generic G-sec yield hardened by 30 bps to close at 6.17 per cent on March 31, 2021 (Chart II.4.4). II.4.17 With the introduction of the fully accessibleroute (FAR)25 with effect from April 1, 2020, FPIs have three routes to invest in G-secs, viz., general route with investment limits set under the medium-term framework (MTF), voluntary retention route (VRR) and FAR. The limit for FPI investments in G-sec under MTF for the year 2020-21 was set at ₹3,38,062 crore. During April 2020 - March 2021, FPIs sold G-secs for ₹31,104 crore under the general route. However, FPIs invested ₹17,211 crore under the FAR route during the same period excluding ₹15,199 crore that was transferred from the general window to the FAR scheme at the commencement of the latter. Incidentally, the number of securities included under the FAR scheme increased from five (with outstanding stock of ₹4,34,224 crore as on April 1, 2020) to twelve securities (with outstanding stock of ₹11,79,423 crore as on March 31, 2021). FPIs also invested ₹789 crore in G-secs during April 2020 - March 2021 through the VRR which has a combined investment limit of ₹1,50,000 crore for G-secs and corporate bonds. The State Development Loans (SDLs) also witnessed FPIs buying for ₹99 crore during the same period. 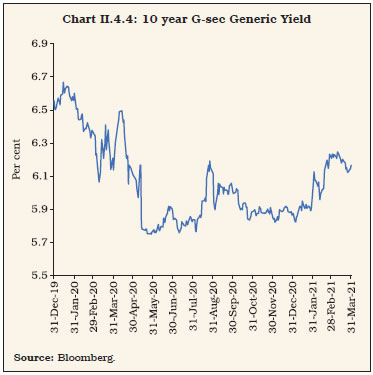 4. Corporate Debt Market II.4.18 Corporate bond yields largely tracked G-sec yields. Financing conditions in the corporate bond market, which witnessed a brief period of stress during March-April 2020 triggered by the outbreak of COVID-19, eased significantly in the remainder of 2020-21, with the average yields on AAA-rated 5-year corporate bonds falling to its lowest level since 2004. During 2020-21, the AAA-rated 5-year bond yields of public sector undertakings (PSUs); financial institutions (FIs) & banks; NBFCs and corporates softened by 50 bps, 101 bps and 114 bps, respectively, reflecting the transmission of monetary policy rate cuts to the corporate bond yields, surplus liquidity conditions and the effect of targeted measures by the Reserve Bank and the government. Furthermore, encouraging reports on COVID-19 vaccine development and approvals for inoculations improved market sentiment. The yield on AAA-rated 5-year bonds closed at 5.92 per cent for PSUs, FIs and banks; 6.29 per cent for NBFCs; and 6.14 per cent for corporates at end-March 2021. II.4.19 During 2020-21, the risk premium or spread on AAA-rated 5-year bonds (over 5-year G-sec) decreased from 18 bps to (-) 14 bps for PSUs, FIs and banks; 107 bps to 23 bps for NBFCs and 104 bps to 8 bps for corporates. The narrowing of spreads was also visible across the rating segments of corporate bonds. The deployment of several conventional and unconventional tools by the Reserve Bank such as Long-term Repo Operations (LTROs), Targeted LTROs (TLTROs) and Special Liquidity Facility for Mutual Funds (SLF-MF), supplemented with measures undertaken by the government such as special liquidity scheme and partial credit guarantee scheme for NBFCs, helped easing of liquidity premiums in the corporate bond market. The average daily secondary market turnover in the corporate bond market increased by 25.7 per cent y-o-y to ₹10,889 crore in Q1:2020-21, aided by the regulatory requirement of investing a part of TLTRO funds in the secondary market, but witnessed some moderation subsequently. Overall, the average daily turnover decreased to ₹7,671 crore during 2020-21 from ₹8,532 crore in the previous year (Chart II.4.5). II.4.20 Liquidity infusion by the Reserve Bank played a key role in supporting primary corporate bond issuances, which increased by 13.4 per cent to a record ₹7.8 lakh crore during 2020-21 under easy liquidity conditions coupled with softening of yields. Corporates mobilised higher resources from the bond market to seize the benefit of lower costs. Private placements remained the preferred choice for corporates, accounting for 98.7 per cent of total resources mobilised through the bond market. Outstanding corporate bonds increased by 11.8 per cent y-o-y to ₹35.1 lakh crore, i.e., 18.2 per cent of GDP at end-December 2020. Investments by FPIs in corporate bonds decreased to ₹1.33 lakh crore at end-March 2021 from ₹1.73 lakh crore at end-March 2020. Consequently, utilisation of the approved limit by FPIs declined to 24.5 per cent at end-March 2021 from 54.5 per cent at end-March 2020. 5. Equity Market II.4.21 After undergoing sharp corrections in Q4:2019-20 amidst the tragic outbreak of COVID-19, the Indian equity market made a strong V-shaped recovery in 2020-21 following decisive monetary and fiscal policy responses, gradual easing of COVID-19 induced lockdown measures and strong FPI inflows. Furthermore, the sharp rebound in global peers amid stimulus measures by governments and monetary authorities worldwide, coupled with encouraging reports on development of coronavirus vaccine supported the domestic equity market recovery from April 2020. Overall, during 2020-21, the BSE Sensex surged by 68.0 per cent to close at 49,509 while the Nifty 50 increased by 70.9 per cent to close at 14,691 on March 31, 2021. India VIX, which captures short-term volatility of Nifty 50, declined to 20.6 per cent at end-March 2021 after soaring to the unusually high level of 83.6 per cent on March 24, 2020 (Chart II.4.6). 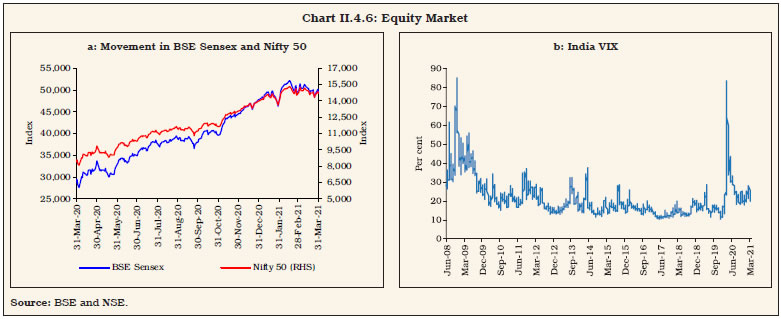 II.4.22 The Indian equity market commenced the year with a sharp rebound, posting its biggest monthly gain in 11 years during April 2020. The BSE Sensex surged by 14.4 per cent during the month on the hopes of a second round of stimulus measures by the government and announcement of various liquidity measures by the Reserve Bank. Encouraging reports of COVID-19 drug trials and easing of lockdown measures in major economies lifted market sentiment. However, the upside in equities was capped by dismal economic data, sharp decline in crude oil prices and closure of six debt schemes by a mutual fund. The Reserve Bank responded quickly, providing a special liquidity facility of ₹ 50,000 crore for mutual funds and stemming a run of redemptions under various mutual fund schemes. The downtrend deepened in May 2020 in sync with global peers amid escalation in the US-China diplomatic issues and fear of a second wave of coronavirus infections as economies started lifting lockdowns. The announcement of the “AatmaNirbhar Bharat” stimulus package and a large policy repo rate cut by the Reserve Bank on May 22 provided some breather to domestic equities. II.4.23 The equity market rebounded in June 2020 with the BSE Sensex posting its best quarterly return (18.5 per cent) since 2009, driven by strong global cues amidst re-opening of economies and additional stimulus measures by the European Central Bank (ECB). However, the rally proved transient as bearish sentiment gripped markets following a persistent rise in COVID-19 cases, simmering India-China border tensions and a grim economic outlook for India projected by various agencies. The recovery resumed in July and August on the back of encouraging reports on coronavirus vaccine trials and more supportive measures from national authorities globally. On the domestic front, the rally was driven by the reports of dis-engagement between India and China over the border dispute, better than expected corporate earnings results for Q1: 2020-21, strong FPI inflows and announcement of a series of growth supportive measures by the Reserve Bank. However, the sentiment reversed towards the end of August due to fresh escalation in Indo-China border tensions. Trading turned cautious ahead of the implementation of new trading norms on margin requirements by the Securities and Exchange Board of India (SEBI). II.4.24 The markets remained under pressure in September as the unabated rise in COVID-19 cases in Europe triggered fears of a second wave of infections and associated lockdown measures. The BSE Sensex plunged sharply by 1,115 points on September 24, its biggest intra-day fall in more than four months, tracking sharp sell-offs in global equities. However, bullish sentiments returned to markets in October following opening up of the economy under ‘Unlock 5’ guidelines, improvement in the manufacturing purchasing managers’ index (PMI) for September 2020 and strong goods and services tax (GST) collection data for September 2020 - indicating resumption in domestic manufacturing activity. Furthermore, upbeat Q2:2020-21 earning results and the announcement of a slew of liquidity and regulatory measures by the Reserve Bank aided the upswing. However, domestic equities witnessed cautious trading towards the end of the month following uncertainty surrounding the US Presidential elections. II.4.25 The Indian equity market rallied to record high levels in November 2020 on the back of sharp increase in global equities on positive developments around COVID-19 vaccines and expectations that trade wars might ease following US Presidential elections (Box II.4.1). Furthermore, the run-up in domestic equities was sustained by the government’s approval of the ₹1.5 lakh crore production-linked incentive (PLI) scheme for 10 manufacturing sectors and record high FPI inflows. Market sentiment remained exuberant during December 2020 on better than expected GDP data for Q2:2020-21 and upward revision in India’s GDP forecast for 2020-21 by the Reserve Bank and various global agencies. The benchmark indices hit record high levels during the month on upbeat IIP data for October 2020 and hopes of a faster global economic recovery after the passage of the US stimulus package and the Brexit trade deal. Markets wilted, however, under reports of a new strain of coronavirus in several countries, leading to imposition of fresh lockdowns and travel restrictions. Box II.4.1
Is the Bubble in Stock Markets Rational? Prices of risky assets surged across countries to record high levels during the year on the back of unparalleled levels of monetary and fiscal stimulus, and the turn in market sentiments following positive news on the development of and access to vaccines and the end of uncertainty surrounding US election results. The widening gap between stretched asset prices relative to prospects for recovery in real economic activity, however, emerged as a global policy concern (BIS, 2020; IMF, 2020). India’s equity prices also surged to record highs, with the benchmark index (Sensex) crossing 50,000 mark on January 21, 2021 to touch a peak of 52,154 on February 15, 2021, which represents a 100.7 per cent increase from the slump just before beginning of the nationwide lockdown (i.e., since March 23, 2020) and a 68.0 per cent increase over the year 2020-21. This order of asset price inflation in the context of the estimated 8 per cent contraction in GDP in 2020-21 poses the risk of a bubble. Literature on the subject highlights several fundamental determinants of equity prices, viz., GDP growth, inflation, and money supply (Tiryaki et al., 2019; Khan and Khan, 2018). An autoregressive distributed lag (ARDL) model is estimated by regressing stock prices (Sensex) on money supply (M3, as a proxy of liquidity), the economic outlook (OECD composite lead indicator - CLI) and foreign portfolio investments in the secondary equity market for the period April 2005 to December 2020. The results suggest that the stock price index is mainly driven by money supply and FPI investments. Economic prospects also contribute to movement in the stock market, but the impact is relatively less compared to money supply and FPI. This assessment shows that liquidity injected to support economic recovery can lead to unintended consequences in the form of inflationary asset prices and providing a reason that liquidity support cannot be expected to be unrestrained and indefinite and may require calibrated unwinding once the pandemic waves are flattened and real economy is firmly on recovery path. Even considering the above expectations earning growth of the corporates, the stock prices cannot be explained by fundamentals alone. Present valuations, as in the past, are supported by improved corporate earnings. This part of Sensex increase can be seen as rational. 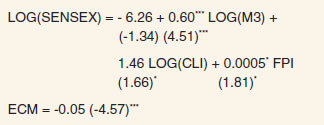 Bounds Test: F-statistic 4.09 [Critical value at 5 per cent - I(0): 2.79; I(1): 3.67] Bounds test rejects the null hypothesis of no level relationship at 5 per cent level. LM Test p-value = 0.30, ARCH test p-value = 0.39 *: Significant at 10 per cent level. ***: Significant at 1 per cent level. Note: Figures in parentheses are t-statistics. Another approach to assess stock market valuation is to compare the price-to-earnings (P/E) ratio with its historical trend. The deviation of the actual P/E from its long-run trend shows that the ratio is overvalued (Chart 1a). Measures of dividend yield also signal that markets are getting overpriced. A decomposition of changes in equity prices indicate that the rise in equity prices during 2016 to early 2020 was mainly supported by a decrease in interest rates and Equity Risk Premium (ERP), with increase in forward earnings expectations contributing to a lesser extent (Chart 1b). Thereafter, a spike in ERP on COVID-19 concerns initially contributed to equity prices declining sharply to compensate for increased risks. However, equity prices registered an impressive recovery, subsequently, aided by easing of ERP. Currently, dividend yields have fallen below their long-term trends. As such, two-way price movements are possible going forward. References: 1. International Monetary Fund (2020), ‘Global Financial Stability Report: Bridge to Recovery’, October. 2. Khan, J., & Khan, I. (2018), ‘The Impact of Macroeconomic Variables on Stock Prices: A Case Study of Karachi Stock Exchange’, Journal of Economics and Sustainable Development, 9 (13), 15-25. 3. Bank for International Settlements (2020), Annual Economic Report, BIS. 4. Tiryaki, A., Ceylan, R., and Erdoğan, L. (2019), ‘Asymmetric Effects of Industrial Production, Money Supply and Exchange Rate Changes on Stock Returns in Turkey’, Applied Economics, 51(20), 2143-2154. | II.4.26 Domestic markets remained largely volatile in January 2021 as investors weighed the roll-out of coronavirus vaccines in the country and upbeat corporate results for Q3:2020-21 against the persistent rise in COVID-19 cases across the globe. The benchmark hit 50,000 mark in intra-day trade for the first time in history on January 21, 2021 before paring all the gains on concerns over reports of a fresh face-off between India and China at the border, weak global cues over the stretched valuations in US equities and cautious trading ahead of the Union Budget. Reversing the weak momentum towards the end of January 2021, the benchmark achieved a fresh high of 52,154 on February 15, 2021 buoyed by budgetary proposals, optimistic outlook on revival of GDP growth by the Reserve Bank and positive cues from global markets. However, markets declined towards the end of the month following a surge in the US treasury yields, rise in crude oil prices and fresh spikes in COVID-19 cases in certain Indian states. Markets commenced on an optimistic note in March 2021 buoyed by release of positive Q3:2020-21 GDP data and encouraging reports for February 2021 on auto sales, GST collections, manufacturing and services PMI. Market ebullience, however, sobered reflecting concerns over inflation and imposition of fresh COVID-induced restrictions in some parts of the country. II.4.27 The total market capitalisation of BSE listed companies scaled to record level of ₹204.3 lakh crore at end-March 2021 registering an increase of 80 per cent over that of ₹113.5 lakh crore at end-March 2020. The market capitalisation to GDP ratio crossed 100 per cent in January 2021 for the first time in over a decade. There has been a surge in IPOs during 2020-21 as also the number currently in the pipeline (Box II.4.2). Box II.4.2
The Phenomena of Listing Returns in India: Some Exploration Equity markets experienced a roller-coaster ride, rebounding steeply from their March 2020 downturn. The exuberance witnessed in the secondary market gripped the primary market, with the year 2020-21 turning out to be an extraordinary one for initial public offers (IPOs) by Indian companies, as 21 out of 29 IPOs have generated positive returns for investors on listing (Chart 1). A sector-wise analysis of 201 IPOs over the last 10 years (2011-12 to 2020-21) indicates that IPOs from consumer staples and healthcare sectors generated the highest listing gains in India (Chart 2). The underpricing of IPO is one of the most commonly studied puzzles in the field of corporate finance. Underpricing of an IPO is said to have taken place when the stock generates higher prices on the first day of listing, called the listing returns. In the literature, information asymmetry is regarded as the root cause of underpricing (Rock, 1986) - a winner’s curse model is at work wherein the issuer deliberately underprices its IPO to attract uninformed investors. Other reasons are providing compensation to investors by the issuers for undertaking ex-ante uncertainty risk. An attempt has been made to examine the factors underlying the underpricing in IPOs in the Indian context using three sets of variables: market specific variables such as oversubscription, lagged market return and lagged volatility; firm characteristics such as age, leverage, growth, profitability and valuation indicators; and IPO specific variables such as IPO size. The data relate to the mainboard IPOs that were listed on the BSE and the NSE during 2011-12 to 2020-21. The following regression model has been estimated to determine the influence of each characteristic on the adjusted IPO returns, which are calculated as the raw IPO returns minus the BSE Sensex returns on the IPO listing day (adjusted returns are preferred over raw returns to control for the effect of general market on IPO performance).
Where, Adjusted_Rtn = Adjusted IPO returns; Oversubscription = Number of application of shares/ number of shares issued by the company; Sensex_lag2mreturn = absolute Sensex returns in two months preceding the IPO; VIX_lag2mavg = average VIX in two months preceding the IPO; Ln_Age = log of the difference between date of incorporation and IPO listing date; DER = debt to equity ratio; ROE = return on equity; Pat2ygrowth = compounded annual growth rate of profit after tax in the last 2 years; PE = price-earnings ratio; and Ln_IPOsize = log of size of IPO proceeds. The model also controls for sector specific dummies. The coefficient of oversubscription rate is found to be positive and highly significant in explaining the IPO’s initial returns (Table 1) and supports the findings of earlier studies (Leong, 2015). Intuitively, a higher oversubscription rate is a signal to the investors in the secondary market on the potential increase in share prices and expected returns (Chart 3). The results also show a positive and significant relationship between lagged Sensex returns and IPO returns, suggesting that IPOs issued during the boom period are relatively more underpriced, which is broadly in line with past studies (e.g., Bhattacharya, 2017). However, the firm specific characteristics are found to be not statistically significant in explaining the price run-ups on the IPO listing day. Further, the negative coefficient of the average VIX is not statistically significant. Thus, the decadal high average IPO listing returns of 36 per cent realised during 2020-21 might have been fuelled by an average oversubscription rate of 71.3 times of IPO issue size. Table 1: Determinants of IPO Returns
(Dependent variable: Adjusted_Rtn) | | Explanatory Variables | Coefficient | | 1 | 2 | | Oversubscription | 0.44** | | Sensex_lag2mreturn | 0.90* | | VIX_lag2mavg | -0.85 | | ln_Age | -2.33 | | DER | 1.7 | | ROE | 0.17 | | Pat2ygrowth | 0.02 | | PE | -0.09 | | ln_IPO size | 6.2 | *: Significant at 5 per cent level. **: Significant at 1 per cent level.
Source: RBI staff calculations. |
References: 1. Rock, Kevin (1986), ‘Why New Issues are Underpriced’, Journal of Financial Economics, Volume 15, Issues 1-2, January-February, Pages 187-212. 2. Mike Siew Wei Leong, S. D. (2015), ‘IPO Initial Return and Volatility: A Study in an Emerging Market’. International Journal of Business and Finance Research, Vol. 9, No. 3, 2015, pp. 71-82. 3. Bhattacharya, A. (2017), ‘Innovations in New Venture Financing: Evidence from Indian SME IPOs’, Global Finance Journal, Volume 34, November, Pages 72-88. | II.4.28 Barring April and September 2020, FPIs remained net buyers in the Indian equity market with November witnessing record inflows of ₹70,896 crore (Chart II.4.7a). The Indian equity market has received a net FPI inflow of ₹2.8 lakh crore in 2020-21, as against a net FPI outflow of ₹6,204 crore during the previous year. However, mutual funds were net sellers during 2020-21 to the tune of ₹1.2 lakh crore. II.4.29 The direct participation of retail investors in equities witnessed an increase during the year, with the opening of 1.43 crore demat accounts during 2020-21, as against 50 lakh demat accounts opened during the previous year. Further, retail holdings in companies listed on NSE increased to 6.9 per cent as at end-March 2021 from 6.5 per cent as at end-March 2020. In value terms, the retail holdings in NSE listed companies increased to ₹13.6 lakh crore at end-March 2021 as against ₹7.2 lakh crore at end-March 2020 (Chart II.4.7b). Primary Market Resource Mobilisation II.4.30 The primary segment of the equity market witnessed increased activity during 2020-21. Resource mobilisation through initial public offers (IPOs), follow-on public offers (FPOs) and rights issues increased by 43.1 per cent to ₹1.1 lakh crore during 2020-21 from ₹76,965 crore in the previous year (Appendix Table 5). Of these, ₹46,060 crore were mobilised through 57 IPO/FPO issues, out of which 27 issues amounting to ₹246 crore were listed on the small and medium enterprises (SME) platform of the BSE and the NSE. Resource mobilisation through rights issues increased to ₹64,059 crore during 2020-21 from ₹55,642 crore in the previous year. Resource mobilisation through preferential allotment and qualified institutional placement (QIP) decreased to ₹1.2 lakh crore during 2020-21, as against ₹2.3 lakh crore during the previous year. 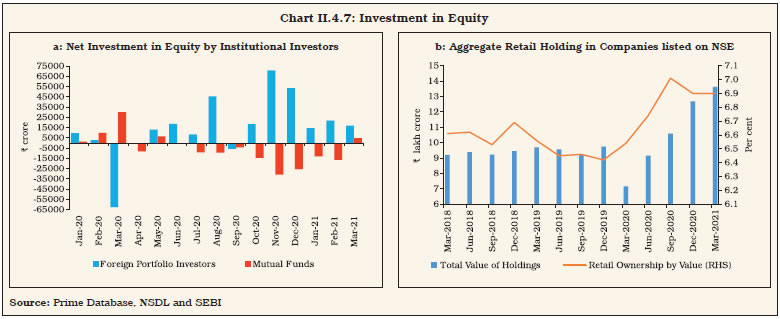 II.4.31 Net resources mobilised by mutual funds increased sharply by 146 per cent to ₹2.15 lakh crore during 2020-21 due to favourable base effect as mutual funds had witnessed sharp outflows, largely led by open-ended debt-oriented schemes, during March 2020 on concerns over the spread of COVID-19. Equity-oriented schemes witnessed net redemption of ₹39,327 crore in 2020-21 as against net mobilisation of ₹81,597 lakh crore in 2019-20. Assets under management (AUM) of equity-oriented mutual funds increased by 66.0 per cent to ₹10.0 lakh crore at end-March 2021 from ₹6.0 lakh crore at end-March 2020. 6. Foreign Exchange Market II.4.32 In the foreign exchange market, turnover in both merchant and the inter-bank segments were lower than previous year’s levels during the first half of the year on account of disruptions related to COVID-19. Turnover returned to previous year’s levels during the latter part of the year with some segments (merchant spot and inter-bank swaps) exhibiting higher activity. II.4.33 The Indian rupee touched an all-time intra-day low of ₹76.91/USD in April 2020, with moderate volatility in relation to its peers at the height of pandemic. It then traded with an appreciating bias during the rest of 2020-21. In the ensuing period, the rupee recovered with return of risk appetite for EME currencies following unlocking of economic activities but concerns over COVID-19 infections led the rupee to trade sideways in Q1:2020-21. Tracking gains in other EME currencies, the rupee strengthened in Q2:2020-21, led by robust FPI inflows following optimism over recovery in economic activity before registering some losses owing to escalation in border tensions in September 2020. The announcement of development of COVID-19 vaccines in November 2020 leading to flow of capital towards EMEs, coupled with improvement in sentiment due to uptick in the growth momentum, resulted in gains for the Indian rupee. In Q4: 2020-21, the Indian rupee remained supported by FPI and merchant-related inflows. However, during the last week of February, the rupee traded with a sharp depreciating bias tracking global risk-off sentiments post sell-offs in US bonds triggered by higher inflation expectations and poor auction demand. Overall, the Indian rupee gained by 3.5 per cent (based on USD/INR closing rates as at end-March 2021 over end-March 2020) but underperformed vis-a-vis its Asian peers during 2020-21 [Chart II.4.8]. II.4.34 On an average basis, in tandem with movements in the nominal exchange rates of the rupee, the 40-currency nominal effective exchange rate (NEER) depreciated in 2020-21 (y-o-y). The 40-currency NEER depreciated by 4.2 per cent, however, the 40-currency real effective exchange rate (REER) remained almost stable in 2020-21. II.4.35 Forward premia mostly remained anchored in short tenors on account of surplus liquidity in the system. However, hardening was witnessed towards the end of 2020-21 amid surplus dollars and paying interest ahead of the year-end. Longer tenors also saw some hardening, tracking the steepened G-sec curve. 7. Conclusion II.4.36 In sum, the Reserve Bank undertook a slew of measures to instil confidence in the financial markets and the economy. These measures not only ensured orderly market conditions, but also accelerated the pace of recovery as reflected in high frequency economic indicators. The unwinding of some of the policy measures undertaken in the wake of pandemic warrants a calibrated and gradual approach. Going forward, financial market movements would be guided by progress in containing the COVID-19 pandemic, especially through administration of vaccines, the pace of recovery of the global and the domestic economies and developments in global liquidity and financial conditions. II.5 GOVERNMENT FINANCES II.5.1 In 2020-21, when general government finances recorded large deviations from budget estimates across the globe, India was no exception. In order to protect lives and livelihoods, and contain the spread of the pandemic, governments unleashed large scale fiscal stimuli of above the line as well as below the line liquidity support measures amounting to around US$ 16 trillion, including US$ 5.7 trillion in the form of quasi fiscal operations and guarantees (Chart II.5.1a). Consequently, fiscal deficits and debt levels shot up around the world in 2020 reflecting a large erosion in revenues due to the contraction in output, and increases in spending to bolster the safety nets. Average overall deficit as a share of GDP reached 11.7 per cent for advanced economies, 9.8 per cent for emerging market economies, and 5.5 per cent for low-income developing countries. Average public debt in the world surged to an unprecedented 97 per cent of GDP in 2020. In 2021, fiscal deficits are expected to remain elevated but to moderate from peak levels as revenues recover partly and temporary pandemic-related expenditures come down (IMF,2021)26 (Chart II.5.1b). 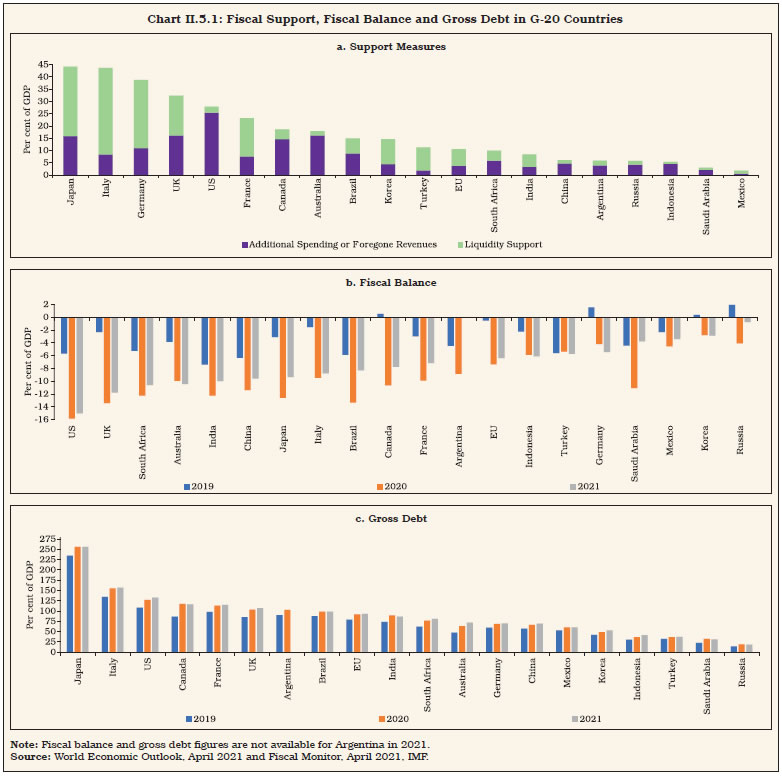 II.5.2 India’s gross debt in 2020-21 was higher than most of the developing countries (except Brazil and Argentina) in the G-20 group, but lower than the advanced countries (Chart II.5.1c). India’s general government fiscal deficit and gross debt ratios are projected to shrink in 2021-22. II.5.3 Against this backdrop, sub-sections 2 and 3 present the position of Central Government finances in 2020-21 and 2021-22, respectively. Similarly, sub-sections 4 and 5 outline the developments in state government finances during 2020-21 and 2021-22. General government finances are discussed in sub-section 6. The final section sets out concluding remarks and some policy perspectives. 2. Central Government Finances in 2020-21 II.5.4 In the wake of the pandemic, the Union Government announced a series of economic reform measures which cumulatively amounted to ₹17.2 lakh crore (Table II.5.1). Within a fortnight of COVID-19 being declared a pandemic, i.e., on March 26, 2020, the government announced the Pradhan Mantri Garib Kalyan Package (PMGKP) which focused on protecting lives and livelihoods of vulnerable sections of the population through measures like free foodgrains to the poor; direct benefit transfers to women, senior citizens and poor disabled; and paying both employee and employer contribution to provident fund corpuses for organised sector workers. The second set of stimulus measures named AatmaNirbhar Bharat Abhiyan 1.0 (May 13-17) focused on providing liquidity support through government guarantees and low interest rate loans to micro, small and medium enterprises (MSMEs), non-banking financial companies (NBFCs), microfinance institutions (MFIs), housing finance companies (HFCs) and power distribution companies (DISCOMs) to help keep them afloat. Several structural reforms in sectors like coal, minerals, defence production and civil aviation were also part of this package, which were expected to have a salutary impact on growth in the long-term. | Table II.5.1: Fiscal Package Announced by the Union Government | | (₹ crore) | | S. No. | Scheme | Amount | | 1 | 2 | 3 | | 1. | Pradhan Mantri Garib Kalyan Package | 1,70,000 | | 2. | PM's Health Package | 15,000 | | 3. | Revenue Loss due to Tax Relief Measures | 7,800 | | 4. | AatmaNirbhar Bharat Abhiyan 1.0 | 11,02,650 | | 5. | PMGKP Anna Yojana Extension | 82,911 | | 6. | AatmaNirbhar Bharat Abhiyan 2.0 | 73,000 | | 7. | AatmaNirbhar Bharat Abhiyan 3.0 | 2,65,080 | | 8. | Total | 17,16,441 | | Source: Press Information Bureau, GoI. | II.5.5 Once travel restrictions were eased and economic activity started to gain momentum, AatmaNirbhar Bharat Abhiyan 2.0 (October 12) was announced. It included both consumption-based measures in the form of leave travel concession (LTC) cash voucher scheme and interest free loans for government employees and investment measures in the form of increase in the capex budget of the Union Government and interest free loans to state governments for capital expenditure. The thrust on capital expenditure was continued in the AatmaNirbhar Bharat Abhiyan 3.0 (November 12), which included, inter alia, additional outlay for Pradhan Mantri Awas Yojana - Urban, further increase in the capex budget, equity infusion in the National Investment and Infrastructure Fund (NIIF) and a production-linked incentive (PLI) scheme for 10 identified sectors to boost domestic manufacturing, investment and employment at an estimated cost of ₹1.5 lakh crore to the exchequer over the next five years. II.5.6 The total fiscal package does not reflect the true fiscal cost to the Union Government as it includes below the line items like liquidity support measures as well. Furthermore, the Union Government also undertook expenditure rationalisation measures in order to cut down avoidable outgoes during the year. Thus, the total expenditure of the Union Government increased from ₹30.4 lakh crore in BE to ₹34.5 lakh crore in RE. This also includes the increase in expenditure arising on account of on-budgeting of a large part of outstanding loans availed in lieu of subsidies by the Food Corporation of India (FCI) from the National Small Savings Fund (NSSF), a practice which was followed since 2016-17. 3. Central Government Finances in 2021-22 II.5.7 The Union Budget 2021-22 has set the stage for a strong revival. This is sought to be achieved by increasing the buoyancy of tax revenue through improved compliance, and by increased receipts from monetisation of assets (Table II.5.2). Efforts at improving tax buoyancy are not reliant on additional taxation. The budget also aims at better compliance through use of data analytics and artificial intelligence. At the same time, the scope of faceless assessment has been broadened by bringing all pending assessment cases within the purview of the scheme. There has also been a renewed push to disinvestment and asset monetisation in the budget through the new public sector enterprise policy, which aims to minimise the presence of central public sector enterprises (CPSEs) and create more space for the private sector. Asset monetisation aims at generating new sources of revenue by unlocking of value in unutilised or underutilised public assets. The government has indicated that it plans to set up a pipeline to monetise 100 government-owned assets over a period of time which may bring in investment opportunities of ₹2.5 lakh crore. It also has a strong disinvestment plan. Four broad strategic areas (atomic energy, space and defence; power, petroleum, coal and minerals; transport and telecommunications; and financial services) have been identified, where CPSEs will have a minimal presence. In all other non-strategic sectors, CPSEs will be either privatised or closed. | Table II.5.2: Central Government's Fiscal Performance | | (Per cent of GDP) | | Item | 2004-08 | 2008-10 | 2010-15 | 2014-15 | 2015-16 | 2016-17 | 2017-18 | 2018-19 | 2019-20 | 2020-21 (RE) | 2021-22 (BE) | | 1 | 2 | 3 | 4 | 5 | 6 | 7 | 8 | 9 | 10 | 11 | 12 | | Non-debt Receipts | 11.0 | 9.7 | 9.5 | 9.2 | 9.1 | 9.4 | 9.1 | 8.8 | 8.6 | 8.2 | 8.9 | | Gross Tax Revenue (a+b) | 10.7 | 10.4 | 10.2 | 10.0 | 10.6 | 11.1 | 11.2 | 11.0 | 9.9 | 9.7 | 9.9 | | a) Direct Tax | 5.1 | 6.0 | 5.7 | 5.6 | 5.4 | 5.5 | 5.9 | 6.0 | 5.2 | 4.6 | 5.0 | | b) Indirect Tax | 5.6 | 4.4 | 4.5 | 4.4 | 5.2 | 5.6 | 5.4 | 5.0 | 4.7 | 5.1 | 5.0 | | Net Tax Revenue | 7.9 | 7.6 | 7.3 | 7.2 | 6.9 | 7.2 | 7.3 | 6.9 | 6.7 | 6.9 | 6.9 | | Non-tax Revenue | 2.2 | 1.8 | 1.8 | 1.6 | 1.8 | 1.8 | 1.1 | 1.2 | 1.6 | 1.1 | 1.1 | | Non-debt Capital Receipts | 0.9 | 0.3 | 0.4 | 0.4 | 0.5 | 0.4 | 0.7 | 0.6 | 0.3 | 0.2 | 0.8 | | Total Expenditure | 14.5 | 16.1 | 14.4 | 13.3 | 13.0 | 12.8 | 12.5 | 12.2 | 13.2 | 17.6 | 15.6 | | Revenue Expenditure | 12.1 | 14.4 | 12.6 | 11.8 | 11.2 | 11.0 | 11.0 | 10.6 | 11.6 | 15.4 | 13.1 | | Capital Expenditure | 2.4 | 1.7 | 1.8 | 1.6 | 1.8 | 1.8 | 1.5 | 1.6 | 1.6 | 2.2 | 2.5 | | Revenue Deficit | 2.0 | 5.0 | 3.5 | 2.9 | 2.5 | 2.1 | 2.6 | 2.4 | 3.3 | 7.4 | 5.1 | | Gross Fiscal Deficit | 3.5 | 6.3 | 4.9 | 4.1 | 3.9 | 3.5 | 3.5 | 3.4 | 4.6 | 9.4 | 6.8 | BE: Budget Estimates. RE: Revised Estimates.
Note: Going by the principle of using latest available GDP data for any year, GDP used for 2020-21 (RE) is the latest available Second Advance Estimates (released on February 26, 2021). In view of this, the fiscal indicators as per cent of GDP given in this table may at times marginally vary from those reported in the Union Budget Documents.
Source: Union Budget Documents. |
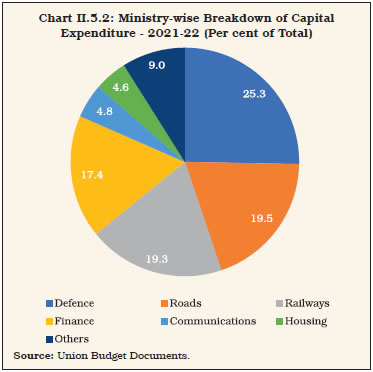 II.5.8 In 2021-22, the counter-cyclical fiscal support to the economy is to be maintained through capital expenditure, which is expected to increase to 2.5 per cent of GDP from an average of 1.7 per cent during 2010-20, even as revenue expenditure is set to see some contraction over 2020-21 (RE) (Chart II.5.2). The sizeable deviation in gross fiscal deficit in 2020-21 and 2021-22 has necessitated a quantum jump in market borrowings of the Union Government, which remain the primary source of financing the deficit, followed by access to the NSSF (Chart II.5.3). 4. State Finances in 2020-2127 II.5.9 State finances have, in general, shown consolidation vis-à-vis budgeted levels over thelast three years - 2017-18 to 2019-2028 - primarily driven by large cuts in capital expenditure. For 2020-21, states had budgeted a combined GFD of 2.8 per cent of GDP; more than half of them budgeted for revenue surpluses (Table II.5.3). COVID-19 undermined these fiscal targets and associated receipts for 2020-21 (BE). ‘Scissor effects’ - loss of revenues due to demand slowdown, coupled with higher expenditure associated with the pandemic - are likely to erode state finances in 2020-21, with the GFD-GDP ratio projected at 4.0 per cent, with an upsidebias (RBI, 2020)29. The duration of stress on state finances is contingent upon factors like tenure of lockdown and risks of renewed waves of infections all of which make traditional backward-looking tax buoyancy forecasting models unreliable. | Table II.5.3: Fiscal Position of States | | (₹ lakh crore) | | | 2017-18 | 2018-19 | 2019-20 (BE) | 2019-20 (PA) | 2020-21 (BE) | | 1 | 2 | 3 | 4 | 5 | 6 | | I. Revenue Receipts | 23.21 | 26.21 | 31.54 | 26.86 | 33.27 | | | (13.6) | (13.8) | (14.9) | (12.4) | (14.8) | | II. Capital Receipts | 0.40 | 0.41 | 0.62 | 1.35 | 0.16 | | | (0.2) | (0.2) | (0.3) | (0.6) | (0.1) | | III. Revenue Expenditure | 23.40 | 26.38 | 31.46 | 27.89 | 33.27 | | | (13.7) | (13.9) | (14.9) | (12.9) | (14.8) | | IV. Capital Expenditure | 4.31 | 4.87 | 6.22 | 5.46 | 6.46 | | | (2.5) | (2.6) | (2.9) | (2.5) | (2.9) | | a. Capital Outlay | 3.94 | 4.40 | 5.81 | 4.25 | 5.98 | | | (2.3) | (2.3) | (2.8) | (2.0) | (2.7) | | b. Loans and Advances by States | 0.38 | 0.47 | 0.41 | 0.41 | 0.48 | | | (0.2) | (0.3) | (0.1) | (0.2) | (0.2) | | V. Fiscal Deficit/ Surplus | 4.10 | 4.63 | 5.54 | 5.25 | 6.26 | | | (2.4) | (2.4) | (2.6) | (2.4) | (2.8) | | VI. Revenue Deficit/ Surplus | 0.19 | 0.18 | -0.08 | 1.41 | 0.00 | | | (0.1) | (0.1) | (-0.0) | (0.7) | (0.0) | Note: 1. Figures in parentheses are per cent of GDP.
2. Data for 2019-20 Provisional Accounts (PA) are accounts figures of all states available with CAG, augmented with 2019-20 BE estimates for Delhi, Goa, Jammu and Kashmir and Puducherry.
Source: Budget documents of state governments; CAG and MOSPI. | II.5.10 The provisional accounts (PA) for states for H1:2020-21 (April-September 2020) indicate that their GFD-GDP ratio stood at 3.8 per cent, substantially higher than the budget estimate of 2.8 per cent for the year as a whole. Extending the analysis further to include the data for October-February 2020-21, it is found that the revenue receipts of state governments, after witnessing a sharp contraction till September 2020 due to the pandemic-induced lockdown, have recovered partially with gradual resumption in economic activity. During April-February 2020-21, states’ revenue expenditure growth remained muted as higher increase in revenue expenditure during the initial months to mitigate the impact of the pandemic was offset by subsequent re-prioritisation of some allocations, viz., dearness allowance freeze; deferment of part or full salaries and wages; and deduction from salary. Typically, states’ fiscal response to COVID-19 should have reflected in a larger increase in revenue expenditure in 2020-21 than budgeted. These spendings, coupled with revenue receipts’ shortfall, are likely to convert revenue surpluses as budgeted in 2020-21 into deficits. On the capex side, states have a tendency to cut back their capital expenditure by almost 0.5 per cent of GDP, on an average, to meet fiscal responsibility legislation (FRL) - prescribed deficit targets. A similar tendency relative to PA is seen in 2020-21, particularly since states have not been able to start much capex in H1 because of the lockdown (Q1) and monsoons (Q2). Going forward, however, states are likely to increase capex through investment in healthcare, social housing, education and environmental protection to support a more resilient and inclusive recovery. Any significant cut in capex by states, driven by funding constraints, may counteract the growth impact of the capex push of the centre. 5. State Finances in 2021-22 II.5.11 As per the information available for 17 state governments, the GFD has been budgeted at 3.2 per cent of GSDP in 2021-22 as against 4.1 per cent in 2020-21 (RE). This is in line with the Fifteenth Finance Commission’s (FC-XV) recommendation on the revised fiscal roadmap for states. The consolidation over the previous year has been sought to be achieved primarily through enhanced revenue receipts and cut in revenue expenditure while hiking capex (Table II.5.4; Appendix Table 6). II.5.12 State finances, which have been under stress on the revenue front, are likely to get some support from the FC-XV’s recommendations, particularly with respect to grants, which are slated to rise in the award period (Box II.5.1). | Table II.5.4: State Government Finances 2021-22*: Key Indicators | | (Per cent of GSDP) | | Item | 2019-20 | 2020-21 (BE) | 2020-21 (RE) | 2021-22 (BE) | | 1 | 2 | 3 | 4 | 5 | | Revenue Deficit | 0.0 | -0.1 | 1.5 | 0.3 | | Gross Fiscal Deficit | 2.1 | 2.4 | 4.1 | 3.2 | | Primary Deficit | 0.6 | 1.0 | 2.4 | 1.5 | *: Data pertain to seventeen states that have presented their final budgets for 2021-22.
Source: Budget documents of state governments. | 6. General Government Finances II.5.13 As per the latest available information for 2020-21 - RE for centre and BE for states - the general government deficit and debt have soared to around 12.6 per cent and 90 per cent of GDP, respectively. These figures are likely to go up further once the revised estimates of all states are available. Such high levels of deficit and debt are likely to pose challenges in financing, once private investment picks up (Chart II.5.4; Appendix Table 7). Box II.5.1
15th Finance Commission Recommendations: A Comparative Analysis The full report of the FC-XV (Chairman: Shri N. K. Singh) covering the period 2021-26 was submitted on November 9, 2020 and was placed before the Parliament on February 1, 2021. There are three aspects to the recommendations in a historical context: tax devolution, grants and fiscal roadmap/ rules. Tax Devolution The base of union taxes shareable with the states was considerably widened by the Eleventh Finance Commission (FC-XI) which recommended that all union taxes, excluding cesses and surcharges, should be shareable with states (earlier only excise duty and income tax collections were shareable). Since then, successive finance commissions have made increments in the devolution ratio, with the Fourteenth Finance Commission (FC-XIV) making a radical departure by recommending a significantly higher share in view of the abolition of the planning commission and cessation of plan grants, thus making tax devolution the primary vehicle for federal transfers. Nevertheless, the increase in devolution ratio did not translate into a commensurate rise in the devolved taxes due to the proliferation of cesses and surcharges that are excluded from the divisible pool of union taxes. FC-XV was guided by stability and continuity in tax transfers and has maintained the tax devolution ratio (adjusting for the share attributable to Jammu and Kashmir) recommended by its predecessor. As regards the inter se distribution of taxes among states (horizontal sharing), equity-based criteria have dominated in determining the share of individual states since the Eighth Finance Commission (FC-VIII), thus making the tax devolution progressive. In case of the FC-XV, the most significant change in the criteria for determining the share of individual states is to move the population census from 1971 to 2011. It has introduced a new criterion of demographic performance - the product of the inverse of the total fertility rate as per 2011 population census, and a state’s population in 1971 - to reward states that have successfully brought down population growth. The other major change is the re-introduction of the criterion for tax effort that was used by the Xth, XIth and XIIth Finance Commissions, but was done away with by the XIIIth and XIVth Finance Commissions (Table 1). Grants-in-Aid The FC-XV has made a significant departure from its predecessor in recommending a historically high share of grants in total transfers. Compositionally, grants to local bodies have the highest share in finance commission grants since the FC-XIII, followed by post devolution revenue deficit grants, both of which have seen their share in total transfers rise consecutively in the last two finance commission recommendations. The FC-XV has brought back sector- and state- specific grants that were a regular feature till the FC-XIII; the Union Government has, however, indicated that it will give due consideration to these grants while revisiting the centrally sponsored schemes (Chart 1). Fiscal Roadmap/Rules Successive finance commissions have recommended debt and deficit targets as well as institutional changes to make governments accountable and transparent in the conduct of fiscal policy. The FC-XII, the FC-XIII and the FC-XIV recommended elimination of revenue deficits and limiting the fiscal deficit to GDP ratio to 3 per cent at both levels of government. As regards institutional measures, FC-XII recommended the creation of a sinking fund for debt repayments and a guarantee redemption fund to safeguard states finances from invocation of guarantees, both of which have been implemented by the majority of states. The FC-XIV recommended exclusion of state governments from NSSF operations from April 1, 2015 (existing obligations on servicing and repayments to be fulfilled). The FC-XV has made significant relaxations in the fiscal deficit and debt targets in view of the pandemic induced slowdown. The gross fiscal deficit (GFD) for the Union Government is recommended on an elevated path with the terminal year (2025-26) target in the range of 3.5 to 4.5 per cent of GDP and the normal net borrowing limit of state governments has been relaxed to 4 per cent of GSDP in 2021-22 and 3.5 per cent of GSDP in 2022-23, with an additional allowance of 0.5 per cent for the four year period of 2021-22 to 2024-25 conditioned upon improvement in operational and financial performance of power distribution companies (DISCOMs). It has also made a recommendation to appoint a high-powered inter-governmental committee to examine the issue of debt sustainability (Table 2). 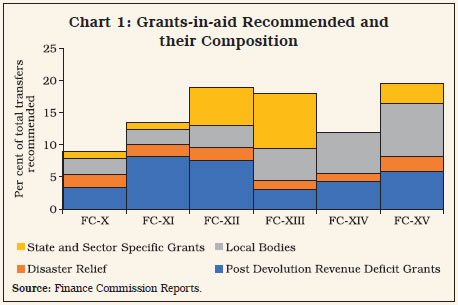
| Table 1: Tax Devolution: Vertical Devolution and Horizontal Sharing Criteria | | FC Period | Vertical Devolution | Criteria for Horizontal Sharing Between States | | Tax Devolution Ratio (All Central Taxes) | States’ Share / Gross Tax Revenue | Need and Cost Disability | Equity | Performance | | Population (1971) | Population (2011) | Area Adjusted | Forest Cover | Infrastructure Distance | Income Distance Per Capita | Fiscal Capacity Distance | Tax Effort | Fiscal Discipline | Demographic Performance | | 1 | 2 | 3 | 4 | 5 | 6 | 7 | 8 | 9 | 10 | 11 | 12 | 13 | | FC-Xl (2000-2005) | 29.5 | 26.6 | 10.0 | - | 7.5 | - | 7.5 | 62.5 | - | 5.0 | 7.5 | - | | FC-XII (2005-2010) | 30.5 | 25.9 | 25.0 | - | 10.0 | - | - | 50.0 | - | 7.5 | 7.5 | - | | FC-XIII (2010-2015) | 32.0 | 27.9 | 25.0 | - | 10.0 | - | - | - | 47.5 | - | 17.5 | - | | FC-XIV (2015-2020) | 42.0 | 34.4 | 17.5 | 10.0 | 15.0 | 7.5 | - | 50.0 | - | - | - | - | | FC-XV (2020-2026) | 41.0 | - | - | 15.0 | 15.0 | 10.0 | - | 45.0 | - | 2.5 | - | 12.5 | | Source: EPW Research Foundation; Union Budget 2020-21; Finance Commission Reports and Reddy et al., (2019). |
| Table 2: Fiscal Roadmap / Rules Recommended by Finance Commissions | | Finance Commission and Tenure | General Government Finances | Central Government Finances | Finances of State Governments | | Debt and Deficit Targets | Other Targets/ Measures | Debt and Deficit | Other Targets/ Measures | Debt and Deficit | Other Targets/ Measures | | 1 | 2 | 3 | 4 | 5 | 6 | 7 | | FC-XII (2005-10) | Debt-GDP ratio of 75 per cent by 2009-10. | Tax-GDP target of 17.6 per cent by 2009-10. | Long-term debt-GDP ratio to be 28 per cent; GFD-GDP ratio of 3 per cent; eliminate revenue deficit by 2008-09. | Achieve interest payments to revenue receipts ratio of 28 per cent by 2009-10. | Long-term debt-GDP ratio to be 28 per cent; GFD-GDP ratio of 3 per cent; eliminate revenue deficit by 2008-09. | Enactment of FRL legislation to define deficit targets; creation of sinking fund for future repayments of borrowings; creation of guarantee redemption fund to meet requirement of their invocation. | | FC-XIII (2010-15) | Debt-GDP ratio of 68 per cent by 2014-15 | Resource requirement of states in case of macroeconomic shocks to be managed through additional borrowings by the Centre to be devolved to the states as per the tax devolution formula. | Debt-GDP ratio of 44.8 per cent by 2014-15; eliminate revenue deficit by 2014-15. | Disinvestment receipts to be kept in a consolidated fund and not in the public account of the centre. | Debt-GDP ratio of 24.3 per cent by 2014- 15; eliminate revenue deficit by 2014-15. | Amend/enact FRBM Acts to build in the fiscal reform path; state-specific grants to be conditional on compliance. | | FC-XIV (2015-20) | | Transparent accounting for the performance of public sector undertakings (guarantees, off-budget borrowings and accumulated losses) to be made available annually with the budget presentation. | GFD-GDP ratio of 3 per cent by 2016-17 and thereafter. Eliminate revenue deficit by 2019-20. | Amendment of the FRBM act to reflect the fiscal roadmap, omit the definition of effective revenue deficit and mandate the establishment of an independent fiscal council. | GFD-GDP ratio of 3 per cent; additional incentive based borrowing up to 0.5 per cent of GSDP based on achieving targets on revenue deficit, interest payments - revenue receipts ratio and debt-GSDP ratio. | Exclusion of state governments from NSSF operations from April 1, 2015 (existing obligations on servicing and repayments to be fulfilled). | | FC-XV (2020-26) | GFD-GDP ratio glide path from 9.3 per cent in 2021-22 to 6.8 per cent in 2025-26; projected debt-GDP ratio of 85.7 per cent in 2025-26, after peaking at 89.6 per cent in 2022-23. | Restructuring of FRBM Act and time-table for defining and achieving debt sustainability to be examined by a high-powered inter-governmental group. | In the baseline scenario, GFD-GDP ratio glide path from 6 per cent in 2021-22 to 4 per cent in 2025-2630; projected debt-GDP ratio of 56.6 per cent in 2025-26, after peaking at 62.9 per cent in 2021-22. | - | Normal limit of net borrowings to be 4 per cent in 2021-22, 3.5 per cent in 2022- 23 and 3 per cent of GSDP from 2023-24 to 2025-26; incentive based additional borrowings of 0.5 per cent of GSDP from 2021-22 to 2024-25. | - | References: 1. Ministry of Finance (2020), ‘Report of the Fifteenth Finance Commission’, Ministry of Finance, Government of India, New Delhi. 2. Reddy, Y. V. and G. R. Reddy (2019), ‘Indian Fiscal Federalism’, Oxford University Press, New Delhi. |
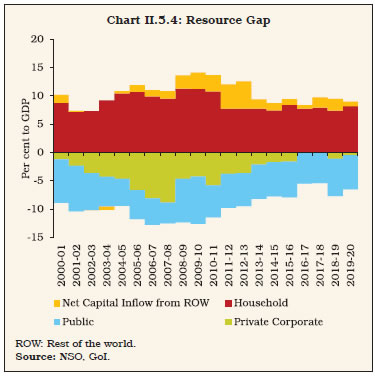 7. Conclusion II.5.14 In sum, the deterioration in major fiscal indicators in 2020-21 may be attributed to the pandemic superimposed on a cyclical slowdown in tax revenues and a counter-pandemic fiscal push through higher government expenditure. Going forward, as growth revives and economy gets back on track, it is important for the government to adhere to a clear exit strategy and build fiscal buffers, which can be tapped into in events of future shocks to growth. II.6 EXTERNAL SECTOR II.6.1 India’s external sector was impacted by worsening of both external and domestic demand conditions amidst the COVID-19 pandemic during 2020-21. A recession-driven fall in imports and favourable terms of trade compressed the merchandise trade deficit during the year. Notwithstanding a fall in remittances driven by deterioration in the economies of source countries, the compressed trade deficit is likely to translate into a current account surplus for the first time on an annual basis after 2003-04. With inflows of foreign direct and portfolio investment remaining strong, these developments led to a large reserve accretion during the year. II.6.2 Against this backdrop, global economic and financial conditions in which these shifts in external balances occurred are outlined in sub-section 2, followed by a discussion on merchandise trade and invisibles in sub-sections 3 and 4, respectively. An analysis of capital flows is provided in sub-section 5, with an assessment of external sustainability in sub-section 6, followed by concluding observations. 2. Global Economic Conditions II.6.3 The COVID-19 pandemic took a severe toll on global economic activity in H1:2020. Global demand plunged following a very sharp compression in consumption and a collapse in investment and international commodity prices. Propelled up by massive policy support by both governments and central banks, however, major economies recorded a sequential pick-up in Q3:2020. Even as intensification of containment measures in response to a strong resurgence of coronavirus infections across various countries posed downside risks, progress with vaccines and inoculation drives lifted expectations and reduced uncertainty on the global economic outlook as reflected in improvement in global economic projections for 2020 by the IMF in January 2021 and April 2021 (contraction of 3.5 per cent and 3.3 per cent, respectively) [Chart II.6.1]. With demand conditions normalising alongside easing of supply and mobility disruptions in an environment of sustained policy support, a faster economic recovery is expected in 2021. II.6.4 World merchandise trade activity also appears to be gaining momentum from the contraction of 21 per cent in Q2 (Chart II.6.1). A contraction of 6 per cent in Q3:2020 and an expansion of 2 per cent in Q4:2020 has signalled the turnaround. Services trade that contracted 28 per cent in Q2 is taking longer to revive. The WTO’s goods trade barometer recovered from84.5 in August to 103.9 in December 202031 but components of trade are since showing some signs of deceleration. Since the pandemic, travel and tourism have been the most impacted sectors due to a sharp cutback in global migration and imposition of travel restrictions. The impact of COVID-19 on global remittances, already discernible in 2020, may extend to 2021, as demand for expatriate workers may not recover fully amongst source countries. 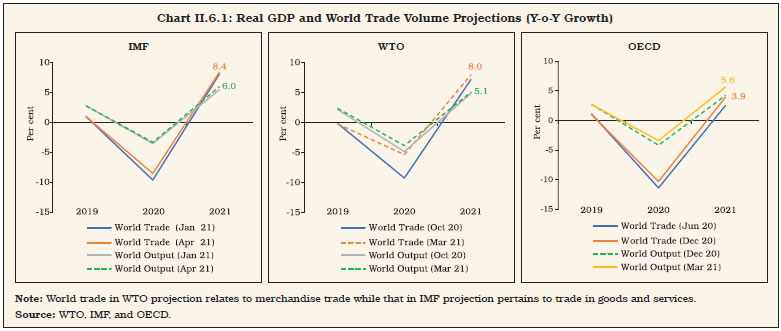 II.6.5 Lockdowns also impacted cross-border investment across greenfield projects as well as cross-border mergers and acquisitions, leading to a decline in global foreign direct investment flowsby 38 per cent in 2020.32 Europe faced a sudden stop, but developing economies, especially in Asia, fared better. After the COVID-19 pandemic triggered a massive portfolio outflow from EMEs in March 2020, the rapid and unprecedented response from governments and central banks, steps by the US Federal Reserve to support dollar liquidity, weakening of the US dollar, and the quick recovery in China helped rekindle portfolio flows in Q4:2020. Benefitting from reflation trade, EMEs hosted portfolio inflows to the tune of US$ 518 billion during 2020-21 (April-March), of which almost 77 per cent has been into debt markets. Boosted by resurgence in capital flows and fall in US dollar, EME currencies recovered during April-June 2020 and remained stable thereafter. Starting March 2020, massive purchases by central banks and reflation trade helped suppress bonds’ yields globally and the revival in risk appetite gave a much-needed impetus to foreign portfolio investors in acquisitions of EME assets. From Q3:2020, a broad-based recovery also set in upon commodity markets. 3. Merchandise Trade II.6.6 Against the backdrop of the collapse in world trade, India’s merchandise exports and imports contracted by 7.3 per cent and 18.0 per cent, respectively, during 2020-21. A fall inprices33, combined with a decline in volume by 3.5 per cent, pulled down exports. The stringent measures, which were imposed domestically to curb the spread of the pandemic disrupted export supply chains, especially in Q1:2020-21. Only pharmaceuticals, agricultural products and iron ore could withstand the onslaught of the pandemic (Table II.6.1). A revival gained strength in Q3, on the back of growth in non-oil exports (3.1 per cent) (Charts II.6.2a and II.6.2b). II.6.7 There was a decline in petroleum, oil and lubricant exports by 37.3 per cent during 2020-21, reflecting the effect of a drop in global crude oil prices. The decline in volume was smaller at 15 per cent. Production wars within OPEC plus and ensuing supply-demand mismatches triggered the steep fall in oil prices, with settlement prices for West Texas Intermediate futures closing in negative territory on April 20, 2020 while Brent crude prices dipped briefly below US$ 20 per barrel on April 27, 2020. However, oil price dynamics gradually changed during the year with supply restraints more rigorously observed by OPEC plus, supported by additional voluntary production cuts by the OPEC’s largest producers in June 2020 and January 2021. Later in March 2021, the production cuts were extended till April 2021. | Table II.6.1: India’s Merchandise Trade | | | Value in US$ Billion | Growth Rate (Y-o-Y) in Per Cent | | 2018-19 | 2019-20 | 2020-21 | 2018-19 | 2019-20 | 2020-21 | | 1 | 2 | 3 | 4 | 5 | 6 | 7 | | Exports | | Q1 | 82.1 | 80.9 | 51.3 | 14.7 | -1.4 | -36.6 | | Q2 | 81.4 | 78.2 | 74.1 | 9.7 | -3.9 | -5.3 | | Q3 | 80.6 | 79.1 | 75.7 | 4.7 | -1.9 | -4.3 | | Q4 | 86.0 | 75.1 | 89.5 | 6.7 | -12.7 | 19.2 | | Annual | 330.1 | 313.4 | 290.6 | 8.8 | -5.1 | -7.3 | | Imports | | Q1 | 128.7 | 130.1 | 61.3 | 12.7 | 1.1 | -52.9 | | Q2 | 132.9 | 118.0 | 88.3 | 22.8 | -11.3 | -25.2 | | Q3 | 130.7 | 116.1 | 110.5 | 8.1 | -11.2 | -4.8 | | Q4 | 121.7 | 110.5 | 130.9 | 0.3 | -9.2 | 18.4 | | Annual | 514.1 | 474.7 | 389.2 | 10.6 | -7.7 | -18.0 | | Trade Balance | | Q1 | -46.6 | -49.2 | -9.9 | | | | | Q2 | -51.5 | -39.7 | -14.1 | | | | | Q3 | -50.1 | -37.1 | -34.9 | | | | | Q4 | -35.7 | -35.4 | -41.4 | | | | | Annual | -184.0 | -161.3 | -98.6 | | | | Note: Quarterly figures will not add up to annual figures.
Source: DGCI&S. |
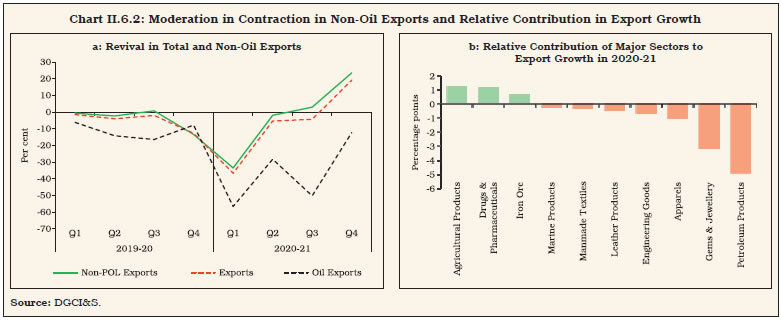 II.6.8 As pointed out earlier, drugs and pharmaceutical exports maintained positive growth during 2020-21, these exports grew by 18.1 per cent (US$ 24.4 billion) on a y-o-y basis. This resilient performance can be attributed to leveraging existing competencies in generic medicines production. India has a sizeable presence in the case of medicine exports, being the third largest exporter globally in volume terms. Moreover, Indian pharmaceutical companies supply around 50 per cent of vaccines globally. This expertise has been leveraged by Indian pharma companies to enter into partnerships with global pharma companies to produce COVID-19 vaccines. India has been highly dependent on China for Active Pharmaceutical Ingredients (APIs) imports; however, the recent Production-Linked Incentive (PLI) scheme addresses the API concentration risks and aims to make India’s manufacturing process globally competitive with a focus on increasing exports. The pharmaceutical sector has received around one-tenth of the total financial outlay under the PLI scheme and this move is expected to create economies of scale and strengthen India’s integration with global value chains (Box II.6.1). Box II.6.1
COVID-19 Pandemic - Opportunities and Challenges for Indian Pharmaceutical Exports The COVID-19 pandemic has placed the US$1 trillion global medical exports market at the centre stage of the global growth recovery. The World Health Organisation (WHO) suggested that a substantial portion of the world population needs to be vaccinated to develop herd immunity against COVID-19. On a conservative estimate of an average price of US$ 8 per vaccine34, export opportunities to the tune of US$ 31 to US$ 36 billion are estimated to open up at the global level. By undertaking research and development (R&D) activity at an unprecedented speed, vaccines have been developed in a record nine months. New ground-breaking (mRNA) techniques have also been employed, which reportedly will have the potential to cure many incurable diseases like cancer and Parkinson’s, opening up new revenue streams for the pharma sector. India’s pharma sector contributes around 2 per cent to GDP and 6.6 per cent to total merchandise exports. India is the 12th largest exporter of medical goods in the world and India’s pharma exports grew faster than world exports during the last two decades. Furthermore, India is a major supplier to least developed and developing countries. According to data analytics company Airfinity, India would be the leading supplier of the COVID-19 vaccine after the US in coming years (Chart 1a to 1c). Indian pharmaceutical firms have already started rolling out COVID-19 vaccine by leveraging on existing infrastructure and a skilled labour force. As on March 15, 2021, India had supplied total 586.4 lakh COVID-19 vaccines to 71 countries comprising grants (81.3 lakh), commercial exports (339.7 lakh) and under the COVAX platform (165.5 lakh). However, following the second wave and the pressing need to upscale vaccination in India, some moderation in its exports is expected in the short-term. In order to analyse the comparative advantage of Indian pharma companies, a panel fixed effect regression model for 67 pharmaceutical firms is estimated by using Prowess database, with exports to sales ratio as an explanatory variable and covering the sample period of 2010-11 to 2019-20, following the empirical specification (Rentala et al., 2017): 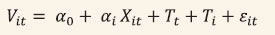 where the dependent variable (V) is exports by ‘ith’ firm as a proportion of its sales in the ‘t’ year. X represents a vector of firm-specific explanatory variables, viz., imports intensity, measured as the ratio of the imports of raw materials to overall purchase of raw material of a firm; research and development intensity, measured by the ratio of research and development expenditure to sales; leverage ratio, measured as total debt as a percentage of total assets; capital intensity, which is measured as net fixed assets as a percentage of total sales in the given year; and profitability,measured by the ratio of profits after tax to sales. Tt and Ti are time fixed effects and firm fixed effects to control for conditions in different financial years and in different firms, respectively. 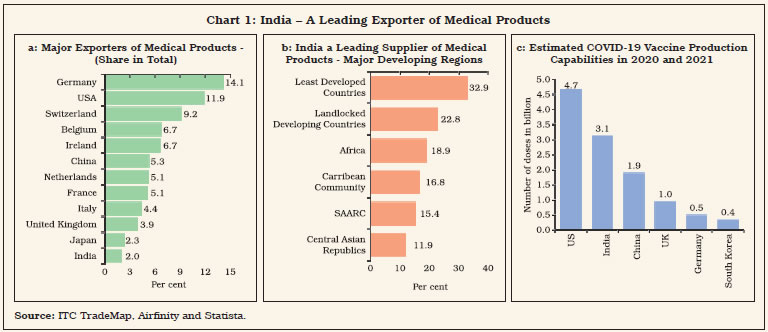 Empirical findings suggest that, R&D, import intensity, capital intensity and profit after tax are important factors that influence exports intensity (Table 1). Indian pharmaceutical companies spend only around 8-13 per cent of their turnover on R&D. Higher R&D expenditure improves product quality and enhances competitiveness in foreign markets (Grossman and Helpman, 1991). India’s pharma export sector relies heavily on imports of Active Pharmaceutical Ingredients (APIs), especially in the case of bulk drugs and this is corroborated by the empirical findings which suggest that import intensity is statistically significant. | Table 1: Export Intensity of India’s Pharmaceutical Industry | | Explanatory Variables | Dependent Variable: Export Intensity | | 1 | 2 | | Profit after Tax | 0.07* | | | (2.87) | | R&D Intensity | 0.69* | | | (3.97) | | Capital Intensity | 0.03* | | | (3.38) | | Leverage | -0.02 | | | (1.2) | | Import intensity | 0.10* | | | (2.93) | | No. of Companies | 67 | | Time Fixed Effects | YES | | Company Fixed Effects | YES | | R-squared | 0.86 | *: Significant at 1 per cent level.
Source: Prowess (CMIE); and RBI staff estimates. | The government has already taken several initiatives to reduce import dependency in certain key drug intermediates and APIs. Priority has also been accorded to boost R&D and original design capabilities through the PLI scheme. These actions bode well for raising the export potential of domestic pharma companies. References: 1. Grazzi, M., Mathew, N., & Moschella, D. (2017), ‘Efficiency, Innovation, and Imported Inputs: Determinants of Export Performance among Indian Manufacturing Firms’, LEM Working Paper Series (No. 2017/09). 2. Grossman, G.M. and Helpman, E. (1991), ‘Trade, Knowledge Spillovers, and Growth’, European Economic Review. 3. International Monetary Fund (2021), ‘World Economic Outlook Update’, January. 4. Rentala, S., Anand, B., & Shaban, M. (2017), ‘Determinants of Export Performance: An Empirical Analysis of the Indian Pharmaceutical and Automobile Industries’, International Business Strategy (pp. 241-257), Palgrave Macmillan, London. | II.6.9 Iron ore exports have shown robust growth of 86.8 per cent on y-o-y basis (US$ 4.9 billion) during 2020-21, posting double-digit growth in all months. The growth in iron ore exports was due to higher export volumes, aided by rising iron ore prices. In recent years, China has been the major export destination, accounting for more than four-fifths of India’s total iron ore exports. Concerns over Brazil’s iron ore supply and ongoing trade tensions between Australia and China have vacated additional space for India (Chart II.6.3). As a result, the supply-demand mismatch led to a steep rise in iron ore prices since June 2020 to record levels. II.6.10 Agricultural exports also showed resilience in COVID-19 times. According to the WTO, trade in agricultural products has been more resilient than overall trade. Initially, countries focused on ensuring food security by imposing exports restrictions and stockpiling food products; however, later on, there was a switch in policies towards supporting agricultural producers and mending supply chains by relaxing export restrictions. II.6.11 In India as well, agricultural exports which contracted in Q1:2020-21 rebounded sharply in subsequent quarters. The recovery was aided by a bumper kharif harvest creating favourable supply conditions (Chart II.6.4). II.6.12 Engineering goods - accounting for around one-fourth of India’s total merchandise export basket - contracted sharply in Q1:2020-21 as major export destinations imposed lockdowns. However, there has been a revival from Q2:2020-21 and a strong rebound in Q4:2020-21, especially in March 2021. Within this sector, exports of base metals including iron and steel, copper and products, zinc and products, and aluminium and products witnessed positive growth. The sharp industrial recovery in China and other East Asian economies, which emerged relatively unscathed from COVID-19, led to increased demand for base metal exports from India. On the other hand, exports of transport-related goods, including motor vehicles, ships, auto components have slumped, thereby pulling down the growth of overall engineering goods. The PLI scheme has been introduced for many components of engineering goods, including automobile and auto components and speciality steel. Furthermore, PLI schemes for manufacturing of white goods (air conditioners and light emitting diodes), high-efficiency solar photovoltaic modules, telecom and networking goods and advance chemistry cell (ACC) battery are expected to boost electronic goods exports and also support engineering good exports through economies of scale (Chart II.6.5a). 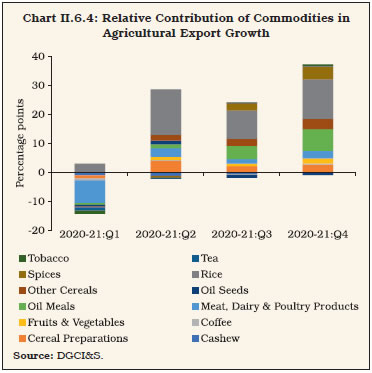
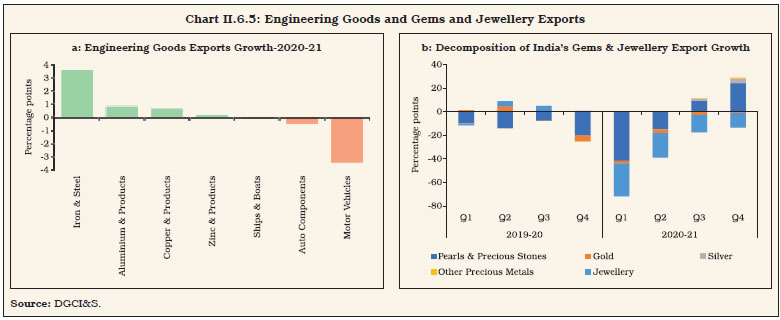 II.6.13 Gems and jewellery exports, which were contracting in 2019-20, slumped further in 2020-21 due to COVID-19 related demand and supply disruptions. The contraction was particularly severe in Q1:2020-21, but export growth finally returned into positive territory in November 2020 due to revival in demand for pearls and precious stones (Chart II.6.5b). Gold jewellery, which is the other major component, remains in a deep contractionary mode. The UAE used to be the largest destination of gold jewellery exports, accounting for more than 50 per cent of India’s total gold jewellery exports. However, travel restrictions and the reluctance of Indian exporters to ship goods on credit owing to the uncertainty created by COVID-19 led to a massive slump in exports of gold jewellery to the UAE. II.6.14 As stated earlier, the outbreak of COVID-19 resulted in severe supply and demand-side disruptions, India’s merchandise imports, which witnessed a slowdown during 2019, started to recover in January and February 2020. However, with the spread of the pandemic, import growth registered the biggest contraction in 30 years in April 2020, contracting by 59.7 per cent as against a growth of 6.1 per cent in April 2019. The contraction was also reflected in volume terms. As per the latest available data, imports declined to US$ 389.2 billion in 2020-21 from US$ 474.7 billion in 2019-20, a decline of 18.0 per cent (Table II.6.1). The contraction in imports has been due to price and volume effects, with import volumeestimated to have declined by 8.9 per cent35. II.6.15 The sectoral composition reveals that the contraction in imports was broad-based. The rolling out of stimulus packages, along with the gradual easing-up of lockdown measures during the festival season, resulted in a recovery in domestic demand (Chart II.6.6a). Commodity-wise, petroleum, oil and lubricants (POL), transport equipment, machinery, coal, pearl and precious stones and iron and steel are the major sectors which pulled down import growth during the year (Chart II.6.6b). 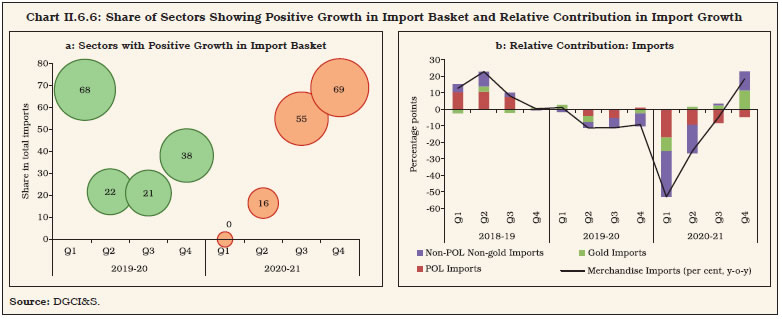 II.6.16 India is the world’s third-largest crude oil consumer after the US and China, with an import dependency of nearly 85 per cent, POL playsa critical role in total import payments.36 With the imposition of lockdown and travel curbs, the demand for POL collapsed, and POL import bill fell to US$ 82.4 billion (a decline of 36.9 per cent, y-o-y) during 2020-21 from US$ 130.6 billion in the corresponding period of the previous year. Lower POL imports reflected a fall in international crude oil prices (Indian basket) by 25.9 per cent (y-o-y) along with an estimated decline in volumes by 13.8 per cent. II.6.17 Iraq and Saudi Arabia remained the largest crude oil suppliers for India, though their share declined during the period. Venezuela, which was amongst India’s major crude oil suppliers, witnessed a steep decline in its share (0.9 per cent in April-February 2021 compared to 4.6 per cent in 2019-20) after the US imposed sanctions. By contrast, the UAE, Qatar and the US gained share in India’s POL imports (Chart II.6.7). 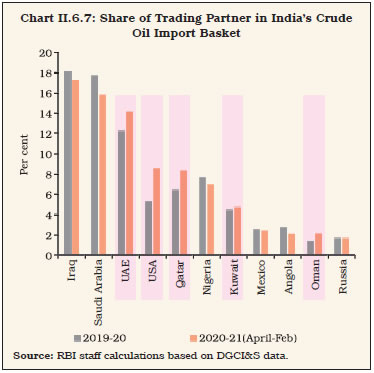
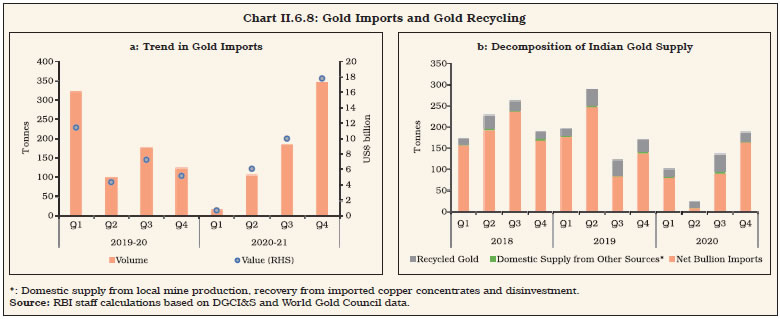 II.6.18 India is one of the biggest consumer of gold, but it imported its lowest monthly volumes in April 2020, reflecting a significant fall in demand in the pandemic. However, gold imports, in value terms, picked up in Q2 and have continued to remain at an elevated level since then. The growth in gold imports has been essentially driven by steep rise in global gold prices, though even in volume terms they have recovered to levels seen last year (Chart II.6.8a). In particular during Q4:2020-21, several factors, ranging from base effect to pre-festival impact (Akshaya Tritiya), pent up wedding induced demand contributed to the sharp surge in gold imports. According to a recent report by the World Gold Council, high gold prices supported an increase in global recycling of gold, which spiked sharply in Q2 and Q3:2020 (Chart II.6.8b). II.6.19 Non-oil non-gold imports, which started contracting from Q4:2018-19, witnessed a rebound in growth after seven quarters in Q3:2020-21, particularly in December 2020. Electronic goods, pearls and precious stones and chemicals were major contributors to the expansion during Q4:2020-21. II.6.20 The pandemic deepened the slowdown in imports of capital goods - an indicator of investment demand in an economy – which contracted by 28.3 per cent in April-November 2020 vis-à-vis 2.2 per cent a year earlier. All major sub-sectors witnessed a sharp slump, i.e., iron and steel, machine tools, machinery and transport equipment. Capital goods imports turned positive from December 2020 as recovery in the Indian economy gained traction (Chart II.6.9). 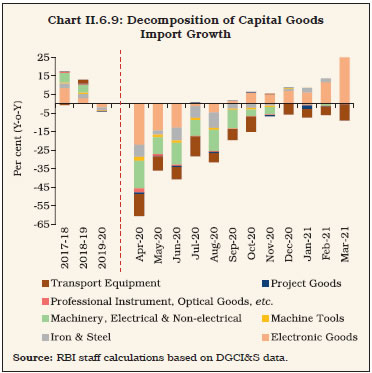
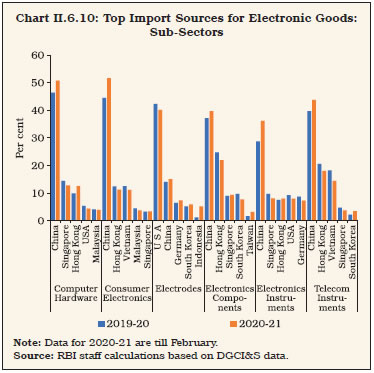 II.6.21 India’s electronic goods imports registered a marginal contraction of 0.1 per cent to US$ 54.3 billion in 2020-21 from US$ 54.4 billion in 2019-20. India is a net importer of electronic goods, the trade deficit of the electronic goods sector expanded to US$ 43.2 billion in 2020-21 from US$ 42.7 billion in the previous year37 (Chart II.6.10). Destination-wise, China is the major source partner for almost all the product categories. COVID-19 induced global lockdown caused supply-side disruptions due to which the need to diversify source partners has gained utmost importance. Accordingly, the government recently took two major policy initiatives to attract large scale investment in the electronics sector by way of the PLI scheme for large scale electronics manufacturing and the Scheme for Promotion of Manufacturing of Electronic Components and Semiconductors (SPECS). Several global manufacturing companies are expected to expand their manufacturing base in India. As this sector has strong backward and forward linkages, this, in turn, will foster expansion of domestic production capacity and boost exports with induction of newer technologies under AatmaNirbhar Bharat. II.6.22 During April-February 2020-21, the bilateral trade deficit with China declined, whereas the trade surplus with the US increased. Overall, as the decline in imports was larger than exports, the trade deficit narrowed to US$ 98.6 billion in 2020-21 from US$ 161.3 billion in the corresponding period of last year, reflecting the impact of both stringent lockdown measures and subdued economic activity due to COVID-19 (Charts II.6.11a and II.6.11b). 4. Invisibles II.6.23 Net receipts from invisibles, reflecting cross-border transactions of services, income and transfers, remained relatively resilient to the global shock on the back of stable services earnings (Chart II.6.12). While demand for software services exports remained strong and remittances receipts improved sequentially in Q2 and Q3, the outgo from primary income account increased with rise in net income payments to overseas investors. II.6.24 The ongoing pandemic and the resultant supply chain disruptions severely impacted world trade in commercial services in 2020 (Chart II.6.13). India’s services exports remained relatively resilient and showed signs of gradual recovery, primarily on the back of robust software exports earnings. Despite global headwinds, software services, accounting for more than 40 per cent of India’s total services exports, witnessed steady growth as major IT companies capitalised on growing global demand for business transformation initiatives to enhance digital presence and migrate to cloud services in the aftermath of the world-wide lockdown. Travel and transportation services were severely hit by the imposition of lockdown and travel restrictions world-wide (Chart II.6.14). Among other services, business and financial services, which mainly relates to off-site services, witnessed steady flows albeit at a moderated pace. 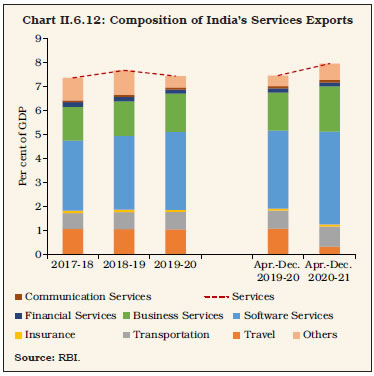
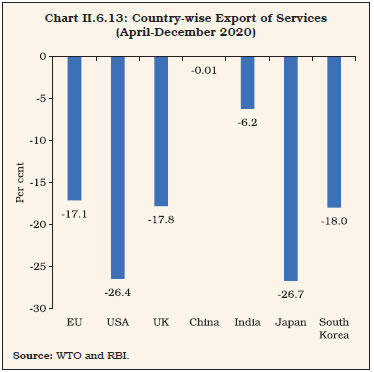
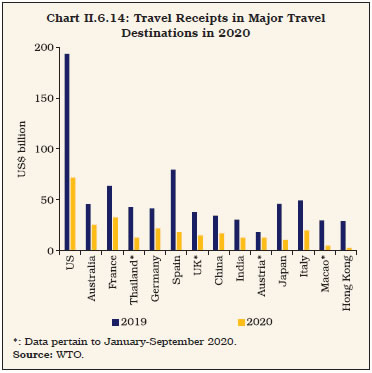
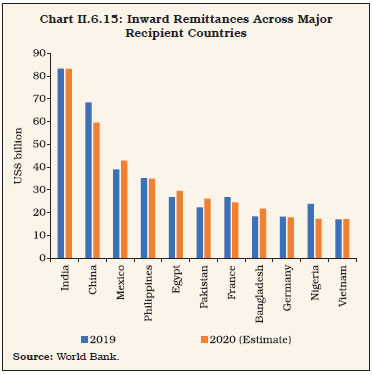 II.6.25 There was an exodus of migrant workers from host countries, resulting in a decline in global remittances flows in 2020 (Chart II.6.15). India, being the highest recipient of inbound remittances, recorded a decline of 5.4 per cent in remittances flows in April-December 2020-21. Although remittances rebounded gradually from this initial setback, flows remained below their pre-crisis levels. Nevertheless, India remained the largest recipient with a share of 11.8 per cent in global remittances in 2020 (World Bank, May 2021). II.6.26 The income account, primarily reflecting net cross-border income payments associated with the production process and ownership of financial and other non-produced assets, recorded higher net outflows in April-December 2020-21 relative to the preceding year. On account of moderation in gross investment income receipts owing to lower interest earnings on foreign currency assets and higher income payments on debt and non-debt liabilities, the net outgo remained higher on a year-on-year basis. II.6.27 In April-December 2020-21, the current account recorded a surplus of 1.7 per cent of GDP as against a deficit of 1.2 per cent a year ago (Chart II.6.16). After registering a record surplus in Q1:2020-21, the current account surplus narrowed in Q2 and turned negative in Q3 as the pace of contraction eased for both merchandise exports and imports and the trade deficit widened. Positive net terms of trade owing to modest crude oil prices and a decline in import volume contributed to the surplus in April-December 2020-21 (Chart II.6.17).
5. External Financing II.6.28 Among the major components of financial flows, foreign direct and portfolio investment inflows were large; however, loans in the form of external commercial borrowings, trade credit and banking capital recorded net outflows. With the current account in surplus, the accretion to foreign exchange reserves on a BoP basis (excluding valuation changes) was of the order of US$ 83.9 billion in April-December 2020 (Chart II.6.18 and Appendix Table 8). II.6.29 Capital flows were dominated by FDI which turned out to be higher than a year ago both in gross and net terms (Table II.6.2). FDI limits were enhanced in the areas of defence manufacturing to 74 per cent under the automatic route from 49 per cent earlier. There was a steady improvement in the OECD’s FDI restrictiveness index – from 0.244 in 2015 to 0.207 in 2019. The expansion of the PLI scheme has the potential to attract foreign companies that are looking to diversify their presence in global supply chains. In 2020-21, India’s FDI performance was in sharpcontrast to the global FDI.38 India crossed a milestone of cumulative FDI equity inflows of US$ 500 billion since April 2000 (Box II.6.2). | Table II.6.2: Foreign Direct Investment Inflows | | (US$ billion) | | | 2017-18 | 2018-19 | 2019-20 | 2020-21 | | 1 | 2 | 3 | 4 | 5 | | 1. Net FDI (1.1 - 1.2) | 30.3 | 30.7 | 43.0 | 43.4 | | 1.1 Net Inward FDI (1.1.1 - 1.1.2) | 39.4 | 43.3 | 56.0 | 54.7 | | 1.1.1 Gross Inflows | 61.0 | 62.0 | 74.4 | 81.7 | | 1.1.2 Repatriation/Disinvestment | 21.5 | 18.7 | 18.4 | 27.1 | | 1.2 Net Outward FDI | 9.1 | 12.6 | 13.0 | 11.3 | | Source: RBI. |
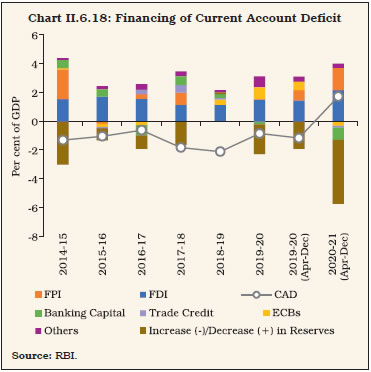
Box II.6.2
Is FDI COVID-Proof? The unprecedented shock of the global pandemic impacted cross-border movement of capital flows, particularly in the form of foreign direct investment (FDI). Global FDI flows declined by 38 per cent in 2020 (OECD, 2021), to their lowest level since 2005 (Chart 1). Lockdowns around the world not only caused delay in existing investment projects but also forced global companies to reassess their new projects. Among the major economies, India and China are the only economies that bucked the global trend in FDI inflows (Chart 2). In the case of India, the bulk of these investments went into e-commerce and digital platforms, with mega deals in Indian companies mirroring the growing business prospects for digital operations worldwide. Even though FDI inflows were stronger in 2020-21, their distribution was highly skewed (Chart 3). The coefficient of variation of FDI flows (based on transaction size) was larger during the pandemic period, implying concentration in distribution. The lower incidence of transactions points to the underlying weakness in FDI inflows during the year. Without the top five FDI deals, FDI inflows during 2020-21 would have declined by about third of their level a year ago. The number of FDI transactions declined by 31 per cent during the pandemic period, while their average size decreased marginally (Table 1).
Going forward, the pipeline of FDI for 2021-22 could be supported by the thrust given to PLI, and domestic growth prospects. | Table 1: Number and Size of FDI Transactions (Without Top 5 High Value Transactions) | | Period | Number of Transactions | Average Size (US$ Million) | | 1 | 2 | 3 | | 2019-20 | 19,330 | 1.8 | | 2020-21 | 13,278 | 1.7 | | Source: RBI; and RBI staff calculations. | Reference: OECD (2021), ‘FDI in Figures’ April. | During 2020-21, computer services attracted the largest FDI inflows (accounting for 43.9 per cent), followed by transport, manufacturing, retail and wholesale trade, and financial services. Country-wise, Singapore and the USA remained major sources of FDI equity inflows (accounting for 55.4 per cent of total flows), followed by Mauritius, the United Arab Emirates, Saudi Arabia, the Cayman Islands, and the Netherlands (Chart II.6.19 and Appendix Table 9). II.6.30 Besides equity investment, reinvested earnings (i.e., profits deemed to be invested) of FDI companies and inter-corporate debt transactions between affiliated enterprises were also robust, amounting to US$ 15.7 billion during April-December 2020-21. II.6.31 Outward FDI recorded a y-o-y decline by 13 per cent to US$ 11.3 billion during 2020-21, reflecting the broad-based decline in FDI flows across different regions of the world. Singapore, the USA, Mauritius, the Netherlands and the UK were the major destinations, together accounting for around 73 per cent of India’s outward FDI. Business services; manufacturing; restaurants and hotels; agriculture and mining; and construction were the top five sectors attracting India’s overseas direct investment during the year. 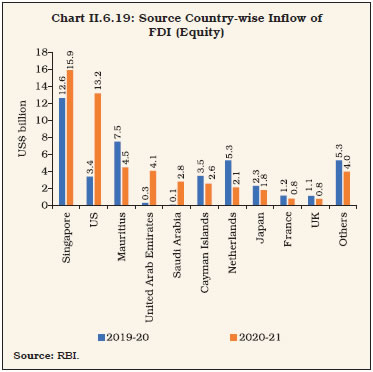 II.6.32 Portfolio flows recovered during the year from their March lows. Notwithstanding a sell-off in the debt segment in Q1:2020-21, large exposures of foreign portfolio investors in the equity segment in subsequent quarters took the total inflows to US$ 37.1 billion during 2020-21 (Chart II.6.20). Ample global liquidity driven by unprecedented monetary easing improved global financial conditions. Optimism on vaccines and fiscal stimulus in the US also triggered risk-on sentiments among foreign investors and caused surges in capital flows in EMEs, including India in November-December 2020. These flows, however, moderated in Q4:2020-21, in response to the high valuations in equities and increased supplies in bond markets. While the domestic equity segment hosted the largest ever net inflows in 2020 (calendar year), the debt segment witnessed a record sell-off during the same period. 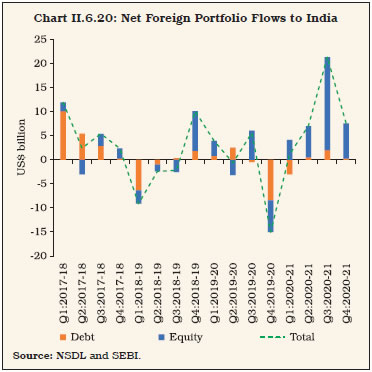 II.6.33 Amid falling real yields and large government borrowings during the year, FPIs reduced their exposure in the debt segment, with a utilisation rate of about 28 per cent of the total investment limit of G-sec and state development loans as on March 31, 2021. While the utilisation rate of specified government securities available under the ‘fully accessible route’ introduced in March 2020 for FPIs was 2.7 per cent, the use of the investment limit available under the voluntary retention route was to the tune of 72 per cent, albeit mainly through corporate bonds. As on March 31, 2021, FPIs held 24.5 per cent of the general investment limit in corporate bonds (i.e., 15 per cent of the outstanding stock), which was lower than 54.5 per cent of the limit a year ago. II.6.34 Around 67 per cent of the FPI inflows were recorded in top three sectors, viz., financial services (39 per cent), software and services (17 per cent) and oil and gas (11 per cent) (Chart II.6.21). Portfolio flows to the banking sector remained encouraging as banks raisedcapital in time to mitigate COVID-19 concerns39, with added momentum from government’sdecision to privatise some state-ownedbanks. Lockdown-induced reliance on digitaltransactions in the payments system improvedthe outlook of IT and IT enabled services.Among other sectors, investor optimism wasnoteworthy in automobiles and auto componentsand pharmaceuticals and biotechnology sectors.As at end-March 2021, assets under custodywere dominated by US-based portfolio investorsfollowed by Mauritius, Luxembourg, Singapore,and the UK. The limit for FPIs under VRRwas increased to ₹1,50,000 crore in January2020, and in view of the disruptions caused byCOVID-19, FPIs were subsequently allowedadditional time of three months to invest 75 percent of their committed portfolio size. CumulativeFPI investment under VRR (which was introducedin March 2019) was US$ 14.8 billion till March31, 2021. 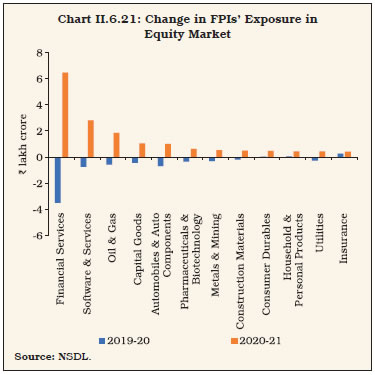 II.6.35 There was a decrease in external commercial borrowing agreements. Fresh disbursements of ECBs were lower in 2020-21, than their level a year ago and firms pre-paid ECBs. As repayments exceeded fresh disbursals in view of higher borrowing costs than a year ago (Chart II.6.22), ECBs recorded net outflow of US$ 0.6 billion during 2020-21 vis-à-vis inflows of US$ 21.7 billion a year ago (Chart II.6.23). 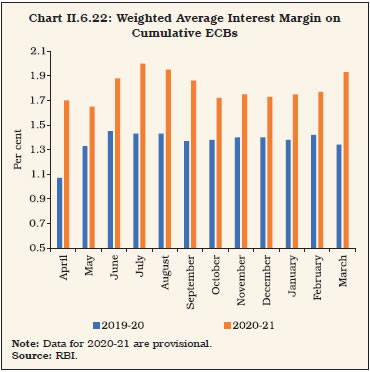
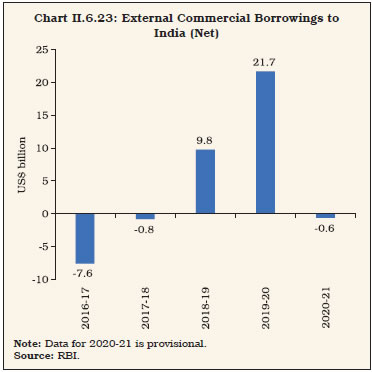
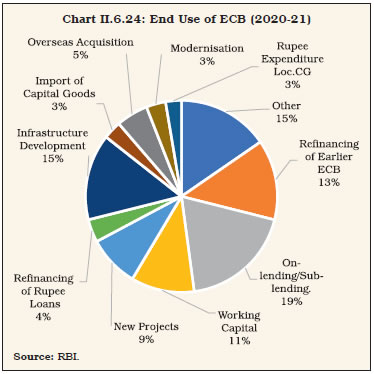 II.6.36 ECBs raised during the year were mainly utilised for on-lending/sub-lending, followed by infrastructure development, refinancing of earlier borrowings, working capital, new projects, overseas acquisition and refinancing of rupee loans (Chart II.6.24). Within ECBs, rupee denominated loans and rupee denominated bonds (RDBs) accounted for 6.0 per cent of the total agreement amount as compared with 7.1 per cent a year ago. Furthermore, the share of hedged loans/bonds (other than rupee denominated borrowings) stood lower at 51.3 per cent as compared with 56.7 per cent a year ago. RDBs recorded net outflows of US$ 0.9 billion lower than the outflows of US$ 1.3 billion in the corresponding period last year. II.6.37 External financing requirements for merchandise imports in the form of short-term credit also declined. As repayments exceeded fresh credit availed by importers, there was net outflow of US$ 1.8 billion in April-December 2020-21. Around 36 per cent of the trade credit was raised for imports of crude oil, gold, coal and copper. | Table II.6.3: Flows under Non-Resident Deposit Accounts | | (US$ billion) | | | 2017-18 | 2018-19 | 2019-20 | 2020-21 | | 1 | 2 | 3 | 4 | 5 | | 1. Non-Resident External (Rupee) Account | 7.1 | 7.3 | 5.6 | 8.8 | | 2. Non-Resident Ordinary Account | 1.5 | 1.9 | 2.0 | 2.3 | | 3. Foreign Currency Non-Resident(B) Account | 1.0 | 1.1 | 1.1 | -3.8 | | Non-Resident Deposits (1+2+3) | 9.7 | 10.4 | 8.6 | 7.4 | | Source: RBI. | II.6.38 With robust inflows in Non-Resident (External) Rupee (NRE) account, which constitutes around 72 per cent of total outstanding NRI deposits, net inflows into non-resident deposits accounts were US$ 7.4 billion during 2020-21, lower than their level a year ago (Table II.6.3). While NRE account and NRO account witnessed inflows of US$ 8.8 billion and US$ 2.3 billion, respectively, FCNR(B) deposits recorded outflows of US$ 3.8 billion, partly due to weakening of the US dollar. 6. Vulnerability Indicators II.6.39 India’s external debt at 21.4 per cent of GDP for end-December 2020 remained lower than that of emerging market peers. At end-December 2020, India’s external debt increased by US$ 5.3 billion (i.e., 1.0 per cent) from its level at end-March 2020, primarily on account of non-resident deposits. The increase was also contributed by valuation loss of US$ 11.4 billion resulting from the depreciation of the US dollar against the Indian rupee and major currencies (such as euro, yen, and SDR). Excluding the valuation effect, external debt would have decreased by US$ 6.1 billion instead of increasing by US$ 5.3 billion. Commercial borrowings remained the largest component of external debt, with a share of 36.9 per cent, followed by non-resident deposits (24.9 per cent) and short-term trade credit (17.7 per cent). Total debt increased from 20.6 per cent of GDP at end-March 2020 to 21.4 per cent at end-December 2020. Similarly, short-term debt (on residual maturity basis) increased during the year. A sizeable accretion in reserves, however, led to an improvement in other vulnerability indicators such as reserve cover of short-term debt (on residual maturity basis) and imports. India’s net international investment position (NIIP) improved by US$ 34.6 billion (i.e., fall in net claims of non-residents on India) during the same period (Table II.6.4). | Table II.6.4: External Vulnerability Indicators (End-March) | | (Per cent, unless indicated otherwise) | | Indicator | 2013 | 2019 | 2020 | End-Dec 2020 | | 1 | 2 | 3 | 4 | 5 | | 1. External Debt to GDP Ratio | 22.4 | 19.9 | 20.6 | 21.4 | | 2. Ratio of Short-term Debt (original maturity) to Total Debt | 23.6 | 20.0 | 19.1 | 18.4 | | 3. Ratio of Short-term Debt (residual maturity) to Total Debt | 42.1 | 43.4 | 42.4 | 44.8 | | 4. Ratio of Concessional Debt to Total Debt | 11.1 | 8.7 | 8.8 | 9.1 | | 5. Ratio of Reserves to Total Debt | 71.3 | 76.0 | 85.6 | 104.0 | | 6. Ratio of Short-term Debt (original maturity) to Reserves | 33.1 | 26.3 | 22.4 | 17.7 | | 7. Ratio of Short-term Debt (residual maturity) to Reserves | 59.0 | 57.0 | 49.6 | 43.1 | | 8. Reserve Cover of Imports (in months) | 7.0 | 9.6 | 12.0 | 18.6 | | 9. Debt Service Ratio (debt service to current receipts) | 5.9 | 6.4 | 6.5 | 9.0 | | 10. External Debt (US$ billion) | 409.4 | 543.1 | 558.2 | 563.5 | | 11. Net International Investment Position (NIIP) (US$ billion) | -326.7 | -436.9 | -375.2 | -340.5 | | 12. NIIP/GDP ratio | -17.8 | -16.0 | -13.9 | -12.9 | | 13. CAB/GDP ratio | -4.8 | -2.1 | -0.9 | 1.7 | Note: CAB/GDP ratio in column 5 pertains to April-December 2020.
Source: RBI and Government of India. | II.6.40 The accretion to the reserves, which reached a historic high of US$ 590.3 billion at end-January 2021 and were at US$ 577.0 billion at end-March 2021, was driven by robust foreign portfolio and direct investments, and the current account surplus in H1:2020-21. In 2020-21, India’s reserves accumulation was to the tune of US$ 99.2 billion. 7. Conclusion II.6.41 Going forward, the outlook for India’s external sector will continue to be determined by pandemic’s impact on demand and supply side dynamics, globally and in India. The thrust in the budget on easy access to certain raw materials augurs well for export recovery. Waning terms of trade gains in view of rising global crude oil prices and subdued flows of remittances may pose downside risks. However, the improvement in terms of external vulnerability indicators, adequate level of foreign exchange reserves and sound domestic macroeconomic fundamentals would help the economy withstand spillovers of global adverse macro-financial shocks. Global financial conditions remain easy but can alter rapidly. Various reform measures undertaken by the government have the potential to keep the external sector sustainable.
|