| The Indian economy exhibited resilience during 2023-24, in the face of headwinds from protracted geopolitical tensions and volatile global financial markets. The combination of a sustained anti-inflationary monetary policy stance and proactive supply management measures resulted in headline inflation remaining largely within the tolerance band. Monetary and credit conditions evolved in line with the monetary policy stance. Within the commitment to fiscal consolidation, emphasis was laid on capital spending. External sector sustainability indicators improved during the year, insulating the economy from spillovers from adverse global macro-financial shocks. II.1.1 The global economy turned out to be resilient in 2023 in spite of tightening financial conditions engendered by restrictive monetary policy stances, geopolitical tensions and geoeconomic fragmentation. Global GDP rose by 3.2 per cent in 2023 (3.5 per cent a year ago1) supported by buoyancy in the US and major emerging market and developing economies (EMDEs). Global inflation eased to 6.8 per cent in 2023 from 8.7 per cent a year ago on the back of monetary tightening and restoration of supply chains. Pandemic-induced loosening in fiscal policy exerted upward pressures on the global public debt-GDP ratio in an environment of sluggish growth and elevated interest rates. Global merchandise trade volume contracted by 1.2 per cent in 2023 from an expansion of 3.0 per cent in 20222, dragged down by rising trade restrictions and a rotation of demand away from goods to services. Global financial markets exhibited bouts of volatility in response to fluctuating perceptions on the monetary policy trajectory among market participants in spite of high for longer stances articulated by central banks. Sovereign bond yields hardened in the first half of 2023-24 and exhibited sizeable two-way movements in the second half. The US dollar remained firm through the year, putting downward pressures on emerging market economy (EME) currencies. II.1.2 Amidst global uncertainty, the Indian economy exhibited resilience during 2023-24, with real GDP growth3 improving to 7.6 per cent from 7.0 per cent in 2022-23, supported by robust fixed investment. On the supply side, economic activity was supported by the improvement in the manufacturing sector’s profitability which benefitted from lower input prices as well as the sustained momentum in services activity, offsetting the slowdown in the agricultural sector. II.1.3 Headline inflation moderated during 2023-24 into the tolerance band on the back of anti-inflationary monetary policy, active supply management measures, and corrections in global commodity prices. Core inflation exhibited a broad-based disinflation and has moved below 4 per cent from December 2023. II.1.4 General government finances exhibited improvement in terms of key deficit and debt indicators as the commitment to fiscal consolidation took hold amidst a directing of public expenditure towards growth-supportive measures with greater focus on capex. Tax revenues were buoyant, supported by resilient economic activity and improving compliance. II.1.5 During the year, domestic financial markets evolved in an orderly manner. Money market rates hardened with the ebbing of liquidity surplus, partly due to an increase in government cash balances. Issuances of certificates of deposit (CDs) increased amidst sustained credit demand. After remaining range-bound during H1:2023-24, sovereign bond yields softened on lower domestic inflation, announcement of inclusion of Indian sovereign bonds in major global bond indices, and lower than expected market borrowings programme of Government of India (GoI) announced in the interim Union Budget 2024-25. Equity markets registered strong gains on buoyant economic activity and corporate performance. The Indian rupee (INR) exhibited stability, supported by robust domestic prospects and improvements in India’s external position. The moderation in the current account deficit (CAD) amidst large capital inflows enabled addition to foreign exchange reserves. II.1.6 Against this backdrop, the rest of the chapter is structured into six sections. An analysis of the real economy is presented in section 2, followed by a detailed analysis of inflation and its drivers in section 3. The developments in monetary aggregates and financial markets are presented in sections 4 and 5, respectively. The evolution of government finances (centre and states) is discussed in section 6, and external sector dynamics are covered in section 7. II.2 THE REAL ECONOMY II.2.1 The Indian economy exhibited resilience during 2023-24, notwithstanding persistent headwinds from subdued external demand, protracted geopolitical tensions and volatile global financial markets. Real GDP growth was sustained at 7 per cent and above for the third successive year in 2023-24, supported by robust growth in fixed investment on the back of the government’s focus on capital expenditure. On the supply side, economic activity was lifted by the boost to the manufacturing sector’s profitability from the correction in input prices and sustained momentum in services activity, even as the agricultural sector activity exhibited a slowdown. II.2.2 An assessment of aggregate demand and its major components is etched out in sub-section 2. The developments in aggregate supply conditions in terms of the performance of agriculture, industry and services are presented in sub-section 3. Employment and labour market dynamics are discussed in sub-section 4, with concluding observations in sub-section 5. 2. Aggregate Demand II.2.3 Real GDP rose by 7.6 per cent in 2023-24 as compared with 7.0 per cent growth in 2022-23, according to the second advance estimates (SAE) of the National Statistical Office (NSO) [Table II.2.1 and Appendix Table 1]. This acceleration was powered by solid expansion in investment demand, which more than offset the slowdown in private consumption demand and the drag from external demand (Appendix Table 2). Real GDP growth was robust at 8.2 per cent during 2023-24 (April-December). The acceleration in momentum in Q2 sustained in Q3:2023-24 (Chart II.2.1). Consumption II.2.4 Private final consumption expenditure (PFCE) – the mainstay of domestic aggregate demand – slackened in 2023-24. Deficient and uneven south-west and north-east monsoon pulled down both kharif and rabi production. Two-wheeler sales, an indicator of rural demand, picked up in H2:2023-24. Demand for work under the Mahatma Gandhi National Rural Employment Guarantee Act (MGNREGA) also tapered in H2, suggesting some recovery in rural demand. Urban demand was supported by improvement in labour market conditions, higher disposable incomes, tapering of retail inflation and double digit growth in retail credit. Domestic air passenger traffic, railway passenger traffic and passenger vehicle sales recorded robust growth. Both collection of goods and services tax (GST) and issuance of E-way bills registered steady expansion. Government final consumption expenditure (GFCE) displayed a modest expansion in 2023-24 as the government remained committed towards its fiscal consolidation path (Chart II.2.2). 
| Table II.2.1: Real GDP Growth | | Component | Growth (per cent) | | 2019-20 | 2020-21 | 2021-22 | 2022-23 | 2023-24 | | 1 | 2 | 3 | 4 | 5 | 6 | | I. Total Consumption Expenditure | 5.0 | -4.6 | 9.8 | 7.1 | 3.0 | | Private | 5.2 | -5.3 | 11.7 | 6.8 | 3.0 | | Government | 3.9 | -0.8 | 0.0 | 9.0 | 3.0 | | II. Gross Capital Formation | -6.0 | -10.6 | 25.4 | 2.0 | 10.2 | | Gross Fixed Capital Formation | 1.1 | -7.1 | 17.5 | 6.6 | 10.2 | | Change in Stocks | -58.7 | -76.4 | 525.4 | 14.5 | 5.0 | | Valuables | -14.2 | 29.9 | 32.5 | -19.1 | 13.8 | | III. Net Exports | | | | | | | Exports | -3.4 | -7.0 | 29.6 | 13.4 | 1.5 | | Imports | -0.8 | -12.6 | 22.1 | 10.6 | 10.9 | | IV. GDP | 3.9 | -5.8 | 9.7 | 7.0 | 7.6 | | Source: NSO. | Investment and Saving II.2.5 The rate of gross domestic investment in the Indian economy, measured by the ratio of gross capital formation (GCF) to GDP at current prices, moderated marginally to 32.2 per cent in 2022-23 from 32.4 per cent in the preceding year. Available information for the constituents of the GCF for 2023-24 indicate an uptick in investment, led by the government’s sustained thrust on infrastructure, coupled with ebullience in the housing sector. The ratio of real gross fixed capital formation (GFCF) to GDP inched up to 34.1 per cent in 2023-24 from 33.3 per cent in the previous year. Among the components of GFCF, the construction sector gathered traction as evident in robust growth in its proximate coincident indicators – steel consumption and cement production (Chart II.2.3). Capacity utilisation (CU) of the manufacturing sector has remained above its long-term average. It increased to 74.7 per cent in Q3:2023-24 from 74.0 per cent in the previous quarter4. The seasonally adjusted CU was 74.6 per cent in Q3:2023-24. 
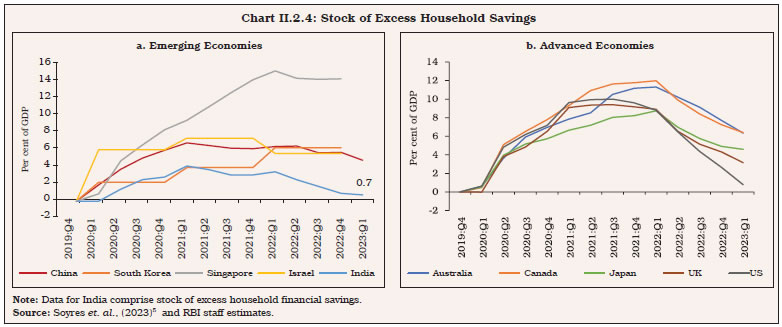
 II.2.6 Gross domestic saving as per cent to gross national disposable income (GNDI) moderated to 29.7 per cent in 2022-23 from 30.8 per cent in the preceding year, due to drop in household financial saving (net) to 5.2 per cent of GNDI in 2022-23 from 7.2 per cent in the previous year (Table II.2.2 and Appendix Table 3) as households drew down excess saving accumulated during the pandemic to fund consumption and investment. In consonance with the global trend, India had experienced a spike in household financial saving (net) to 11.6 per cent of GNDI during 2020-21, as pandemic-induced restrictions on mobility and spending curtailed consumption of contact-intensive services. As a result, the accumulated stock of excess financial savings6 rose to 4.1 per cent of GDP by end-March 2021; with the ebbing of the pandemic and release of the pent-up demand, the stock of excess financial savings moderated to 0.7 per cent of GDP as at end-March 2023 (Chart II.2.4). | Table II.2.2: Financial Saving of Household Sector | | (Per cent of GNDI) | | Item | 2013-14 | 2014-15 | 2015-16 | 2016-17 | 2017-18 | 2018-19 | 2019-20 | 2020-21 | 2021-22 | 2022-23 | | 1 | 2 | 3 | 4 | 5 | 6 | 7 | 8 | 9 | 10 | 11 | | A. Gross Financial Saving | 10.4 | 9.9 | 10.7 | 10.4 | 11.9 | 11.8 | 11.4 | 15.2 | 10.9 | 10.9 | | of which: | | | | | | | | | | | | 1. Currency | 0.9 | 1.0 | 1.4 | -2.1 | 2.8 | 1.4 | 1.4 | 1.9 | 1.1 | 0.9 | | 2. Deposits | 5.8 | 4.8 | 4.6 | 6.3 | 3.0 | 4.2 | 4.3 | 6.2 | 3.5 | 4.0 | | 3. Shares and Debentures | 0.2 | 0.2 | 0.2 | 1.1 | 1.0 | 0.9 | 0.5 | 0.5 | 0.9 | 0.8 | | 4. Claims on Government | 0.2 | 0.0 | 0.5 | 0.7 | 0.9 | 1.1 | 1.3 | 1.3 | 1.1 | 0.9 | | 5. Insurance Funds | 1.8 | 2.4 | 1.9 | 2.3 | 2.0 | 2.0 | 1.7 | 2.8 | 2.0 | 2.0 | | 6. Provident and Pension Funds | 1.5 | 1.5 | 2.1 | 2.1 | 2.1 | 2.1 | 2.2 | 2.5 | 2.3 | 2.3 | | B. Financial Liabilities | 3.1 | 3.0 | 2.7 | 3.0 | 4.3 | 4.0 | 3.8 | 3.7 | 3.8 | 5.7 | | C. Net Financial Saving (A-B) | 7.2 | 6.9 | 7.9 | 7.3 | 7.5 | 7.8 | 7.6 | 11.6 | 7.2 | 5.2 | GNDI: Gross National Disposable Income.
Note: Figures may not add up to total due to rounding off of the numbers.
Source: NSO. |
 II.2.7 The saving-investment gap widened during 2022-23, driven by non-financial corporations, reflecting the revival in investment demand along with a moderation in the saving rate (Chart II.2.5). The drawdown by the general government sector reduced further on the back of continuing fiscal consolidation. 3. Aggregate Supply II.2.8 As per the SAE of the NSO, aggregate supply, measured by real gross value added (GVA) at basic prices, expanded by 6.9 per cent in 2023-24 as compared with 6.7 per cent in 2022-23, propelled by the industrial and the services sectors, while agriculture tapered in 2023-24 (Table II.2.3). The momentum remained strong in Q2 and Q3:2023-24 (Chart II.2.6). | Table II.2.3: Real GVA Growth | | (Per cent) | | Sector | 2019-20 | 2020-21 | 2021-22 | 2022-23 | 2023-24 | | 1 | 2 | 3 | 4 | 5 | 6 | | I. Agriculture, Forestry and Fishing | 6.2 | 4.0 | 4.6 | 4.7 | 0.7 | | II. Industry | -2.5 | 1.1 | 9.6 | -0.6 | 8.3 | | II.1 Mining and Quarrying | -3.0 | -8.2 | 6.3 | 1.9 | 8.1 | | II.2 Manufacturing | -3.0 | 3.1 | 10.0 | -2.2 | 8.5 | | II.3 Electricity, Gas, Water Supply and Other Utility Services | 2.3 | -4.2 | 10.3 | 9.4 | 7.5 | | III. Services | 5.8 | -7.9 | 10.6 | 9.9 | 7.9 | | III.1 Construction | 1.6 | -4.6 | 19.9 | 9.4 | 10.7 | | III.2 Trade, Hotels, Transport, Communication and Services Related to Broadcasting | 6.0 | -19.9 | 15.2 | 12.0 | 6.5 | | III.3 Financial, Real Estate and Professional Services | 6.8 | 1.9 | 5.7 | 9.1 | 8.2 | | III.4 Public Administration, Defence and Other Services | 6.6 | -7.6 | 7.5 | 8.9 | 7.7 | | IV. GVA at Basic Prices | 3.9 | -4.1 | 9.4 | 6.7 | 6.9 | | Source: NSO and RBI staff estimates. |
Agriculture and Allied Activities II.2.9 The agriculture and allied activities sector faced headwinds from the uneven and deficient south-west monsoon (SWM) rainfall coinciding with strengthening El Nino7 conditions. The overall SWM rainfall in 2023 (June-September) was 6 per cent below long period average (LPA)8 at the all-India level (Chart II.2.7a). The late onset of the SWM, along with temporal and spatial uneven precipitation, delayed the start of kharif sowing and a shortfall occurred in overall kharif sowing. The north-east monsoon (NEM) [October-December] also ended with a rainfall deficit (9 per cent). The below-normal SWM and NEM rainfall depleted reservoir storage levels (Chart II.2.7b). II.2.10 As per the SAE, the production of kharif and rabi foodgrains in 2023-24 was 1.3 per cent lower than the final estimates of the previous year (Table II.2.4). The output of millets could benefit from productivity gains (Box II.2.1). As per the First Advance Estimates (FAE), the production of horticultural crops during 2023-24 was 0.1 per cent below the final estimates of 2022-23, mainly due to lower production in vegetables. II.2.11 The minimum support prices (MSPs) for both kharif and rabi seasons 2023-24 ensured a minimum return of 50 per cent over the cost of production9 for all crops. The overall public stock of foodgrains as on March 31, 2024 stood at 2.9 times the total quarterly buffer norm (Chart II.2.8). On November 29, 2023, the government extended free distribution of foodgrains under the Pradhan Mantri Garib Kalyan Anna Yojana (PMGKAY) for five more years, effective January 1, 2024. | Table II.2.4: Agricultural Crop Production 2023-24* | | (Lakh tonne) | | Crop | 2022-23
Final Estimates** | 2023-24
Second Advance Estimates
(SAE) | 2023-24
(SAE) Variation
Over 2022-23 Final Estimate
(per cent) | | 1 | 2 | 3 | 4 | | 1. Foodgrains | 3,135.5 | 3,093.5 | -1.3 | | Rice | 1,255.2 | 1,238.2 | -1.4 | | Wheat | 1,105.5 | 1,120.2 | 1.3 | | Nutri/Coarse Cereals | 535.0 | 500.7 | -6.4 | | Pulses | 239.8 | 234.4 | -2.2 | | Tur | 33.1 | 33.4 | 0.8 | | Gram | 122.7 | 121.6 | -0.9 | | Urad | 24.0 | 20.6 | -14.4 | | Moong | 18.3 | 15.1 | -17.6 | | 2. Oilseeds | 403.0 | 366.0 | -9.2 | | 3. Sugarcane | 4,905.3 | 4,464.3 | -9.0 | | 4. Cotton # | 336.6 | 323.1 | -4.0 | | 5. Jute & Mesta ## | 93.9 | 96.3 | 2.6 | *: Kharif and Rabi crops. **: Excluding summer crops. #: Lakh bales of 170 kg each. ##: Lakh bales of 180 kg each.
Source: Ministry of Agriculture and Farmers Welfare, GoI. |
Box II.2.1
Boosting Millet Production in India: Identifying the Supply Side Drivers India accounts for almost 80 per cent of Asia’s and 20 per cent of global millet production10. The acreage and production of millets have, however, stagnated over the years (Charts 1a and 1b), partly reflecting incentives for cultivation of fine cereals through MSP-backed procurement and a visible shift in consumer preferences towards fine cereals (Rao, 2021). Millets are typically grown under rainfed conditions with no/minimal irrigation (Chart 1c). The productivity of millets in India remains lower than those of major producers around the world (Chart 1d). The plot level comprehensive cost of cultivation survey (CCCS) data for 2021-22 show a significant yield gap from the frontier11 farmers, implying considerable scope for improvement. Against this backdrop, results from a generalised linear model using the CCCS dataset for 2021-22 show a significant dependence of the yield gap12 for bajra on the rainfall position (Table 1). 
| Table 1: Determinants of Yield Gap in Bajra Production | | Dependent Variable: Yield Gap | | | Model 1 | Model 2 | Model 3 | Model 4 | | Rainfall | | | | | | Actual Rainfall (millimetre) | -1.27*** | -0.98*** | - | - | | | (0.26) | (0.23) | | | | Deviation from LPA (1 = Normal and Above Normal Rainfall@) | - | - | -0.04** | -0.04** | | | | | (0.02) | (0.02) | | Input Variables | | | | | | Labour (hours/hectare) | -0.60* | -0.84*** | -0.88*** | -0.85*** | | | (0.33) | (0.27) | (0.29) | (0.28) | | Irrigation (hours/hectare) | -0.01 | 0.01 | 0.02 | - | | | (0.02) | (0.01) | (0.01) | | | Ownership of Irrigation (1=owned) | - | - | - | -0.01* | | | | | | (0.01) | | Seed (kg/hectare) | 0.16 | 0.15 | 0.12 | 0.10 | | | (0.15) | (0.10) | (0.11) | (0.11) | | Fertiliser (kg/hectare) | -0.17*** | -0.16*** | -0.17*** | -0.16*** | | | (0.04) | (0.04) | (0.05) | (0.04) | | Technology Variables | | | | | | Usage of Hybrid Seeds (1= adopted) | -0.06** | -0.05** | -0.03 | -0.04* | | | (0.03) | (0.02) | (0.02) | (0.02) | | Machine (hours/hectare) | -0.19** | -0.11* | -0.12** | -0.13** | | | (0.09) | (0.07) | (0.06) | (0.06) | | Demand Variables | | | | | | Lagged Price# (₹/quintal) | -1.73 | - | - | - | | | (1.55) | - | - | - | | Expected Net Returns# (1= Positive returns) | - | -0.14*** | -0.15*** | -0.14*** | | | - | (0.02) | (0.02) | (0.02) | | State Dummy | Yes | Yes | Yes | Yes | | Number of Observations | 448 | 448 | 427 | 427 | | Log Pseudolikelihood | -288.67 | -282.00 | -272.17 | -272.13 | -: Not applicable.
***, ** and * indicate significance levels at 1 per cent, 5 per cent and 10 per cent, respectively.
@: Rainfall deviation of +/-19 per cent from LPA is considered as normal at district level.
#: Based on previous year’s prices.
Note: 1. Figures in parentheses are robust standard errors (calculated using the delta method and clustered at the block level).
2. Data for all the variables have been used at the plot level, except for prices and rainfall which are taken at district-level.
Source: RBI staff estimates. | Although millets are considered drought resistant crops, a minimal but assured13 irrigation would be critical in bridging the yield gap. Labour, fertiliser and machine usage are also negatively and significantly related to the yield gap. The adoption of hybrid seeds improves yields. Higher expected net returns (proxied by using lagged prices and prevailing cost) are also likely to encourage farmers to invest more in high-yielding inputs and thus reduce the yield gap. References: 1. Papke, L. E., and Wooldridge, J. M. (1996), ‘Econometric Methods for Fractional Response Variables with an Application to 401 (k) Plan Participation Rates’, Journal of Applied Econometrics, 11(6), 619-632. 2. Rao, B.D., Bhandari, R. and Tonapi, V.A. K. (2021), ‘White Paper on Millets – A Policy Note on Mainstreaming Millets for Nutrition Security’, ICAR-Indian Institute of Millets Research (IIMR), Hyderabad, India. |
 Industrial Sector II.2.12 India’s industrial sector registered a strong growth in 2023-24, aided by healthy corporate profits on the back of easing input cost pressures (Chart II.2.9). II.2.13 Industrial output as measured by the index of industrial production (IIP) expanded by 5.8 per cent during 2023-24 as compared with 5.2 per cent in the previous year (Chart II.2.10a). Within the manufacturing sector, 13 of 23 industry groups recorded y-o-y expansion, led by transport equipment, motor vehicles and basic metals. In terms of the use-based classification, all categories recorded y-o-y expansion (Chart II.2.10b). II.2.14 The manufacturing sector gained from the production-linked incentive (PLI) scheme. As of December 2023, actual investments of ₹1.07 lakh crore was realised, which has resulted in production/sales of ₹8.7 lakh crore, creation of over 7.0 lakh jobs directly and indirectly, and exports surpassing ₹3.4 lakh crore. Incentives totalling around ₹4,415 crore have been disbursed since the beginning of the scheme. Electronics and pharmaceuticals have been the major beneficiaries of the PLI scheme. II.2.15 The mining sector index recorded 7.5 per cent y-o-y growth in 2023-24, led by expansion in coal production. Renewable energy, which accounts for around 13 per cent of the overall power generation, recorded a healthy growth during 2023-24 (Chart II.2.11). India had a total renewable energy capacity of 190.6 gigawatts (GW) as on March 31, 2024. Services Sector II.2.16 The services sector growth in 2023-24 was boosted by construction activity and financial, real estate and professional services. Proximate indicators of services sector such as air traffic, railway freight, automobile sales, steel consumption, GST E-way bills and foreign tourist arrivals recorded buoyant expansion (Table II.2.5).  II.2.17 India’s construction sector, currently ranking as the world’s third largest, posted strong growth in 2023-24. Steel consumption and cement production expanded by 11.9 per cent and 9.1 per cent, respectively, in 2023-24. Pent-up demand and robust consumer sentiment for home ownership seen since the pandemic, maintained momentum in 2023-24 (Chart II.2.12). The information technology (IT) sector remained muted in 2023-24, impeded by global headwinds. The hospitality sector made further gains, with sustained leisure and corporate travel demand. In the financial sector, aggregate deposits and bank credit to the commercial sector recorded double digit expansion. Public administration, defence, and other services (PADO) registered a steady growth. 
 II.2.18 The services sector composite index (SSCI)14, which tracks activity in construction, trade, transport and financial services and is a coincident indicator of GVA growth in the services sector excluding PADO, remained at an elevated level in 2023-24 (Chart II.2.13). 4. Employment II.2.19 Labour market conditions improved during 2022-23 and 2023-24. According to the annual periodic labour force survey (PLFS), the unemployment rate (UR) declined further to 3.2 per cent in 2022-23 (from 4.1 per cent in the previous year) alongside a rise in the labour force participation rate (LFPR) to 57.9 per cent from 55.2 per cent15, with the progressive normalisation after the pandemic. LFPR and the worker population ratio (WPR) for 2022-23 were the highest since the inception of the PLFS series in 2017-18 (Chart II.2.14a). The employment situation improved in both rural and urban areas (Chart II.2.14b).  II.2.20 As per the quarterly PLFS, which covers urban areas, the LFPR as well as the worker-population ratio during Q4:2023-24 was the highest since the survey’s inception for persons aged 15 years and above, which pushed the unemployment rate to one of the lowest levels at 6.7 per cent (Chart II.2.15). The organised sector employment, as measured by payroll data, also indicated gains in 2023-24 (Chart II.2.16). II.2.21 Productivity growth is a key driver of medium-term growth. The important factors contributing to productivity growth in India since the 1990s include resource reallocation from low-productive to high-productive sectors and rapid penetration of information and communication technology (ICT)16 [Box II.2.2]. 

 Box II.2.2
Productivity and Digitalisation in India The effect of digitalisation17 on productivity is assessed through two separate channels, viz., via the role of ICT as an input in driving output and labour productivity growth in the economy; and by estimating the productivity potentials by examining the differential between ICT and non-ICT sectors (Das and Erumban, 2016). Role of ICT as an Input in Production Function For India, estimates of productivity and output growth were constructed for 27 KLEMS industries from 1980 to 2020 as follows: In the next stage, the decomposition of labour productivity growth is obtained as: The decomposition results20 show that the contribution of ICT capital services to output growth increased from 5.0 per cent during 1981-90 to 13.2 per cent during 1992-2023. The contribution of ICT capital deepening to labour productivity growth increased from 8.4 per cent to 15.3 per cent over the same period. Effect of ICT Sectors on TFP Growth The 27 KLEMS industries have been segmented into ICT and non-ICT sectors to examine the productivity differential between ICT and non-ICT sectors using the following equation: | Table 1: Productivity and ICT Sector | | Period/ Variable | Dependent Variable (ΔP): | | 1980-2020 | 1980-1990 | 1990-2000 | 2000-2010 | 2010-2020 | | 1 | 2 | 3 | 4 | 5 | 6 | | ICT Sector Dummy | 0.16*** | 0.31* | 0.52 | 0.68* | -0.31 | | | (3.46) | (1.83) | (1.39) | (1.99) | (-0.91) | | Non-ICT Sector Dummy | 0.12* | 0.27 | 0.45 | 0.60* | -0.33 | | | (2.69) | (1.56) | (1.24) | (1.82) | (-0.99) | | Difference between ICT and Non-ICT | 0.04*** | 0.04*** | 0.07* | 0.07** | 0.01 | | | (5.46) | (9.15) | (2.69) | (3.24) | (1.33) | | Number of Observations | 1053 | 243 | 243 | 243 | 243 | ***, ** and * indicate significance levels at 1 per cent, 5 per cent and 10 per cent, respectively.
Note: 1. The models include controls for labour quality, capital stock, capital composition, industry, and year-fixed effects.
2. Figures in parentheses are t-statistics.
Source: RBI staff estimates. |
 The results show that, on average, the ICT sector’s productivity fared better than the non-ICT sector for the whole sample period (1980-2020) and the decadal sub-periods (Table 1). The productivity impact of ICT continued to grow during 1980 to 2010, refuting Solow’s productivity paradox for India22. The emergence of the paradox in India for the more recent period (2010-2020), however, is generally consistent with the post-GFC productivity slowdown despite rising digitisation in many parts of the world, reflecting uneven access to digital technologies or their quality; and slow diffusion of technology benefits between the leading and the lagging firms (Dieppe et. al., 2020). References: 1. Dieppe, A., Kilic Celik, S., and Kindberg-Hanlon, G. (2020), ‘Global Productivity: Trends. Drivers, and Policies’, The World Bank, Washington. 2. Erumban, A. A., and Das, D. K. (2016), ‘Information and Communication Technology and Economic Growth in India’, Telecommunications Policy, 40 (5), 412-431. 3. OECD (2020), ‘A Roadmap Toward a Common Framework for Measuring the Digital Economy’, Report for the G20 Digital Economy Task Force. 4. Van Ark, B. (2016), ‘The Productivity Paradox of the New Digital Economy’, International Productivity Monitor, 31, 3-18. | 5. Conclusion II.2.22 The domestic economy exhibited robust growth in 2023-24, underpinned by strong investment activity, amidst subdued external demand. Manufacturing and services sectors were the key drivers on the supply side while agricultural activity slowed down due to uneven and deficient monsoon rainfall. The growth outlook remains buoyant, given the government’s sustained focus on capital expenditure while maintaining fiscal consolidation. Strong corporate balance sheets, rising capacity utilisation, double digit credit growth, healthy financial sector, and the ongoing disinflation are likely to be other growth levers. Lingering geopolitical tensions, geoeconomic fragmentation and adverse climate shocks impart downside risks to the outlook. II.3 PRICE SITUATION II.3.1 In India, headline inflation23 moderated during 2023-24 into the tolerance band, in response to monetary policy tightening, supply management measures and easing of input cost pressures (see Chapter III). Food inflation turned volatile due to recurrent supply shocks. On the other hand, core inflation eased on a sustained basis, recording the lowest print in March 2024 in the current CPI series24. Fuel and light group remained in deflation since September 2023, driven down by the softening of global energy prices (Chart II.3.1). II.3.2 Although average headline inflation moderated in 2023-24, its volatility, measured by its standard deviation, rose as extreme weather events resulted in intermittent food price spikes (Table II.3.1). II.3.3 Against this backdrop, sub-section 2 assesses developments in global inflation and commodity prices. Sub-section 3 presents an analysis of inflation dynamics in India, with a deep dive into its primary constituents in sub-section 4. Other indicators of prices and costs are analysed in sub-section 5, followed by concluding observations. 
| Table II.3.1: CPI Headline Inflation – Key Summary Statistics | | (Per cent) | | | 2013-14 | 2014-15 | 2015-16 | 2016-17 | 2017-18 | 2018-19 | 2019-20 | 2020-21 | 2021-22 | 2022-23 | 2023-24 | | 1 | 2 | 3 | 4 | 5 | 6 | 7 | 8 | 9 | 10 | 11 | 12 | | Mean | 9.4 | 5.8 | 4.9 | 4.5 | 3.6 | 3.4 | 4.8 | 6.2 | 5.5 | 6.7 | 5.4 | | Standard Deviation | 1.3 | 1.5 | 0.7 | 1.0 | 1.2 | 1.1 | 1.8 | 1.1 | 0.9 | 0.7 | 0.9 | | Skewness | -0.2 | -0.1 | -0.9 | 0.2 | -0.2 | 0.1 | 0.5 | -0.7 | -0.1 | -0.1 | 1.5 | | Kurtosis | -0.5 | -1.0 | -0.1 | -1.6 | -1.0 | -1.5 | -1.4 | -0.7 | -1.0 | -0.6 | 1.6 | | Median | 9.5 | 5.5 | 5.0 | 4.3 | 3.4 | 3.5 | 4.3 | 6.5 | 5.6 | 6.7 | 5.1 | | Maximum | 11.5 | 7.9 | 5.7 | 6.1 | 5.2 | 4.9 | 7.6 | 7.6 | 7.0 | 7.8 | 7.4 | | Minimum | 7.3 | 3.3 | 3.7 | 3.2 | 1.5 | 2.0 | 3.0 | 4.1 | 4.2 | 5.7 | 4.3 | Note: Skewness and Kurtosis are unit-free. Annual inflation is the average of the monthly inflation rates during the year and therefore, may vary from the annual inflation calculated from the average index for the year.
Source: NSO and RBI staff estimates. | 2. Global Inflation Developments II.3.4 Globally, inflation eased in 2023 from its multi-decadal peak in 2022, but it ruled above targets and pre-pandemic levels across major economies. Aggressive and synchronised monetary policy tightening, normalisation of supply chains and softening of global energy and food prices helped to rein in inflationary pressures. According to the International Monetary Fund (IMF), global inflation fell to 6.8 per cent in 2023 from 8.7 per cent in 2022, although it remained above the average of 3.5 per cent during 2010-1925. II.3.5 Amongst major commodities, energy prices decreased by around 28 per cent during 2023-24, according to the World Bank energy price index (Chart II.3.2). While continuation of production cuts by OPEC+ countries exerted upside pressures on crude oil prices, they were more than offset by subdued global demand and increase in non-OPEC+ supply. Metal prices declined by around 8 per cent in 2023-24 on weak Chinese and European demand. International food prices fell by 10 per cent due to improved supplies from robust harvest. Rice and sugar prices, however, hardened on supply-demand gaps. The increasing incidence of extreme climate events and lingering global geopolitical uncertainties pose risks to the inflation outlook. 3. Inflation in India II.3.6 India’s headline inflation rose from an intra-year low of 4.3 per cent in May 2023 to a peak of 7.4 per cent in July 2023. It eased to 4.9 per cent in October but firmed up to 5.7 per cent in December and then softened to 4.9 per cent in March 2024, reflecting the volatility in food prices (Chart II.3.3). Supply side measures including targeted interventions, stock limits, and active trade policy initiatives in respect of inflation sensitive agricultural items helped in mitigating price pressures. Core inflation was tempered by monetary tightening, mending of global supply chains and corrections in input cost pressures. The impact of shocks on core inflation has been reduced significantly in the post-flexible inflation targeting (FIT) period, indicating the anchoring of inflation expectations (Box II.3.1). 
Box II.3.1
Dynamics of Inflation Surges in India Seasonally adjusted quarterly headline and core inflation paths are estimated as a function of lagged inflation and lagged surge event dummies in a regression-based event study framework to study the dynamics of inflation in surge episodes (Blanco et. al., 2022). Surge events are defined by changes in inflation above the threshold level of the 90th percentile of the long run inflation distribution or those in the right tail of the distribution (Chart 1). The event period window selection is based on the average time (number of quarters) taken for inflation surges to reach their pre-surge levels. The dynamics of the inflation path is estimated as: 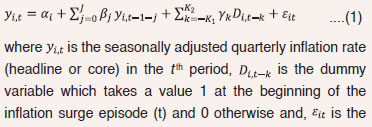
 Cross-country evidence suggests that inflation surges are persistent, but with the duration of disinflation exceeding the phase of inflation increase (Blanco et.al., 2022; Ari et.al., 2023). In India, core inflation takes one year, on an average, to return to its pre-surge level in the absence of any overlapping shock; however, the convergence of headline inflation to its pre-shock level is obstructed by volatility in food inflation (Charts 2a and 2b). Disaggregated analysis of the pre-FIT (1995-2016) and post-FIT (2017-2023) periods indicates a change in the pattern of convergence, particularly for core inflation. While the timeline for movement back to equilibrium remains similar due to structural factors and policy transmission lags, the jump in core inflation is notably lower than in the pre-FIT period. This points to anchored inflation expectations. Thus, credible and timely monetary policy actions can contain the impact of shocks on inflation both in terms of size and duration. 
 References: 1. Ari A., C. M-Granados, V Mylonas, L Ratnovski, and W Zhao (2023), ‘One Hundred Inflation Shocks: Seven Stylized Facts’, IMF Working Paper, WP/23/190. 2. Blanco A., P. Ottonello and T. Ranosova (2022), ‘The Dynamics of Large Inflation Surges’, NBER Working Paper Series, No. 30555. | II.3.7 Inflation in food and beverages remained the major driver of headline inflation, with its contribution to headline inflation increasing to 60.3 per cent during 2023-24 from 46 per cent a year ago. Uneven spatial and temporal distribution of rainfall and extreme weather events led to crop damages and production shortfalls in key agricultural commodities. Frequent shocks in vegetables prices, combined with lower stocks of wheat and decline in production of pulses and spices, kept food inflation at an elevated level. The impact of supply shocks on state-level inflation could provide an assessment of their spillovers across state borders (Box II.3.2). Box II.3.2
India’s Spatial Connectivity and Sub-national Inflation Dynamics: Connecting the Dots Better connectivity among states eases transportation and trade costs by reducing the mark-up. The spatial transmission of supply shocks and impact on CPI food inflation is analysed through a heterogeneous spatial auto regression (SAR) model of the following form: where πit is inflation for state i in year t. The supply shock is proxied by state level absolute rainfall deviations from normal26 and wij is the row-normalised spatial linkages measured by the number of national highways connecting states i and j (wii = 0)27. The model is estimated as a system of equations with heterogeneous coefficients (Aquaro et. al., 2021) using annual CPI inflation data across 27 states during 2013-24. It is observed that there is positive and significant spatial autocorrelation among states, suggesting transmission of supply shocks through transport linkages. Higher rainfall deviations increase inflation pressures on food inflation (Table 1). | Table 1: Effect of Supply Shock on Spatial Variations in Inflation28 | | Model → | (1) | (2) | (3) | (4) | | | Full Sample (2013-24) | Pre-COVID (2013-19) | | 1 | 2 | 3 | 4 | 5 | | Spatial Autocorrelation | 0.715*** | 0.725*** | 0.701*** | 0.710*** | | | (0.072) | (0.077) | (0.059) | (0.059) | | Absolute Rainfall Deviation | 0.021*** | 0.020*** | 0.029*** | 0.029*** | | | (0.010) | (0.010) | (0.011) | (0.011) | *** indicates significance at 1 per cent level.
Note: Figures in parentheses are standard errors estimated using asymptotic derivation suggested by Aquaro et. al., (2021). The coefficients represent average effect, average taken over states.
Source: RBI staff estimates. | Using the spatial framework, the total effect of the rainfall shocks is decomposed into direct and indirect effect (Pace and LeSage, 2009). The direct effect captures the state-wise effect on inflation due to state-level rainfall deviation, whereas the indirect effect captures the second-round effect due to the transmission of rainfall shocks to other states through the transportation network. The findings suggest that the direct effect of rainfall deviation is positive and significant on food inflation, on an average. Indirect effect accounts for almost 75 per cent of the total effect suggesting strong transport linkages among the states (Table 2). Spatio-temporal variations in indirect contributions are plotted in a heatmap (Chart 1). The contribution of indirect effect29 in total food inflation is high across majority of states, underlining the role of road infrastructure in supply management. The findings indicate that supply shocks which generate food price pressures can get amplified in distant states with poor connectivity. Trade cost pressures are lower for states with better connectivity. | Table 2: Direct and Indirect Effect of Rainfall Shock on Inflation | | Model → | (1) | (2) | (3) | (4) | | | Full Sample (2013-24) | Pre-COVID (2013-19) | | 1 | 2 | 3 | 4 | 5 | | Direct Effect | 0.045*** | 0.047*** | 0.041*** | 0.044*** | | | (0.010) | (0.010) | (0.012) | (0.012) | | Indirect Effect | 0.128*** | 0.131*** | 0.121*** | 0.122*** | | | (0.024) | (0.025) | (0.023) | (0.023) | | Share of Direct Effect in Total Effect (Per cent) | 27.01 | 27.50 | 25.31 | 26.51 | *** indicates significance at 1 per cent level.
Note: Figures in parentheses are standard errors estimated using bootstrap.
Source: RBI staff estimates. |
References: 1. Aquaro, M., Natalia B., and Hashem P. M. (2021), ‘Estimation and Inference for Spatial Models with Heterogeneous Coefficients: An Application to U.S. House Prices’, Journal of Applied Econometrics, 36 (1), 18–44. 2. Armington, P. (1969), ‘A Theory of Demand for Products Distinguished by Place of Production’, International Monetary Fund Staff Papers, Washington DC, 159–78. 3. Deardorff, A. (2004), ‘Local Comparative Advantage: Trade Costs and The Pattern of Trade’, University of Michigan Research Seminar in International Economics Discussion Paper, University of Michigan, Ann Arbor. 4. LeSage, J. and Robert. K. P. (2009), ‘Introduction to Spatial Econometrics’, CRC Press, New York, January. | II.3.8 Inflation in the fuel and light group averaged 1.2 per cent during 2023-24, significantly lower than 10.3 per cent a year ago. Year-on-year prices in this group moved into deflation from September 2023, following reduction in prices of liquefied petroleum gas (LPG) and kerosene on the back of correction in global energy prices. Electricity price inflation, however, averaged higher at 9.7 per cent due to tariff hikes in some states. II.3.9 During 2023-24, core inflation moderated to 4.3 per cent from 6.1 per cent a year ago, as a broad-based disinflation gathered momentum during September-March. This easing was driven by prices of household goods, clothing and footwear, and personal care and effects (excluding gold and silver) on the goods side and house rent, recreation and amusement, and transport fares on the services side. Overall, headline inflation fell to 5.4 per cent during 2023-24, 129 basis points (bps) lower than a year ago (Appendix Table 4). 4. Constituents of CPI Inflation II.3.10 During 2023-24, CPI headline inflation was primarily driven by prices of food and beverages, followed by health and education, housing, and clothing and footwear (Chart II.3.4). Food II.3.11 Inflation in food and beverages (weight: 45.9 per cent in CPI) hovered in a wide range of 3.3 per cent to 10.6 per cent in 2023-24. Persistent price pressures in cereals, spices, pulses, and animal proteins exacerbated by spikes in prices of vegetables, primarily tomato and onion, were the key drivers of food inflation (Chart II.3.5). Oils and fats, however, remained in deflation throughout the year on the back of softer global edible oil prices. II.3.12 Food and beverages inflation averaged 7.0 per cent in 2023-24, higher than 6.7 per cent a year ago. Within the food group, inflation increased in six sub-groups while it moderated for the remaining six sub-groups (Chart II.3.6). Pulses and spices (combined weight: 10.6 per cent in CPI-Food and beverages) recorded double digit inflation of 15.2 per cent and 18.9 per cent, respectively. Food inflation peaked at 10.6 per cent in July 2023, the highest since January 2020.  II.3.13 After remaining in deflation during November 2022-June 2023, the prices of vegetables (weight of 13.2 per cent in the food and beverages group) increased by 37.4 per cent (y-o-y) in July 2023 as crop damages and supply disruptions caused by heavy rainfall and floods in the northern parts of the country led to sharp increase in prices of tomatoes, onions and potatoes (TOP) as well as non-TOP vegetables (Charts II.3.7a and II.3.7b). A gradual normalisation of supply conditions and a pick-up in fresh crop arrivals softened vegetables inflation to 2.8 per cent in October 2023. A spike in onion and tomato prices in November 2023 along with subsequent hardening in prices of non-TOP vegetables and adverse base effects led to a resurgence in vegetables inflation to 28.3 per cent in March 2024. II.3.14 Onion prices declined on a month-on-month (m-o-m) basis during April-May 2023 on account of robust market arrivals from the fresh rabi harvest. However, onion prices picked up in June 2023 and recorded double digit increases until November due to lower production [a decline of 15.7 per cent in 2023-24, as per 1st advance estimates (AE) over 2022-23 final estimates (FE)]. Seasonal uptick in onion prices was exacerbated by dry weather conditions in August which resulted in crop damage. Delayed harvest of kharif onions amidst lower availability of rabi stocks exerted upward pressure on prices, leading to y-o-y inflation of 86.3 per cent in November 2023. To contain price pressures, the central government resorted to multi-pronged measures: enhancement of the buffer stock of onions to 7 lakh metric tonnes (LMT) in 2023-24 from 2.5 LMT in 2022-23; disposal of stock through open market sales; retail sale of subsidised onions through various channels; imposition of 40 per cent export duty and minimum export price (MEP) of US$ 800 per metric tonne from October 29, 2023; and a prohibition on onion exports from December 8, 202330. On the back of these measures and fresh crop arrivals, onion prices declined cumulatively by almost 58 per cent during December 2023-February 2024.  II.3.15 Tomato prices exhibited significant volatility in 2023-24. Inflation in this item surged to 202.1 per cent in July, the highest in the current CPI series, due to crop damages and supply disruptions on account of excess rains and floods, especially in northern India, and pest attacks in Karnataka. This was followed by significant corrections during September-October on fresh crop arrivals. Tomato prices rose again in November 2023 owing to excess/unseasonal rainfall in key producing states. Overall, decline in supply on account of lower production [(-) 1.3 per cent in 2022-23] contributed to price pressures. Tomato prices corrected in August-October 2023 and thereafter in December 2023-January 2024 on the back of higher production (1.9 per cent in 2023-24 1st AE over 2022-23 FE). On the other hand, potato prices remained in deflation from February 2023 to January 2024 on the back of higher production (an increase of 7.1 per cent in 2022-23). Potato inflation, however, turned positive in February 2024 and touched 41 per cent in March 2024 due to lower production in 2023-24 [(-) 1.9 per cent over 2022-23] and adverse base effects. Vegetables such as ginger, garlic, cauliflower, cabbage, brinjal and green chillies also witnessed high price pressures in July due to rain-induced supply disruptions. The unusually high cumulative price momentum in non-TOP vegetables contributed substantially to the spike in vegetables inflation during July-August 2023. With fresh crop arrivals, the prices of these vegetables corrected in subsequent months, albeit lower than usual due to higher minimum temperatures in November-December 2023. II.3.16 Inflation in prices of cereals and products (weight of 21 per cent in the CPI-Food and beverages) remained in double digits during April-November 2023, driven up by rice and wheat prices. Wheat prices surged on the back of lower production due to higher temperature in February 2023, unseasonal rains in March 2023 and low stock levels. Rice prices have recorded double digit inflation since October 2022 on account of lower kharif production during 2022-23 as well as lower arrivals in 2023-24. In order to improve domestic supply and to contain price pressures in cereals, the government undertook various measures including allocation of 101.5 LMT of wheat and 25 LMT of rice for sale under open market sale scheme (OMSS) in the kharif marketing season 2023-24; imposition of export duty on parboiled rice; restriction on exports of non-basmati rice; stock limits on wheat; launch of retail sale of ‘Bharat’ brand atta and rice at subsidised prices to increase supplies in the market at affordable rates; and restriction on diversion of subsidised rice to distilleries for ethanol production. Cereals inflation moderated to 8.4 per cent in March 2024, with wheat/atta inflation at 4.7 per cent. Rice inflation, however, remained elevated at 12.7 per cent. The government extended the Pradhan Mantri Garib Kalyan Anna Yojana (PMGKAY) for five years starting January 2024.  II.3.17 Animal protein-rich items such as eggs, meat and fish (weight of 8.8 per cent in CPI-food and beverages) witnessed uptick in prices during May-June 2023 due to heat conditions which impacted egg and poultry production in major producing states in southern India (Chart II.3.8a). Price pressures moderated subsequently due to fall in demand on account of Shravana period during July-August 2023. However, price pressures re-emerged, especially in the case of eggs from September 2023, reflecting seasonal demand and higher exports. Milk and products price inflation moderated during 2023-24 on favourable base effects, no significant price hikes by major milk co-operatives, and reduced peak demand for milk and products (such as ice-cream, curd and buttermilk) due to the delayed onset of summer following unseasonal rains in the early part of 2023 (March-May). Moreover, easing global dairy prices discouraged exports, thereby enabling higher domestic supply of milk fats like butter and ghee. Feed and fodder costs moderated through Q1:2023-24 on better domestic availability. Furthermore, as the dairy sector recovered from the lumpy skin disease outbreak of 2022 and production improved, there was a softening in milk price momentum (Chart II.3.8b). II.3.18 Prices of oils and fats (weight of 7.8 per cent in CPI-food and beverages) were in double digit deflation throughout 2023-24, averaging at (-) 14.8 per cent, due to higher domestic production of oilseeds during 2022-23 (by 8.9 per cent), fall in international prices and lower import duties on major edible oils (Chart II.3.9). The lower kharif production of oilseeds in 2023-24 [(-) 12.7 per cent as per 2023-24 2nd AE over 2022-23 FE] led to pressure in some oils (viz., mustard and groundnut oil). The government reduced the basic import duty on refined soyabean and sunflower oil from 17.5 per cent to 12.5 per cent on June 15, 2023. Lower import duty structure on crude palm, sunflower and soyabean was extended till March 2025. Ghee and butter price inflation moderated, reflecting pass-through of easing milk price momentum and favourable base effect.  II.3.19 Inflation in prices of pulses (weight of 5.2 per cent in CPI-food and beverages) increased steadily during the year, averaging 15.2 per cent in 2023-24 (Chart II.3.10). Lower production of pulses in 2022-23 as well as in the kharif 2023-24 season (viz., urad and moong) [(-) 6.6 per cent as per 2023-24 second advance estimate (SAE) over 2022-23 FE] exerted upward price pressures. In order to improve domestic availability and contain prices, the government extended imports of tur and urad under the ‘free category’ till March 31, 2025; extended free imports of yellow peas, a close substitute of gram without minimum import price (MIP) restriction till October 2024; imposed stock limits on tur and urad till December 31, 2023; removed procurement ceilings of 40 per cent for tur, urad and masoor under the price support scheme (PSS) for 2023-24 to encourage higher sowing acreage; released tur from the national buffer in a calibrated manner; and engaged in sale of subsidised chana dal under the brand name ‘Bharat Dal’.  II.3.20 Inflation in prices of fruits (weight of 6.3 per cent in CPI-food and beverages) remained subdued during April-June 2023, supported by higher production (2.5 per cent as per 2022-23 horticulture FE over 2021-22 FE). However, there was an uptick in inflation from July 2023 as floods in Himachal Pradesh damaged apple plantations and led to supply disruptions. Banana price inflation remained moderate during June-September on the back of robust production but hardened thereafter to 16.6 per cent in December 2023 due to supply constraints in the growing belt as well as higher festival demand. Inflation in fruits softened from January 2024 on the back of higher production in 2023-24 (1.7 per cent over 2022-23). II.3.21 Among other food items, double digit inflation persisted in spices (averaging 18.9 per cent during 2023-24), primarily driven by jeera (cumin) - which recorded over 100 per cent inflation during July-December 2023 due to unfavourable weather conditions and stagnant production. The monthly momentum in jeera prices fell sharply in September 2023 and turned negative from December 2023 onwards, reflecting higher production in 2023-24 (49 per cent over 2022-23). Inflation in dry chillies moderated consistently during the year from 27.5 per cent in April 2023 to 3.7 per cent in March 2024. Fuel II.3.22 The contribution of the fuel group (weight of 6.8 per cent in CPI) to headline inflation decreased to 1.6 per cent in 2023-24 from 10.5 per cent a year ago. Fuel inflation decreased from 10.8 per cent in January 2023 to (-) 3.4 per cent in March 2024 driven by the moderation in kerosene and LPG price inflation (Chart II.3.11). The cut in LPG prices by ₹200 per domestic cylinder on August 30, 2023 aided the deflation observed since September 2023 (Chart II.3.12). Another LPG price cut of ₹100 per domestic cylinder was announced on March 8, 2024. Core Inflation (Inflation excluding Food and Fuel) II.3.23 Inflation excluding the volatile food and fuel items, i.e., core inflation, moderated to 4.3 per cent in 2023-24 from 6.1 per cent a year ago, encompassing softening in both goods and services inflation (Chart II.3.13). 
 II.3.24 Among the major constituents of core CPI, inflation in clothing and footwear eased, reflecting sharp correction in both domestic and international cotton prices and muted export demand for textiles and wearing apparel. Household goods and services inflation witnessed a gradual easing to 2.7 per cent in March 2024. Reflecting largely unchanged domestic petrol and diesel prices since August 2022 (Chart II.3.14) and moderation in transport fares, inflation in transport and communication prices ebbed to 1.9 per cent in 2023-24 from 5.9 per cent a year ago. After ruling above 6 per cent during December 2022-August 2023, inflation in the health sub-group eased gradually as pandemic-induced healthcare services demand subsided and medical supplies normalised. Around 75 per cent of the core CPI items registered less than 4 per cent inflation in March 2024, indicating a broad based softening (Chart II.3.15). II.3.25 Housing inflation fell from 4.9 per cent in April 2023 to 2.7 per cent in March 2024. Net of housing, inflation excluding food and fuel averaged 4.4 per cent in 2023-24, significantly lower than 6.6 per cent a year ago. II.3.26 Inflation in personal care and effects increased marginally to 7.8 per cent in 2023-24 from 7.6 per cent a year ago, primarily driven up by higher gold prices on the back of international price movements caused by war-induced safe-haven demand. 5. Other Indicators of Inflation II.3.27 From a sectoral perspective, inflation measured by the CPI for industrial workers (CPI-IW) averaged 5.3 per cent during April-January 2023-24 as compared with 6.1 per cent in the corresponding period a year ago. Inflation based on the CPI for agricultural labourers (CPI-AL) and rural labourers (CPI-RL) averaged higher at 7.0 per cent and 6.9 per cent, respectively, during April-February 2023-24, primarily driven by elevated food inflation. II.3.28 The wholesale price index (WPI) remained in deflation during April-October 2023-24 before turning marginally positive thereafter, led by sharp increase in vegetables prices, especially onion and tomato, in November and adverse base effects in December. The movement in WPI inflation during the year mirrored the correction in global commodity prices, particularly in energy, food, and metals, owing to normalisation of supply and slowdown in global demand. Overall, WPI inflation averaged (-) 0.7 per cent during 2023-24 (as compared with 9.4 per cent a year ago), much below average CPI headline inflation of 5.4 per cent. II.3.29 Low WPI inflation was driven by all the three major groups – primary articles (weight of 22.6 per cent in WPI basket); fuel and power (13.2 per cent); and manufactured products (64.2 per cent). Primary articles WPI inflation moderated to 3.5 per cent during 2023-24, mainly reflecting deflation in non-food articles and crude petroleum and natural gas, in line with easing global prices even as food inflation fluctuated due to uneven and deficient rainfall during the year. In contrast, fuel and power recorded deflation during 2023-24 averaging (-) 4.5 per cent (against 28.1 per cent inflation a year ago) in line with the easing of global energy prices. The broad-based moderation in global commodity prices kept manufactured products prices in deflation during 2023-24 averaging (-) 1.7 per cent (as against 5.6 per cent inflation a year ago). This was largely on account of manufactured food products, basic metals, chemicals and textiles. Reflecting the moderation in both WPI and CPI inflation, the gross domestic product (GDP) deflator inflation moderated to 1.1 per cent in 2023-24 (April-December) from 8.2 per cent in the corresponding period of 2022-23. II.3.30 Minimum support prices (MSPs) in 2023-24 were increased in the range of 5.3-10.4 per cent for the kharif crops and 2.0-7.1 per cent for the rabi crops. Moong witnessed the maximum MSP increase among kharif crops, while the increase was the highest for lentils (masur) and wheat among rabi crops. II.3.31 Nominal rural wage growth averaged 6.0 per cent in April-February 2023-24 as compared with 5.4 per cent in the corresponding period of the previous year, with both agricultural and non-agricultural wage growth near 6 per cent. The pace of growth, however, has moderated since October, primarily driven by deceleration in ploughing, horticulture and packaging within the category of agricultural labourers, and beedi makers and bamboo/cane basket weavers within the category of non-agricultural labourers. 6. Conclusion II.3.32 In sum, headline CPI inflation moderated in 2023-24 despite overlapping food price shocks. The softening was the outcome of the sustained anti-inflationary monetary policy stance, proactive supply management measures by the government and correction in global commodity prices. Core inflation exhibited a broad-based disinflation since June 2023 and moved below 4 per cent by end-2023. While headline inflation dipped into the tolerance band in 2023-24 (barring July-August), it hovered above the inflation target. Lingering geopolitical uncertainties, renewed supply chain pressures due to geopolitical developments in the Middle East, lower reservoir levels, and fall in production of major crops pose upside risks to headline inflation going forward. II.4 MONEY AND CREDIT II.4.1 Monetary and credit conditions evolved in line with the monetary policy stance during the year, supporting domestic economic activity. Important factors impacting their evolution during 2023-24 were the withdrawal of ₹2000 banknotes (May 2023), the merger of a non-bank with a bank (July 2023) and the temporary imposition of the incremental cash reserve ratio (I-CRR)31 [August 2023]. The expansion in reserve money and currency in circulation moderated due to the return of a predominant part of ₹2000 banknotes to the banking system as deposits. The return of these banknotes, along with an increase in term deposit rates, contributed to an acceleration in aggregate deposits and broad money (M3). Bank credit exhibited sustained double digit growth in 2023-24. Banks mobilised additional resources through certificates of deposit (CDs) to bridge the credit-deposit gap. II.4.2 Against this backdrop, sub-section 2 delves into reserve money dynamics and the shifts in the Reserve Bank’s balance sheet. Sub-sections 3 and 4 examine developments in money supply and bank credit, respectively, followed by concluding observations. 2. Reserve Money32 II.4.3 Reserve money (RM) depicts the stock of monetary liabilities in the central bank’s balance sheet (Chart II.4.1). Risk buffers and revaluation accounts [forming the bulk of net non-monetary liabilities (NNML)] along with surplus liquidity placed by banks with the Reserve Bank under reverse repos/standing deposit facility (SDF) are the other major components of the balance sheet. II.4.4 The Reserve Bank’s balance sheet size increased to 24.1 per cent of GDP at end-March 2024 from 23.5 per cent at end-March 2023. The balance sheet has normalised to its pre-pandemic level (Chart II.4.2). II.4.5 The growth in RM33 decelerated to 6.7 per cent in 2023-24 from 9.7 per cent a year ago (7.4 per cent when adjusted for the first-round impact of change in CRR34), below its decennial average35 of 12.9 per cent (2013-14 to 2023-24). This reflected largely the impact of withdrawal of ₹2000 banknotes36 (Chart II.4.3a and Appendix Table 4). RM growth registered a transient spurt in August 2023 on account of the temporary imposition of I-CRR during August-October 2023 (Chart II.4.3b). The growth in currency in circulation (CiC) - the major constituent of RM with a share of 75.1 per cent – decelerated to 4.1 per cent during 2023-24 from 7.8 per cent a year ago, due to the withdrawal of ₹2000 banknotes (Charts II.4.3a and II.4.3c). II.4.6 The currency-GDP ratio has moderated with the ebbing of pandemic uncertainty and the increasing usage of digital payments37. India’s central bank digital currency (CBDC) is gradually gaining traction in the retail segment (Chart II.4.4).
II.4.7 Bankers’ deposits with the Reserve Bank (22.9 per cent share in RM), i.e., balances maintained by banks to meet their CRR requirements, increased by 15.4 per cent in 2023-24, in tandem with the expansion in bank deposits, as compared with 15.9 per cent in the previous year (Chart II.4.3a). II.4.8 On the sources side (assets), RM comprises net domestic assets (NDA)38 and net foreign assets (NFA)39 of the Reserve Bank. During 2023-24, the expansion in RM was driven mainly by NFA, with net purchases from authorised dealers at ₹3.4 lakh crore as against net sales of ₹2.2 lakh crore in the previous year. NDA declined during the year as the increase in government cash balances pulled down the Reserve Bank’s net claims on the government, more than offsetting the expansion in net credit to banks and the commercial sector (Chart II.4.5). 3. Money Supply40 II.4.9 Money supply in terms of broad money (M3) consists of currency with the public (CwP) and aggregate deposits (AD) of banks on the components side (liabilities). M3 recorded a growth of 11.2 per cent as on March 22, 2024 (9.0 per cent a year ago) driven mainly by time deposits, which benefitted, inter alia, from higher deposit rates with the transmission of policy rate increases (Chart II.4.6). The sustained demand for bank credit also exerted pressure on banks to mobilise more deposits. The expansion in bank deposits outpaced that in CwP for the second successive year41. The ratio of M3 to GDP has reverted to its pre-pandemic levels (Chart II.4.7).  II.4.10 On the sources side (assets), the expansion in M3 was mainly driven by bank credit to the commercial sector, which grew by 15.6 per cent in 2023-24 (14.4 per cent a year ago). The pace of expansion in net bank credit to the government decelerated to 5.7 per cent in 2023-24 from 11.5 per cent a year ago. The excess holdings of statutory liquidity ratio (SLR) securities42 of SCBs were 10.4 per cent of net demand and time liabilities (NDTL) as on March 22, 2024 as compared with 11.0 per cent a year ago. The net foreign assets of the banking sector increased, mirroring the expansion in NFA in the Reserve Bank’s balance sheet during the year (Charts II.4.5 and II.4.8; Table II.4.1). Key Monetary Ratios II.4.11 The transactions velocity of money, i.e., nominal GDP divided by M3, has remained stable. As on March 22, 2024, the money multiplier (MM) was 5.4, marginally higher than its decennial average43 (2013-14 to 2023-24). The currency-deposit ratio fell to 15.9 per cent from 17.3 per cent in 2022-23, reflecting the withdrawal of ₹2000 banknotes and their return to the banking system as deposits. Adjusted for reverse repo - analytically akin to banks’ deposits with the central bank - the money multiplier turned out to be marginally lower at 5.3 as on March 22, 2024, with MM and adjusted MM converging (Chart II.4.9a). The reserve-deposit ratio remained stable due to no change in the CRR (Chart II.4.9b). 

| Table II.4.1: Monetary Aggregates | | Item | Outstanding as on March 22, 2024
(₹ lakh crore) | Growth Rate (per cent) | | 2021-22 | 2022-23 | 2023-24
(as on March 22, 2024) | | 1 | 2 | 3 | 4 | 5 | | I. Reserve Money (RM) | 46.8 | 12.3 | 9.7 | 6.7 | | II. Money Supply (M3) | 248.3 | 8.7 | 9.0 | 11.2 | | III. Major Components of M3 | | | | | | III.1. Currency with the Public | 34.2 | 10.2 | 7.9 | 4.3 | | III.2. Aggregate Deposits | 213.3 | 8.4 | 9.1 | 12.3 | | IV. Major Sources of M3 | | | | | | IV.1. Net Bank Credit to Government | 73.1 | 8.2 | 11.5 | 5.7 | | IV.2. Bank Credit to Commercial Sector | 166.7 | 9.0 | 14.4 | 15.6 | | IV.3. Net Foreign Assets of the Banking Sector | 55.1 | 8.8 | -0.6 | 11.7 | | V. Money Multiplier (Ratio) | 5.4 | | | | Note: 1. Data are provisional.
2. The data for RM pertain to March 29, 2024.
Source: RBI. | 4. Credit II.4.12 Double digit growth in bank credit was sustained during 2023-24, led by demand from retail and services sectors. SCBs’ credit expanded by 16.3 per cent as on March 22, 2024 on top of 15.0 per cent a year ago (Chart II.4.10a). Bank group-wise, private sector banks (PVBs) continued to exhibit higher growth than public sector banks (PSBs). PVBs’ growth accelerated to 19.2 per cent (y-o-y) as on March 22, 2024 from 17.8 per cent a year ago and that of PSBs to 14.7 per cent from 13.8 per cent. This resulted in a fall in PSBs’ share in total credit, although they still have the larger share (Chart II.4.10b). 
 II.4.13 Sector-wise44, credit to agriculture expanded by 20.1 per cent in March 2024 (15.4 per cent a year ago). Credit growth to large industries was relatively muted (6.4 per cent), partly due to their improved profitability and cash flows. The increase in credit to micro, small and medium enterprises (MSMEs) was robust at 14.1 per cent, supported by the availability of collateral-free loans45. Services sector bank credit rose by 20.2 per cent in March 2024, driven by demand from non-banking financial companies (NBFCs) and trade. However, the pace of expansion of bank credit to NBFCs moderated following regulatory measures announced by the Reserve Bank on November 16, 2023 (see Chapter VI). Personal loan growth remained solid at 17.7 per cent in March 2024, supported by housing loans, which account for about half of the segment (Chart II.4.11 and Table II.4.2). II.4.14 SCBs’ deposit growth remained below that of bank credit during 2023-24 (Charts II.4.12a and II.4.12b). As a result, the incremental credit-deposit ratio rose above 100 per cent during June 2022-May 2023 (Chart II.4.12c). This ratio fell subsequently on the back of an acceleration in deposit growth, but the wedge between credit and deposit growth has persisted. Banks bridged this funding gap through issuances of CDs which increased to ₹8.3 lakh crore during 2023-24 from ₹6.4 lakh crore during the previous year (Chart II.4.12d). II.4.15 Tight financial conditions can have an adverse impact on firms’ debt servicing but deleveraging and the build-up of liquidity buffers can mitigate the impact of higher interest rates on corporate finances (Box II.4.1). | Table II.4.2: Sectoral Credit Growth - SCBs | | (Per cent, y-o-y) | | Sector | 2022-23# | 2023-24 | | Apr | May | Jun | Jul | Aug | Sep | Oct | Nov | Dec | Jan | Feb | Mar | | 1 | 2 | 3 | 4 | 5 | 6 | 7 | 8 | 9 | 10 | 11 | 12 | 13 | 14 | | Non-food Credit | 15.4 | 16.1 | 15.6 | 16.3 | 14.8 | 15.0 | 15.3 | 15.3 | 16.3 | 15.8 | 16.2 | 16.5 | 16.3 | | I. Agriculture & Allied Activities | 15.4 | 16.8 | 16.1 | 19.8 | 16.9 | 16.6 | 16.8 | 17.5 | 18.2 | 19.5 | 20.1 | 20.1 | 20.1 | | II. Industry (Micro & Small, Medium and Large) | 5.6 | 7.0 | 6.0 | 8.0 | 5.1 | 6.0 | 6.6 | 5.4 | 6.1 | 8.1 | 7.9 | 8.8 | 8.5 | | II.1. Micro & Small | 13.2 | 9.9 | 9.8 | 13.2 | 10.2 | 10.8 | 10.1 | 16.5 | 16.8 | 14.7 | 16.0 | 15.1 | 14.6 | | II.2. Medium | 12.0 | 11.2 | 10.4 | 13.4 | 9.1 | 9.3 | 9.1 | 12.0 | 11.9 | 8.6 | 9.9 | 12.7 | 13.1 | | II.3. Large | 3.1 | 5.8 | 4.6 | 6.1 | 3.4 | 4.5 | 5.4 | 2.2 | 3.0 | 6.4 | 5.7 | 6.8 | 6.4 | | II.3.1 Infrastructure | 0.4 | 3.2 | 1.9 | 1.7 | 0.3 | 1.0 | 1.9 | -0.1 | 1.1 | 4.8 | 5.0 | 5.8 | 5.4 | | II.3.2 Basic Metals & Metal Products | 19.6 | 19.9 | 17.1 | 22.0 | 18.1 | 18.5 | 18.6 | 17.0 | 17.9 | 15.0 | 11.5 | 11.9 | 11.4 | | II.3.3 Chemicals & Chemical Products | 10.0 | 4.9 | 4.5 | 6.5 | 0.2 | 1.7 | 2.9 | 0.4 | 5.8 | 9.5 | 8.9 | 11.8 | 11.5 | | II.3.4 Textiles | 1.9 | 4.3 | 5.2 | 8.7 | 8.4 | 11.8 | 12.6 | 12.7 | 14.9 | 13.5 | 13.6 | 13.6 | 10.9 | | II.3.5 All Engineering | 4.3 | 6.3 | 5.6 | 10.5 | 10.2 | 9.0 | 7.4 | 9.4 | 9.6 | 8.5 | 12.0 | 11.1 | 11.2 | | II.3.6 Food Processing | 5.1 | 2.4 | 3.7 | 5.9 | 4.1 | 8.0 | 8.0 | 10.6 | 11.4 | 10.3 | 13.5 | 13.7 | 14.9 | | III. Services | 19.6 | 21.4 | 21.1 | 26.5 | 19.4 | 20.6 | 21.2 | 19.9 | 21.7 | 19.4 | 20.5 | 20.9 | 20.2 | | III.1. Trade | 17.8 | 18.2 | 17.4 | 17.4 | 16.6 | 16.0 | 17.2 | 19.6 | 19.6 | 17.8 | 18.2 | 18.1 | 17.0 | | III.2. NBFCs | 29.9 | 28.7 | 27.3 | 34.7 | 19.4 | 20.9 | 21.4 | 17.9 | 18.5 | 14.7 | 15.2 | 14.4 | 15.0 | | IV. Personal Loans | 21.0 | 19.7 | 19.5 | 21.2 | 17.9 | 18.4 | 18.3 | 18.0 | 18.6 | 17.7 | 18.4 | 18.1 | 17.7 | | IV.1. Housing | 15.2 | 14.5 | 14.6 | 15.0 | 12.8 | 13.6 | 13.7 | 14.5 | 15.0 | 14.4 | 16.7 | 16.7 | 17.4 | | IV.2. Vehicle Loans | 24.8 | 23.1 | 22.3 | 23.0 | 21.2 | 20.7 | 21.3 | 20.0 | 20.8 | 20.5 | 16.3 | 17.5 | 17.3 | #: March 2023 over March 2022.
Note: Data are provisional and exclude the impact of merger of a non-bank with a bank.
Source: RBI. |

Box II.4.1
Monetary Policy and Non-Financial Firms in India Financial conditions driven by monetary policy cycles can impact funding costs, debt servicing capacity and the overall financial health of the non-financial corporate sector (Schularick et. al., 2021; Boissay et. al., 2023). Using CMIE Prowess quarterly data for 1,700 listed Indian non-financial firms covering the period Q1:2010 to Q4:2023, the impact of monetary policy changes on average funding costs is analysed in a local linear projection (LLP) model framework by regressing the interest expense ratio (IER) [gross interest expenses to total debt] and interest coverage ratio (ICR) [operating profits to gross interest expenses] on the policy repo rate, while controlling for GDP growth, inflation, and quarter- and firm-fixed effects. Policy rate changes have a lagged impact on debt servicing indicators and the peak impact on the firms occurs 7-9 quarters after the policy rate action (Chart 1). Corporate sector health - captured in indicators such as debt maturity structure and cash balances - could potentially amplify or soften the impact of policy rate actions on debt servicing costs. The Indian corporate sector has seen an elongation of the maturity structure of its debt along with a build-up of liquidity buffers. This imparts resilience to firms in the face of tighter financial conditions (Chart 2).
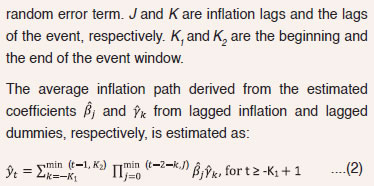
References: 1. Schularick, M., Steege, L. T., and Ward, F. (2021), ‘Leaning Against the Wind and Crisis Risk’, American Economic Review: Insights, 3 (2), 199-214. 2. Boissay, F., Collard, F., Manea, C., and Shapiro, A. (2023), ‘Monetary Tightening, Inflation Drivers and Financial Stress’, BIS Working Papers, No.1155, December. | 5. Conclusion II.4.16 The withdrawal of ₹2000 banknotes during the year and their return as bank deposits led to a deceleration in currency in circulation as well as reserve money while simultaneously contributing to an acceleration in deposit growth. Bank deposits were also boosted by attractive returns. Robust expansion in bank credit was sustained, led by services, agriculture, retail and MSME sectors. Upbeat consumer and business optimism and strengthening of banks’ balance sheets are expected to sustain credit growth necessitating a step-up in deposit mobilisation efforts to fund credit needs. II.5 FINANCIAL MARKETS II.5.1 Global financial markets remained volatile during 2023-24, reflecting uncertainty about the pace of disinflation in major economies, and the consequent monetary policy trajectory of major central banks as well as intensifying geopolitical tensions. Market exuberance on expectations that interest rates have peaked remained highly sensitive to forward guidance and incoming data, leading to large two-way movements. II.5.2 Domestic financial markets evolved in an orderly manner during 2023-24 drawing strength from resilient economic activity and strengthening macroeconomic fundamentals. Money market rates firmed up in H2:2023-24 as liquidity surplus ebbed due to a sustained increase in government cash balances. Issuances of certificates of deposit (CDs) rose amidst tight liquidity conditions and sustained credit demand. Sovereign bond yields remained range-bound during H1:2023-24 but softened thereafter on lower crude oil prices, fall in global bond yields, announcement of inclusion of Indian sovereign bonds in major global bond indices, easing of domestic inflation and lower-than-expected central government borrowing for 2024-25. Corporate bond yields generally tracked G-sec yields with a widening in spreads in the later part of the year. Equity markets registered strong gains on buoyant economic activity and corporate performance. The Indian rupee (INR) displayed stability on the back of improving domestic growth prospects and higher foreign portfolio investment (FPI) flows. II.5.3 Against this backdrop, money market developments are detailed in sub-section 2. Market segments for government securities (G-secs) and corporate bonds are discussed in sub-sections 3 and 4, respectively. Equity and foreign exchange market developments are covered in sub-sections 5 and 6, with concluding observations in sub-section 7. 2. Money Market II.5.4 Money market rates oscillated around the policy corridor during 2023-24 in tune with evolving liquidity conditions46. The weighted average call rate (WACR) was range bound in the first half of the year. It hovered close to the ceiling of the liquidity adjustment facility (LAF) corridor during October-January on tightening liquidity conditions resulting from a persistent build-up in government cash balances and the festival-related expansion in currency in circulation (CiC) [see Chapter III]. The WACR eased and moved around the policy repo rate during February-March. The average spread of the WACR relative to the policy rate was (+)13 basis points (bps) in 2023-24 as compared with (-)12 bps in 2022-23 (Chart II.5.1). II.5.5 Volatility in the call money segment, measured by coefficient of variation47 of the WACR, decreased sharply to 2.5 per cent in 2023-24 from 18.1 per cent in the previous year. Average daily volume in the money market48 declined by 6 per cent to ₹5.04 lakh crore during 2023-24 from ₹5.36 lakh crore in the previous year. Intra-year, average daily volumes initially fell to ₹4.9 lakh crore in Q2:2023-24 from ₹5.0 lakh crore in Q1, before recovering to ₹5.1 lakh crore in Q3 and further to ₹5.2 lakh crore in Q4 amidst tightening liquidity conditions49. Of the total money market volume, the share of triparty repo increased from 61 per cent in Q1:2023-24 to 67 per cent in Q4 with a concomitant fall in the share of market repo from 37 per cent to 31 per cent. The share of uncollateralised call money segment remained at around 2 per cent across quarters (Chart II.5.2).  II.5.6 The average daily spread of certificates of deposit (CD) and commercial paper (CP) rates over T-bill rates picked up during the year (Chart II.5.3). Regulatory measures on consumer credit and bank credit to non-banking financial companies (NBFCs) announced by the Reserve Bank on November 16, 2023 also contributed to hardening of CP rates for NBFCs during Q3:2023-24. II.5.7 In the primary market, fresh issuance of CDs rose from ₹1.5 lakh crore in Q1:2023-24 and ₹1.6 lakh crore in Q2 to ₹2.6 lakh crore in Q3 as banks sought to fund robust credit offtake. In Q4, the CD issuance was ₹3.0 lakh crore. New issuance of CPs in the primary market, however, fell from ₹3.8 lakh crore in Q1 to ₹3.3 lakh crore in Q2, and ₹2.9 lakh crore in Q3, amidst tight liquidity conditions and increased appetite for bank loans. However, in Q4, the CP issuance increased again to ₹3.8 lakh crore. 3. G-sec Market II.5.8 G-sec yields exhibited two-way movements in 2023-24. During Q1, yields traded lower in response to the monetary policy committee’s (MPC) decision to keep the policy repo rate unchanged, favourable inflation readings and softening crude oil prices. The 10-year generic G-sec yield closed the quarter at 7.12 per cent, a decline of 19 bps from its level on March 31, 2023 (Chart II.5.4). The yield curve flattened, with the spread between 5-year and 10-year rates narrowing to 4 bps from 14 bps as at end-March 2023. During Q2:2023-24, domestic G-sec yields increased in sync with hardening global yields, rising crude oil prices and an uptick in domestic inflation, offsetting optimism from the inclusion of Indian G-secs in major global bond indices50. Domestic 10-year and 5-year generic G-sec yields closed the quarter higher by 10 bps and 15 bps, respectively, over their levels in the previous quarter. The domestic G-sec yield curve flattened further and the spread between 5-year and 10-year G-sec yields inverted marginally to 1 basis point.  II.5.9 During Q3, 10-year generic G-sec yield moderated by 5 bps to 7.17 per cent, reflecting softening in global yields from their multi-year highs and a fall in Brent crude oil prices despite an uptick in domestic inflation. The yield curve steepened, with a sharper fall in yields for short-end tenor vis-à-vis at the long-end. The 5-year generic G-sec yield closed 10 bps lower at 7.13 per cent. Yields softened further during Q4:2023-24 amid lower-than-expected gross as well as net market borrowings in the Interim Union Budget 2024-25 and cooling of domestic inflation. The 10-year and 5-year generic G-sec yields eased by 11 bps and 7 bps, respectively, during the quarter, with both at 7.06 per cent at end-March 2024. 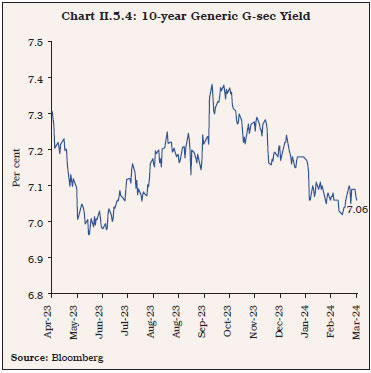 II.5.10 With the introduction of the fully accessible route (FAR)51 with effect from April 1, 2020, FPIs have three channels of investment - the general route with investment limits set under the medium-term framework (MTF); the voluntary retention route (VRR); and FAR (Table II.5.1). In aggregate, FPIs invested ₹1.3 lakh crore in debt instruments in 2023-24. | Table II.5.1: FPI Investment in Debt Instruments | | (Amount in ₹ lakh crore) | | Route/ Channel of Investment | March 31, 2022 | March 31, 2023 | March 31, 2024 | | Limit | Outstanding | Utilisation
(per cent of Limit) | Limit | Outstanding | Utilisation
(per cent of Limit) | Limit | Outstanding | Utilisation
(per cent of Limit) | | 1 | 2 | 3 | 4 | 5 | 6 | 7 | 8 | 9 | 10 | | (i) MTF^ | 10.8 | 2.2 | 20.5 | 11.7 | 1.8 | 15.4 | 11.7 | 1.9 | 16.0 | | (ii) VRR^$ | 1.5 | 1.5 | 100.0 | 2.5 | 2.1 | 82.0 | 2.5 | 1.8 | 70.1 | | (iii) FAR# | 17.6 | 0.5 | 2.6 | 28.0 | 0.8 | 2.8 | 39.0 | 1.7 | 4.5 | ^: Includes central government securities (G-secs), state government securities (SGSs) and corporate bonds.
$: The reduction in utilisation in 2023-24 is due to pooling back of expired limit under VRR with effect from July 2023.
#: Available only for the specified securities included under the route.
Source: CCIL and NSDL. | 4. Corporate Debt Market II.5.11 Corporate bond yields generally softened during 2023-24, mirroring G-sec yields. The monthly average yield on AAA-rated 3-year bonds of public sector undertakings (PSUs), financial institutions (FIs) and banks; NBFCs; and corporates softened by 12 bps, 14 bps and 12 bps, respectively, in March 2024 vis-à-vis March 2023 levels (Table II.5.2). The yields softened during H1 and generally hardened during H2 with a widening of spreads amid tightening of liquidity conditions and announcement of regulatory measures towards consumer credit and bank credit to NBFCs. II.5.12 The spread of AAA-rated 3-year bond yields over G-sec yields of corresponding maturity increased between March 2023 and March 2024. The average daily secondary market turnover in the corporate bond market increased marginally to ₹5,718 crore during 2023-24 from ₹5,549 crore in the previous year (Chart II.5.5). II.5.13 Primary issuances of listed corporate bonds rose in 2023-24, along with increase in mobilisation through overseas issuances (Table II.5.3). Private placements remained the preferred channel, accounting for 97.8 per cent of total resources mobilised through the bond market. Investments by FPIs in corporate bonds increased marginally during the year, pulling up the utilisation of the approved limits to 16.2 per cent at end-March 2024 from 15.5 per cent a year ago. | Table II.5.2: Corporate Bonds* - Yield and Spread | | Entity | Yields
(per cent) | Spread (bps)
[over corresponding risk-free rate] | | March 2023 | March 2024 | Change (bps) | March 2023 | March 2024 | Change (bps) | | 1 | 2 | 3 | 4 (=3-2) | 5 | 6 | 7 (=6-5) | | (i) PSUs, FIs and Banks | 7.75 | 7.63 | -12 | 36 | 44 | 8 | | (ii) NBFCs | 8.12 | 7.98 | -14 | 73 | 80 | 7 | | (iii) Corporates | 8.07 | 7.95 | -12 | 68 | 77 | 9 | *: AAA-rated 3-year bonds.
Note: Yields and spreads are computed as monthly averages.
Source: FIMMDA. |
5. Equity Market II.5.14 In 2023-24, the Indian equity market remained ebullient on strong macroeconomic fundamentals and robust corporate profitability. The BSE Sensex touched a new high, gaining 24.9 per cent to close at 73,651 at end-March 2024, outperforming most global peers (Chart II.5.6). The exuberance of the secondary market translated into increased resource mobilisation in the primary market as well, with initial public offer (IPO) issuances maintaining a steady pace and resource mobilisation through preferential allotments and qualified institutional placements (QIPs) also growing at a fast clip. | Table II.5.3: Corporate Bond Issuances | | Item | Amount (₹ lakh crore) | Variation
(Col. 3 over Col. 2)
[per cent] | | 2022-23 | 2023-24 | | 1 | 2 | 3 | 4 | | (i) Primary Corporate Bond Issuances | 7.6 | 8.6 | 12.2 | | (ii) Outstanding Corporate Bonds (end-March) | 43.1 | 47.3 | 9.6 | | (iii) Investments by FPIs in Corporate Bonds (end-March) | 1.04 | 1.08 | 4.4 | | Source: SEBI and NSDL. | II.5.15 The markets began Q1:2023-24 on a positive note buoyed by solid corporate earnings for Q4:2022-23, upbeat domestic manufacturing performance, robust goods and services tax (GST) collections and soft inflation print for May 2023. In Q2, the markets continued the upward trajectory on positive domestic corporate results for Q1:2023-24 and favourable macroeconomic data, notwithstanding some drag from the sharp correction in China’s equities and rising concerns of a prolonged period of high global interest rates. II.5.16 In Q3, the markets initially registered losses in October 2023 due to FPI outflows and Middle East hostilities. Subsequently, domestic equity indices rebounded sharply, propelled by positive global cues from softer-than-anticipated inflation prints in the US and favourable domestic corporate earnings for Q2:2023-24. In Q4:2023-24, markets registered a marginal increase. The BSE Sensex crossed the 74,000 mark - a fresh peak - in March 2024 following strong GDP growth data for Q3:2023-24. II.5.17 The broader market indices outperformed the benchmark indices, with BSE MidCap and SmallCap indices increasing by 63.4 per cent and 60.1 per cent, respectively, during 2023-24 on increased risk appetite (Chart II.5.7a). FPIs made net purchases of ₹2.1 lakh crore in the domestic equity market during 2023-24 as against net sales of ₹0.4 lakh crore in the previous financial year (Chart II.5.7b). Mutual funds made net purchases of ₹2.0 lakh crore in 2023-24. Primary Market Resource Mobilisation II.5.18 In the primary segment of the equity market, resource mobilisation through preferential allotments and QIPs increased to ₹1.1 lakh crore during 2023-24 from ₹0.9 lakh crore during the previous year. Resource mobilisation through IPOs, follow-on public offers (FPOs) and rights issues increased to ₹0.8 lakh crore from ₹0.7 lakh crore (Chart II.5.8a and Appendix Table 5). The small and medium enterprises (SMEs) segment exhibited exuberance, with 197 SME IPO/FPO issues garnering ₹6,122 crore in 2023-24, as compared with 125 SME IPO/FPO issues mobilising ₹2,333 crore a year ago. II.5.19 Net resources mobilised by mutual funds increased by more than four times to ₹3.5 lakh crore during 2023-24 from ₹0.8 lakh crore during 2022-23. Net mobilisation by open-ended equity-oriented mutual fund schemes rose to ₹1.8 lakh crore from ₹1.5 lakh crore. Average monthly contributions to mutual funds through the systematic investment plan (SIP) route increased to ₹16,602 crore in 2023-24 from ₹12,998 crore in the previous year (Chart II.5.8b). Assets under management (AUM) of open-ended equity-oriented mutual funds rose by around 55 per cent to ₹23.5 lakh crore at end-March 2024. Net redemptions in open-ended debt-oriented schemes fell to ₹0.2 lakh crore during 2023-24 from ₹1.8 lakh crore in the previous year.
6. Foreign Exchange Market II.5.20 The Indian rupee (INR) exhibited resilience during 2023-24 on improving domestic macroeconomic fundamentals, narrowing current account deficit (CAD) and higher capital inflows. In Q1, the fall in crude oil prices and large FPI inflows imparted an appreciation bias to the INR while it faced downward pressures from a stronger US dollar and the impasse around the US debt-ceiling issue. On net, the INR appreciated by 0.2 per cent in Q1 to ₹82.04 per US dollar by end-June 2023. In Q2:2023-24, the INR came under pressure, tracking sharp gains in the US dollar and crude oil prices. The US dollar index (DXY) gained 3.2 per cent during the quarter, its best since September 2022, on expectations of further monetary tightening by the US Fed and its higher for longer interest rate stance. FPI outflows in September 2023 added to pressure on the INR while reports of Indian bonds’ inclusion in the JP Morgan’s Emerging Market Global Bond Index provided some support. Overall, the INR closed the quarter lower by 1.2 per cent at ₹83.04 per US dollar (Chart II.5.9). II.5.21 During Q3:2023-24, the increase in the US treasury yields to the highest levels since 2007, and a rise in crude oil prices amid eruption of geopolitical tensions in the Middle East and continued FPI outflows weighed on the INR. Thereafter, softening in US treasury yields and recovery in FPI inflows during November and December (US$ 13 billion) supported the INR. On balance, the INR closed the quarter marginally lower by 0.2 per cent at ₹83.21 per US dollar. In Q4:2023-24, stronger US dollar and higher crude oil prices exerted pressure on the INR while FPI inflows of around US$10 billion kept the INR supported. The INR closed the quarter lower by 0.2 per cent at ₹83.40 per US dollar. During 2023-24, forward premia trended lower, tracking narrowing of the interest rate differential between India and the US. 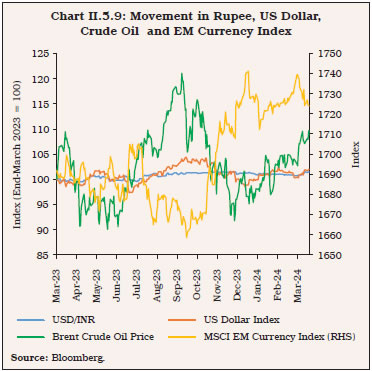 II.5.22 The 40-currency nominal effective exchange rate (NEER) depreciated (y-o-y) by 0.6 per cent, while real effective exchange rate (REER) appreciated (y-o-y) by 0.9 per cent during 2023-24. 7. Conclusion II.5.23 Indian financial markets displayed orderly movements during 2023-24, notwithstanding persisting adverse global spillovers from tightening global financial conditions, the uncertain trajectory of monetary policy of major systemic economies, volatile crude oil prices and lingering geopolitical tensions. Money market rates witnessed reduced volatility. Domestic G-sec yields were marked by two-way movements. The INR exhibited stability. The Indian equity market scaled new peaks and resource mobilisation in the primary markets gained momentum. II.6 GOVERNMENT FINANCES II.6.1 The general government finances consolidated during 2023-24 with its deficit (per cent of GDP) declining due to buoyant tax receipts and lower revenue spending. The quality of expenditure improved with the expansion in capital outlays. Against this backdrop, sub-sections 2 and 3 analyse central government finances in 2023-24 and 2024-25, respectively. Sub-sections 4 and 5 focus on state government finances during these years. General government finances are discussed in sub-section 6. The final section sets out concluding remarks. 2. Central Government Finances in 2023-24 II.6.2 The Union government contained its gross fiscal deficit (GFD) for 2023-24 at 5.9 per cent of GDP in the revised estimates (RE)52, in line with the budget estimates (Chart II.6.1). 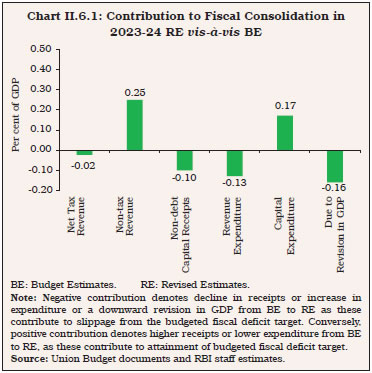 II.6.3 Revenue expenditure turned out to be higher than budgeted by 0.1 per cent of GDP (₹38,103 crore) in 2023-24 (RE), reflecting additional spending measures such as the subsidy of ₹200 per 14.2 kg LPG cylinder (announced in August 2023); additional subsidy of ₹100 per cylinder for beneficiaries of the Pradhan Mantri Ujjwala Yojana (PMUY) scheme (announced in October 2023); extension of the Pradhan Mantri Garib Kalyan Anna Yojana (PMGKAY) for five years; increased allocation of funds under the Mahatma Gandhi National Rural Employment Guarantee Act (MGNREGA) scheme; and higher outgoes under nutrient based fertiliser subsidy (NBS). Capital expenditure, on the other hand, fell short of the budget estimates (BE) by ₹50,715 crore due to lower than budgeted loans and advances (₹20,640 crore) and capital outlay53 (₹30,075 crore). Nevertheless, capex grew at a robust pace of 28.4 per cent in 2023-24 (RE) and rose to 3.2 per cent of GDP from 2.7 per cent in 2022-23. II.6.4 On the receipts side, gross tax revenues surpassed BE by ₹76,353 crore, driven up by higher income tax revenues which offset shortfalls in excise and customs collections. Income tax recorded a buoyancy of 2.5 in 2023-24 (RE) vis-à-vis 1.0 in BE. Net tax revenue, however, fell short of the BE by 0.02 per cent of GDP (₹6,713 crore) due to higher devolution to states. Non-tax revenue collections exceeded BE by 0.3 per cent of GDP (₹74,145 crore) on the back of higher dividend transfers by the Reserve Bank and public sector enterprises. Disinvestment receipts at ₹30,000 crore in 2023-24 (RE) were, however, below the BE (Chart II.6.2). 3. Central Government Finances in 2024-25 II.6.5 The interim Union Budget 2024-25 underscored the government’s commitment to fiscal consolidation while supporting growth impulses through higher capital expenditure. The GFD has been budgeted at 5.1 per cent of GDP for 2024-25, a consolidation of 76 basis points (bps) over the RE for 2023-24, led by the containment of revenue expenditure at 11.2 per cent of GDP, even as capital expenditure is budgeted to rise to 3.4 per cent of GDP from 3.2 per cent in 2023-24 (RE) [Table II.6.1 and Appendix Table 6]. II.6.6 On the expenditure front, payouts on major subsidies are expected to contract by 7.8 per cent in 2024-25 (BE), restricting revenue spending growth to 3.2 per cent. Capital expenditure is expected to remain robust in 2024-25 (growth of 16.9 per cent), driven by spending on roads and railways (Chart II.6.3). The scheme for providing financial assistance to states for capital investment has been extended to 2024-25. Capital outlay is budgeted to rise to 2.9 per cent of GDP in 2024-25 (BE) and the revenue expenditure/capital outlay ratio will fall further, improving the quality of spending (Chart II.6.4). | Table II.6.1: Central Government’s Fiscal Performance | | (Per cent of GDP) | | Item | Average of 2015-16 to 2018-19 | 2019-20 | 2020-21 | 2021-22 | 2022-23 | 2023-24 (BE) | 2023-24 (RE) | 2024-25 (BE) | | 1 | 2 | 3 | 4 | 5 | 6 | 7 | 8 | 9 | | I. Non-debt Receipts | 9.1 | 8.7 | 8.5 | 9.4 | 9.1 | 9.0 | 9.4 | 9.4 | | II. Gross Tax Revenue (a+b) | 11.0 | 10.0 | 10.2 | 11.5 | 11.3 | 11.1 | 11.7 | 11.7 | | a) Direct Tax | 5.7 | 5.2 | 4.8 | 6.0 | 6.2 | 6.0 | 6.6 | 6.7 | | b) Indirect Tax | 5.3 | 4.8 | 5.5 | 5.5 | 5.2 | 5.1 | 5.1 | 5.0 | | III. Net Tax Revenue | 7.1 | 6.7 | 7.2 | 7.6 | 7.8 | 7.7 | 7.9 | 7.9 | | IV. Non-tax Revenue | 1.5 | 1.6 | 1.0 | 1.5 | 1.1 | 1.0 | 1.3 | 1.2 | | V. Non-debt Capital Receipts | 0.5 | 0.3 | 0.3 | 0.2 | 0.3 | 0.3 | 0.2 | 0.2 | | VI. Total Expenditure | 12.6 | 13.4 | 17.7 | 16.1 | 15.6 | 14.9 | 15.3 | 14.5 | | VII. Revenue Expenditure | 10.9 | 11.7 | 15.5 | 13.6 | 12.8 | 11.6 | 12.0 | 11.2 | | VIII. Capital Expenditure | 1.7 | 1.7 | 2.1 | 2.5 | 2.7 | 3.3 | 3.2 | 3.4 | | IX. Revenue Deficit | 2.4 | 3.3 | 7.3 | 4.4 | 4.0 | 2.9 | 2.9 | 2.0 | | X. Gross Fiscal Deficit | 3.5 | 4.6 | 9.2 | 6.7 | 6.4 | 5.9 | 5.9 | 5.1 | BE: Budget Estimates. RE: Revised Estimates.
Source: Union Budget documents. |
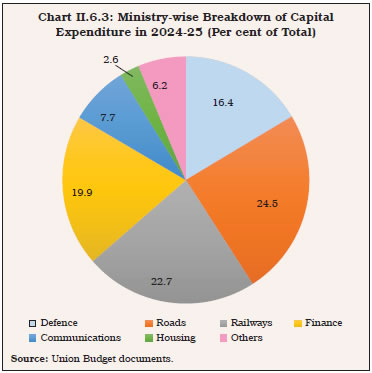 II.6.7 On the receipts side, gross tax revenue is budgeted to increase by 11.5 per cent, a buoyancy of 1.09 in line with recent trends (Table II.6.2). The direct tax-GDP ratio is projected at 6.7 per cent of GDP in 2024-25, the highest in three decades (Chart II.6.5). Non-tax receipts are budgeted to increase by 6.4 per cent, while the disinvestment target has been set at ₹0.5 lakh crore. 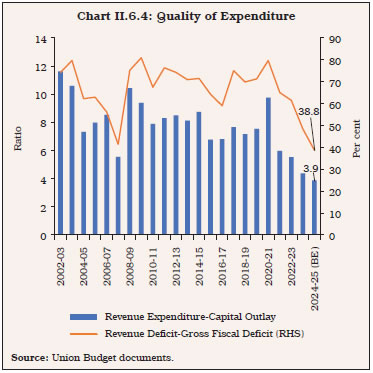
| Table II.6.2: Tax Buoyancy | | | Average Tax Buoyancy
(2010-11 to 2018-19) | 2023-24 (BE) | 2023-24 (RE) | 2024-25 (BE) | | 1 | 2 | 3 | 4 | 5 | | 1. Gross Tax Revenue | 1.11 | 0.99 | 1.39 | 1.09 | | 2. Direct Taxes | 1.03 | 1.00 | 1.90 | 1.24 | | i) Corporation Tax | 0.92 | 1.00 | 1.30 | 1.24 | | ii) Income Tax | 1.27 | 1.00 | 2.49 | 1.25 | | 3. Indirect Taxes | 1.25 | 0.99 | 0.77 | 0.89 | | i) GST | - | 1.14 | 1.40 | 1.11 | | ii) Customs Duty | 0.31 | 1.05 | 0.27 | 0.55 | | iii) Excise Duty | 0.91 | 0.57 | -0.50 | 0.48 | -: Not available. GST: Goods and Services Tax.
Note: Tax buoyancy is defined as the responsiveness of tax revenue to changes in nominal GDP and to discretionary changes in tax policies.
Source: RBI staff estimates based on Union Budget documents for various years. |
II.6.8 Gross market borrowings for 2024-25 are pegged at ₹14.1 lakh crore (4.3 per cent of GDP), down from ₹15.4 lakh crore in 2023-24 (RE) [5.3 per cent of GDP]. Net market borrowings remain the main source of financing GFD in 2024-25 (BE)54, followed by small savings (Chart II.6.6). 4. State Finances in 2023-24 II.6.9 States budgeted a combined GFD of 3.1 per cent of GDP in 2023-24 within the Centre’s limit of 3.5 per cent for the year (Table II.6.3). According to the data for 22 states available from Comptroller and Auditor General (CAG) of India for 2023-24, states’ GFD at 92.0 per cent of the budget estimates was higher than the previous year (88.1 per cent). On the receipts front, states’ overall tax revenue increased by 14.7 per cent due to higher devolution, while own tax revenue growth decelerated. Within states’ own tax revenue, growth in sales tax/value added tax and state excise moderated, while growth in state goods and services tax increased marginally. Non-tax revenues expanded by 16.8 per cent, while grants from the Centre contracted by 21.7 per cent following the cessation of GST compensation to states and the tapering off of finance commission grants. 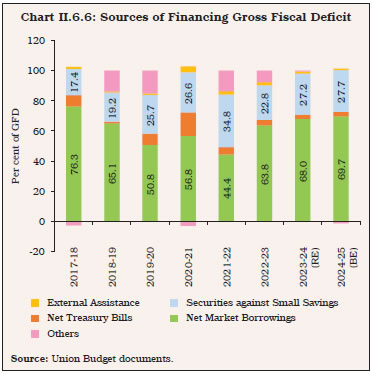
| Table II.6.3: Fiscal Position of States/UTs | | (Amount in ₹ lakh crore) | | | 2019-20 | 2020-21 | 2021-22 | 2022-23 (RE) | 2023-24 (BE) | | 1 | 2 | 3 | 4 | 5 | 6 | | I. Revenue Receipts | 26.7 | 25.9 | 32.3 | 39.1 | 43.1 | | | (13.3) | (13.0) | (13.7) | (14.4) | (14.3) | | II. Non-debt Capital Receipts | 0.6 | 0.2 | 0.2 | 0.1 | 0.4 | | | (0.3) | (0.1) | (0.1) | (0.1) | (0.1) | | III. Revenue Expenditure | 27.9 | 29.6 | 33.3 | 40.4 | 43.4 | | | (13.9) | (14.9) | (14.2) | (14.8) | (14.4) | | IV. Capital Expenditure | 4.6 | 4.6 | 5.8 | 8.1 | 9.6 | | | (2.3) | (2.3) | (2.4) | (3.0) | (3.2) | | a. Capital Outlay | 4.2 | 4.1 | 5.3 | 7.3 | 8.7 | | | (2.1) | (2.1) | (2.3) | (2.7) | (2.9) | | b. Loans and Advances by States | 0.4 | 0.4 | 0.4 | 0.8 | 0.9 | | | (0.2) | (0.2) | (0.2) | (0.3) | (0.3) | | V. Fiscal Deficit | 5.3 | 8.1 | 6.6 | 9.2 | 9.5 | | | (2.6) | (4.1) | (2.8) | (3.4) | (3.1) | | VI. Revenue Deficit | 1.2 | 3.7 | 1.0 | 1.3 | 0.4 | | | (0.6) | (1.9) | (0.4) | (0.5) | (0.1) | | VII. Primary Deficit | 1.7 | 4.2 | 2.3 | 4.5 | 4.3 | | | (0.9) | (2.1) | (1.0) | (1.7) | (1.4) | Note: Figures in parentheses are per cent of GDP.
Source: Budget documents of state governments. | II.6.10 On the spending front, revenue expenditure growth (8.1 per cent) was lower in 2023-24 than the previous year (11.2 per cent). The thrust on capital spending continued (19.4 per cent increase), aided by the Centre’s scheme for special assistance to states for capital investment. 5. State Finances in 2024-25 II.6.11 As per information available for 27 states for 2024-25, their consolidated GFD-GSDP ratio is budgeted at 3.0 per cent (Table II.6.4). Gross transfers from the Centre are budgeted to increase by 8.4 per cent during 2024-25 (BE), largely due to enhanced tax devolution and an increase in loans for capital expenditure. The scheme of 50-year interest free loans for capital expenditure to states would be continued in 2024-25, with total outlay of ₹1.3 lakh crore - an increase of 23.2 per cent over 2023-24 (RE) levels. Finance commission grants are, however, expected to decline in 2024-25, primarily due to lower transfers under post-devolution revenue deficit grants. | Table II.6.4: State Government Finances 2024-25*: Key Deficit Indicators | | (Per cent of GSDP) | | Item | 2022-23 | 2023-24 (RE) | 2024-25 (BE) | | 1 | 2 | 3 | 4 | | Revenue Deficit | 0.3 | 0.5 | 0.2 | | Gross Fiscal Deficit | 2.7 | 3.3 | 3.0 | | Primary Deficit | 1.0 | 1.6 | 1.3 | *: Data pertain to 27 states/UTs, out of which 19 states/UTs have presented their final budgets and remaining states have presented Vote on Account budgets for 2024-25.
Source: Budget documents of state governments. | 6. General Government Finances II.6.12 The general government deficit and debt moderated to 8.6 per cent and 81.6 per cent of GDP, respectively, in 2023-24 (BE) from 9.6 per cent and 82.5 per cent, respectively, in 2022-23 (RE), respectively (Chart II.6.7 and Appendix Table 7). The reduction in the general government deficit in 2023-24 was supported by an increase in tax revenues [from 17.9 per cent of GDP in 2022-23 (RE) to 18.2 per cent in 2023-24 (BE)] along with moderation in revenue expenditure (from 25.8 per cent of GDP to 24.0 per cent). II.6.13 Globally, government finances remained under pressures in 2023 on the back of slowing growth, rising real interest rates and expansionary fiscal policy (IMF, 2023)55. The general government fiscal deficit increased from 3.2 per cent of GDP in 2022 to 5.6 per cent in 2023 in advanced economies (AEs) and from 4.9 per cent to 5.4 per cent in emerging market economies (EMEs) [Chart II.6.8]. Even as overall deficits are projected to narrow in 2024, global debt/GDP ratios will remain elevated and are expected to increase further in both AEs and EMEs.
7. Conclusion II.6.14 The interim Union Budget 2024-25 persevered with consolidation, while improving the quality of spending through higher capital outlays. Gross market borrowings are placed lower in 2024-25, which would enhance the resources available for the private sector. State government budgets for 2024-25 also envisage containment of fiscal deficits. Accordingly, the general government deficit is expected to decline further in 2024-25, which bodes well for macroeconomic stability. II.7 EXTERNAL SECTOR II.7.1 India’s external sector strengthened during 2023-24 amidst multiple global headwinds emanating from sharp deceleration in world trade volumes, financial market volatility engendered by aggressive monetary policy tightening actions of systemic central banks and escalating geopolitical tensions. The correction in commodity prices and subdued external demand led to a contraction in merchandise exports and imports (US$ terms) and a narrowing of the merchandise trade deficit. The buoyancy in services exports and private transfer receipts cushioned the current account deficit (CAD). Net capital flows were higher than in the previous year, driven by portfolio inflows and banking capital, leading to an accretion to foreign exchange reserves. II.7.2 Against this backdrop, sub-section 2 presents a brief overview of global economic and financial conditions, followed by an analysis of India’s merchandise exports and imports in sub-section 3. The behaviour of invisibles is presented in sub-section 4. Details on net capital flows are set out in sub-section 5, while external vulnerability indicators are examined in sub-section 6, followed by concluding observations. 2. Global Economic Conditions II.7.3 The global economy sustained an uneven expansion during 2023, despite tight financial conditions, high inflation, geoeconomic fragmentation and geopolitical tensions. GDP growth turned out to be somewhat stronger than anticipated, driven by resilience in the US and several large emerging market and developing economies (EMDEs) [Chart II.7.1a]. Global trade volume growth was restrained by the rising trade barriers, rotation of global demand back to less-trade intensive services from goods with the ebbing of the pandemic, subdued investment demand and the strengthening of the US dollar (Chart II.7.1b). With continued progress on disinflation, markets are expecting a turn in the global monetary cycle in 2024, which is buoying sentiments in financial markets. 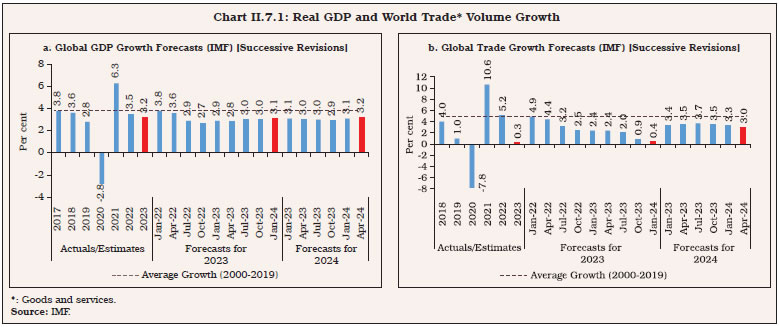
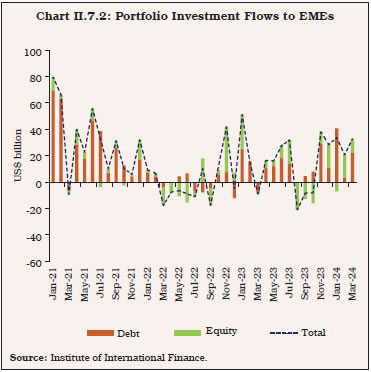 II.7.4 Portfolio flows to emerging market economies (EMEs) recovered in 2023 amidst heightened volatility (Chart II.7.2). Global foreign exchange reserves increased during 2023, reflecting the higher price of gold during the year and lower bond yields in Q4:2023 (Chart II.7.3). 3. Merchandise Trade II.7.5 In India, merchandise exports as well as imports (US$ terms) declined during 2023-24 (Table II.7.1). With the fall in imports exceeding that in exports, the merchandise trade deficit narrowed in 2023-24, reflecting the fragility of global demand (Box II.7.1). 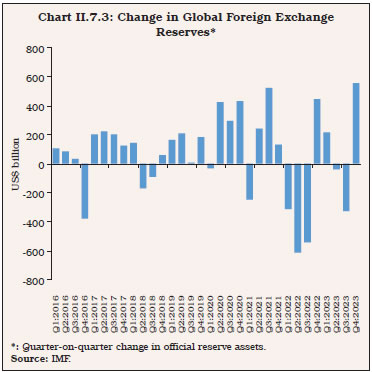
| Table II.7.1: India’s Merchandise Trade | | | Value in US$ billion | Growth Rate | | 2020-21 | 2021-22 | 2022-23 | 2023-24 | 2020-21 | 2021-22 | 2022-23 | 2023-24 | | 1 | 2 | 3 | 4 | 5 | 6 | 7 | 8 | 9 | | Exports | | Q1 | 51.5 | 95.5 | 121.0 | 103.9 | -36.4 | 85.7 | 26.6 | -14.1 | | Q2 | 74.2 | 102.7 | 110.7 | 107.2 | -5.2 | 38.5 | 7.8 | -3.2 | | Q3 | 75.8 | 106.8 | 104.6 | 105.6 | -4.2 | 41.0 | -2.1 | 1.0 | | Q4 | 90.4 | 117.0 | 114.8 | 120.4 | 20.4 | 29.3 | -1.9 | 4.9 | | Annual | 291.8 | 422.0 | 451.1 | 437.1 | -6.9 | 44.6 | 6.9 | -3.1 | | Imports | | Q1 | 61.3 | 127.0 | 183.5 | 160.1 | -52.9 | 107.2 | 44.5 | -12.8 | | Q2 | 90.7 | 147.5 | 189.0 | 170.3 | -23.1 | 62.7 | 28.1 | -9.9 | | Q3 | 110.8 | 167.0 | 176.1 | 174.4 | -4.6 | 50.7 | 5.4 | -1.0 | | Q4 | 131.7 | 171.6 | 167.3 | 170.7 | 19.1 | 30.3 | -2.5 | 2.0 | | Annual | 394.4 | 613.1 | 716.0 | 675.4 | -16.9 | 55.4 | 16.8 | -5.7 | | Trade Balance | | Q1 | -9.8 | -31.4 | -62.6 | -56.2 | | | | | | Q2 | -16.5 | -44.8 | -78.3 | -63.1 | | | | | | Q3 | -35.1 | -60.2 | -71.5 | -68.8 | | | | | | Q4 | -41.2 | -54.6 | -52.6 | -50.3 | | | | | | Annual | -102.6 | -191.0 | -264.9 | -238.3 | | | | | Note: Quarterly figures may not add up to annual figures.
Source: DGCI&S. |
Box II.7.1 Exports Downturn: Structural or Cyclical? India’s merchandise exports rose around ten-fold from US$ 45 billion in 2000-01 to US$ 437.1 billion in 2023-24, interspersed by episodes of contraction and surges. An autoregressive distributed lag (ARDL) model for the period Q1:2009 to Q3:2023 indicates that the long-run elasticity of India’s merchandise export volumes with respect to world merchandise trade volumes is around 1.4. Exports are also sensitive to relative prices, with the real effective exchange rate (REER) elasticity at around (-) 0.5 (Table 1). The short-run trade elasticity is above its long-run value, which suggests that global demand fluctuations have a stronger impact on India’s exports in the short-run. The speed of adjustment (ECM term) is high, i.e., export growth tends to revert to its equilibrium path quickly following deviations from the trend. Utilising the above results, India’s merchandise export growth is decomposed into structural and cyclical components (Constantinescu et. al., 2020). The analysis suggests that the cyclical component has been the major driver of contraction in merchandise export volumes in recent quarters (Chart 1). 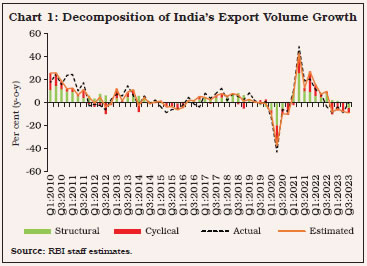
| Table 1: Estimated Elasticity of India’s Merchandise Exports | | Dependent Variable: Log (Export Volume Index) | | Explanatory Variable | Coefficient | | 1 | 2 | | Short-Run (Error Correction Results) | | D[Log(India's export volume index)t–1] | -0.173** | | | (0.076) | | D[Log(India's export volume index)t–2] | 0.123* | | | (0.064) | | D[Log(India's export volume index)t–3] | 0.272*** | | | (0.061) | | D[Log(World trade volume index)t] | 2.132*** | | | (0.155) | | Error Correctiont–1 | -0.567*** | | | (0.099) | | Long-Run (Cointegrating Relation) | | Constant | 1.263 | | | (0.933) | | Log (World trade volume index) | 1.369*** | | | (0.106) | | Log (Export weighted REER) | -0.544** | | | (0.265) | | Bound Test, F-statistic | 7.779 | | Breusch-Godfrey LM Test, p-value | 0.339 | | Breusch-Pagan-Godfrey Test, p-value | 0.455 | | Adjusted R-squared | 0.818 | ***, ** and * indicate significance level at 1 per cent, 5 per cent and 10 per cent, respectively.
Note: Figures in parentheses are standard errors.
Source: RBI staff estimates. | Reference: Constantinescu, C., Mattoo, A., and Ruta, M. (2020), ‘The Global Trade Slowdown: Cyclical or Structural?’, The World Bank Economic Review, 34 (1), 121–142. | II.7.6 The decline in exports in 2023-24 was broad-based, with about half of the export basket recording a fall. The contraction was driven by petroleum, oil and lubricants (POL) and gems and jewellery. On the other hand, non-oil non-gems and jewellery exports witnessed expansion (Chart II.7.4). II.7.7 Apart from petroleum products and gems and jewellery, readymade garments (RMG) of all textiles, organic and inorganic chemicals and rice contributed to the decline in merchandise exports. Electronic goods, drugs and pharmaceuticals, engineering goods, iron ore, and cotton yarn/fabs./made-ups, on the other hand, recorded expansion (Chart II.7.5). II.7.8 Exports of petroleum products dropped by 13.7 per cent (y-o-y) in US$ terms in 2023-24 due to softening oil prices, offsetting the increase in volume terms (Chart II.7.6a). Among the top ten export destinations, five witnessed an increase in supplies (Chart II.7.6b). II.7.9 Exports of engineering goods - one-fourth of the total export basket - increased by 2.1 per cent (y-o-y) during 2023-24, supported by aircraft, spacecraft and parts, and electric machinery and equipment. On the other hand, iron and steel, aluminium and its products, and zinc and its products dragged down overall export growth (Chart II.7.7).
II.7.10 Agricultural exports registered a decline of 9.0 per cent (y-o-y) to reach US$ 46.8 billion during 2023-24. Rice exports contracted by 6.5 per cent (y-o-y) to US$ 10.4 billion during 2023-24, due to restrictions on exports to improve domestic supplies (Chart II.7.8). II.7.11 Exports of electronic goods at US$ 29.1 billion grew by 23.6 per cent (y-o-y) during 2023-24, propelled by mobile phones (accounting for more than half of total electronic goods exports) benefitting from the production-linked incentive (PLI) scheme for large scale electronics manufacturing (LSEM)56 [Chart II.7.9]. Major export markets for smartphones were the US, the UAE, the UK, the Netherlands and Italy.
II.7.12 Exports of drugs and pharmaceuticals, accounting for 6.4 per cent of India’s merchandise exports, rose by 9.7 per cent in 2023-24 on higher shipments of all the sub-components, with double digit growth in drug formulations, biologicals and surgicals (Chart II.7.10). II.7.13 Merchandise imports at US$ 675.4 billion contracted by 5.7 per cent during 2023-24, mainly due to lower prices (Chart II.7.11). The decline in imports was led by POL, coal, pearls, precious, and semi-precious stones, fertilisers and organic and inorganic chemicals. Electronic goods, gold, machinery, pulses, and non-ferrous metals, on the other hand, supported overall import growth (Chart II.7.12). II.7.14 POL imports (26.6 per cent of total merchandise imports) declined by 14.2 per cent to US$ 179.6 billion during 2023-24, mainly due to lower prices as volumes expanded by 0.8 per cent (Chart II.7.13a). Russia’s share in supply of crude oil to India increased to 38.1 per cent during 2023-24 from 22.2 per cent in 2022-23 while that of the Middle East region moderated (Chart II.7.13b).
II.7.15 Fertiliser imports, around one-third of domestic consumption, declined by 39.2 per cent to US$ 10.5 billion during 2023-24 on lower prices (Chart II.7.14). II.7.16 Coal imports at US$ 38.9 billion in 2023-24 fell by 21.8 per cent (y-o-y), benefitting from lower prices even as underlying volumes increased by 11.3 per cent57 (Chart II.7.15). II.7.17 Gold imports at US$ 45.5 billion during 2023-24 rose by 30.1 per cent (y-o-y), underpinned by increase in volume (17.2 per cent) as well as prices (10.2 per cent) [Chart II.7.16]. II.7.18 Imports of electronic goods at US$ 87.9 billion during 2023-24 expanded by 13.7 per cent (y-o-y), driven by electronic components, telecom instruments and computer hardware (Chart II.7.17). II.7.19 The merchandise trade deficit fell by 10.0 per cent (y-o-y) to US$ 238.3 billion during 2023-24. The oil deficit accounted for around 40.1 per cent (Chart II.7.18a). Amongst major trading partners, India’s trade deficit with Russia, Switzerland and China widened, while surpluses improved in respect of the US, the Netherlands and the UK (Chart II.7.18b). 4. Invisibles II.7.20 Net receipts from invisibles - cross-border transactions in services, income, and transfers - rose during 2023-24 (April-December) over the previous year. Software services and business services exports together account for around 70 per cent of India’s services exports, and they increased by 11.0 per cent (y-o-y) during the same period (Chart II.7.19). Amongst other services, exports of travel services grew by 27.6 per cent, benefitting from the lifting of pandemic-related movement restrictions. Transportation receipts fell by 23.9 per cent, largely driven by a softening in global freight rates: the average Baltic Dry Index58 fell by 19.3 per cent over the previous year during April-December 2023. Private transfer receipts, mainly representing remittances by Indians employed overseas, witnessed a y-o-y growth of 3.4 per cent during April-December 2023. Net outgo on the primary income account increased over the previous year by 6.2 per cent, reflecting higher interest and dividend payments. 
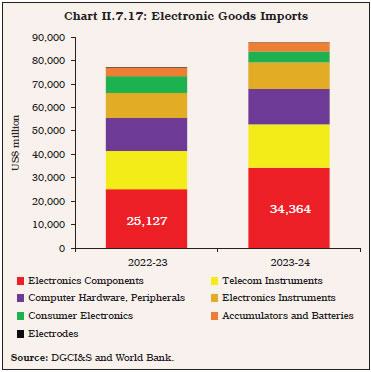

 II.7.21 Services export growth decelerated in 2023-24 due to weakening global demand. The increase in the value of global commercial services was lower at 9.0 per cent in 2023 from 15.1 per cent in 2022. India retained its position in the top five exporting countries during 2023 (Chart II.7.20). According to Gartner59, global information technology (IT) spending is expected to increase to US$ 5.1 trillion in 2024 from US$ 4.7 trillion in 2023, which should support India’s software services exports. II.7.22 Inward remittances to India stood at US$ 86.7 billion in 2023-24 (April-December). India remains the highest remittance receiving economy globally (Chart II.7.21a). According to the World Bank, India’s inward remittances are estimated at US$ 135 billion in 2024, with a share of 15.2 per cent in global remittances. Strong labour markets in major advanced economies such as the US and Europe have supported remittance flows to India. The average cost of sending remittances of US$ 200 to India declined from 5.51 per cent in Q4:2020 (the highest since Q1:2019) to 4.95 per cent in Q3:2023, according to the World Bank estimates. Generally, the amount of remittance receipts and the cost of remittances have a negative relationship (Chart II.7.21b). 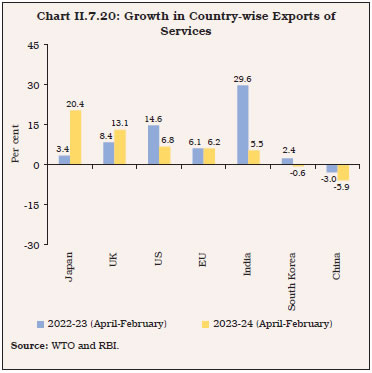 II.7.23 Under the income account60, the deficit widened during 2023-24 (April-December), with the expansion in payments outpacing that in receipts. Higher interest/discount earnings on the Reserve Bank’s investment of its foreign currency assets (FCAs) abroad were offset by outgoes on interest on liabilities such as external commercial borrowings (ECBs), external assistance, short-term credits and non-resident deposits, and payment of dividend to non-resident shareholders (both direct and portfolio investors). II.7.24 India’s CAD narrowed in 2023-24 (April-December) to US$ 31.0 billion (1.2 per cent of GDP) from US$ 65.6 billion (2.6 per cent of GDP) a year ago (Chart II.7.22). This was the outcome of a fall in the merchandise trade deficit as well as a higher surplus in services trade.
5. External Financing II.7.25 During 2023-24 (April-December), capital flows were robust, driven by a turnaround in foreign portfolio investment (FPI) flows. Net inflows under non-resident deposits and external commercial borrowings were higher than a year ago. Net foreign direct investment (FDI) flows were, however, lower on account of a rise in repatriation of FDI from India. Overall, net capital inflows were higher while CAD moderated, leading to an accretion to foreign exchange reserves on a BoP basis (excluding valuation effects) by US$ 32.9 billion during April-December (Chart II.7.23 and Appendix Table 8). II.7.26 Net FDI (i.e., net inward FDI minus net outward FDI) flows fell to US$ 10.6 billion during 2023-24 from US$ 28.0 billion a year ago. While gross inflows by non-residents remained resilient, repatriation/disinvestment of FDI in India increased (Table II.7.2). During 2023-24, the top FDI source countries were Singapore, Mauritius, the US, the Netherlands and Japan, contributing 73.9 per cent (Chart II.7.24). Sector-wise, the services sector (including computer services, communication services, financial services and business services) accounted for a major share of FDI equity flows into India, followed by manufacturing, electricity and other energy, retail and wholesale trade, and transport (Appendix Table 9). II.7.27 Outward FDI from India increased by 13.9 per cent during 2023-24 on a y-o-y basis. Singapore, the US, the UAE, the UK, and the Netherlands were the major destinations. Financial, insurance and business services, manufacturing, and wholesale, retail trade, restaurants and hotels were the major sectors attracting India’s overseas direct investment during 2023-24.
| Table II.7.2: Foreign Direct Investment Inflows | | (US$ billion) | | Item | 2020-21 | 2021-22 | 2022-23 | 2023-24 | | 1 | 2 | 3 | 4 | 5 | | 1. Net FDI (1.1 - 1.2) | 44.0 | 38.6 | 28.0 | 10.6 | | 1.1 Net Inward FDI (1.1.1 - 1.1.2) | 54.9 | 56.2 | 42.0 | 26.5 | | 1.1.1 Gross Inflows | 82.0 | 84.8 | 71.4 | 71.0 | | 1.1.2 Repatriation/Disinvestment | 27.0 | 28.6 | 29.3 | 44.4 | | 1.2 Net Outward FDI | 11.0 | 17.6 | 14.0 | 16.0 | | Source: RBI. | II.7.28 Foreign portfolio investors turned large net buyers in the domestic market in 2023-24 after being net sellers in 2022-23. During 2023-24, net FPI inflows amounted to US$ 41.6 billion as against an outflow of US$ 5.9 billion during 2022-23 (Chart II.7.25). India attracted the highest FPI flows in 2023-24 among peer emerging economies on the back of robust domestic GDP growth, brightening medium-term prospects and strong corporate earnings. II.7.29 FPI inflows in the equity market were primarily recorded in financial services, automobiles, capital goods, oil, gas and consumable fuels, and information technology sectors (Chart II.7.26). Even as the investments by FPIs in the debt market increased during the year, the utilisation remains below the available investment limits.
II.7.30 ECB flows exhibited a turnaround during 2023-24 with net inflow of US$ 3.5 billion as compared to net outflow of US$ 4.1 billion a year ago (Chart II.7.27). II.7.31 More than four-fifths of the ECB agreement amounts were utilised for on-lending/sub-lending, rupee expenditure for local capital goods, modernisation, refinancing of earlier ECBs and new projects (Chart II.7.28). Within ECBs, rupee denominated loans and rupee denominated bonds accounted for 5.3 per cent of the total agreement amounts during 2023-24 as compared with 8.0 per cent a year ago. Of the total agreement amounts during 2023-24, 50.8 per cent of the loans were explicitly hedged, 15.3 per cent were loans from FDI parent companies (excluding INR loans) and 5.3 per cent were denominated in the INR. The remaining 28.6 per cent comprised other ECBs, including naturally hedged loans (i.e., borrowers’ business earnings in foreign currency). 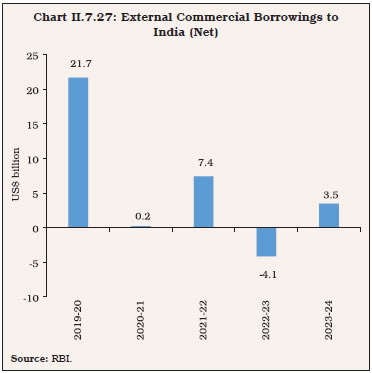 II.7.32 Short-term trade credit declined during 2023-24 in line with the contraction in merchandise imports, with net outflow of US$ 1.8 billion during April-December 2023 as compared with a net inflow of US$ 6.8 billion a year ago. Around 35 per cent of the trade credit was raised for imports of crude oil, gold, coal and copper.
| Table II.7.3: Flows under Non-Resident Deposit Accounts | | (US$ billion) | | Item | 2020-21 | 2021-22 | 2022-23 | 2023-24 | | 1 | 2 | 3 | 4 | 5 | | 1. Non-Resident External (Rupee) Account | 8.8 | 3.3 | 2.5 | 4.2 | | 2. Non-Resident Ordinary Account | 2.3 | 3.5 | 4.0 | 4.2 | | 3. Foreign Currency Non-Resident (B) Account | -3.8 | -3.6 | 2.4 | 6.4 | | Non-Resident Deposits (1+2+3) | 7.4 | 3.2 | 9.0 | 14.7 | | Source: RBI. | II.7.33 Net inflows under non-resident deposits surged to US$ 14.7 billion during 2023-24 from US$ 9.0 billion a year ago, with accretions under all the three schemes - Non-Resident (External) Rupee (NRE) deposits; Non-Resident Ordinary (NRO) accounts; and Foreign Currency Non-Resident (Bank) [FCNR(B)] deposits (Table II.7.3). 6. Vulnerability Indicators II.7.34 At end-December 2023, India’s external debt increased by US$ 23.9 billion over its level at end-March 2023. However, as a ratio to GDP, it declined and remained the lowest among emerging market peers (Table II.7.4). II.7.35 India’s foreign exchange reserves rose during 2023-24, strengthening the buffers for mitigating external risks and spillovers. They were placed at US$ 646.4 billion as at end-March 2024, an increase of US$ 68.0 billion over end-March 2023. At end-December 2023, India’s foreign exchange reserves were five times higher than short-term external debt on original maturity basis and more than two times short-term external debt on residual maturity basis. As at end-March 2024, foreign exchange reserves provided a cover of 11.4 months of imports for 2023-24. | Table II.7.4: External Vulnerability Indicators (End-March) | | (Per cent, unless indicated otherwise) | | Indicator | 2013 | 2022 | 2023 | End-December 2023 | | 1 | 2 | 3 | 4 | 5 | | 1. External Debt to GDP Ratio | 22.4 | 20.0 | 19.0 | 18.7 | | 2. Ratio of Short-term Debt (Original Maturity) to Total Debt | 23.6 | 19.7 | 20.6 | 19.5 | | 3. Ratio of Short-term Debt (Residual Maturity) to Total Debt | 42.1 | 43.2 | 44.0 | 43.9 | | 4. Ratio of Concessional Debt to Total Debt | 11.1 | 8.3 | 8.2 | 7.7 | | 5. Ratio of Reserves to Total Debt | 71.3 | 98.1 | 92.7 | 96.0 | | 6. Ratio of Short-term Debt (Original Maturity) to Reserves | 33.1 | 20.0 | 22.2 | 20.3 | | 7. Ratio of Short-term Debt (Residual Maturity) to Reserves | 59.0 | 44.0 | 47.4 | 45.7 | | 8. Reserve Cover of Imports (in Months)* | 7.0 | 11.8 | 9.6 | 11.0 | | | | | | (11.4) | | 9. Debt Service Ratio (Debt Service to Current Receipts) | 5.9 | 5.2 | 5.3 | 6.5 | | 10. External Debt (US$ billion) | 409.4 | 619.0 | 624.3 | 648.2 | | 11. Net International Investment Position (NIIP) [US$ billion] | -326.7 | -358.2 | -367.5 | -370.3 | | 12. NIIP/GDP Ratio | -17.8 | -11.6 | -11.3 | -10.8 | | 13. CAB/GDP Ratio# | -4.8 | -1.2 | -2.0 | -1.2 | *: Based on merchandise imports of latest four quarters, published in BoP statistics.
#: CAB/GDP Ratio in column 5 pertains to April-December 2023.
Note: Figure in parenthesis pertains to end-March 2024.
Source: RBI and Government of India. | 7. Conclusion II.7.36 India’s external sector strengthened during 2023-24. The current account deficit narrowed, remaining sustainable and well financed. Capital flows recovered and helped to augment foreign exchange reserves. Accordingly, the economy’s ability to withstand spillovers from adverse global macro-financial shocks was enhanced, contributing to overall macroeconomic and financial stability.
|