|
The preliminary data on India's balance of payments
(BoP) for the first Quarter (Q1) of 2006-07 i.e., April-June 2006, are
compiled. Full
details of BoP data are set out in the attached Statements in the standard format
of presentation. It may be mentioned that in recognition of growing importance
of services, new reporting arrangements were put in place in 2004-05, wherein
a number of new purpose codes were introduced with a view to collecting data
separately for a number of services (such as business services, financial services
and communication services), which were earlier included under miscellaneous
items (shown as Table 3). These data have been included in the standard format
of presentation of BoP data for financial year 2004-05, 2005-06 and Q1 of 2006-07.
The BoP developments during the Q1 of 2006-07 along with the revised data for
the full financial year i.e. April-March 2004-05 are set out in the following
paragraphs.
April-June 2006
The major items of the BoP for Q1 of 2006-07
are presented in Table 1 below.
|
Table 1: India's Balance of
Payments: April-June 2006
|
|
(US $ million)
|
|
Items
|
April-June
|
April-June
|
|
|
2006P
|
2005PR
|
|
1
|
2
|
3
|
|
Exports
|
28,245
|
24,150
|
|
Imports
|
46,729
|
37,754
|
|
Trade Balance
|
-18,484
|
-13,604
|
|
Invisibles, net
|
12,385
|
10,048
|
|
Current Account Balance
|
-6,099
|
-3,556
|
|
Capital Account*
|
12,477
|
4,803
|
|
Change in Reserves#
(-) indicates increase.
|
-6,378
|
-1,247
|
|
*: Including errors and omissions.
#: On BoP basis excluding valuation.
P: Preliminary. PR: Partially Revised.
|
Merchandise Trade
- India’s Merchandise exports, on a BoP basis,
posted a growth of 17 per cent in Q1 of 2006-07 as compared with 35.4 per
cent in the corresponding quarter of the previous year.
- Import payments showed moderation in Q1 (23.8
per cent growth) representing mainly a strong base effect as imports grew
by 64.5 per cent in the corresponding quarter of 2005-06.
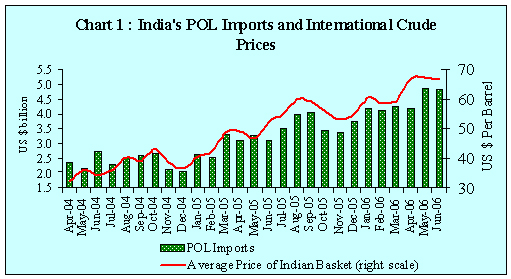
- The average price of the Indian basket of international
crude (a mix of Dubai and Brent varieties) rose to US $ 66.8 per barrel in
Q1 of 2006-07 from US $ 49.3 per barrel in the corresponding quarter of the
previous year (Chart 1).
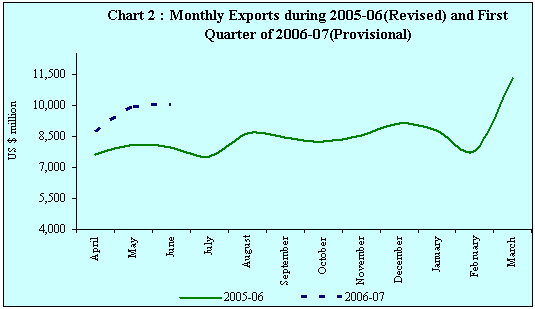
- The month-wise movement in exports as per Directorate
General of Commercial Intelligence and Statistics (DGCI&S) data is presented
in Chart 2.
- According to the data released by DGCI&S,
while the growth in oil imports accelerated from 31.0 per cent in April-June
2005 to 44.9 per cent in April-June 2006, non-oil imports witnessed a deceleration
(9.1 per cent) as against an increase of 52.9 per cent over the corresponding
period of the previous year. Non-oil imports, excluding gold and silver during
the quarter recorded an increase of 17.3 per cent (53 per cent in the corresponding
period of the previous year).
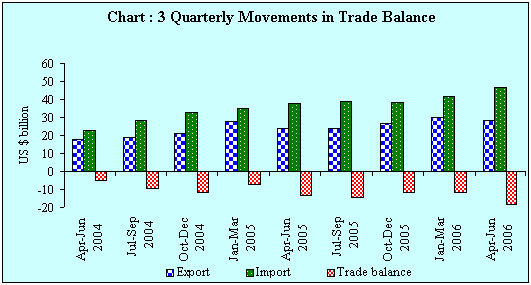
Trade Deficit
- On BoP basis, the growth in imports outstripping
the pace of export growth, the merchandise trade deficit increased to US $
18.5 billion in Q1 of 2006-07 (US $ 13.6 billion in Q1 of 2005-06) (Chart
3).
Invisibles
- Maintaining the pace of growth in travel earnings,
business and professional services, software services and remittances, invisible
receipts rose by 22.6 per cent (Table 2 and Chart 4).
|
Table 2 : Details of Invisible
Gross Receipts and Payments
|
|
|
|
|
(US $ million)
|
|
Items
|
Invisible Receipts
|
Invisible Payments
|
|
|
April-June
2006
|
April-June
2005
|
April-June
2006
|
April-June
2005
|
|
1
|
2
|
3
|
4
|
5
|
|
I. Services
|
16,554
|
12,849
|
8,979
|
7,477
|
|
Travel
|
1,708
|
1,466
|
1,629
|
1,288
|
|
Transportation
|
1,738
|
1,469
|
1,998
|
1,638
|
|
Insurance
|
240
|
199
|
135
|
193
|
|
Govt. not included elsewhere
|
57
|
62
|
85
|
79
|
|
Software Services
|
6,385
|
5,103
|
438
|
250
|
|
Non Software Misc Services
|
6,426
|
4,550
|
4,694
|
4,029
|
|
II. Transfers
|
6,032
|
5,697
|
297
|
194
|
|
III. Income (i+ii)
|
1,552
|
1,140
|
2,477
|
1,967
|
|
(i) Investment Income
|
1,487
|
1,107
|
2,278
|
1,802
|
|
(ii) Compensation of Employees
|
65
|
33
|
199
|
165
|
|
Total (I+II+III)
|
24,138
|
19,686
|
11,753
|
9,638
|
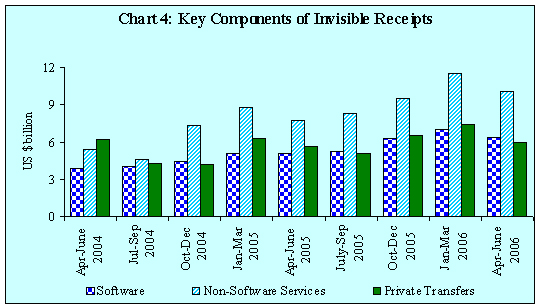
- Software exports were recorded at US $ 6.4 billion
in the Q1 of 2006-07 as compared with US $ 5.1 billion in the corresponding
quarter of the previous year. The miscellaneous receipts, net of software,
were recorded at US $ 6.4 billion in Q1 of 2006-07 as against US $ 4.6 billion
in the Q 1 of 2005-06 (Table 3).
|
Table 3 : Break up of Non-Software
Miscellaneous Receipts and Payments
|
|
(US $ million)
|
|
|
Receipts
|
Payments
|
|
|
April-June
2006
|
April-June
2005
|
April-June
2006
|
April-June
2005
|
|
Communication Services
|
517
|
318
|
108
|
85
|
|
Construction
|
83
|
477
|
235
|
126
|
|
Financial
|
725
|
269
|
317
|
290
|
|
News Agency
|
98
|
142
|
42
|
30
|
|
Royalties, Copyrights & License Fees
|
28
|
35
|
221
|
162
|
|
Business Services
|
4,548
|
1,906
|
2,470
|
1,283
|
|
Others
|
427
|
1,403
|
1,301
|
2,053
|
|
Total
|
6,426
|
4,550
|
4,694
|
4,029
|
- Receipts on account of Business Services were
recorded at US $ 4.5 billion in Q1 of 2006-07 as against US $ 1.9 billion
in the corresponding quarter of the previous year.
- Invisible payments grew at 21.9 per cent partly
reflecting continuing pace of outbound tourist traffic from India and rising
payments towards transportation.
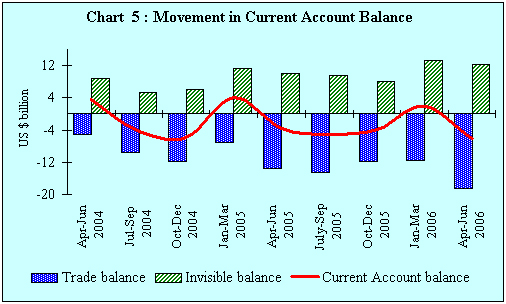
Current Account Deficit
- Notwithstanding a higher net invisibles surplus
of US $ 12.4 billion, large merchandise trade deficit led to a higher current
account deficit of US $ 6.1 billion than the corresponding quarter of the
previous year (US $ 3.6 billion) (Chart 5 ).
Capital Account
- In the capital account, net inflows under external
commercial borrowings, foreign direct investment and banking capital recorded
steady increase resulting in higher net capital flows. (Table 4).
- The increase in banking capital was on account
of higher inflow under NRI deposits and drawdown of foreign assets of commercial
banks.
|
Table 4 : Net Capital Flows
in April-June 2006
|
|
|
|
(US $ million)
|
|
Items
|
April-June 2006
|
April-June 2005
|
|
1
|
2
|
3
|
|
Foreign Direct Investment
|
1,727
|
1,198
|
|
Portfolio Investment
|
-527
|
972
|
|
External Assistance
|
23
|
212
|
|
External Commercial Borrowings
|
3,560
|
1,091
|
|
Banking Capital
|
5079
|
782
|
|
Of which : NRI Deposits
|
1,231
|
-108
|
|
Short-term Credits
|
417
|
-151
|
|
Others*
|
1,584
|
324
|
|
Total
|
11,863
|
4,428
|
|
* Include rupee debt service and leads
and lags in export receipts.
|
Reserve Accretion
- Accretion to foreign exchange reserves at US
$ 6.4 billion was higher than US $ 1.2 billion recorded during the corresponding
quarter of the previous year. Taking into account the valuation gain of US
$ 4.9 billion, foreign exchange reserves recorded an increase of US $ 11.3
billion during April-June 2006 as against a decline of US $ 3.1 billion during
the corresponding period of the previous year.
Revisions in the BoP Data for 2004-05
According to the Revisions Policy
for BoP data, the data for 2004-05 have been revised taking into account the
latest available data. The revised quarterly and annual data for 2004-05 are
set out in the attached
statement.
It may be mentioned that the preliminary
data for 2005-06 would be revised in December 2006, in accordance with the Revisions
Policy for BoP data.
P.V.Sadanandan
Manager
Press Release : 2006-2007/449
|