Bhupal Singh* |
| |
This paper examines the macroeconomic factors that drive the Indian corporates’ preference for overseas borrowings. Foreign borrowings by Indian corporates are characterised by a large number of companies accessing international capital markets for small size loans. The policy framework on foreign commercial borrowings has been effective in achieving a balanced maturity profile as also in channelising funds to productive sectors. It is observed that foreign borrowings by the corporates and import of capital goods display a close positive relationship. Since capital goods import is closely related to growth in industrial production, it implies that the demand for foreign borrowings by the corporates is generated by the underlying pace of real activity. The estimated error correction model revealed that Indian corporates’ long-run demand for overseas commercial borrowings is predominantly influenced by the pace of domestic real activity, followed by the interest rate differentials between the domestic and international markets (indicating arbitrage) and the credit conditions. The real variable dominates the price variable in driving the demand for overseas commercial borrowings. |
| |
JEL Classification : G1, G3, E51
Keywords : Financial markets, corporate overseas borrowings, credit, interest rate arbitrage |
| |
| Introduction |
| |
The rising access of the emerging market firms to international capital markets reflects the transformation of corporate financing led by cross-border movement of capital, deepening of global financial markets, strong interlinkage across markets and institutional developments, particularly the mechanisms for risk assessment. Large access to international borrowings is also indicative of greater trade linkages and an enhanced exposure of firms to foreign currency |
| |
* The author is Assistant Adviser in the Department of Economic Analysis and policy. The views expressed in the paper are those of the author’s only and not that of the institution the author is affiliated to. The usual disclaimer applies. The author expresses gratitude to Dr. Sarat Dhal for his insightful suggestions and Mrs. Jaya Sohani for patiently going through the page proofs of the paper. |
| |
| transactions. Liberalisation of capital controls by developing countries coupled with a rising appetite for asset diversification by international investors has also created an environment for firms from developing countries to increasingly access the international capital markets. The above mentioned developments seem to have enabled them to circumvent the credit constraint imposed by the underdeveloped local capital markets, widened their choices of financing and facilitated borrowings at a reasonable cost. |
| |
A historical account of India’s approach to external commercial borrowings (ECBs) reveals that during the period 1950s to the early 1980s, the domestic firms’ reliance on international capital markets was restricted mainly to bilateral and multilateral assistance. In the 1980s, in the context of the widening current account deficit, the traditional external sources of financing were found to be inadequate and were supplemented with commercial borrowings from international markets including short-term borrowings. In the 1990s, the Indian corporates’ access to international capital markets increased with the liberalisation of the external borrowings policy, the gradual withdrawal of capital account restrictions and improved credit ratings. During the current decade (2000s), the sustained growth of overseas borrowings and the overall private capital flows to India reflects the momentum in domestic economic activity, resilient corporate performance, a positive investment climate, a long-term view of India as an investment destination and the improved sovereign risk. Besides these factors, the prevailing higher domestic interest rate coupled with a higher growth rate has moderated the risk perception and created arbitrage opportunities.
In the above backdrop of a paradigm shift from official to private capital flows and the emergence of overseas commercial borrowings as an important component of capital flows, this paper attempts to analyse the underpinnings and the key determinants of commercial borrowings by the Indian corporates from international capital markets. Section I provides an analytical review of the shifting policy paradigm of external borrowings. The trends in ECBs, compositional shifts and the pattern of concentration in favour of small or big size borrowings are discussed in Section II. Based on these, Section III presents analytical underpinnings of corporates’ overseas borrowing behaviour from international markets. Estimates of an Error Correction Model (ECM), formulated to capture the long run and the short run corporate borrowing behaviour, are analysed in Section IV. Some key observations emerging from the study are summarised in Section V. |
| |
Section I |
| |
The Policy Environment: A Paradigm Shift |
| |
The recourse to commercial borrowings by the Indian corporates, though began in the 1970s, remained modest due to the dominance of concessional, non-market based finance in the form of external assistance from bilateral sources and multilateral agencies. Towards the end of the 1970s, the concessionality in the aid flows dwindled. Thus, with the rising external financing requirements beginning with the 1980s and the recognition that reliance on external assistance was not favourable, commercial borrowings from international capital markets were preferred. The commercial borrowings were, however, regulated by an approval procedure, subject to conditions on cost, maturity, end use and ceilings on borrowings. The upgrade in the credit ratings also facilitated access to international capital markets. In the second half of the 1980s, financial institutions and public sector undertakings increased their participation in the international bonds market – the Samurai market, the DM and the Swiss Franc public bond and the Euro-Dollar fixed rate bond markets. During the late 1980s, large inflows were also contributed by the development financial institutions which were encouraged to borrow overseas well in advance of their requirements. The rising reliance on commercial borrowings was manifested in the fact that the commercial borrowings constituted 27 per cent of net capital flows to India in the 1980s, more than double from 12 per cent in the 1970s.
Following the balance of payments (BoP) crisis of 1991, the flow of funds from global commercial banks and bond markets virtually receded in response to a down grading of sovereign ratings by the credit rating agencies. The problem that emerged was related to the access of Indian entities to international markets rather than the cost of borrowings. As a consequence, a prudent external debt management policy was pursued to bring the external debt situation to a more comfortable level. During the 1990s, in the period following the balance of payments crisis of 1991 and the introduction of economic reforms, external assistance ceased to be an important element of capital inflows with the ascendancy of private capital flows – a phenomenon observed across the developing countries. As a consequence, net capital flows to India increased to 2.2 per cent of GDP in the 1990s and 3.7 per cent in the 2000s (2000-08), after remaining at around 1 per cent of GDP during the period 1950-1980. This, however, masks the magnitude of cross border capital flows to India as in gross terms, which increased five-fold from 7.2 per cent of GDP in 1990-91 to 36.4 per cent in 2007-08. In tandem, commercial borrowings, after experiencing some slowdown after the BoP crisis, also rose significantly in the latter half of the 1990s, responding to the strong domestic investment demand, favourable global liquidity conditions, upgrade of sovereign credit rating, lower risk premia on emerging market bonds and an upward phase of capital flow cycle to the EMEs. During this period, ECBs constituted about 30 per cent of the net capital flows to India. Towards the late 1990s and the early 2000s, the demand for ECBs remained subdued due to a host of factors such as global economic slowdown, reversal of a rising phase of capital flows to developing countries and lower domestic investment demand. The period beginning 2003-04 marked the resumption of debt flows to developing countries, which was a combined outcome of the higher interest rate differential emanating from ample global liquidity and the robust growth expectations and a low risk perception towards the emerging markets. During this period, Indian corporates also increased their recourse to ECBs, which contributed to about 25 per cent of the net capital flows to India.1 |
| |
| The policy on commercial borrowings, however, continues to lay emphasis on the principles of prudent debt management with regard to access, prioritizing the end use of resources raised, minimum maturity restriction and prudent ceiling on aggregate borrowings.2 First, from the viewpoint of prudent debt management, ECBs can be accessed under two routes: (i) the automatic route, i.e., which does not require approval, and (ii) the approval route. The maximum amount of ECBs which can be raised by a corporate under the approval route is US$ 500 million or equivalent with a minimum average maturity of five years during a financial year. However, corporates can avail of ECBs up to an additional amount of US$ 250 million over the existing limit of US$ 500 million with an average maturity of more than 10 years. While borrowings for investment in the real sector, especially the infrastructure sector, fall under the automatic route, the following types of proposals are covered under the approval route: (a) financial institutions dealing exclusively with infrastructure or export finance, (b) banks and financial institutions which had participated in the textile or steel sector restructuring package, (c) ECBs by non-banking financial companies with a minimum average maturity of 5 years, (d) foreign currency convertible bonds (FCCBs) by housing finance companies, (e) special purpose vehicles or any other entity notified by the RBI set up to finance infrastructure companies/ projects, and (f) multi-state co-operative societies engaged in manufacturing activity. The pattern of external commercial borrowings reveals that a dominant part of the borrowings is raised under the automatic route, indicating broadly no restrictions on borrowings by the non-financial entities, i.e. corporates (Table 1). The recent rise in the share of the approval route reflects large size loans (above US $ 500 million) by non-financial companies in the power, airline and mineral sectors. |
| |
Table 1: External Commercial Borrowings through Various Routes |
(US $ million) |
Quarter |
Automatic Route |
Approval Route |
Total |
Amount |
% Share |
Amount |
% Share |
1 |
2 |
3 |
4 |
5 |
6 |
2004:Q1 |
857 |
69.3 |
380 |
30.7 |
1,237 |
2004:Q2 |
2,603 |
96.3 |
100 |
3.7 |
2,703 |
2004:Q3 |
2,780 |
88.8 |
352 |
11.2 |
3,132 |
2004:Q4 |
3,077 |
87.4 |
445 |
12.6 |
3,522 |
2005:Q1 |
1,941 |
90.9 |
194 |
9.1 |
2,135 |
2005:Q2 |
2,292 |
96.2 |
90 |
3.8 |
2,382 |
2005:Q3 |
3,746 |
87.9 |
514 |
12.1 |
4,259 |
2005:Q4 |
3,017 |
96.1 |
122 |
3.9 |
3,139 |
2006:Q1 |
6,450 |
87.3 |
941 |
12.7 |
7,391 |
2006:Q2 |
3,930 |
88.8 |
498 |
11.2 |
4,428 |
2006:Q3 |
3,462 |
85.1 |
607 |
14.9 |
4,069 |
2006:Q4 |
2,610 |
35.9 |
4,657 |
64.1 |
7,268 |
2007:Q1 |
7,917 |
82.6 |
1,671 |
17.4 |
9,588 |
2007:Q2 |
4,823 |
56.7 |
3,684 |
43.3 |
8,507 |
2007:Q3 |
5,734 |
80.7 |
1,372 |
19.3 |
7,105 |
2007:Q4 |
4,108 |
50.6 |
4,006 |
49.4 |
8,115 |
2008:Q1 |
5,354 |
74.1 |
1,873 |
25.9 |
7,227 |
Source : Compiled on the basis of information obtained from www.rbi.org.in/ecb |
|
| |
Second, the thrust of the policy continues to be directed towards allowing ECBs an additional source of finance for the Indian corporate sector for financing expansion of the existing capacity and for fresh investment to augment resources available domestically. Although till recently, the policy sought to give greater priority to projects in the infrastructure, core and export sectors, all end-use restrictions were relaxed, except prohibiting the use of proceeds for investment in capital markets and real estate so as to avoid any speculative activities (Table 2). |
| |
Table 2: End-Use Restrictions on External Commercial Borrowings in India |
| |
Domestic Investment |
Import of capital goods, new projects, modernisation/expansion of existing production units in real sector - industrial sector including small and medium enterprises (SME) and infrastructure sector - in India. Infrastructure sector is defined as (i) power, (ii) telecommunication, (iii) railways, (iv) road including bridges, (v) sea port and airport (vi) industrial parks and (vii) urban infrastructure (water supply, sanitation and sewage projects). |
Foreign Currency Expenditure |
ECB above US $ 50 million per borrower company per financial year is permitted only for foreign currency expenditure for permissible end-uses of ECB. |
Local Rupee Expenditure |
Borrowers proposing to avail ECB up to US $ 50 million for rupee expenditure for permissible end uses would require prior approval of the Reserve Bank under the Approval Route. However, borrowers in infrastructure sector may avail ECB up to US $ 100 million for Rupee expenditure for permissible end-uses under the approval route. |
Overseas Investment |
ECB proceeds can be utilised for overseas direct investment in Joint Ventures (JV)/Wholly Owned Subsidiaries (WOS) subject to the existing guidelines on Indian Direct Investment in JV/WOS abroad. |
Acquisition under the Disinvestment Process |
Utilisation of ECB proceeds is permitted in the first stage acquisition of shares in the disinvestment process and also in the mandatory second stage offer to the public under the Government’s disinvestment programme of PSU shares. |
| Micro Finance |
NGOs engaged in micro finance activities may utilise ECB proceeds for lending to self-help groups or for micro-credit or for bonafide micro finance activity including capacity building. |
|
| |
| A relevant issue that arises is how effective the above policy framework has been in respect of the end use pattern of the ECBs. The emphasis of the ECB policy has been traditionally on the use of funds for the import of capital goods, new projects, modernisation/ expansion of existing production units in the real sector. It may be discerned from Table 3 that, on an average, 70 per cent of ECBs are utilised for the import of capital goods, setting up new projects and the modernisation or expansion of existing units. In the context of the end use of ECBs, there have been some new developments. First, with the momentum in Indian investment abroad through Joint Ventures (JVs) and Wholly Owned Subsidiaries (WOSs) to provide the Indian industry access to new markets and technologies, the end-use of ECBs was enlarged to include overseas direct investment, |
| |
Table 3: End-Use Pattern of External Commercial Borrowings |
(US $ million) |
Components |
2004-05 |
2006-07 |
2007-08 |
Amount |
Share (%) |
Amount |
Share (%) |
Amount |
Share (%) |
1 |
2 |
3 |
4 |
5 |
6 |
7 |
Import of capital goods |
3,060 |
26.6 |
5,760 |
22.7 |
12,717 |
41.1 |
Rupee Expenditure for local sourcing of capital goods |
1,899 |
16.5 |
3,056 |
12.1 |
836 |
2.7 |
On-lending or sub-lending |
1,401 |
12.2 |
883 |
3.5 |
712 |
2.3 |
New Projects |
2,273 |
19.8 |
6,970 |
27.5 |
4,796 |
15.5 |
Modernisation/expansion of existing units |
2,057 |
17.9 |
5,222 |
20.6 |
2,929 |
9.5 |
Overseas investment in JV/WOS |
265 |
2.3 |
1,392 |
5.5 |
3,901 |
12.6 |
Leasing & hire purchase |
- |
- |
18 |
0.1 |
2,518 |
8.1 |
Refinancing of old loans |
- |
- |
630 |
2.5 |
1,226 |
4.0 |
Textile/Steel re-structuring package |
100 |
0.9 |
– |
– |
– |
– |
Others |
437 |
3.8 |
1,422 |
5.6 |
1,317 |
4.3 |
Total |
11,492 |
100.0 |
25,353 |
100.0 |
30,953 |
100.0 |
Note: Based on Form 83 submitted for allotment of loan registration number prior to draw down and approvals.
Source: Compiled on the basis of the information sourced from www.rbi.org.in. |
|
| |
| which has grown in significance. Second, ECBs are also being increasingly used for leasing and hire purchase, reflecting mainly the leasing of aircrafts by domestic airline companies for capacity expansion. Three, the monthly trend in 2007-08 shows that the ECBs utilised for capital goods import have remained significantly higher after the policy changes relating to the end use were effected in August 2007. Simultaneously, the ECBs used for rupee expenditure have significantly come down. |
| |
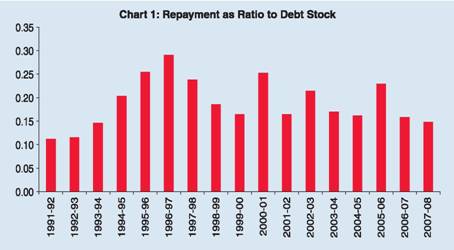
Third, the policy also aims at maintaining a minimum average maturity while keeping an annual ceiling on approvals. ECBs with an average maturity of 8 years and above are, however, outside the purview of the ceiling. Limits on individual borrowings are linked to an average maturity profile. Based on these criteria, the ECBs guideline/approval procedure has been substantially liberalised over time with a view to providing corporates a greater access to international capital markets. As a broad indicator of the maturity profile of commercial loans, the ratio of loans maturing during a year as a ratio to the loans outstanding at the beginning of the year can provide a fair idea about the maturity structure. The policy bias towards balancing of the maturity profile with longer maturity loans during the post-1991 period is amply demonstrated by the ratio of maturing loans to the loans outstanding at about 0.2, implying an average maturity of 5 years (Chart 1).
The computed weighted average maturity of ECB loans during the period 2004-07 has witnessed a balanced maturity structure (Chart 2). The maturity structure, however, seems to respond to the interest rate movements. The average maturity witnessed some compression with the hardening of international interest rates. However, moderation in the interest rate cycle seems to have had a favourable impact on the maturity structure.
Fourth, an important guiding principle of the ECB policy is to keep the costs of borrowings within prudent limits so that the excessive risk taken by the corporates can be avoided. Accordingly, the all-in-cost ceiling for raising borrowing in the international |
 |
capital markets is linked to the 6-month LIBOR for the respective currencies in which the loan is raised. It can be discerned from Table 4 that the interest rate spread over the LIBOR has been progressively reduced which might be driven by the improved credit rating and finer spreads on Indian bonds in the international markets and better aligning of the domestic interest rate to global rates.
The outcome of the above mentioned policy measures is evident in the secular reduction in the implicit interest rates on external commercial borrowings from 1990-91 through 2006-07 (Table 5). |
 |
| |
Table 4: Price Ceiling on External Commercial Borrowings |
(Basis points over 6-month LIBOR) |
Year |
Normal Projects/3-5 year maturity |
Long Term ECBs/more than 5 year maturity |
1 |
2 |
3 |
2001 |
300 (400 for infrastructure sectors |
450 |
2004 |
200
(3-5 year) |
350
(>5 years) |
2006 |
200 |
350 |
2007 |
150 |
250 |
2008 |
200 |
350 |
Note: Ceiling represents all in cost ceiling over 6 month LIBOR for the respective currencies. |
|
The implicit interest rate on external borrowings has moved in a corridor between the 6-month LIBOR and the ceiling interest rate. Again, the spread of implicit cost of commercial borrowings over the LIBOR has significantly narrowed down during the period 1991-92 to 2006-07 from a peak of about 700 basis points in 1992-93 to 100 basis points in 2006-07, reflecting the deep and liquid global financial markets, benign liquidity conditions and gradual upgradation in the sovereign rating and improved corporate performance. |
| |
Table 5: Interest Rate Dynamics |
(Per cent) |
Year |
6-Month Libor |
Average Ceiling rate over Libor |
Implicit rate on ECBs |
1 |
2 |
3 |
4 |
1990-91 |
7.96 |
- |
15.10 |
1991-92 |
5.44 |
- |
11.29 |
1992-93 |
3.66 |
- |
10.09 |
1993-94 |
3.51 |
- |
10.77 |
1994-95 |
5.78 |
- |
11.96 |
1995-96 |
5.78 |
- |
10.62 |
1996-97 |
5.68 |
- |
9.76 |
1997-98 |
5.86 |
- |
9.65 |
1998-99 |
5.40 |
- |
9.38 |
1999-00 |
5.85 |
9.35 |
7.88 |
2000-01 |
6.36 |
10.86 |
8.50 |
2001-02 |
2.95 |
7.45 |
5.97 |
2002-03 |
1.78 |
6.28 |
5.00 |
2003-04 |
1.35 |
5.85 |
4.98 |
2004-05 |
2.63 |
6.13 |
4.36 |
2005-06 |
4.43 |
7.93 |
4.98 |
2006-07 |
5.42 |
7.92 |
6.38 |
Note:(1) Interest rate (r) is computed by dividing the interest payments (ip) in period t by the debt stock (d) in period t-1, i.e. r = [ip(t)/d(t-1)]-1.
(2) Interest payments for 2003-04 and 2005-06 exclude the interest relating to redemption of Resurgent India Bonds and India Millennium Deposits. |
|
| |
| Fifth, corporates have been permitted to undertake liability management for hedging the interest and/or exchange rate risk on their underlying foreign currency exposures. These products include interest rate swaps, currency swaps, coupon swaps, interest rate caps/ collars and forward rate agreements. Prepayment facilities on ECB debt have also been relaxed significantly. As of now, 100 per cent prepayment is permitted where the source of funds is from the Exchange Earners’ Foreign Currency account(s) in addition to prepayment out of foreign equity inflow or when residual maturity of such debt is up to one year. Prepayment of ECBs up to US$ 500 million can be allowed by banks without the prior approval of the RBI, subject to compliance with the minimum average maturity period as applicable to the loan. |
| |
Section II |
| |
Trends and Composition of ECBs |
| |
ECBs raised by Indian corporates in gross terms increased seventeen-fold between 1990-91 and 2007-08 (Table 6). A comparison of approvals and actual loans raised by the corporates provides an important indication about the market conditions and the behaviour of the companies intending to raise loans. A higher rate of realisation of the loans approved may take place during the periods of higher credit demand domestically or a higher interest rate spread between domestic and foreign interest rates. A stable and consistently high realisation ratio in the recent years indicates the higher credit demand by the corporates.
In tandem with the increasing levels, the composition of India’s external debt reveals that ECBs constitute the largest component of external debt after the external assistance. ECB liabilities witnessed |
| |
Table 6: External Commercial Borrowings |
(US $ million) |
Year |
Approvals |
Disbursements |
Repayments |
Net Inflows |
Realisation Ratio (%) (disbursement approvals) |
1 |
2 |
3 |
4 |
5 |
6 |
1985-86 |
1,390 |
1,470 |
462 |
1,008 |
105.8 |
1990-91 |
1,903 |
1,700 |
1,191 |
509 |
89.3 |
1991-92 |
2,127 |
2,798 * |
1,146 |
1,652 |
131.5 |
1992-93 |
2,200 |
1,001 |
1,357 |
-356 |
45.5 |
1993-94 |
2,585 |
1,859 |
1,703 |
156 |
71.9 |
1994-95 |
4,469 |
2,670 |
2,513 |
157 |
59.7 |
1995-96 |
6,286 |
4,538 |
3,311 |
1,227 |
72.2 |
1996-97 |
8,581 |
7,018 |
4,032* |
2,986 |
81.8 |
1997-98 |
8,712 |
7,400 |
3,411 |
3,989 |
84.9 |
1998-99 |
5,200 |
6,927 * |
3,153 |
3,774 |
133.2 |
1999-00 |
3,398 |
2,289 |
3,460 |
-1,171 |
67.4 |
2000-01 |
2,837 |
9,295 * |
5,043 |
4,252 |
327.6 |
2001-02 |
2,653 |
2,933 |
4,013 |
-1,080 |
110.6 |
2002-03 |
4,235 |
3,033 |
5,001 |
-1,968 |
71.6 |
2003-04 |
6,671 |
5,149 |
8,015 * |
-2,866 |
77.2 |
2004-05 |
11,490 |
9,084 |
3,658 |
5,426 |
79.1 |
2005-06 |
17,172 |
14,343 |
11,584 * |
2,759 |
83.5 |
2006-07 |
25,353 |
20,325 |
3,868 |
16,457 |
80.2 |
2007-08 |
30,953 |
28,300 |
6,119 |
22,181 |
91.4 |
* Disbursements for 1991-92, 1998-99 and 2000-01 are inclusive of special bonds. Similarly,
repayments for 1996-97, 2003-04 and 2005-06 are inclusive of redemptions of special bonds.
Source: Status Report on External Debt, Government of India and Reserve Bank of India. |
|
| |
more than a six-fold increase between March 1991 and March 2008 (Table 7). The sharper rise in commercial debt has taken place in the 2000s, the period when corporate demand for external financing rose significantly due to a sustained rise in economic activities domestically and favourable conditions in the international capital markets. As a result, the share of commercial debt in India’s external debt increased from 12 per cent in March 1990 to 28 per cent in March 2008. |
| |
| Another indicator of a broader access to finance through ECBs to the smaller companies can be gauged based on the concentration of the loans disbursed in different size buckets. An interesting |
| |
Table 7: Trends in ECB Loans Outstanding |
(US $ billion) |
End of March |
External Commercial Borrowings |
Total External Debt |
Share of ECBs in Total Debt (%) |
1 |
2 |
3 |
4 |
1990 |
9.3 |
75.9 |
12.3 |
1991 |
10.2 |
83.8 |
12.2 |
1992 |
11.7 |
85.3 |
13.7 |
1993 |
11.6 |
90.0 |
12.9 |
1994 |
12.4 |
92.7 |
13.3 |
1995 |
13.0 |
99.0 |
13.1 |
1996 |
13.9 |
93.7 |
14.8 |
1997 |
14.3 |
93.5 |
15.3 |
1998 |
17.0 |
93.5 |
18.2 |
1999 |
21.0 |
96.9 |
21.7 |
2000 |
19.9 |
98.3 |
20.3 |
2001 |
24.4 |
101.3 |
24.1 |
2002 |
23.3 |
98.8 |
23.6 |
2003 |
22.5 |
105.0 |
21.4 |
2004 |
22.0 |
111.6 |
19.7 |
2005 |
26.4 |
133.0 |
19.9 |
2006 |
26.4 |
138.1 |
19.1 |
2007 |
41.7 |
169.6 |
24.6 |
2008 |
62.0 |
221.2 |
28.0 |
Source: Status Report on External Debt, Government of India and Reserve Bank of India. |
|
| |
| finding that emerges is that about 75 per cent of the total number of loans are concentrated in the category of small size loans, i.e., up to US $ 20 million (Table 8 and Chart 3). Further, if the loan size up to US $ 50 million is considered, about 86 per cent of the total number of loans are concentrated under this category. Thus, it can be concluded that external borrowings are characterised by a large number of companies accessing the international markets for smaller size loans. |
| |
| It may also be pertinent to analyse the pattern of distribution of external commercial loans under various loan size categories. In terms of the share, smaller size loans (up to US $ 20 million) witnessed a decline in its share in the aggregate amount of loan raised from 22 per cent in 2005 to 9 per cent in 2007 (Table 9). This has occurred due to an acceleration in the pace of large sized loans |
| |
Table 8: Distribution of Number of ECB Loans under Various Loan Sizes |
(No. of Loans) |
Quarter |
Up to US$ 20 million |
>US$20-50 million |
>US$ 50-100 million |
>US$ 100 million |
Total |
1 |
2 |
3 |
4 |
5 |
6 |
2005:Q1 |
141 |
10 |
3 |
5 |
159 |
2005:Q2 |
111 |
11 |
8 |
5 |
135 |
2005:Q3 |
110 |
9 |
16 |
9 |
144 |
2005:Q4 |
115 |
14 |
17 |
5 |
151 |
2006:Q1 |
122 |
13 |
14 |
22 |
171 |
2006:Q2 |
158 |
28 |
11 |
10 |
207 |
2006:Q3 |
173 |
23 |
11 |
8 |
215 |
2006:Q4 |
188 |
16 |
4 |
15 |
223 |
2007:Q1 |
205 |
30 |
12 |
29 |
276 |
2007:Q2 |
141 |
31 |
9 |
14 |
195 |
2007:Q3 |
113 |
15 |
12 |
19 |
159 |
2007:Q4 |
73 |
26 |
10 |
17 |
126 |
Source: Computed on the basis of information sourced from www.rbi.org.in |
|
| |
| (>100 million), whose share has risen from 34 to 67 per cent during the same period. This can be, inter alia, attributed to the market access by a number of Indian companies for financing overseas acquisitions and sizeable transactions relating to leasing and hire purchase of aircrafts by the domestic airline companies for capacity expansion. |
 |
Table 9: Distribution of Amount of ECBs under Various Loan Sizes |
(Percentage Share) |
Quarter |
Up to US$ 20 million |
>US$ 20-50 million |
>US$ 50-100 million |
>US$ 100 million |
Total |
1 |
2 |
3 |
4 |
5 |
6 |
2005:Q1 |
33.5 |
17.0 |
5.7 |
43.8 |
100.0 |
2005:Q2 |
18.4 |
19.0 |
27.5 |
35.1 |
100.0 |
2005:Q3 |
18.8 |
9.2 |
35.8 |
36.2 |
100.0 |
2005:Q4 |
16.2 |
21.8 |
39.9 |
22.1 |
100.0 |
2006:Q1 |
10.1 |
5.6 |
14.3 |
69.9 |
100.0 |
2006:Q2 |
18.3 |
25.2 |
16.9 |
39.5 |
100.0 |
2006:Q3 |
20.6 |
19.0 |
18.7 |
41.7 |
100.0 |
2006:Q4 |
15.5 |
9.1 |
4.9 |
70.5 |
100.0 |
2007:Q1 |
13.8 |
14.4 |
11.4 |
60.5 |
100.0 |
2007:Q2 |
9.5 |
12.5 |
9.9 |
68.1 |
100.0 |
2007:Q3 |
8.8 |
7.2 |
12.8 |
71.1 |
100.0 |
2007:Q4 |
5.4 |
14.2 |
11.2 |
69.2 |
100.0 |
Source: Computed on the basis of information sourced from www.rbi.org.in |
|
| |
Section III |
| |
Analytical Underpinnings of Corporates’ Overseas Borrowing |
| |
The borrowing behaviour of corporates can be postulated to be determined broadly by the underlying investment demand – a demand led factor and the cost of capital – a supply-side factor. Investment demand can be financed through internal resources in the form of retained profits and external sources, motivated by the choice about the capital structure. The capital structure of a firm entails the firm’s choice between debt and equity capital.3 Equity capital can be raised from the firm’s promoters or capital market. Debt in the form of loans and bonds can be raised through floatation of corporate bonds or borrowing from banks and non-bank financial intermediaries.4 Furthermore, a firm’s choice between borrowings from the overseas markets and the domestic capital market is done typically after a deliberate process of long term financial planning (World Bank, 2007). Thus, a firm’s decision to raise borrowings from international capital markets can be a complex interaction of a host of factors. One, a firm’s potential demand for domestic investment, which in turn is a function of the expectations about future growth. Two, the credit constraint a firm might be facing in the domestic market due to underdeveloped and less liquid bond markets, which, on the one hand may hamper borrowings by smaller firms and on the other may not facilitate large sized bond issuances as well as offerings of long maturity horizon. International capital markets due to their highly liquid nature and capacity to absorb long maturity bonds, help firms from underdeveloped markets to raise adequate resources, reduce dependence on the narrow local markets and diversify the sources of funds. Three, firms persistently attempt to minimize the cost of capital with the progressive opening up of the trade and investment regime. Persistence of interest rate differential above a threshold level between the domestic and the international markets for similar financial assets together with the expectations about exchange rate movements, may lead to substitution of domestic liabilities with international liabilities by firms. It is argued that companies could raise funds from international capital markets at a lower cost (Saudagaran, 1988). Four, raising loans by the domestic firms from international markets may help firms acquire credibility and reputation, which in turn, may facilitate greater access to domestic markets. It is contended that firms that participate in international markets tend to obtain better financing opportunities and leverage for longer debt maturity (Karolyi, 1998; Chaplinksy and Ramchand, 2000; Miller and Puthenpurackal, 2000; Lins, Strickland, and Zenner, 2001; Schmukler and Vesperoni, 2001; Doidge, Karolyi and Stulz, 2002). Five, a firm achieving global scale of operations and having exposure to receivables and borrowings in foreign currency may provide a natural hedge to its balance sheet. In addition, firms may take recourse to international markets to finance their global operations. Six, foreign currency borrowings may also enable firms in managing risks through more sophisticated financial instruments. |
| |
Apart from the above factors, shifts in investor sentiment and phases of global credit cycles may play an important role in determining access of domestic firms to external markets. Country credit ratings have a predominant impact on the risk perception on corporate bonds and thus, access to international capital markets and also the cost of capital. The East Asian crisis (1997) and the Russian crisis (1998) have amply demonstrated that the currency crisis may have significant adverse spillovers for the corporate sector in terms of credit spreads in the international markets and the access to credit as the general risk perception rises. The exchange rate also constitutes an important element of borrowing cost of the corporate. The corporate tends to take higher recourse to borrowings in international markets when there are strong expectations of the appreciation of domestic currency as the effective cost of servicing such debt goes down in future. The reverse is true when the exchange rate of the domestic currency is expected to appreciate significantly. In a situation of fixed exchange rate, the exchange rate does not pose any risk to the corporate balance sheet and hence the cost of hedging of foreign exchange risk is zero for the corporate. To further extend the argument, if the exchange rate is managed narrowly within a band, it may provide more certainty about the exchange rate movement to the borrowers and hence, dispense with the need to incur additional cost of hedging foreign currency exposures. Besides the above factors, it is argued that certain institutional and economic obstacles may hamper firms from less developed markets to access international capital markets. These mainly include information barriers on firms from less developed markets, relatively low quality of corporate governance, volatile corporate earning cycles and higher country risk premium. |
| |
| A key issue in the context of a firm’s choice about accessing international markets over the domestic market is as to what extent the decision on raising funds are driven by the underlying production activities. However, in the Indian case, the relationship between ECBs and industrial activities is not a direct one. As the ECBs are largely used to finance import of capital goods (machinery, equipments, etc.), this is the conduit through which ECB demand is transmitted from the real activity. An analysis of the relationship between ECB |
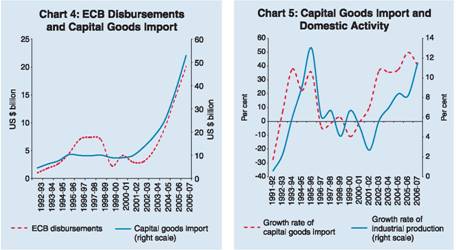 |
| disbursements and the import of capital goods shows that there is a close positive relationship between these two variables (Chart 4). This is also corroborated by a high degree of correlation (0.90) between these two variables during the period 1992-93 to 2006-07. The import of capital goods, in turn, is dependent on the momentum in industrial activity. It is evident from Chart 5 that capital goods import growth closely tracks the movements in industrial production growth. The rising trend in capital goods import financed through ECBs anchors on industrial production. The coefficient of correlation between IIP growth and capital goods import is observed to be relatively high (0.56). |
| |
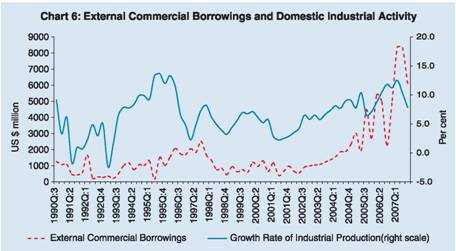
| In the Indian case, an analysis of movement in ECB mobilisation and the growth in industrial production, prima facie, establishes the conjecture that external borrowings are greatly influenced by the pace of domestic activities (Chart 6). The coefficient of correlation between IIP growth and ECB mobilisation is observed to be relatively high (0.71). |
| |
Interest Rate Arbitrage |
| |
| At the heart of a firm’s decision to access alternative modes of finance is the issue of interest rate arbitrage. In the Indian context, |
 |
| as is the case with many other emerging markets, a dormant domestic debt market and the rigidity built in the interest rate structure may be indirectly contributing to the corporates’ recourse to international capital markets. Thus, in the Indian case, a key issue is whether interest rate differentials between domestic and international markets play an important role in influencing the corporate decision to raise borrowings from international markets. An important issue that arises in the context of interest rate arbitrage is the inflation wedge of the domestic economy with the rest of the world (Chart 7). |
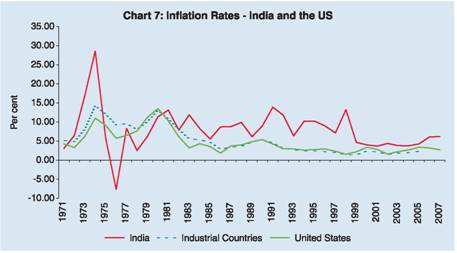 |
A higher inflation wedge would, in principle, translate into higher nominal interest rates, create the opportunities for cross border interest rate arbitrage and hence encourage domestic firms to tap international capital markets. Consistent with the theory, movement in exchange rate would neutralise this as real interest rate differentials (interest rates adjusted for inflation differentials) are reflected in the movement of the exchange rate. However, in many emerging markets, despite the existence of significant inflation differentials, there is persistent pressure for exchange rate appreciation due to strong expectations of economic growth. Thus, persistence of a higher interest rate along with a higher output growth rate creates a lower risk perception and greater arbitrage opportunities.
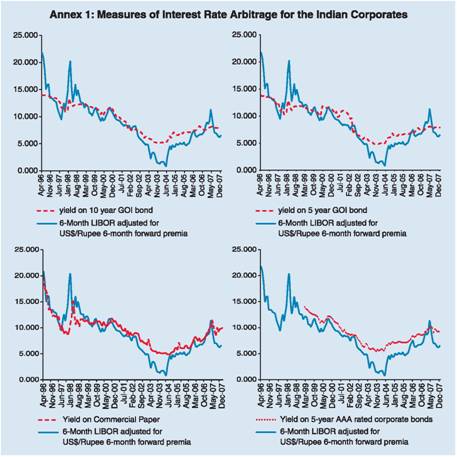
In the Indian context, a number of measures of interest rate arbitrage can be constructed (Annex 1). First, a nominal interest rate spread on 10-year Government of India bonds over the 6-month LIBOR (adjusted for exchange rate in terms of 6-month forward premia) provides evidence of the existence of an arbitrage since 2002. Second, the spread of 5 year Government of India (GOI) bonds over the 6-month LIBOR also reveals the same trend. Third, spread of commercial banks’ prime lending rate (PLR) over the 6-month LIBOR also shows persistence of significant interest rate arbitrage opportunities (Chart 8). Fourth, spread of 5-year AAA rated corporate bonds over the 6-month LIBOR reiterates the presence of significant arbitrage opportunities. |
 |
| |
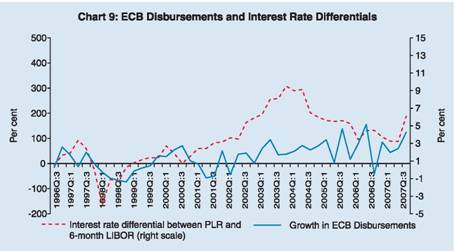
Having established the evidence of significant interest rate differentials and hence the opportunities for the corporates to minimise their cost of capital by diversifying their liabilities, it would be pertinent to examine the relationship between the interest rate differentials and the pace of corporates’ recourse to overseas borrowings. There, prima facie, seems to be evidence of persistence of significant interest rate differential, which enables corporates to choose between domestic and overseas borrowings and also determines the pace of corporate borrowings in overseas markets (Chart 9)5 . The coefficient of correlation between ECB disbursements and interest rate differentials between domestic and external markets is observed to be high (0.75).
This paper, with the above mentioned analytical underpinnings, attempts to develop a framework to explore the key drivers of Indian corporates’ borrowing behaviour in the international markets in a relatively liberalised capital account regime. |
 |
| |
Section IV |
| |
The Empirical Framework |
| |
A firm’s recourse to the international capital markets can be explained through various financial and real variables (Chart 10). From the demand side, real activity plays a crucial role. In a relatively open economy, the higher credit demand generated by the real activity can be financed by a combination of domestic and foreign resources. Among the financial variables, key drivers are interest rate differential, exchange rate and the hedging cost. In the standard economic theory, the demand for funds is inversely related to interest rates i.e., the cost of capital, other things remaining the same. Interest rates differential between home and abroad would be a complex interaction of a host of domestic and international factors. Exchange rate movements can significantly affect the effective cost of borrowings from the international markets. Illustratively, expectations of an appreciation of domestic currency over the medium term may reduce the effective cost of debt servicing and hence provide greater incentives for borrowings from external markets. Hedging costs and the availability of hedging instruments can also impact the borrowings by domestic firms from international markets. Higher hedging costs may narrow down the arbitrage available to domestic borrowers from international markets. Similarly, well developed hedging tools may minimize the risk to the borrower and enhance the incentives to borrow from overseas markets. We broadly follow the above |
 |
framework in the Indian context in order to examine the demand for external borrowings by the corporates.
Drawing from the above circular interaction of various factors in influencing the borrowing behaviour of corporates, the demand for overseas bottowing of the corporates is explained through an error correction and cointegration model. The error correction model subject to a long term tragectory of demand for ECBs can be specified as : |
| |
 |
| |
where yt = corporate demand for overseas borrowings, xt = [rd,
Lt and Qt], vector of veriables i.e., rd is the interest rate differential between the domestic and the international interest rates, L is the liquidity constraint faced by the firms in the domestic market, Q is the index of industrial production signifying the underlying domestic investment demand by the corporate sector. q and p are vectors of the short run coefficients and adjustment to equilibrium or long run path, respectively. v is the white note and ∆the first difference operator. The quarterly data for the period 1993:Q1 to 2007:Q4 were used to estimate the postulated model. The data were obtained from the RBI data base. The model was estimated using E-Views statistical package.
The optimal lag order of the model is determined by the Schwarz criteria (SBC); suggesting 2 quarter lag - typical of a financial time series where lag responses are quicker.6 All the variables were found to be difference stationary, i.e., I(1), suggesting a cointegrating relationship. The results of Johansen’s cointegration rank tests pertaining to Trace and Maximum Eigen value statistics are summarized in Table 10. Both the Trace and the Eigen value tests suggest that there is a single cointegrating vector or a long-run relationship among the four variables in the model. Furthermore, the LM test suggests that there is no serial correlation of the first order among the error terms.7 Chi-Square statistic suggests absence of heteroscedasticity.8
Since the objective of the study is to analyse the behaviour of ECBs depending upon other variables, the long-run cointegrating |
| |
Table 10: Johansen’s Cointegration Test |
Cointegration Rank Test (Trace) |
Hypothesized No. of CE(s) |
Eigen value |
Trace Statistic |
0.05 Critical Value |
Prob.** |
1 |
2 |
3 |
4 |
5 |
None * |
0.570054 |
62.71261 |
47.85613 |
0.0011 |
At most 1 |
0.164161 |
15.44327 |
29.79707 |
0.7507 |
At most 2 |
0.088876 |
5.401386 |
15.49471 |
0.7648 |
At most 3 |
0.003371 |
0.189100 |
3.841466 |
0.6637 |
Unrestricted Cointegration Rank Test (Maximum Eigen value) |
None * |
0.570054 |
47.26933 |
27.58434 |
0.0001 |
At most 1 |
0.164161 |
10.04188 |
21.13162 |
0.7407 |
At most 2 |
0.088876 |
5.212287 |
14.26460 |
0.7149 |
At most 3 |
0.003371 |
0.189100 |
3.841466 |
0.6637 |
** : Significant at 1% level. |
|
| |
vector normalised to the ECB variable (i.e., ECB as the dependent variable) is shown in Table 11. It is evident that real activity, spread and liquidity have a statistically significant long-run effect on the ECB variable. The real activity and spread have a positive association while liquidity has an inverse relation with the ECB.
Given the above long-run cointegration relation, the short-run response of the variables to the error correction term, i.e. deviation |
Table 11: Long-run Cointegration Path of ECBs: ECM Model |
Variables |
Coefficients |
1 |
2 |
Log Bt-1 (Normalised) |
1.000 |
rd t-1 |
0.155 |
| |
[9.97] |
Log Q t-1 |
21.589 |
| |
[14.46] |
Log L t-1 |
- 8.536 |
| |
[ -13.47] |
Intercept |
16.347 |
Note: t-statistics in [ ].
Log B = logarithm of gross loans of ECBs raised by Indian companies, rd = interest rate differential between the bank lending rate and the 6-month LIBOR adjusted for 6-month forward premia,
Log Q = log of index of industrial production, Log L = log of broad money supply. |
|
| of ECB from the long run trajectory or excess borrowing, is presented in Table 12. The coefficient of the error correction term in the error correction equation of LogBt suggests that there is a rapid and complete adjustment to deviation from the long run path of ECBs in about 3 quarters. In a theoretical world, any arbitrage should be eliminated by the movement of capital from abroad to the domestic economy. However, the response of the interest rate (rdt) to higher external borrowings suggests that the interest rate differentials persist despite higher inflows through external borrowings which could be typically attributed to monetary tightening by the central bank to contain the liquidity effects of rising capital flows. Real activity (Log Qt) also responds positively to higher external borrowings as greater credit expansion boosts real activity. The subdued response of broad money (Log Lt) to higher external borrowings broadly reflects the monetary management by the central bank in response to higher capital flows. |
| |
Variance Decomposition Analysis |
| |
| The variance decomposition analysis arising from the ECM provides an important insight of relative contribution of the various factors in explaining the behaviour of ECBs. Over a 10 quarter horizon (2 ½ years)9, interest rate differentials, real activity and money supply together explain three-fourths of the variation in external borrowings (Table 13). Real activity alone explains about 38 per cent of the variation in external |
| |
Table 12: Error Correction - Short-run Dynamics |
Variables |
Coefficient of EC term |
1 |
2 |
∆(LogB) |
-0.318 |
| |
(-1.60) |
∆(rd) |
2.293 |
| |
(2.59) |
∆(LogQ) |
0.045 |
| |
(2.73) |
∆(LogL) |
0.011 |
| |
(1.66) |
2 |
0.59 |
Note: Figures in brackets are ‘t’ statistics. |
|
| |
Table 13: Variance Decomposition of ECBs |
Period |
S.E. |
LogB |
rd |
LogQ |
LogL |
1 |
0.41 |
49.63 |
7.76 |
39.70 |
2.91 |
2 |
0.45 |
43.63 |
8.32 |
41.91 |
6.14 |
3 |
0.54 |
38.09 |
10.73 |
40.76 |
10.42 |
4 |
0.60 |
33.85 |
14.00 |
39.34 |
12.81 |
5 |
0.66 |
30.89 |
16.12 |
37.97 |
15.02 |
6 |
0.72 |
28.92 |
17.83 |
37.19 |
16.06 |
7 |
0.77 |
27.67 |
18.89 |
36.28 |
17.16 |
8 |
0.81 |
26.73 |
19.81 |
35.76 |
17.69 |
9 |
0.86 |
25.93 |
20.40 |
35.42 |
18.25 |
10 |
0.90 |
25.28 |
20.90 |
35.21 |
18.62 |
|
| |
| borrowings over the 10 quarter horizon. Interest rate differentials (arbitrage) is the second most important variable explaining changes in external borrowings with its contribution rising almost three fold from the first period to the terminal period. The contribution of the broad money – representing the credit conditions – though small over the shorter horizon, gets prominent over the medium term with almost a six fold increase by the terminal period. Thus, credit constraints also assume significance for corporates in their decision for overseas borrowings. |
| |
Impulse Response |
| |
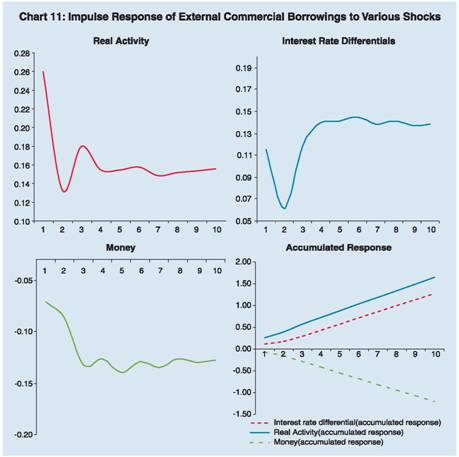
The impulse response analysis of ECBs reveals that a one standard deviation shock to real activity causes a significant variation in demand for the ECBs in the initial three quarters; however, in the subsequent quarters the impact gets stabilised (Chart 11). Further, the shocks to real activity cause persistence in the demand for ECBs, indicating more a permanent nature of such shocks. Positive shocks to interest rate differentials also lead to persistence in the demand for external borrowings. Shock to money supply causes reduction in the demand for overseas borrowings with increasing magnitude over the initial quarters, after which the impact stabilises. To illustrate it further, a high domestic liquidity growth would have a moderating impact on interest rates and also reduce the credit constraint faced by certain corporates thus, persistently reducing the demand for overseas borrowings. |
| |
 |
| |
Simulated Trajectory of ECBs |
| |
| Deriving from the estimates of the ECM presented in Table 11 for the long run behaviour, various scenarios relating to the growth path of ECBs can be numerically simulated based on alternative configurations of output and money (Table 14). These scenarios provide some important perspectives. In the scenario I, under the assumption of stable liquidity (i.e., M3 growth at 17 per cent) and high output growth (i.e., IIP growth at 11 per cent), the ECBs would grow at 24 per cent. In scenario II, high output growth (i.e., IIP growth at 11 per cent) accompanied by expansionary liquidity (i.e., M3 growth at 19 per cent), growth of ECBs would moderate to 19 per cent from 24 per cent in scenario I. In scenario III, with output growth |
| |
Table 14: Simulated path of ECBs for Various Combinations of Money and Output |
(Per cent) |
Period |
Growth rate of IIP |
Growth rate of Broad Money |
Growth rate of ECBs |
1 |
2 |
3 |
4 |
Scenario I. High Output growth and Stable Liquidity |
1 |
8.0 |
17.0 |
7.6 |
2 |
10.0 |
17.0 |
18.4 |
3 |
12.0 |
17.0 |
29.2 |
4 |
14.0 |
17.0 |
40.0 |
Scenario II. High Output growth and Liquidity Expansion |
1 |
8.0 |
17.0 |
7.6 |
2 |
9.8 |
18.0 |
15.2 |
3 |
12.0 |
20.0 |
22.8 |
4 |
14.0 |
22.0 |
29.4 |
Scenario III. Lower Output growth and Tight Liquidity Conditions |
1 |
6.0 |
12.0 |
7.5 |
2 |
7.0 |
13.0 |
10.8 |
3 |
8.0 |
14.0 |
14.0 |
4 |
9.0 |
15.0 |
17.3 |
|
| |
| slowing down to 7.5 per cent and tight liquidity conditions (i.e., M3 growth at 13.5 per cent), ECBs growth would significantly moderate to 12 per cent. |
| |
Section V |
| |
Conclusion |
| |
| The foregoing empirical analysis brings forth some important perspectives. First, ECBs are characterized by a large number of companies accessing the international markets for smaller size loans. Second, there is evidence of a balanced maturity structure and a moderation in the interest rate cycle seems to have had a favourable impact on the maturity structure. Third, the utilisation pattern of ECBs reveals that about 70 per cent of borrowings are utilized for import of capital goods, setting up new projects and modernization or expansion
of existing units. With momentum in Indian investment abroad through JVs and WOSs, the use of ECBs for financing overseas investment has also grown in significance. Fourth, an analysis of the relationship between ECB disbursements and import of capital goods shows that there is a close positive relationship between these two variables. As the capital goods import growth is closely related to the movements in industrial production growth, it suggests that the demand for ECBs is generated by the underlying pace of real activity. Fifth, the coefficient of correlation between ECB disbursements and interest rate differentials between domestic and external markets is observed to be high at 0.75, thus indicating the role of arbitrage in influencing the capital inflows. Sixth, the estimates of ECM reveal that real activity, spread and liquidity have a statistically significant long-run effect on the demand for external borrowings. The real activity and spread have a positive association while liquidity has an inverse relation with the external borrowings. The coefficient of the error correction term in the error correction equation suggests that there is a rapid and complete adjustment to deviation from the long run path of ECBs in about three quarters. Seventh, the variance decomposition analysis reveals that interest rate differentials, real activity and money supply together explain three-fourths of the variation in external borrowings. Real activity alone explains about 38 per cent of the variation in external borrowings over the 10 quarter horizon. Interest rate differentials (arbitrage) is the second most important variable explaining changes in external borrowings with its contribution rising almost three fold from the initial to the terminal period. The contribution of the broad money – representing the liquidity conditions – though small over the shorter horizon, gets prominent over the medium term with almost a six fold increase by the terminal period. Thus, credit constraint also assumes significance for corporates in their decisions about overseas borrowings. |
| |
Notes |
| |
1 The share of ECBs in capital flows has been computed by excluding the impact of the exceptional payments of Indian Development Bonds and Indian Millennium Deposits.
2 ECBs refer to commercial loans in the form of bank loans, buyers’ credit,
suppliers’ credit, securitised instruments such as floating rate notes and
fixed rate bonds, availed from non-resident lenders with minimum average
maturity of 3 years.
3 From the corporate finance perspective, it has been progressively
acknowledged that the choice of liability by a firm depends on a number
of factors such as the extent of information asymmetry and agency
problems between ultimate creditors and ultimate borrowers, growth
opportunities and the state of the infrastructure suitable for external
financing (Shleifer and Vishny, 1987; Yoshitomi and Shirai, 2001).
Illustratively, corporate bond finance can be cheaper than bank loans for
reputable, profitable or large firms (Diamond, 1991) since the bond holder
views low cost associated with information asymmetry and information
problems in respect of credible firms. In other words, well-developed
capital markets enable credible firms to access finance through bonds
and the equity mode rather than traditional bank lending. Looking through
the corporate finance perspective, the perceived benefits of debt financing
are: (i) tax exemption on interest payments on debt, and (ii) control over
ownership of the company.
4 In a situation of perfect and complete capital markets, the corporates’
decisions about the financing decisions are supposed to be optimal.
5 The interest rate differential is defined as the difference between the yield
on a 5-year corporate bond (representing interest rate in the domestic market)
and the average cost of borrowing overseas for corporates (6-month LIBOR
+ average ECB borrowing margins above LIBOR + forward premia).
6 The statistics on the significance of the lag structure for an eight quarter
window are set out below.
|
| |
Lag |
LogL |
LR |
FPE |
AIC |
SC |
HQ |
0 |
-95.74680 |
NA |
0.000687 |
4.068502 |
4.371533 |
4.184299 |
1 |
123.8726 |
387.5636 |
2.35e-07 |
-3.916571 |
-3.007476 |
-3.569179 |
2 |
166.4723 |
68.49371 |
8.42e-08 |
-4.959698 |
-3.444541* |
-4.380712 |
3 |
178.3329 |
17.20956 |
1.03e-07 |
-4.797370 |
-2.676150 |
-3.986789 |
4 |
227.1241 |
63.14154 |
3.04e-08 |
-6.083299 |
-3.356016 |
-5.041124 |
5 |
258.8316 |
36.05949 |
1.84e-08 |
-6.699279 |
-3.365933 |
-5.425509 |
6 |
273.8257 |
14.70007 |
2.29e-08 |
-6.659831 |
-2.720422 |
-5.154466 |
* Significant at 1% level. |
|
7 The LM Statistics at 23.54 for the first order lag is not found significant
at 5 per cent level.
8 The Chi-square statistics with 190 degrees of freedom was found nonsignificant with probability value of 0.76. Thus, the null hypothesis that
errors are both homoscedastic and independent of the regressors, is not
rejected
9 This is equivalent to the average duration of the cycles of industrial activity
in India as indicated by some empirical research in the Indian context
such as Mohanty, Singh and Jain (2000).
|
| |
| |
| References |
| |
Chaplinksy, S. and L. Ramchand (2000), “The Impact of Global Equity Offerings”, Journal of Finance, 55(6):2767-89.
Doidge, Craig, A. Karolyi and R. Stulz (2004), “Why are Foreign Firms Listed in the U.S. Worth More?,” Journal of Financial Economics, 71:205-238.
Karolyi, A. (1998), “Why Do Firms List Shares Abroad? A Survey of the Evidence and Its Managerial Implications”, Financial Markets, Institutions and Instruments, 7(1):1-60.
Lins, K., D. Strickland and M. Zenner (2001), “Do Non-U.S. Firms Issue Equity on U.S. Stock Exchanges to Relax Capital Constraints”, Mimeo, David Eccles School of Business, University of Utah.
Miller, D. and J. Puthenpurackal (2000), “The Costs, Wealth Effects and Determinants of International Capital Raising: Evidence from Public Yankee Bonds”, Mimeo, Indiana University and Texas A&M University.
Mohanty, J., B. Singh and R. Jain (2002), “Business Cycles and Leading indicators of Industrial Activity in India”, Reserve Bank of India Occasional Papers, 21 (2 & 3):235-69.
Diamond, D.W. (1991), “monitoring and reputation: The choice between bank loans and directly placed debt”, Journal of Political Economy, 99 (4): 689-721.
Saudagaran, S.M., (1988), “An empirical study of selected factors influencing the decisions to list in foreign stock exchanges”, Journal of International Business Studies, 1001-127. |
Schmukler, S. and E. Vesperoni (2000),‘‘Globalization and Firms’ Financing Choices: Evidence from Emerging Economies”, World Bank Policy Research Working Paper 2323.
Shleifer, A. and R. Vishny (1987), “A survey of corporate governance’, Journal of Finance, 52: 737-783.
World Bank (2007), “Globalization of Corporate Finance in Developing Countries,” Global Development Finance, World Bank, Washington, DC.
Yoshitomi, M. and S. Shirai (2001), “Designing a financial market structure in post-crisis Asia: how to develop corporate bond markets,” ADB Institute Working Paper No. 15. |
| |
 |
|